Article

Effect of Growth Ring Width and Latewood Content on Selected Physical and Mechanical Properties of Plantation Japanese Larch Wood

1
Research Institute of Wood Industy, Chinese Academy of Forestry, Beijing 100091, China
2
Research Institute of Forestry, Chinese Academy of Forestry, Beijing 100091, China
*
Author to whom correspondence should be addressed.
Submission received: 15 April 2022 / Revised: 11 May 2022 / Accepted: 16 May 2022 / Published: 19 May 2022
(This article belongs to the Special Issue Performance Testing and Service Life of Wood and Wood-Based Materials)

Abstract

:
In order to evaluate the physical and mechanical properties of plantation Japanese larch wood, various physical and mechanical indicators were measured with reference to Chinese national standards. The characteristics of the growth ring on the end face of wood samples were captured, with the mean latewood percentage being 21.4% and the mean ring width being 3.24 mm. Relationships between growth ring characteristics, latewood percentages, and the physical and mechanical properties of the plantation Japanese larch wood were investigated. The results revealed that it is most appropriate to use growth ring width to evaluate MOE and MOR, and to use latewood percentage to evaluate air-dry density, radial air-dry shrinkage, IBS and UTS. Regression analysis confirmed that air-dry density (R2 = 0.99), radial shrinkage (R2 = 0.97) and UTS (R2 = 0.96) had significant positive correlations with latewood percentage, while MOE (R2 = 0.88) and MOR (R2 = 0.90) had significant negative correlations with RW. IBS was not significantly related to either characteristic. RW can be used to define juvenile wood and mature wood, with the dividing ring width being 4.85 mm. There is a large difference in MOE and MOR between the two wood types.

1. Introduction

Japanese larch has the characteristics of disease resistance, high survival rate, short period to maturity, straight tree trunks and excellent mechanical properties, and can readily be used as building and industrial materials [1,2,3,4]. However, the evaluation of its physical and mechanical properties is a key step needed in the process of improving the machining and application of timber from this source.
The structural characteristics of wood are closely related to its mechanical properties, such as the microfibril angle (MFA) of the cellulose within the S2-layer of the wood cell, the tracheid dimensions, and the cell wall thickness [5,6,7]. Density is generally considered a good indicator and is widely believed to be closely related to material properties [8,9]. However, density can be affected by the content of extracts and inorganic salts; thus, there may be large deviations when using only density to predict the physical and mechanical properties of tree species with high resin or gum content. Growth ring width (RW) and latewood (LW) percentage are also characteristics closely related to wood properties [10,11,12].
The formation and structure of growth rings are influenced by the environment [13,14]. Earlywood (EW) is formed in the early stage of the growth cycle, when the environment is conducive to active development, the cell wall is thin, the diameter of tracheid is large, and the MFA of S2 layer is high, while LW is formed in the late summer or autumn, with small diameter, tracheid wall thickness and MFA [15,16]. There may also be differences in the radial and tangential variation of cell walls between EW cells and LW cells. Laskowska found that the radial cell wall and tangential cell wall of LW cells have similar thicknesses, while the thickness of EW cells is only similar in the tangential direction in the sapwood and heartwood zones of Platycladus orientalis [17]. Hence, due to the differences in cell structure between EW and LW, growth rings are a potentially powerful feature that can be used to assess the physical and mechanical properties of wood.
The width of a growth ring represents the radial growth of a tree during a growth cycle and can be subjected to considerable natural variation in growth conditions, including climatic conditions, nature of the terrain and silvicultural treatments [18,19].
Wood properties of different stand density but with similar trunk diameters will vary [20,21]. The width of the growth ring can be used to evaluate the physical and mechanical indicators of wood, such as the modulus of elasticity (MOE), the modulus of rupture (MOR), the ultimate tensile stress parallel to the grain (UTS), the specific gravity and the air-dry density [12,21,22,23,24,25]. Growth RW is positively correlated with MFA [26]. MFA is one of the key factors determining wood properties, and has a significant impact on the stiffness, strength and dimensional stability of wood [27,28,29,30,31,32]. However, the width of growth rings cannot reflect the effect of LW cells on wood properties. The mechanical properties of LW are generally better than those of EW [33,34,35]. Therefore, wood samples with similar RW but different LW percentage content will have different mechanical properties. Previous studies have focused on evaluating wood properties using the RW or LW percentage, and there are few reports using more complex analyses to evaluate wood physical and mechanical properties.
The purpose of this study is to explore the relationship between growth ring characteristics and wood properties of Japanese larch, and to provide numerical models that can be used to nondestructively, rapidly and reliably evaluate the properties of Japanese larch.

2. Materials and Methods

2.1. Materials

Plantation Japanese larch (species: Larix kaempferi (Lamb.) Car.; log diameter: 11~25 cm; initial moisture content: 50%; Age: between 13~25a) was harvested in January 2020 from a plantation in Shaba Town, Longnan City, Gansu Province, China (34°9′8″ N, 106°27′55″ E). The sampling spot is 1736 m above sea level, with an average soil thickness of 60 cm, gravel content less than 25%, and average annual precipitation of 635 mm. A total of 27 logs was collected. The samples were transported to the Chinese Academy of Forestry Sciences in Beijing. After sawing into 40 mm thick lumbers, they were exposed to the atmosphere until they were in an air-dry state (final moisture content: 12.9%, C.V. = 13%). Then, referring to the GB/T 1929-2009 standard [36], they were sawn and processed into small clear specimens, which were free of visible defects, knots, cracks, resin pockets. The reference standards used to determine the specimen specifications are given in Table 1 [36,37,38,39,40,41,42].

2.2. Methods

2.2.1. Determination of Physical and Mechanical Properties

The radial air-drying shrinkage ratio is used to represent the dimensional stability of wood. To estimate this, according to the GB/T 1932-2009 standard [38], the size change of samples from saturated to air-dry and hygroscopic balance, and the weight change from air-dry to absolute drying are recorded.
The radial air-drying shrinkage ratio is calculated as follows:
S = R 1 R 0 / R 0 × 100
where R1 is the radial length of a saturated sample (mm), and R0 is the radial length of the sample in an air-dry state (mm).
The air-dry density is calculated as follows:
D = W 0 W 2 / W 2
where W0 is the weight of a sample in an air-dry state (g) and W2 is the weight of the sample in a fully dry condition.
Using a universal mechanical testing machine (Model ALL-50KNB, loading speed 3 mm/min) and a pendulum impact testing machine, MOE (static four-point bending with a span of 240 mm), MOR (static three-point bending with a span of 240 mm), impact bending strength (IBS) and UTS of the larch samples were measured according to the corresponding national standards (Table 1).
MOE is calculated as follows:
M O E = 23 P l 3 108 b h 3 f
where P is load (N); l is the span between two bearings (mm); b is the width of specimen (mm); h is the height of specimen (mm); f is displacement of specimen under load (mm).
MOR is calculated as follows:
M O R = 3 P m a x l 2 b h 2
where Pmax is breaking load (N).
IBS is calculated as follows:
I B S = 1000 Q b h
where Q is the energy absorbed by the sample (J).
UTS is calculated as follows:
U T S = P m a x b t
where t is the thickness of the specimen (mm).

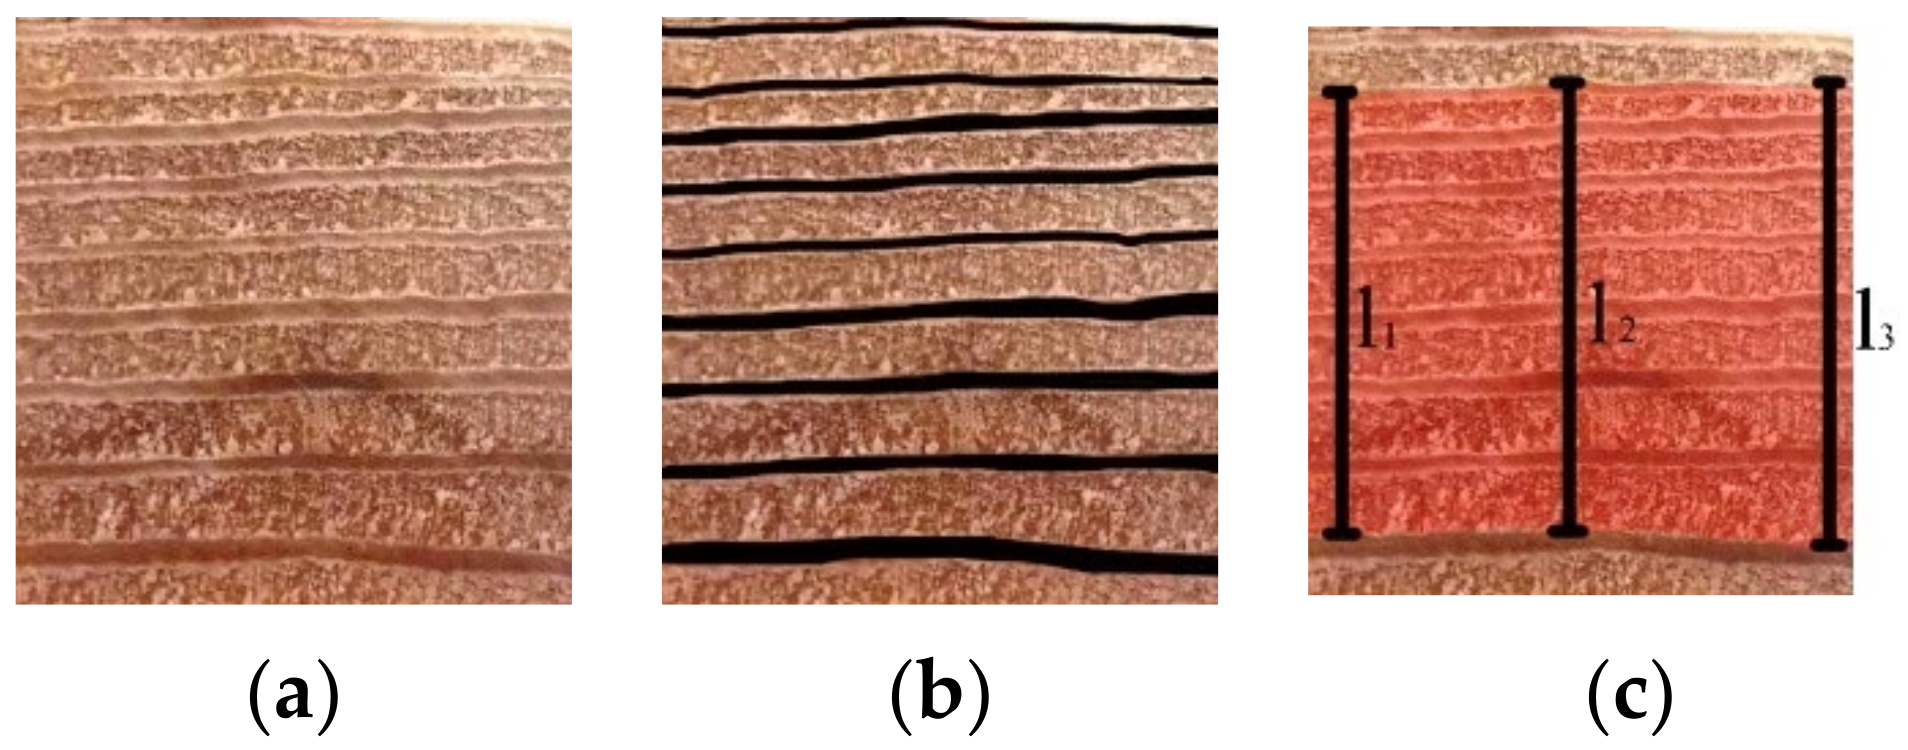
2.2.2. Determination of Latewood Rate and Growth Ring Width

Photographs of the two end faces of a processed specimen were used to record growth ring characteristics. The images were imported into the ImageJ 1.53k, and the end face area was estimated. The LW area was manually extracted and recorded. The ratio of LW area to end face area is the LW percentage. Incomplete growth rings on the end face of the specimen were excluded, and the number of complete growth rings in the radial direction were counted. The distance from the first complete growth ring EW to the LW of the last complete growth ring was measured in the radial direction. Three measurements were taken at equal intervals apart, and the average value was then used. The ratio of this distance to the number of complete rings is the average RW. The end face image processing process is summarized in Figure 1.
In order to facilitate the analysis of the relationship between growth rings and physical and mechanical properties, the samples were grouped according to their RW values and their LW percentages. The grouping criteria aimed, as much as possible, to make the number in each group approximately equal. The five resulting groups using RW were: RW <2.3 mm (R1); RW 2.3–3.3 mm (R2); RW 3.3–4.3 mm (R3); RW 4.3–5.3 mm (R4); RW >5.3mm (R5). The five resulting groups using LW percentage were: <17% (L1); 17–21% (L2); 21–25% (L3); 25–29% (L4); >29% (L5).

3. Results and Discussion

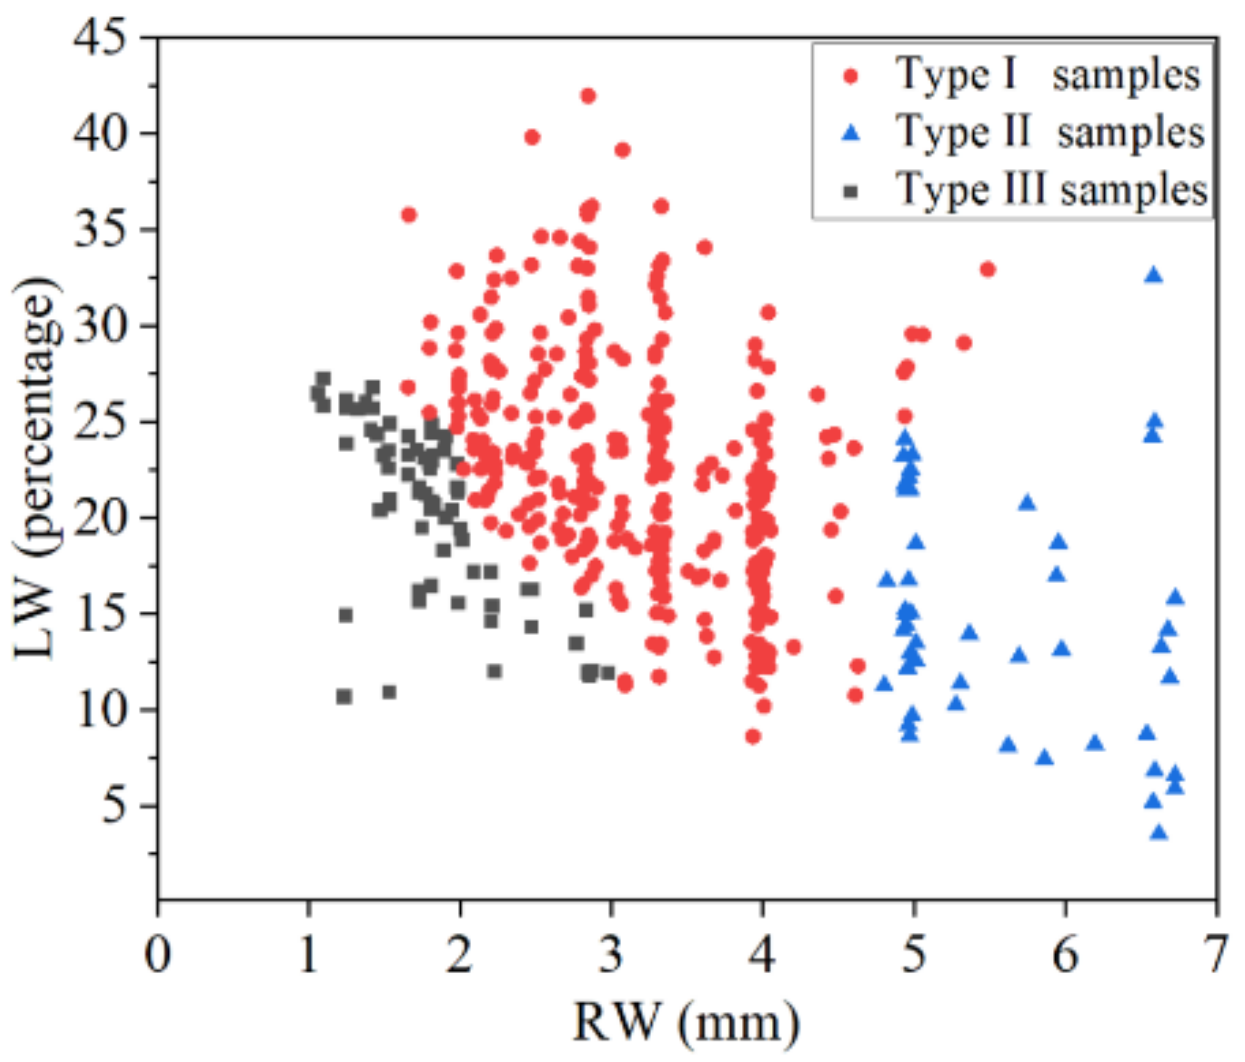
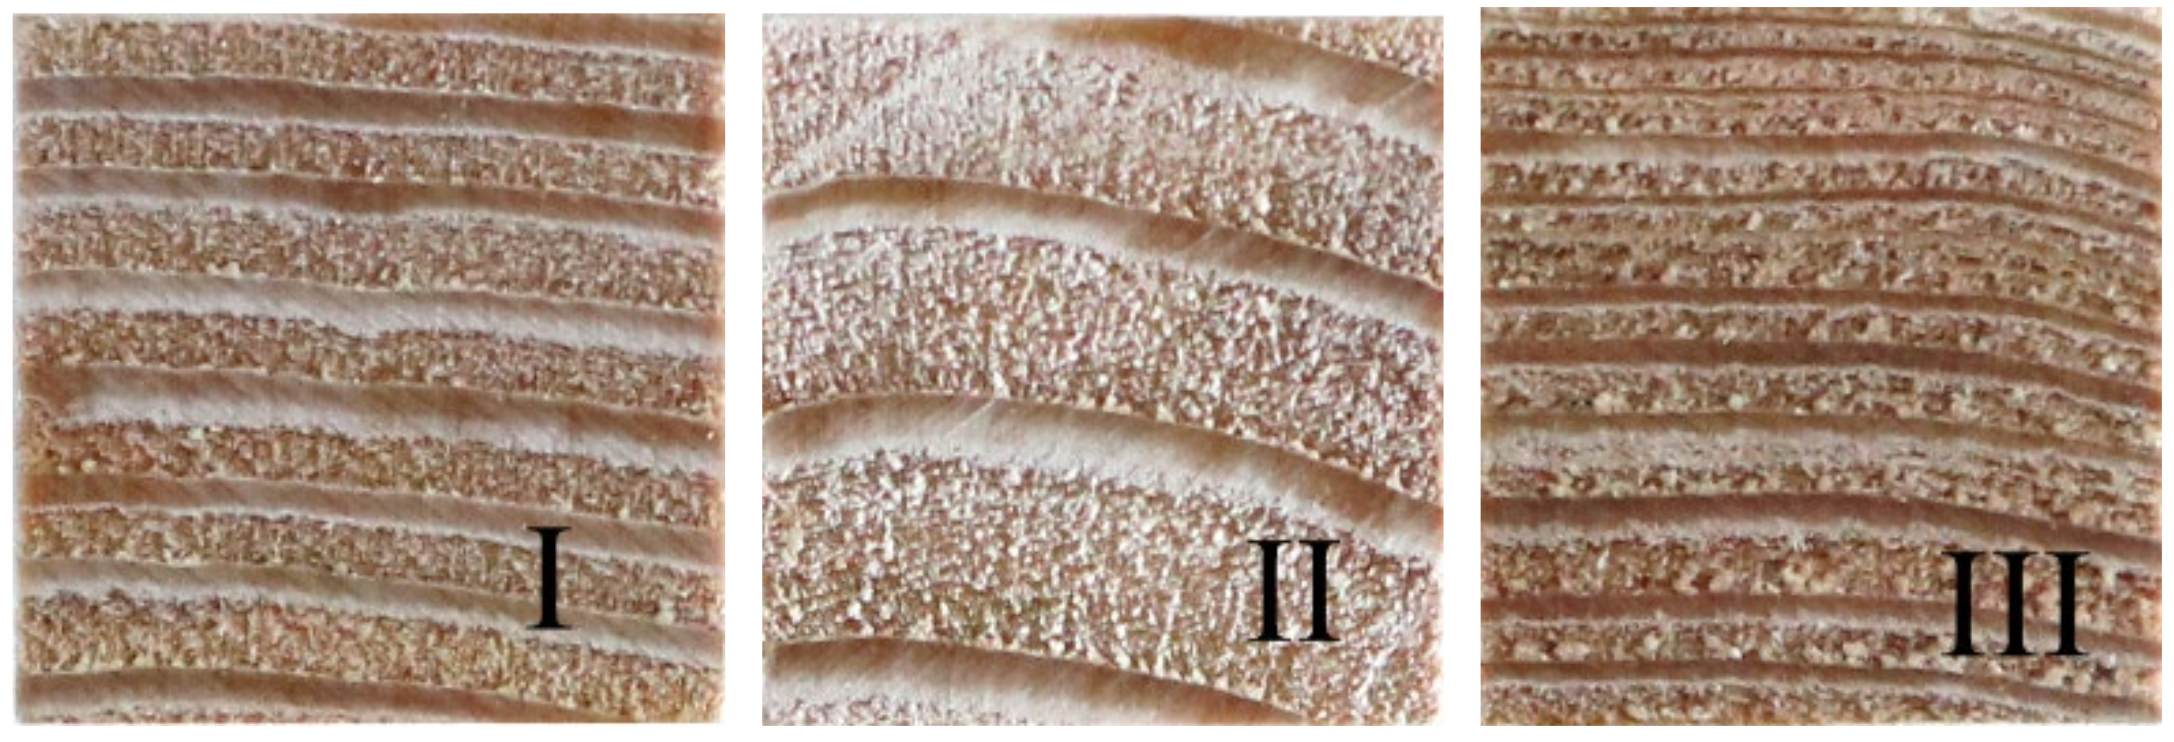
3.1. Relationship between Growth Ring Width and Latewood Percentage

Juvenile wood and mature wood that both form in suitable climates are the result of fast growth. The RW of juvenile wood is wider than that of mature wood. LW percentage decreased with RW (Figure 2), suggesting that the increase in RW was mainly because the increase in the growth of EW and the width of LW in most years was stable.
According to the relationship between the RW and the LW percentage (Figure 2), the samples can be roughly divided into three categories: Type I samples had a moderate RW and a high LW percentage, and the samples were mostly mature wood; Type II samples had a large RW and a small LW percentage, indicating that the proportion of juvenile wood in the samples was relatively high; Type III samples had small RW values and the percentage of LW was also small. Figure 3 presents typical cross-sectional images of type I, II, and III samples.

3.2. The Relationship between Growth Rings and Physical Properties

The density and shrinkage were fitted with RW and LW percentage. It can be seen from Figure 4a that the radial air-drying shrinkage rate and air-dry density have a linear relationship with the LW percentage, with R2 values of 0.99 and 0.97, respectively (Supplementary Materials Tables S1, S3, and S4), and the regression coefficients are −0.007 and 0.002, respectively. Radial air-drying shrinkage fluctuates with RW (Figure 4b), indicating that air-drying shrinkage is mainly related to the content of LW cells, and is less affected by RW. In our samples, air-dry density first decreased and then increased with the RW (Figure 4b), and the R2 using a quadratic function fitting was 0.99 (Supplementary Materials Tables S1, S2 and S4), which is higher than the R2 of fitting equation of LW percentage and density. LW lumens are smaller, and their cell walls are thicker [15]; hence, the density increases with LW percentage. Density is also affected by extractive content, lignin and other factors [43]. Generally, RW tends to decrease from the pith to the bark. From Table 2, it can be seen that the MOE and MOR decreased rapidly after an RW value of about 4.85 mm, indicating that this RW size is located in the transition area between juvenile wood and mature wood. The lignin content of juvenile wood is higher than that of mature wood, and the extract content is higher [15]; hence, the density increased when RW was greater than 4.85 mm. Since the RW can distinguish juvenile wood from mature wood, the use of RW can better reflect the influence of extract on density when evaluating density.

3.3. The Relationship between Growth Rings and Mechanical Properties

Table 2 presents the mechanical properties of Japanese larch for the five classes of RW and for the five classes of LW percentage (Supplementary Materials Tables S5–S8). The data were analyzed with ANOVA, and the results showed that MOE, MOR and UTS had significant relationships with RW and LW percentage, while IBS had no significant relationship with growth ring parameters (Supplementary Materials Table S9). MOE showed a strong relationship to RW and decreased with increasing RW. The MOE of samples from the R1, R2, R3 and R4 classes (mean 11.98 MPa) was significantly differently from that of samples in the R5 class (8.83 MPa). The R5 class (i.e., RW greater than 5.3 mm) specimens were mostly juvenile wood, which led to a significant decrease in MOE [44].
The modulus of the L1 class was significantly smaller than that of the other classes, and the difference between the other classes was small, which is mainly due to the fact that the L1 class contains juvenile wood with wide rings and low LW percentages and that type III specimens have fine growth rings and low LW percentage. The MFA is negatively correlated with mechanical strength, and the MFA of juvenile wood near pith is usually higher than mature wood [45,46].Therefore, type III samples and juvenile wood have significant MOE differences but cannot be distinguished according to their LW percentage; hence, it is better to evaluate MOE using RW.
The MOR of the R5 class (65.11 MPa) was significantly lower than that of the other four groups (average value is 86.39 MPa), indicating that the MOR of juvenile wood is significantly lower than that of mature wood. The MOR of the R5 class was also significantly lower than that of the L1 class, indicating that the L1 class contains type III samples (small LW percentage, small RW), which makes the MOR values of the L1 and the R5 classes differ considerably. The difference can be confirmed by two other aspects: (1) The coefficient of variation of the L1 class was greater than that of the R5 class, which indicates that juvenile wood and type III samples in L1 have low content of LW but the MOR of them are quite different. (2) The MOR of the R1 class was significantly higher than that of the R2, R3, and R4 classes, indicating that MOR is significantly increased when the RW is smaller than a certain threshold, which is similar to the RW of type III specimens. Therefore, when the MOR is grouped according to the RW, the samples can be divided into three sub-groups, i.e., juvenile wood samples, type III samples, and other groups of samples. These three sub-groups have average MOR values of 65.11, 93.85 and 84.01 MPa, respectively. In summary, and as was found for MOE, LW percentage cannot be used to distinguish juvenile wood samples from type III samples that exhibit large differences in MOR; hence, it is more appropriate to evaluate MOR using RW.
It can be seen from Table 2 that IBS fluctuated with RW. It is not as obvious, but IBS was also positively correlated with LW percentage. However, the IBS of the L5 class does not fit this trend, as it was lower than that of the L4 class, and it is speculated that there may be deviations in the value due to the small number of test samples used in the analysis. Compared with RW, LW percentage is more suitable for evaluating IBS, but due to the large variability of IBS in wood, this conclusion needs to be further verified.
UTS values fluctuated with RW with poor regularity (Table 2), while LW percentage showed a strong linear relationship with UTS, indicating that tensile strength along the grain is less affected by the growth rate of the wood and is affected more by the LW in the material. Michaela’s micro-tensile test results on single tracheids also showed that there is a significant difference in tensile stiffness between early and late wood cells [47]. The difference in UTS in early and late wood cells can be attributed to the difference in density and MFA between them [32]. Hence, it is better to use the LW percentage to evaluate UTS.
The MOE, MOR, IBS and UTS were linearly fitted with RW and LW percentage, respectively, and the results are presented in Table 3.
RW was negatively correlated with all three mechanical properties, while LW percentage was positively correlated with all three. Although the overall LW percentage was negatively correlated with RW, it can be affected by tree species, the environment, stress and other factors. As well as the radial and axial wood property variation of trees, the relationship between RW and LW percentage is not absolute [11]. Hence, for some mechanical properties, analyzing from the perspective of RW and LW percentage may produce contradictory results. In order to avoid this contradiction and obtain the most accurate evaluation results, it is necessary to know which LW percentage and RW has a greater impact on each mechanical indicator, and whether the correlation is sufficient such that it can be used in an evaluation.
From the R2 of each fitting model obtained here (Table 3), it can be seen that the correlation of MOE, MOR with RW was relatively high, while the R2 value of the UTS fitting to the LW percentage was high. This is consistent with the results discussed above. However, from the absolute value of R2, the fitting degree of UTS is the best, and the fitting degree of the flexural performance is good. The fitting degree of the IBS is extremely poor (Supplementary Materials, Table S10). This indicates that growth ring parameters are reasonable to evaluate MOE, MOR and UTS but cannot be used to evaluate IBS.
The bending properties of wood are often affected by many factors. Alteyrac performed measurements on growth ring samples of Scots Pine. Bending properties of early wood and latewood were investigated with respect to their MFA, density and RW. A correlation of −0.47 was found between RW and MOE, while −0.42 was found between RW and MOR. This is consistent with the results shown in Table 3. The study found that, compared with the RW, the MFA and the growth ring density had a greater impact on the MOR, and MFA had a greater impact on MOE [10]. Majid also found that there were strong relationships between density and MOR but MOE showed weak correlations [48]. Ekiza measured the physical and mechanical properties of Scots Pine from diverse genetic origins and showed that the origin of the wood had a significant influence on wood density, MOR and MOE [49]. Therefore, RW can be used to assess the mechanical properties of larch without damage, but further evaluation of wood properties requires a combined analysis of all relevant indicators.
IBS is one of the most important properties for dynamic loading. The fitting equation showed that IBS was positively correlated with RW, and LW was negatively correlated, but due to the low value of R2, it was not recommended to use the fitting equation to evaluate IBS (Supplementary Materials, Table S10). The IBS of wood is affected by many factors, including tree species, sample thickness, density and moisture content [50,51]. Almeida assessed the apparent density and IBS of thirty-six Brazilian tropical woods species by using linear, quadratic, and cubic polynomial regression models. The cubic polynomial model was found to be the most efficient tool to estimate wood IBS, with R² = 77.77% [52]. Pazos studied the IBS of test wood, with a density of 0.62 g/cm3, in air-dry and green states and found that the IBS of the air-dry state was about 11.98% higher than that of the green state [51]. Therefore, it may be necessary to introduce moisture content and density to further evaluate IBS of Japanese larch.

4. Conclusions

In this study, MOR, MOE, IBS, UTS, air-dry density and dry shrinkage rate of Japanese larch were measured in accordance with Chinese national standards. The relationships between the characteristics of rings and the physical and mechanical properties of Japanese larch were explored. In summary:
(1)
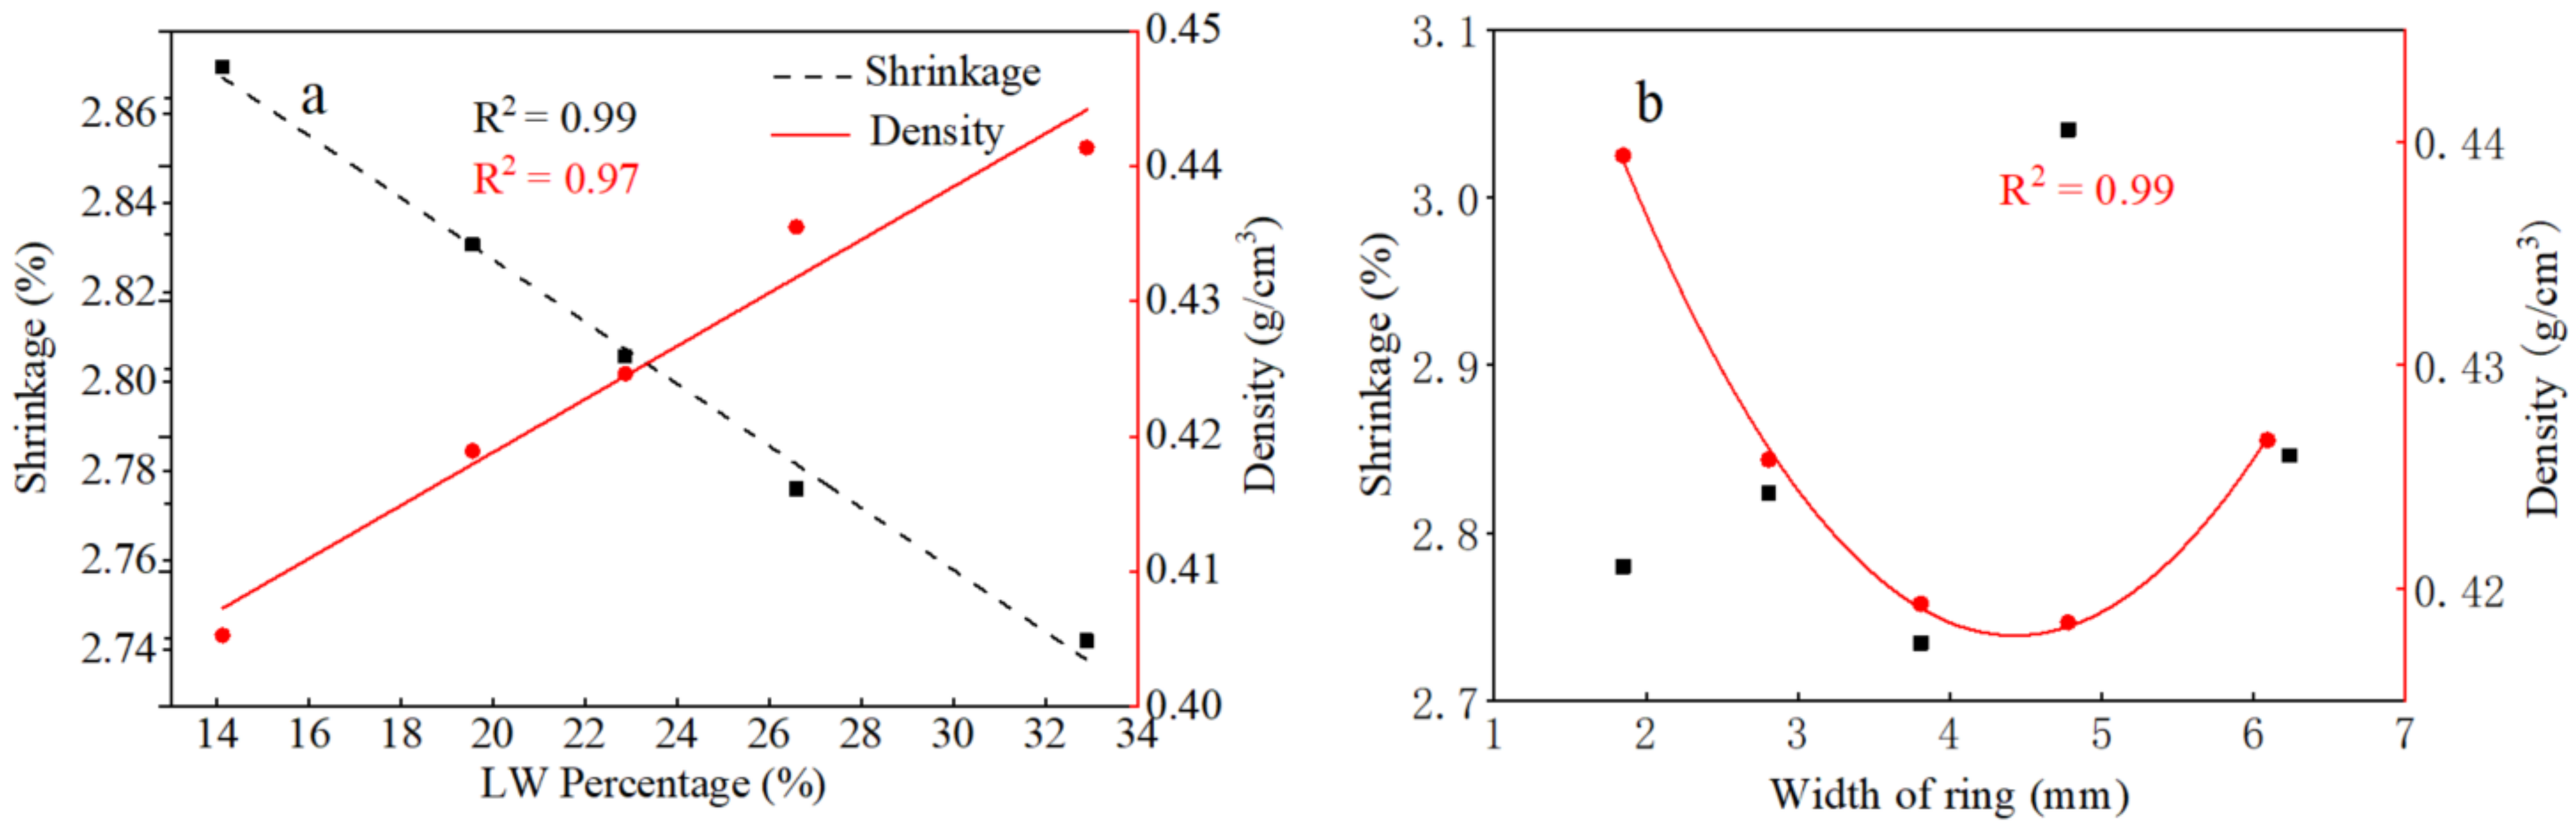
The LW percentage can be used to evaluate the air-drying shrinkage rate. The radial air-drying shrinkage rate (R2 = 0.99) has a linear relationship with LW percentage. The RW has more advantages in density evaluation than LW percentage. Air-dry density first decreases and then increases with RW, and the R2 of a quadratic fitting function was found to be 0.99.
(2)
RW is more suitable for evaluating MOR and MOE than LW percentage. However, LW percentage is more suitable for evaluating UTS. The resulting fitting models can be used for accurate evaluations of Japanese larch wood properties. The RW and LW percentage of wood do not directly affect its impact resistance.
(3)
The demarcation ring width between juvenile wood and mature wood would be about 4.85 mm, and the MOE and MOR of them are quite different.

Supplementary Materials

The following supporting information can be downloaded at: https://0-www-mdpi-com.brum.beds.ac.uk/article/10.3390/f13050797/s1, Table S1. Physical properties of plantation Japanese larch for ring width and latewood percentage; Table S2. Physical properties of plantation Japanese larch for ring width; Table S3. Physical properties of plantation Japanese larch for latewood percentage; Table S4. The results of fits of physical properties of plantation Japanese larch to ring width (w) and latewood percentage (l); Table S5. The modulus of elasticity of plantation Japanese larch for ring width and latewood percentage; Table S6. The modulus of rupture of plantation Japanese larch for ring width and latewood percentage; Table S7. The ultimate tensile stress of plantation Japanese larch for ring width and latewood percentage; Table S8. The impact bending strength of plantation Japanese larch for ring width and latewood percentage; Table S9. Anova table of growth ring parameter and physical and mechanical properties; Table S10. The results of linear fits of impact bending strength of plantation Japanese larch to ring width (w) and latewood percentage (l).

Author Contributions

Conceptualization, J.J., S.W. and D.C.; methodology, J.J.; formal analysis, S.W. and J.C.; investigation, J.J. and S.W.; data curation, J.J. and D.C.; writing—original draft preparation, S.W.; writing—review and editing, J.J.; visualization, S.W. and J.C.; supervision, J.J. and D.C.; funding acquisition, D.C. All authors have read and agreed to the published version of the manuscript.

Funding

This work was funded by the National Natural Science Foundation of China (31971652).

Acknowledgments

Our great appreciation goes to the laboratory of Research Institute of Wood Industry at the Chinese Academy of Forestry for providing testing materials and machines, and technical staff in assisting in this experiment.

Conflicts of Interest

The authors declare no conflict of interest.

References

  1. Matsushita, M.; Nishikawa, H.; Tamura, A. Effects of Girdling Intensity, Pruning Season and Thinning on Tree Growth, Crown Vigor and Wound Recovery in Japanese Larch. Forests 2022, 13, 449. [Google Scholar] [CrossRef]
  2. Pâques, L.E. Roles of European and Japanese larch in the genetic control of growth, architecture and wood quality traits in interspecific hybrids (Larix × eurolepis Henry). Ann. For. Sci. 2004, 61, 25–33. [Google Scholar] [CrossRef] [Green Version]
  3. Sun, X.M.; Chu, X.L.; Zhang, S.G.; Liu, J.L. Timber Evaluation on Physical and Mechanical Properties of Species and Hybrids of Larix. Sci. Silvae Sin. 2012, 48, 153–159. [Google Scholar]
  4. Kurinobu, S. Forest tree breeding for Japanese larch. Eurasian J. For. Res. 2005, 8, 127–134. [Google Scholar]
  5. Cave, I.D.; Walker, J.C.F. Stiffness of wood in fast-grown plantation softwoods: The influence of microfibril angle. For. Prod. J. 1994, 44, 43–48. [Google Scholar]
  6. Meylan, B.A. The influence of microfibril angle on the longitudinal shrinkage-moisture content relationship. Wood Sci. Technol. 1972, 6, 293–301. [Google Scholar] [CrossRef]
  7. Anoop, E.V.; Jijeesh, C.M.; Sindhumathi, C.R.; Jayasree, C.E. Wood physical, anatomical and mechanical properties of big leaf mahogany (Swietenia macrophylla Roxb) a potential exotic for South India. Res. J. Agric. For. Sci. 2014, 2, 7–13. [Google Scholar]
  8. Niklas, K.J.; Spatz, H.C. Worldwide correlations of mechanical properties and green wood density. Am. J. Bot. 2010, 97, 1587–1594. [Google Scholar] [CrossRef]
  9. Almeida, D.H.; Mello, S.R.; Christoforo, A.L.; Varanda, L.D.; Lahr, F.A.R.; Dias, A.A.; Junior, C.C. Tenacidade Da Madeira como função da densidade aparente. Rev. Árvore 2014, 38, 203–207. [Google Scholar] [CrossRef] [Green Version]
  10. Alteyrac, J.; Cloutier, A.; Ung, C.H.; Zhang, S.Y. Mechanical properties in relation to selected wood characteristics of black spruce. Wood Fiber Sci. 2006, 38, 229–237. [Google Scholar]
  11. Kiaei, M.; Khademi-Eslam, H.; Hooman, H.A.; Samariha, A. Ring width, physical and mechanical properties of eldar pine (case study on marzanabad site). Cellul. Chem. Technol. 2012, 16, 125–135. [Google Scholar]
  12. Zhang, S.Y. Effect of growth rate on wood specific gravity and selected mechanical properties in individual species from distinct wood categories. Wood Sci. Technol. 1995, 29, 451–465. [Google Scholar] [CrossRef]
  13. Touchan, R.; Shishov, V.V.; Meko, D.M.; Nouiri, I.; Grachev, A. Process based model sheds light on climate sensitivity of Mediterranean tree-ring width. Biogeosciences 2012, 9, 965–972. [Google Scholar] [CrossRef] [Green Version]
  14. Popkova, M.I.; Shishov, V.V.; Vaganov, E.A.; Fonti, M.V.; Kirdyanov, A.V.; Babushkina, E.A.; Huang, J.G.; Rossi, S. Contribution of Xylem Anatomy to Tree-Ring Width of Two Larch Species in Permafrost and Non-Permafrost Zones of Siberia. Forests 2020, 11, 1343. [Google Scholar] [CrossRef]
  15. Bertaud, F.; Holmbom, B. Chemical composition of earlywood and latewood in Norway spruce heartwood, sapwood and transition zone wood. Wood Sci. Technol. 2004, 38, 245–256. [Google Scholar] [CrossRef]
  16. Plomion, C.; Leprovost, G.; Stokes, A. Wood formation in trees. Plant Physiol. 2001, 127, 1513–1523. [Google Scholar] [CrossRef]
  17. Laskowska, A.; Majewska, K.; Kozakiewicz, P.; Mamiński, M.; Bryk, G. Case Study of Anatomy, Physical and Mechanical Properties of the Sapwood and Heartwood of Random Tree Platycladus orientalis (L.) Franco from South-Eastern Poland. Forests 2021, 12, 925. [Google Scholar] [CrossRef]
  18. Bhat, K.M.; Priya, P.B. Influence of provenance variation on wood properties of teak from the Western Ghat region in India. IAWA J. 2004, 25, 273–282. [Google Scholar] [CrossRef] [Green Version]
  19. Wiemann, M.C.; Wheeler, E.A.; Manchester, S.R.; Portier, K.M. Dicotyledonous wood anatomical characters as predictors of climate. Palaeogeogr. Palaeoclimatol. Palaeoecol. 1998, 139, 83–100. [Google Scholar] [CrossRef]
  20. Grigaliûnas, J. The method of forest stand classification by growth types. Balt. For. 1997, 3, 10–13. [Google Scholar]
  21. Alteyrac, J.; Zhang, S.Y.; Cloutier, A.; Ruel, J.C. Influence of stand density on ring width and wood density at different sampling heights in black spruce (Picea mariana (Mill.) BSP). Wood Fiber Sci. 2005, 37, 83–94. [Google Scholar]
  22. Lasserre, J.P.; Mason, E.G.; Watt, M.S.; Moore, J.R. Influence of initial planting spacing and genotype on microfibril angle, wood density, fibre properties and modulus of elasticity in Pinus radiata D. Don corewood. For. Ecol. Manag. 2009, 258, 1924–1931. [Google Scholar] [CrossRef]
  23. Schneider, R.; Zhang, S.Y.; Swift, D.E.; Begin, J.; Lussier, J.M. Predicting selected wood properties of jack pine following commercial thinning. Can. J. For. Res. 2008, 38, 2030–2043. [Google Scholar] [CrossRef]
  24. Aleinikovas, M. Effect of the mean diameter increment on the pine wood mechanical-physical properties in Lithuania. Balt. For. 2007, 13, 103–107. [Google Scholar]
  25. Jordan, L.; Daniels, R.F.; Clark III, A.; He, R. Multilevel nonlinear mixed-effects models for the modeling of earlywood and latewood microfibril angle. For. Sci. 2005, 51, 357–371. [Google Scholar]
  26. Auty, D.; Gardiner, B.A.; Achim, A.; Moore, J.R.; Cameron, A.D. Models for predicting microfibril angle variation in Scots pine. Ann. For. Sci. 2013, 70, 209–218. [Google Scholar] [CrossRef] [Green Version]
  27. Cave, I.D. The longitudinal Young’s modulus of Pinus radiata. Wood Sci. Technol. 1969, 3, 40–48. [Google Scholar] [CrossRef]
  28. Bendtsen, B.A.; Senft, J. Mechanical and anatomical properties in individual growth rings of plantation-grown eastern cottonwood and loblolly pine. Wood Fiber Sci. 1986, 18, 23–38. [Google Scholar]
  29. Romagnoli, M.; Cavalli, D.; Spina, S. Wood quality of chestnut: Relationship between ring width, specific gravity, and physical and mechanical properties. BioResources 2014, 9, 1132–1147. [Google Scholar] [CrossRef]
  30. Jeong, G.Y.; Zink-Sharp, A.; Hindman, D.P. Tensile properties of earlywood and latewood from loblolly pine (Pinus taeda) using digital image correlation. Wood Fiber Sci. 2009, 41, 51–63. [Google Scholar]
  31. Kretschmann, D.E.; Cramer, S.M.; Lakes, R.; Schmidt, T. Selected mesostructure properties in loblolly pine from Arkansas plantations. Charact. Cellul. Cell Wall 2006, 12, 149–170. [Google Scholar]
  32. Roszyk, E. The effect of ultrastructure and moisture content on mechanical parameters of pine wood (Pinus sylvestris L.) upon tensile stress along the grains. Turk. J. Agric. For. 2014, 38, 413–419. [Google Scholar] [CrossRef] [Green Version]
  33. Kang, C.W.; Juichi, T.; Jang, S.S. Mechanical behaviour of earlywood and latewood under longitudinal compression load. J. Korean Wood Sci. Technol. 2001, 29, 76–83. [Google Scholar]
  34. Rao, R.V.; Aebischer, D.P.; Denne, M.P. Latewood density in relation to wood fibre diameter, wall thickness, and fibre and vessel percentages in Quercus robur L. IAWA J. 1997, 18, 127–138. [Google Scholar] [CrossRef]
  35. Büyüksarı, Ü.; As, N.; Dündar, T. Mechanical properties of earlywood and latewood sections of Scots pine wood. BioResources 2017, 12, 4004–4012. [Google Scholar] [CrossRef] [Green Version]
  36. GB/T 1929-2009; Method of Logs Sawing and Test Specimens Selection for Physical and Mechanical Tests of Wood. China Quality and Standards Publishing: Beijing, China, 2009.
  37. GB/T 1933-2009; Method of Determination of the Density of Wood. China Quality and Standards Publishing: Beijing, China, 2009.
  38. GB/T 1932-2009; Method of Determination of the Shrinkage of Wood. China Quality and Standards Publishing: Beijing, China, 2009.
  39. GB/T 1936.2-2009; Method for Determination of the Modulus of Elasticity in Static Bending of Wood. China Quality and Standards Publishing: Beijing, China, 2009.
  40. GB/T 1936.1-2009; Method of Testing in Bending Strength of Wood. China Quality and Standards Publishing: Beijing, China, 2009.
  41. GB/T 1940-2009; Method of Testing in Tough of Wood. China Quality and Standards Publishing: Beijing, China, 2009.
  42. GB/T 1938-2009; Method of Testing in Tensile Strength Parallel to Grain of Wood. China Quality and Standards Publishing: Beijing, China, 2009.
  43. Shupe, T.F.; Hse, C.Y.; Choong, E.T.; Groom, L.H. Differences in some chemical properties of innerwood and outerwood from five silviculturally different loblolly pine stands. J. Wood Fiber Sci. 1997, 29, 91–97. [Google Scholar]
  44. Kretschmann, D.E. The influence of juvenile wood content on shear parallel, compression, and tension perpendicular to grain strength and mode I fracture toughness of loblolly pine at various ring orientation. For. Prod. J. 2008, 58, 89–96. [Google Scholar]
  45. Barnett, J.R.; Bonham, V.A. Cellulose microfibril angle in the cell wall of wood fibres. Biol. Rev. 2004, 79, 461–472. [Google Scholar] [CrossRef]
  46. Alteyrac, J.; Cloutier, A.; Zhang, S.Y. Characterization of juvenile wood to mature wood transition age in black spruce (Picea mariana (Mill.) BSP) at different stand densities and sampling heights. Wood Sci. Technol. 2006, 40, 124–138. [Google Scholar] [CrossRef]
  47. Eder, M.; Jungnikl, K.; Burgert, I. A close-up view of wood structure and properties across a growth ring of Norway spruce (Picea abies [L] Karst.). Trees 2009, 23, 79–84. [Google Scholar] [CrossRef] [Green Version]
  48. Kiaei, M. Anatomical, physical, and mechanical properties of eldar pine (Pinus eldarica Medw.) grown in the Kelardasht region. Turk. J. Agric. For. 2001, 35, 31–42. [Google Scholar]
  49. Eliza, K.; Kozakiewicz, P.; Buraczyk, W.; Szeligowski, H.; Lachowicz, H. The Technical Quality of Wood of Scots Pine (Pinus sylvestris L.) of Diverse Genetic Origin. Forests 2021, 12, 1–10. [Google Scholar]
  50. Gašparíkm, M.; Gaff, M.; Šafaříková, L.; Vallejo, C.R.; Svoboda, T. Impact Bending Strength and Brinell Hardness of Densified Hardwoods. Bioresources 2016, 11, 8638–8652. [Google Scholar]
  51. Pazos, G.B.; Morales, R.P.Z.; Candelaria, V.R.O.; Báez, A.G.; Salazar, J.A.H. Correlación de los resultados de impacto o tenacidad de 16 maderas mexicanas utilizando dos métodos de prueba. Madera Bosques 2003, 9, 55–70. [Google Scholar] [CrossRef] [Green Version]
  52. Christoforo, A.L.; Almeida, D.H.D.; Varanda, L.D.; Panzera, T.H.; Lahr, F.A. Estimation of wood toughness in brazilian tropical tree species. Eng. Agrícola 2020, 40, 232–237. [Google Scholar] [CrossRef]
Figure 1. Three stages in the process used to record growth ring characteristics: (a) initial sample end face photograph; (b) manual extraction of latewood area; (c) three measurements of overall width of radial growth rings.
Forests 13 00797 g001
Figure 2. The relationship between latewood (LW) percentage and ring width (RW).
Forests 13 00797 g002
Figure 3. End face images of samples from three categories of larch wood: Type I (moderate ring width (RW), high latewood (LW) percentage); Type II (large RW, small LW percentage); Type III (small RW, small LW percentage).
Forests 13 00797 g003
Figure 4. Influence of (a) latewood (LW) percentage and (b) ring width (RW) on shrinkage and density.
Forests 13 00797 g004
Table 1. Specimen sizes, quantities and the national Chinese reference standards used in their specification.
PropertiesSize (R × T × L) (mm)QuantityNational Reference Standard
Air-dry Density20 × 20 × 20109GB/T1933-2009
Dry Shrinkage20 × 20 × 20109GB/T 1932-2009
Modulus of Elasticity20 × 20 × 300196GB/T 1936.2-2009
Modulus of Rupture20 × 20 × 300105GB/T 1936.1-2009
Impact Bending Strength20 × 20 × 30083GB/T 1940-2009
Longitudinal Tensile Strength20 × 20 × 370131GB/T 1938-2009
Table 2. Mechanical properties of Japanese larch for the five classifications of RW (R1 to R5) and of LW percentage (L1 to L5). See text for classification definitions. MOE: modulus of elasticity; MOR: modulus of rupture; IBS: impact bending strength; UTS: ultimate tensile stress parallel to the grain; CV: coefficient of variation.
Group MOEMORIBSUTS
RW
(mm)
QuantityMean
(MPa)
CV
(%)
RW
(mm)
QuantityMean
(Mpa)
CV(%)RW
(mm)
QuantityMean
(kJ/m2)
CV
(%)
RW
(mm)
QuantityMean
(Mpa)
CV
(%)
RW classR11.804912.9217.181.832393.8514.501.832657.5527.281.8734107.5823.48
R22.765211.5318.752.813383.5317.122.751542.1728.942.863899.0233.17
R33.726011.9218.673.772783.6313.143.712949.9349.233.7143109.4031.15
R44.852011.0225.864.851286.1539.534.84837.7151.984.891189.5433.80
R56.14118.8318.296.00865.1115.956.50346.1667.376.33592.5530.88
LW
Percentage
class
L112.915310.3422.7412.223375.3929.9314.062042.9455.5613.363691.6227.44
L219.123811.9117.2119.192286.9512.8519.121246.7536.3019.203898.1228.22
L322.965912.5717.2022.922889.9916.4422.993151.2843.3122.7939108.4230.07
L426.972712.5017.7426.531389.3717.9727.371456.4523.5926.6413120.7424.42
L532.911912.2722.2432.06992.296.7631.90652.7226.5332.295149.4223.37
Table 3. The results of linear fits of mechanical properties of plantation Japanese larch (i.e., MOE, MOR, UTS) to ring width (w) and latewood percentage (l).
PropertiesLinear Fitting EquationR2
MOE y = 0.85 w + 14.46 0.88
y = 0.52 l + 75.92 0.56
MOR y = 6.33 w + 105.22 0.90
y = 0.58 l + 37.35 0.80
UTS y = 0.77 w + 114.31 0.59
y = 3.12 l + 42.74 0.96
MOE: modulus of elasticity; MOR: modulus of rupture; UTS: ultimate tensile stress parallel to the grain.
Publisher’s Note: MDPI stays neutral with regard to jurisdictional claims in published maps and institutional affiliations.

