
Optimum Phenological Phases for Deciduous Species Recognition: A Case Study on Quercus acutissima and Robinia pseudoacacia in Mount Tai

 ,
,
Abstract
:1. Introduction
2. Data and Methods
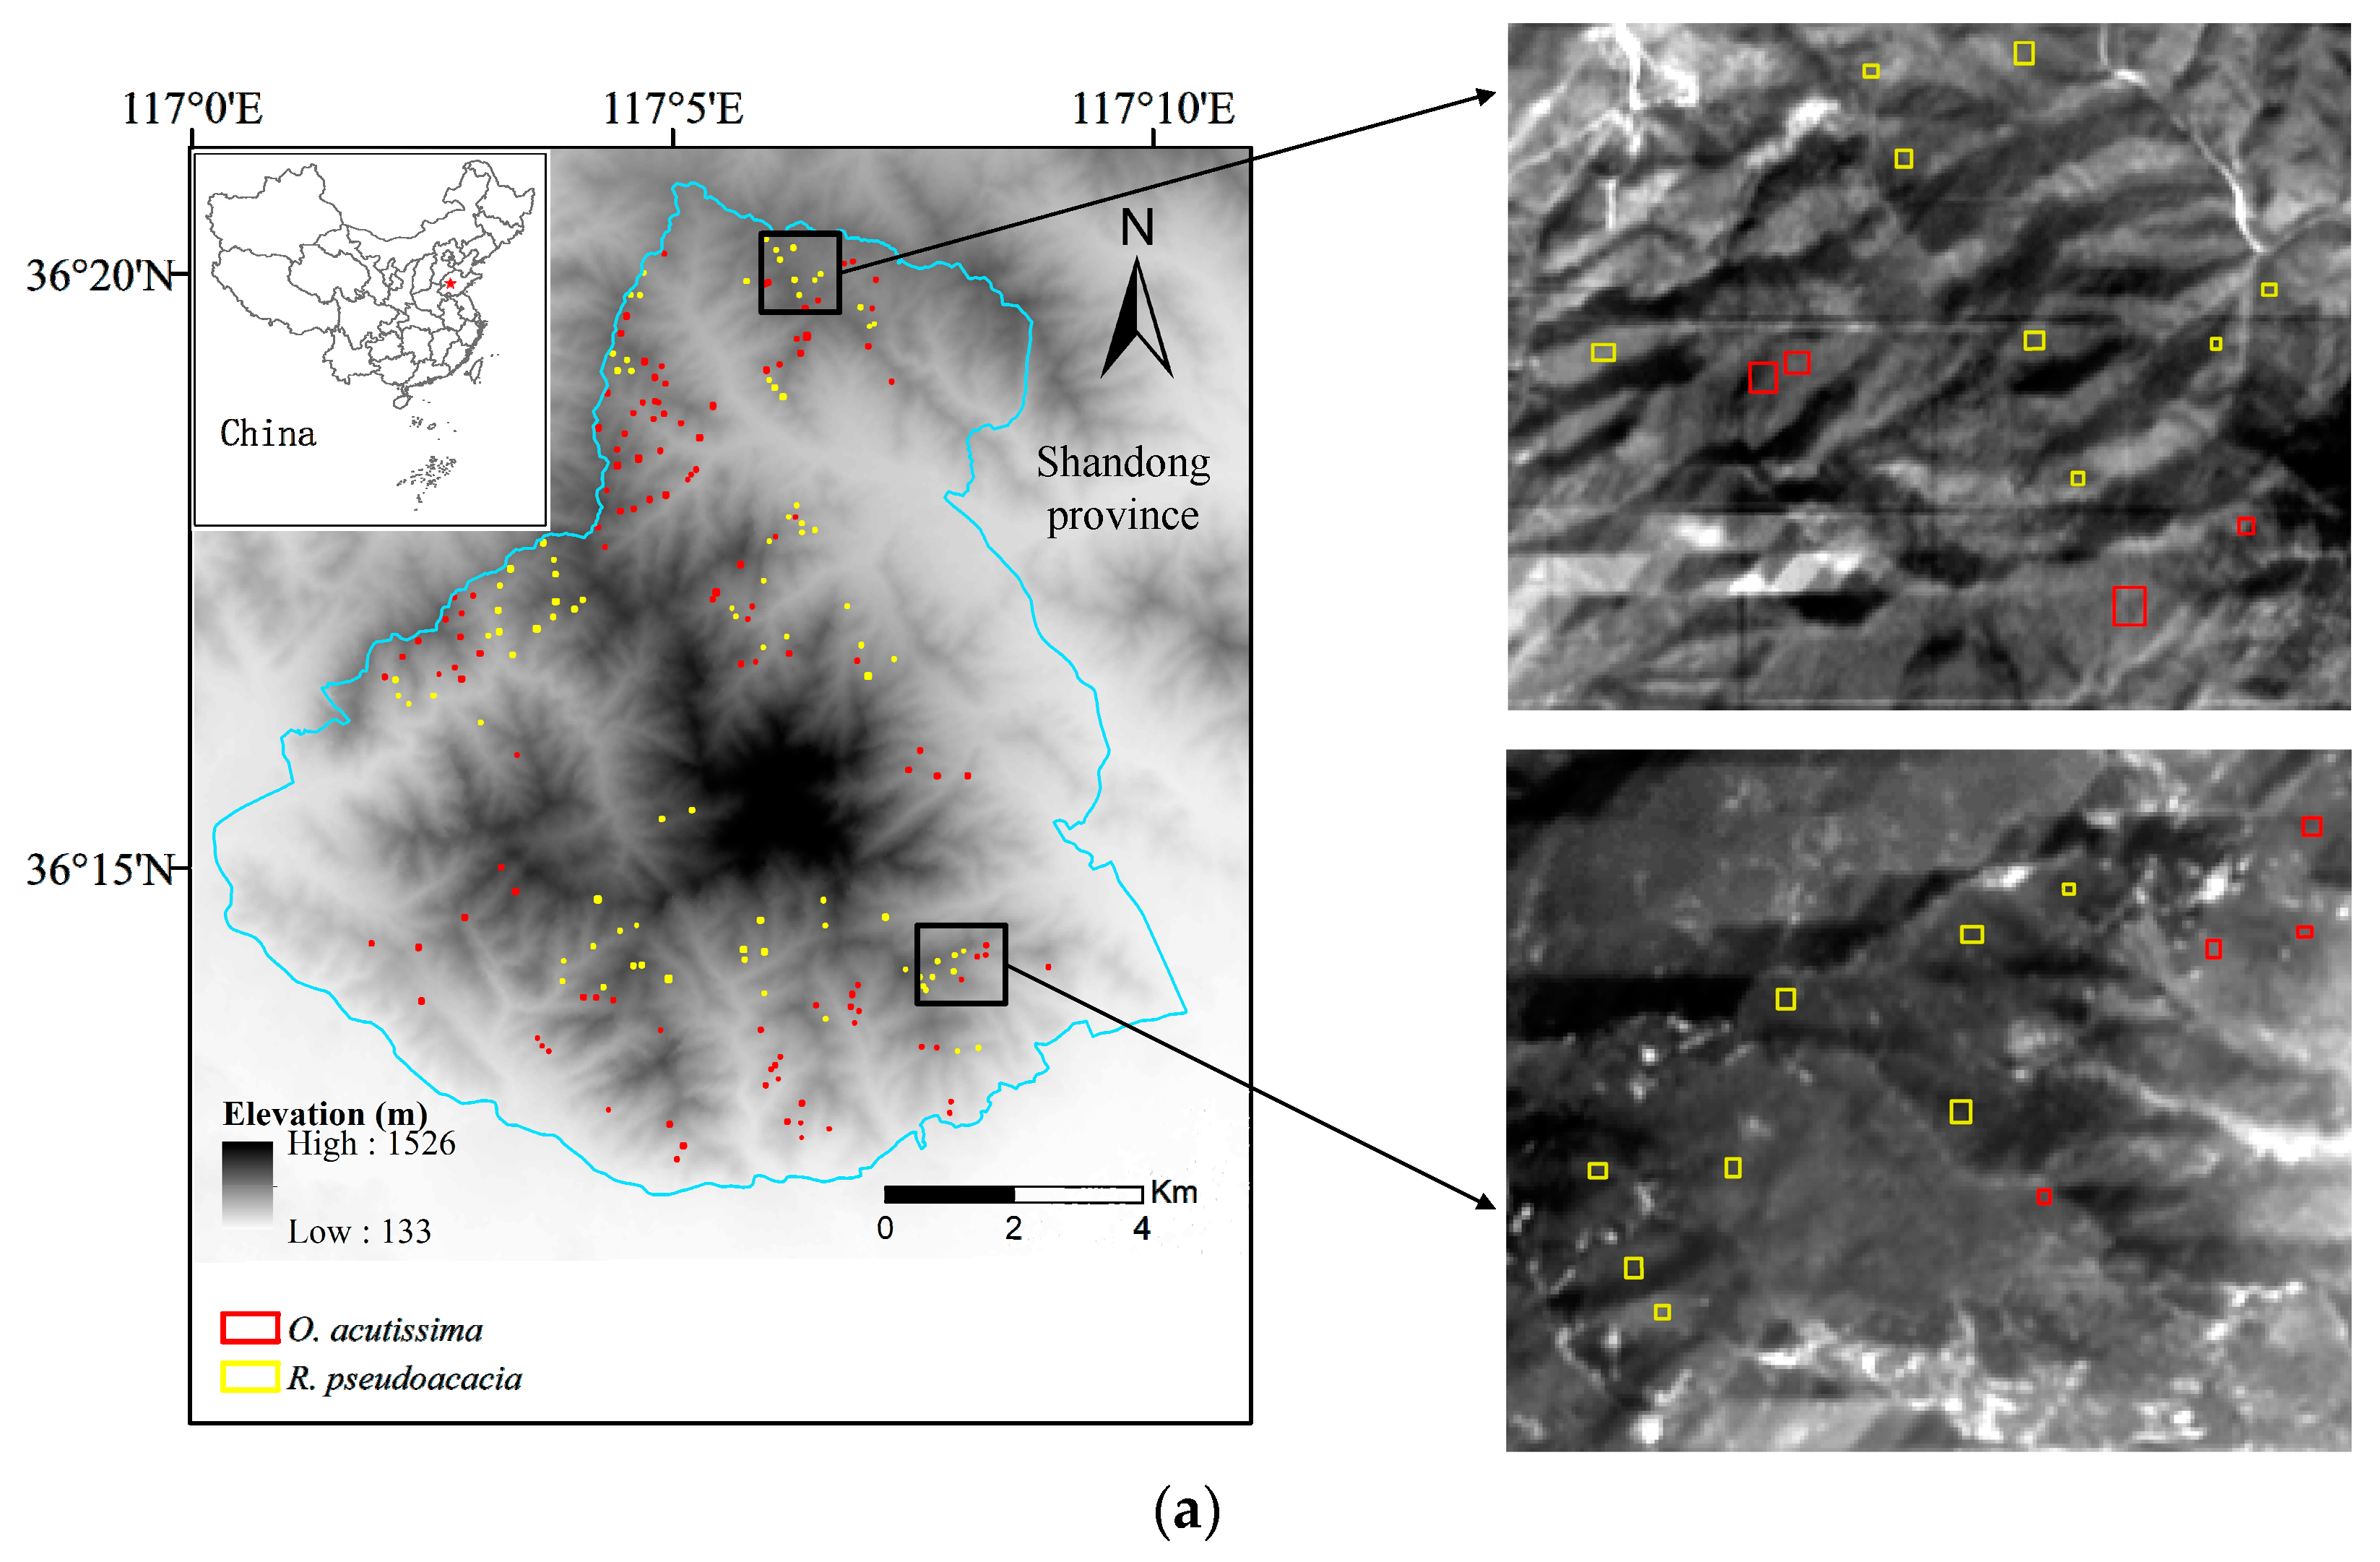
2.1. Study Area
2.2. Phenologic Characteristics of Tree Species
2.3. Multispectral Data
2.4. Sample Selection
2.5. Recognition Algorithm
2.6. Sensitive Spectral Indices
3. Results
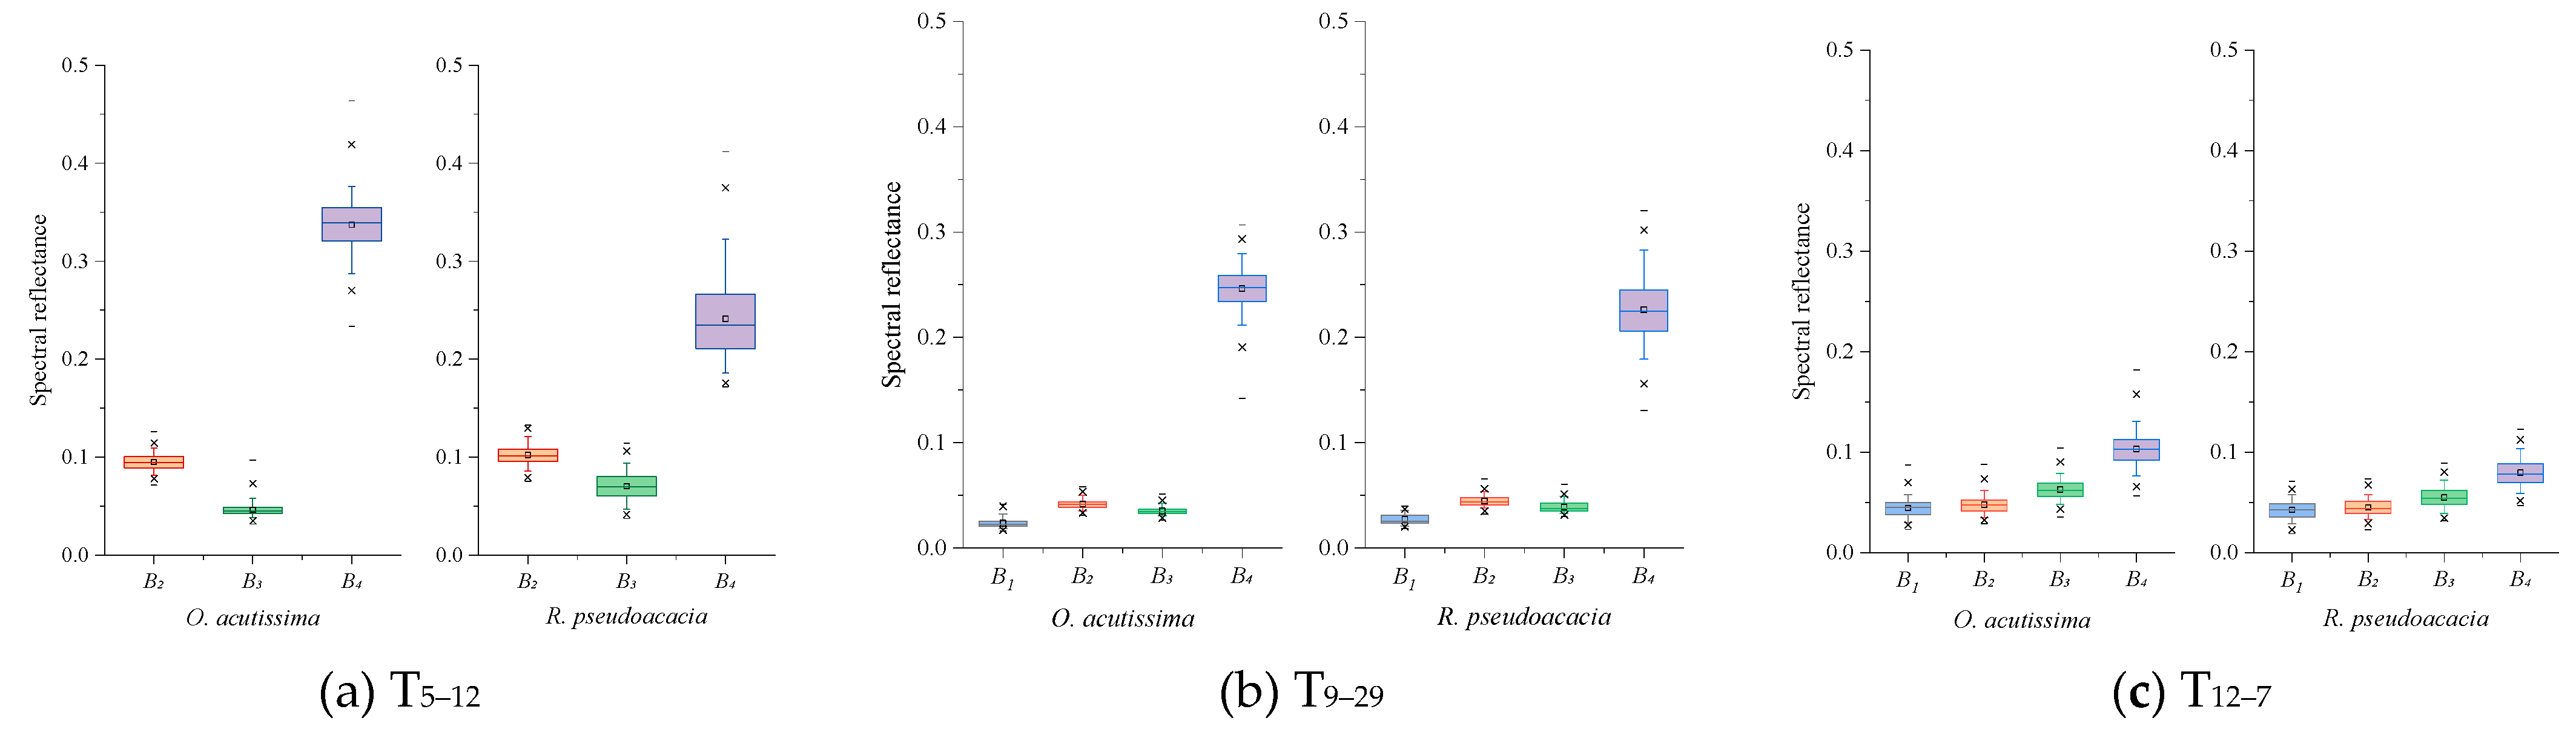
3.1. Spectral Characteristics
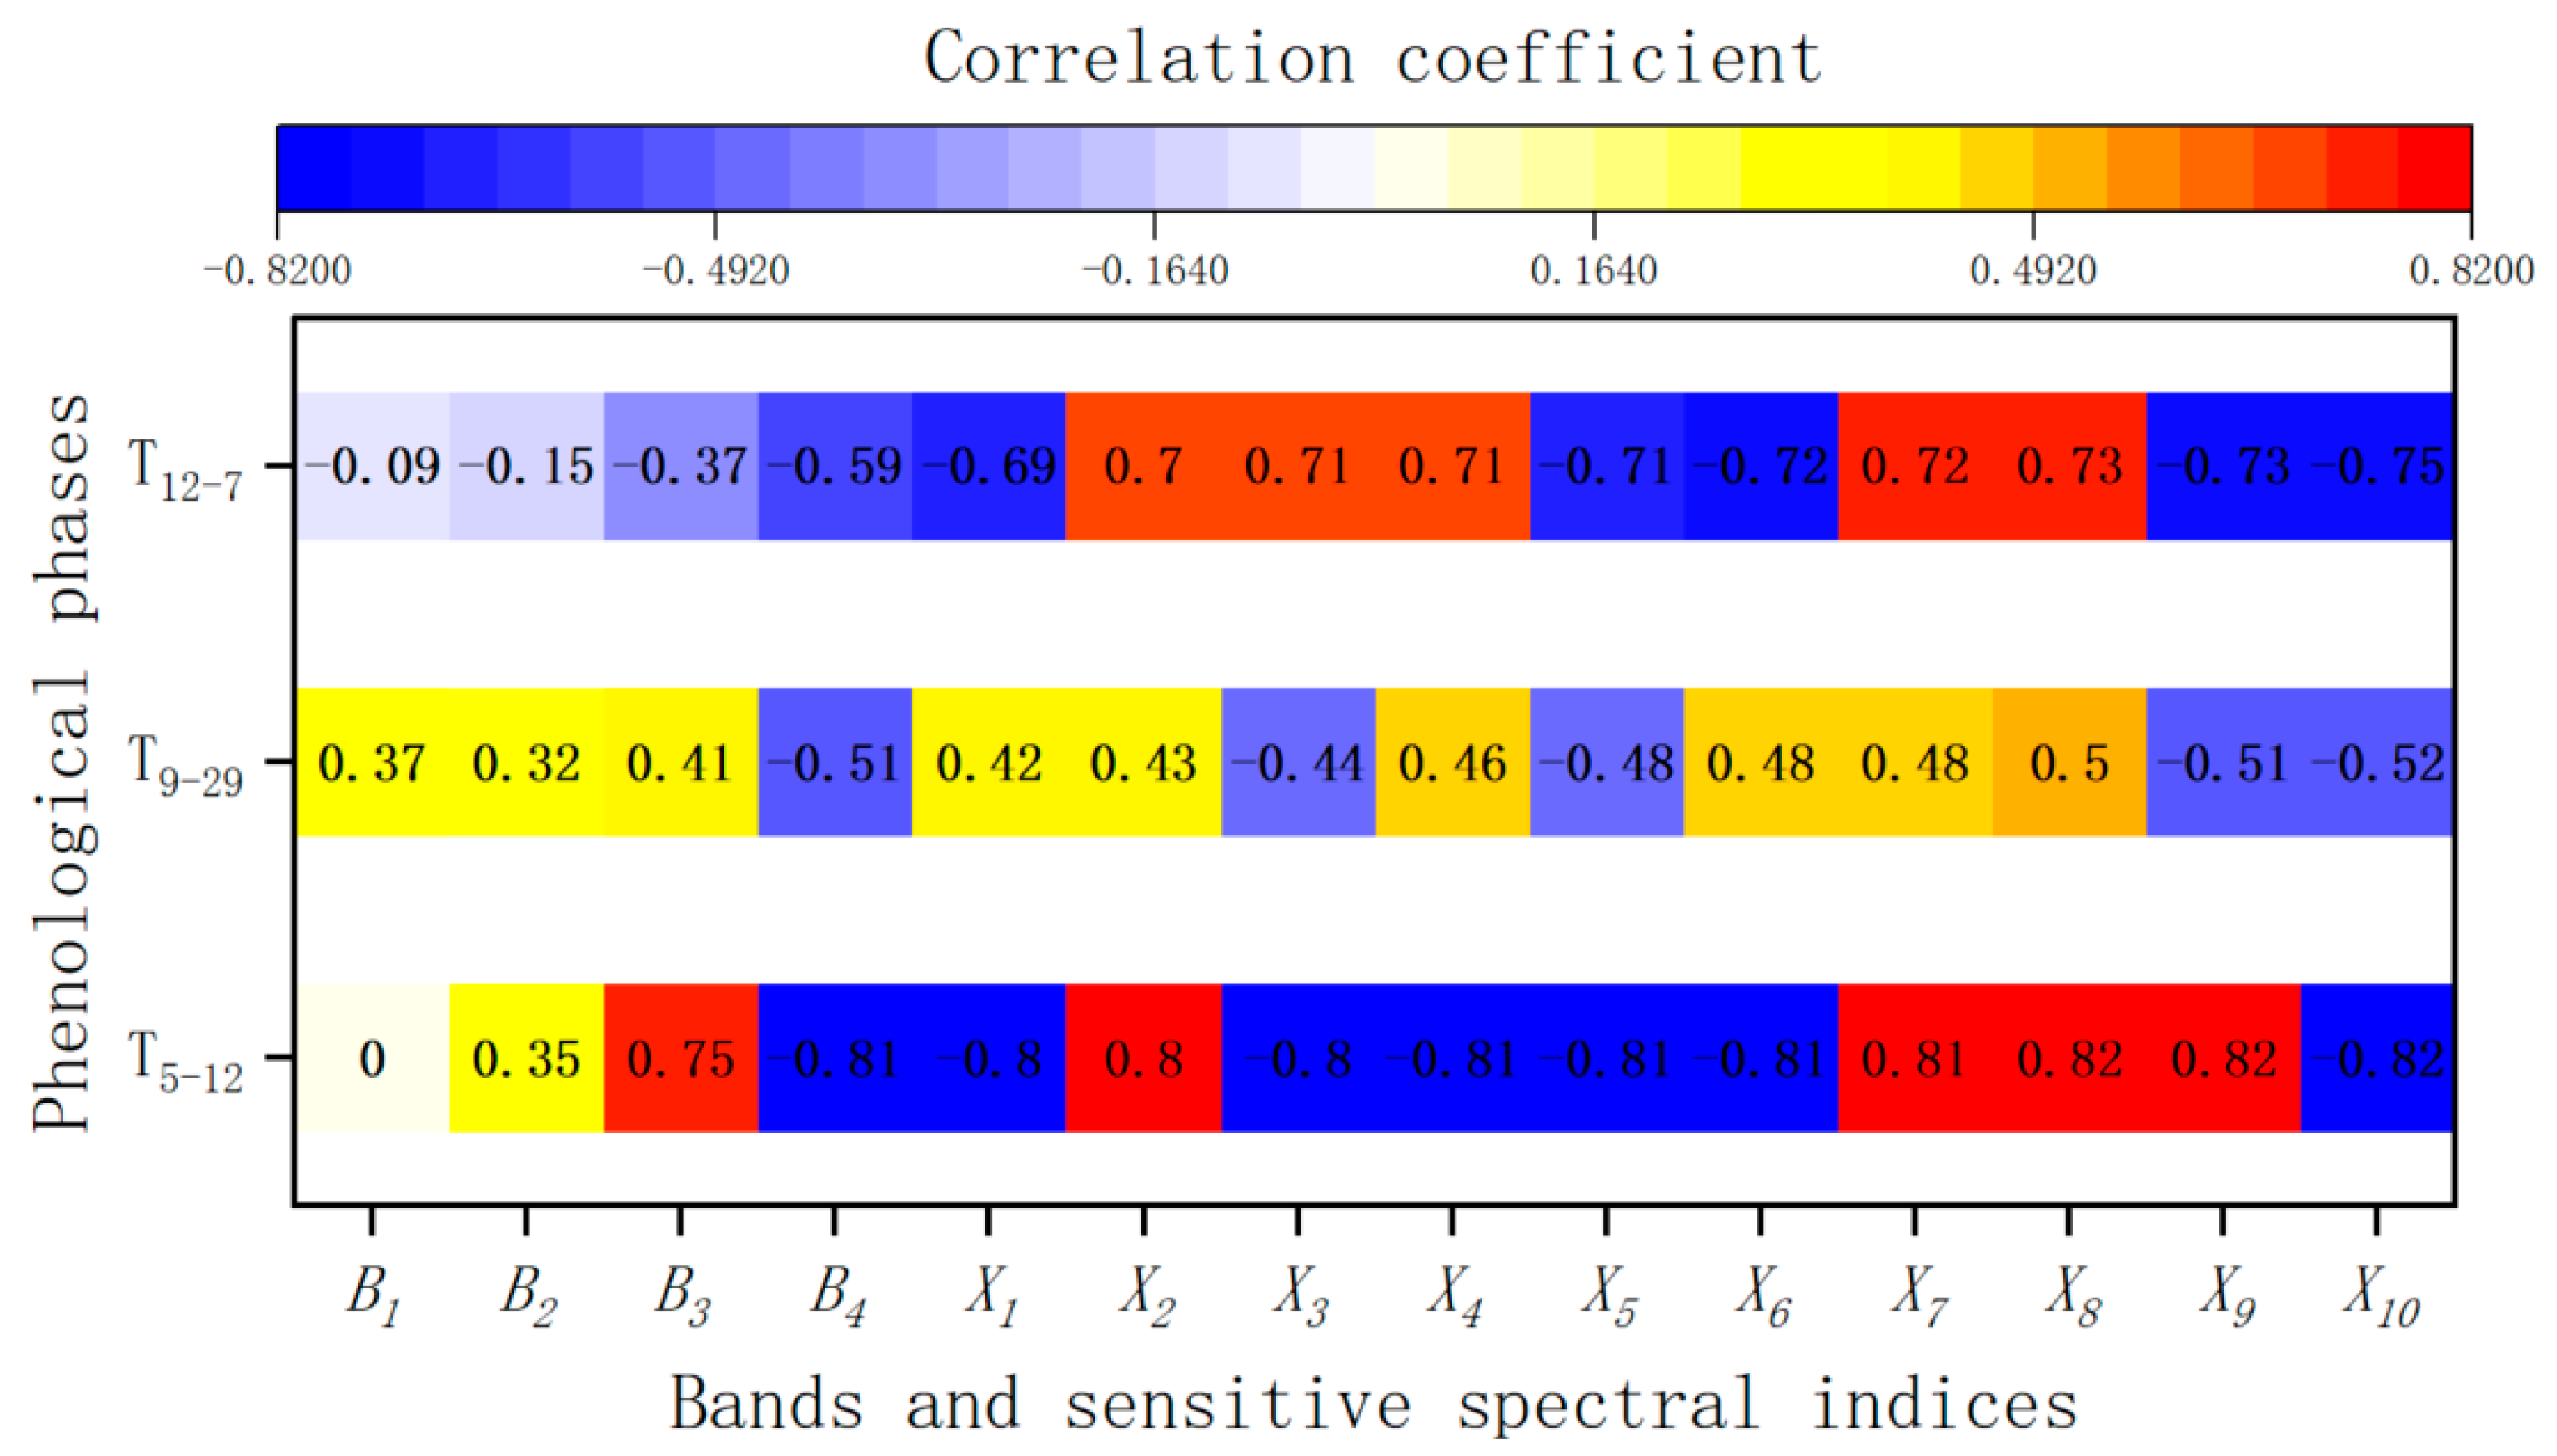
3.2. Sensitive Band and Sensitive Spectral Index
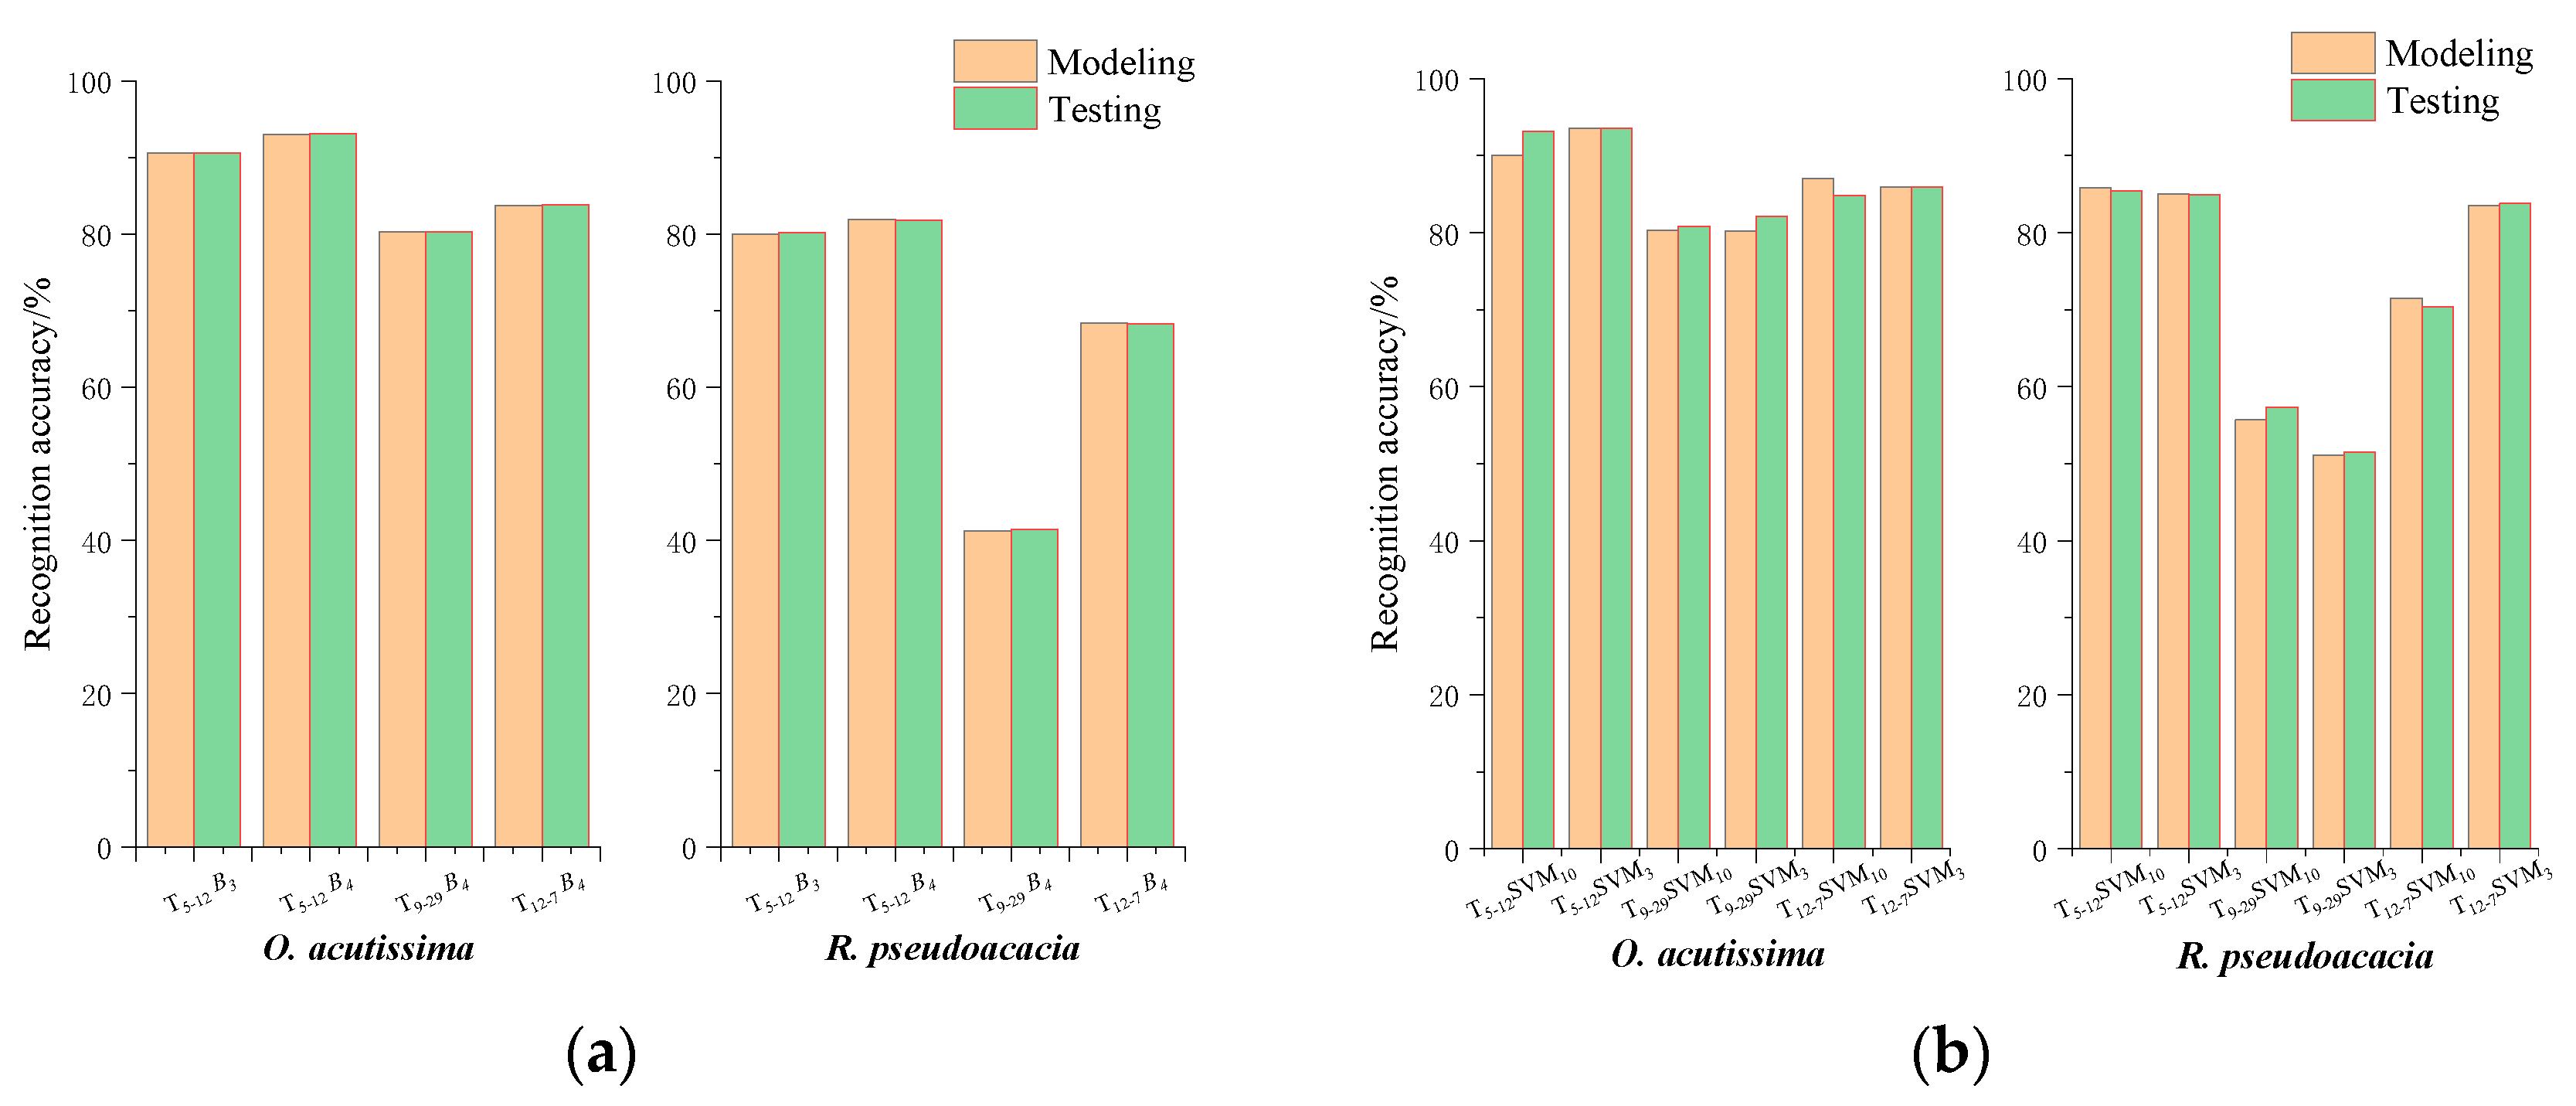
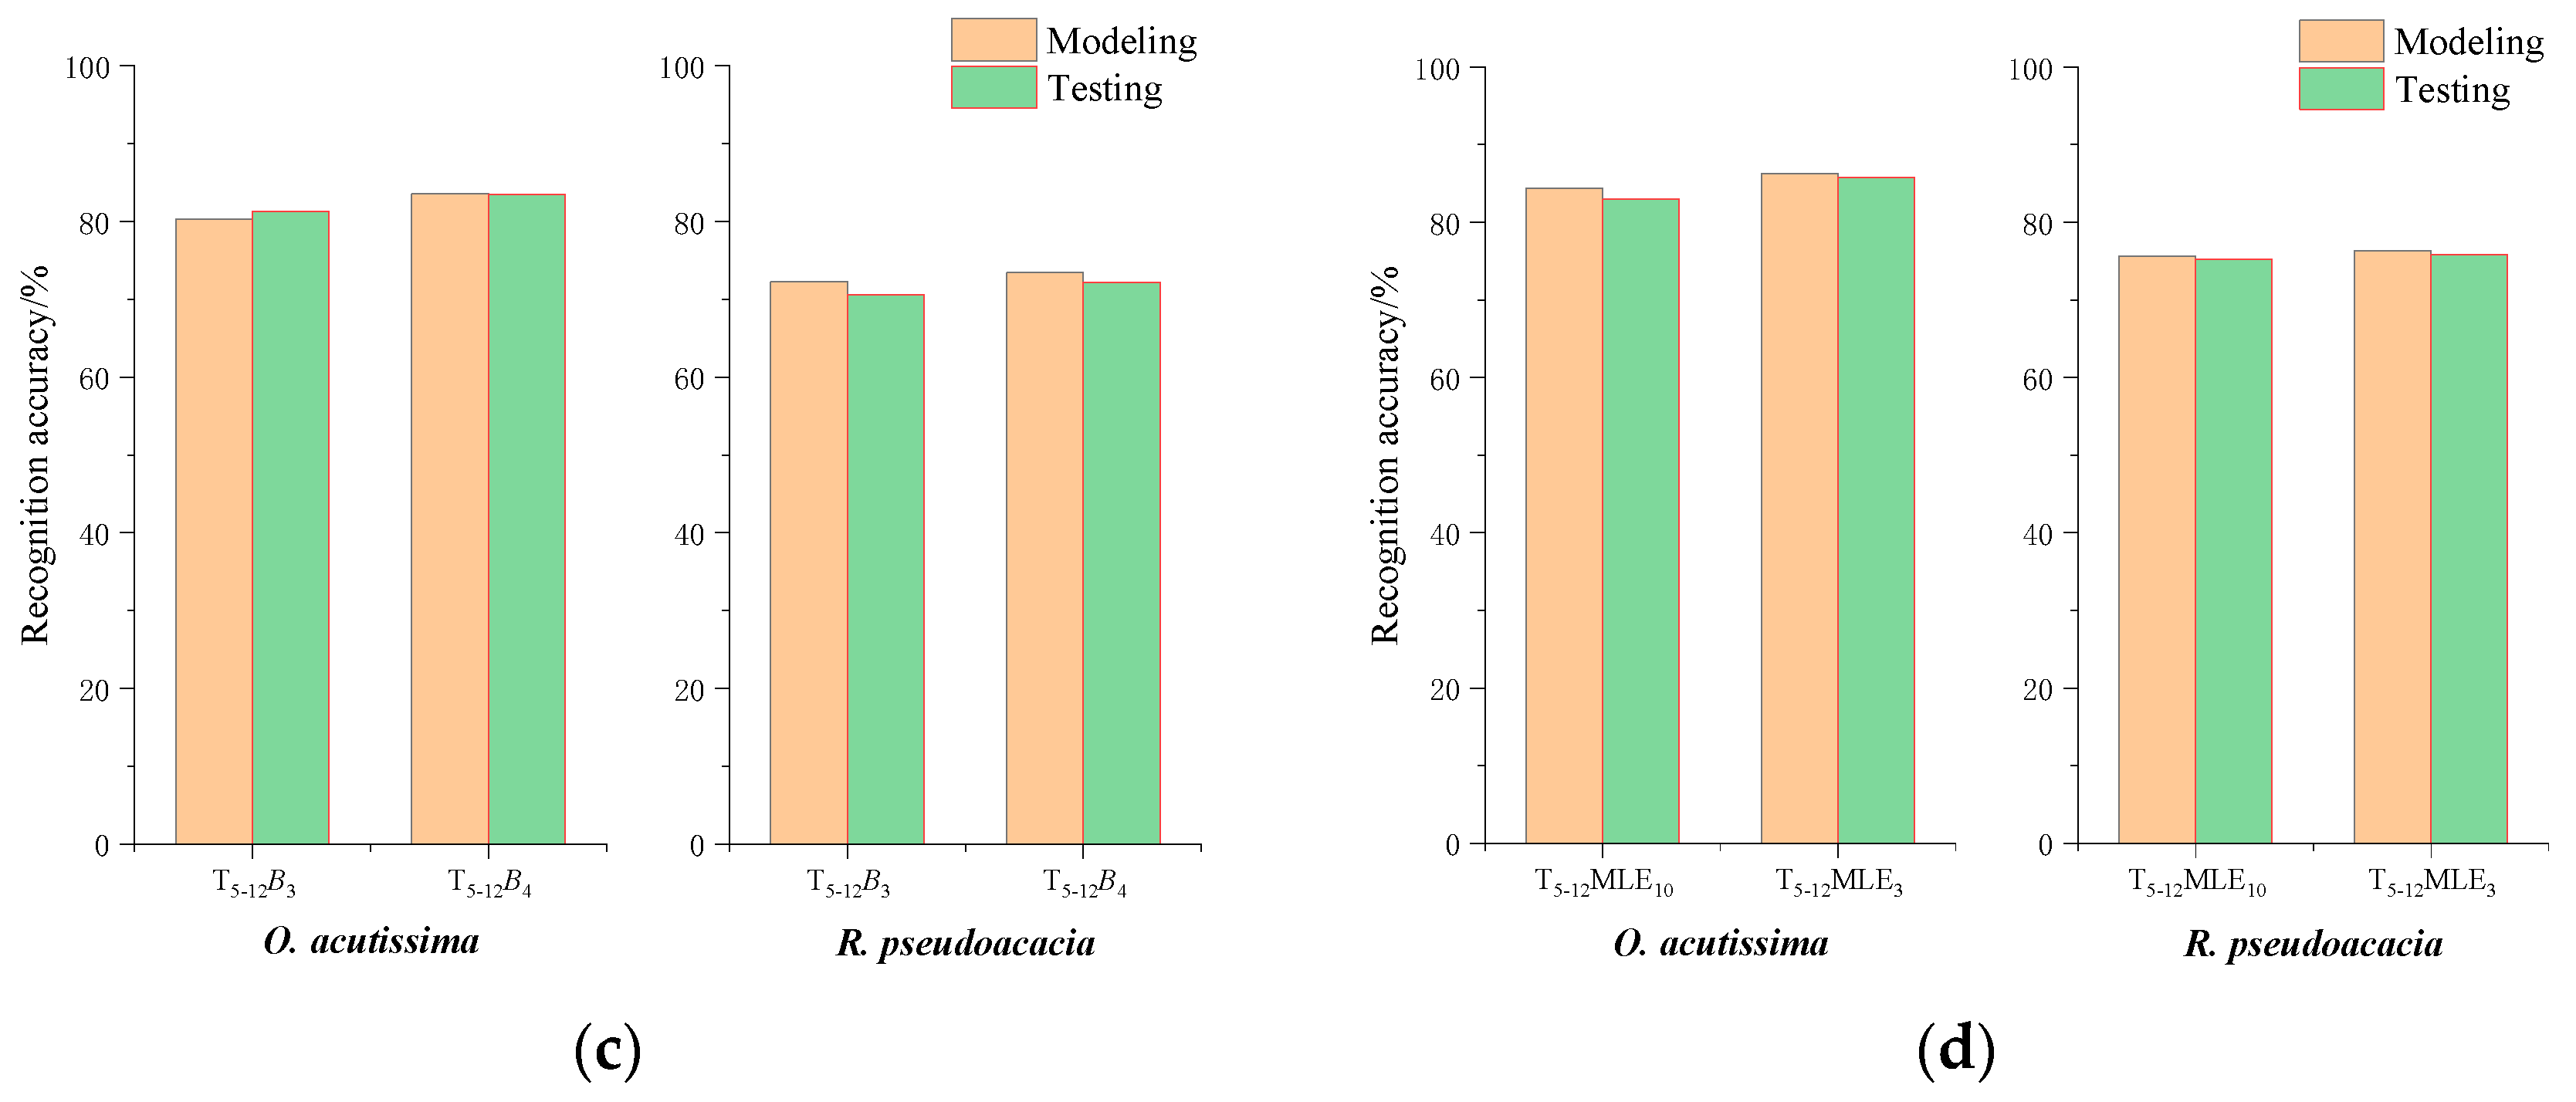
3.3. Recognition Accuracy
4. Discussion
5. Conclusions
Author Contributions
Funding
Institutional Review Board Statement
Informed Consent Statement
Data Availability Statement
Conflicts of Interest
References
- Su, Y.; Li, J.; Qiu, J.; Jin, Z.; Fang, X.; Chao, Y.; Wang, J.; Zhou, H. Current situation investigation and analysis of medicinal plant resources in Mount Tai area. Chin. Wild Plant Resour. 2018, 37, 1006–9690. [Google Scholar]
- Huanxue, Z.; Xin, C.; Qiangzi, L.; Miao, Z.; Xinqi, Z. Research on crop identification using multi-temporal NDVI HJ images. Remote Sens. Technol. Appl. 2015, 30, 304–311. [Google Scholar]
- Lehmann, E.A.; Caccetta, P.A.; Zhou, Z.S.; McNeill, S.J.; Wu, X.; Mitchell, A.L. Joint Processing of Landsat and ALOS-PALSAR Data for Forest Mapping and Monitoring. IEEE Trans. Geosci. Remote Sens. 2011, 50, 55–67. [Google Scholar] [CrossRef]
- Zhou, H.Z.; Qu, Z.L. The method to estimate timber volume with GIS in forest resouree inventory. J. Northeast For. Univ. 2000, 28, 50–53. [Google Scholar]
- Zhang, K.; Hu, B. Individual Urban Tree Species Classification Using Very High Spatial Resolution Airborne Multi-Spectral Imagery Using Longitudinal Profiles. Remote Sens. 2012, 4, 1741–1757. [Google Scholar] [CrossRef] [Green Version]
- Wang, L.; Fan, W.Y. Hyperspectral remote sensing data for identifying dominant forest tree species group. J. Northeast For. Univ. 2015, 43, 134–137. [Google Scholar]
- Qian, H.S. Selection of the optimum temporal for crop estimation using remote sensing data: Main food crops in China. Acta Ecol. Sin. 1998, 18, 48–55. [Google Scholar]
- Dahms, T.; Seissiger, S.; Borg, E.; Vajen, H.; Fichtelmann, B.; Conrad, C. Important Variables of a RapidEye Time Series for Modelling Biophysical Parameters of Winter Wheat. Photogramm. Fernerkund. Geoinf. 2016, 5, 285–299. [Google Scholar] [CrossRef] [Green Version]
- Pan, Y.; Li, L.; Zhang, J.; Liang, S.; Zhu, X.; Sulla-Menashe, D. Winter wheat area estimation from MODIS-EVI time series data using the Crop Proportion Phenology Index. Remote Sens. Environ. 2012, 119, 232–242. [Google Scholar] [CrossRef]
- Ou, W.; Su, W.; Xue, W.; Xia, X. Selection of optimum phase for yield estimation of three major crops based on HJ-1 satellite images. Trans. CSAE 2010, 26, 176–182. [Google Scholar]
- Xu, G.C.; Pang, Y.; Li, Z.Y.; Zhao, K.R.; Liu, L.X. The changes of forest canopy spectral reflectance with seasons in Xiaoxing’anling. Spectrosc. Spectr. Anal. 2013, 33, 3303–3307. [Google Scholar]
- Wang, W.J.; Zhang, X.; Zhao, Y.D.; Wang, S.D. Cotton extraction method of integrated multi-features basedon multi-temporal Landsat 8 images. J. Remote Sens. 2017, 21, 115–124. [Google Scholar]
- Martin, M.E. Determining forest species composition using high spectral resolution remote sensing dates. Remote Sens. Environ. 1998, 65, 249–254. [Google Scholar] [CrossRef]
- Tian, J.; Xing, Y.; Yao, S. Comparison of Landsat-TM Image Forest Type Classification Based on Cellular Automata and BP Neural Network Algorithm. Sci. Silvae Sin. 2017, 53, 26–34. [Google Scholar]
- Zhang, J.; Zhang, X.; Tian, L.; Zhang, Q.F. The support vector machine method for RS images’ classification in northwest arid area. Sci. Surv. Mapp. 2017, 42, 49–52. [Google Scholar] [CrossRef]
- Li, D.R.; Wang, S.L.; Li, D.Y. Spatial Data Mining Theory and Applications, 2nd ed.; Science Press: Beijing, China, 2013. [Google Scholar]
- Yue, J.; Wang, Z.X.; Feng, Z.F.; Li, Z.Y.; Wang, L.D. Studies on remote sensing recognition on fruit trees species based on spectrum and texture features in southern Xinjiang basin. J. Xinjiang Agric. Univ. 2015, 38, 326–333. [Google Scholar]
- Zhang, Z.Y.; Liu, X.Y. Support vector machines for tree species identification using LiDAR-derived structure and intensity variables. Geocarto Int. 2013, 28, 364–378. [Google Scholar] [CrossRef]
- Li, M.Y.; Xing, Y.Q.; Liu, M.S.; Wang, Z.; Yao, S.T.; Zeng, X.J.; Xie, J. Identification of forest type with Landsat-8 image based on SVM. J. Cent. South Univ. For. Technol. 2017, 37, 52–58. [Google Scholar]
- Wang, L. Satellite Remote Sensing Retrieval of Nitrogen and Phosphorous Nutritional Status in Apple Tree Leaves/Canopiesat Blossom Stage; Shandong Agricultural University: Taian, China, 2012. [Google Scholar]
- Yang, Y.L.; Cao, B.H.; Wu, D.; Zhang, D.P. The study of the main ornamental tree species resources of landscape forest on Mountan tai. J. Inn. Mong. Agric. Univ. (Nat. Sci. Ed.) 2007, 28, 19–24. [Google Scholar]
- Liu, X.C.; Dai, Y.K.; Wang, X.Z. Encyclopedia of Mount Tai; Jinan, Shandong Friendship Publishing House: Jinan, China, 1995. [Google Scholar]
- Institute of Geographical Research, Chinese Academy of Sciences. Annual Report of Chinese Animal and Plant Phenological Observation (No. 9); Geological Publishing House: Beijing, China, 1989. [Google Scholar]
- Cortes, C.; Vapnik, V. Support-vector networks. Mach. Learn. 1995, 20, 273–297. [Google Scholar] [CrossRef]
- Wu, L.; Wen, Y. Weed/corn seedling recognition by support vector machine using texture features. Afr. J. Agric. Res. 2009, 4, 840–846. [Google Scholar]
- Mathur, A.; Foody, G.M. Crop classification by support vector machine with intelligently selected training data for an operational application. Int. J. Remote Sens. 2008, 29, 2227–2240. [Google Scholar] [CrossRef] [Green Version]
- Ahmed, F.; Bari, A.H.; Hossain, E.; Al-Mamun, H.A.; Kwan, P. Performance analysis of support vector machine and Bayesian classifier for crop and weed classification from digital images. World Appl. Sci. J. 2011, 12, 432–440. [Google Scholar]
- Pulido, C.; Solaque, L.; Velasco, N. Weed recognition by SVM texture feature classification in outdoor vegetable crop images. IngenIería InvestIgacIón 2017, 37, 68–74. [Google Scholar] [CrossRef]
- Ahmed, F.; Al-Mamun, H.A.; Bari, A.H.; Hossain, E.; Kwan, P. Classification of crops and weeds from digital images: A support vector machine approach. Crop Prot. 2012, 40, 98–104. [Google Scholar] [CrossRef]
- Huang, H.; Liang, X.J.; Xiao, X.; Qiu, S.W.; Xiao, C.L.; Wang, Z. Model of groundwater quality assessment with support vector machine based on rough set. China Environ. Sci. 2016, 36, 619–625. [Google Scholar] [CrossRef]
- Luo, J.C.; Zhou, C.H.; Leung, Y.; Ma, J.H. Support vector machine for spatial feature extraction and classification of remotely sensed imagery. J. Remote Sens. 2002, 6, 50–55. [Google Scholar]
- Hogland, J.; Billor, N.; Anderson, N. Comparison of standard maximum likelihood classification and polytomous logistic regression used in remote sensing. Eur. J. Remote Sens. 2013, 46, 623–640. [Google Scholar] [CrossRef] [Green Version]
- Meghanathan, N. Assortativity Analysis of Real-World Network Graphs based on Centrality Metrics. Comput. Inf. Sci. 2016, 9, 7. [Google Scholar] [CrossRef] [Green Version]
- Evans, J.D. Straightforward Statistics for the Behavioral Sciences, 1st ed.; Brooks Cole Publishing Company: Salt Lake City, UT, USA, 1995. [Google Scholar]
- Zhang, P.; Wang, H.; Wu, Q.; Yu, M.; Wu, T. Effect of wind on the relation of leaf N, P stoichiometry with leaf morphology in Quercus species. Forests 2018, 9, 110. [Google Scholar] [CrossRef] [Green Version]
- Giovanetti, M.; Aronne, G. Honey bee handling behaviour on the papilionate flower of Robinia pseudoacacia L. Arthropod-Plant Interact. 2013, 7, 119–124. [Google Scholar] [CrossRef]


| Tree Species | Germinating | Leaf Expansion | Flowering | Fruit Ripening | Leaf Color Changing | Defoliating |
|---|---|---|---|---|---|---|
| O. acutissima | Mid to late March | The end of March to early April | Late March to early May | September to October of the next year | Late September to mid October | Late November to the end of December |
| R. pseudoacacia | Late February to early April | Early to mid April | Mid April to mid May | Mid July to September of the next year | Late September to early October | Mid October to late November |
| B1 (Blue)/μm | B2 (Green)/μm | B3 (Red)/μm | B4 (Near Infrared)/μm | Spatial Resolution/m | ||
|---|---|---|---|---|---|---|
| Multispectral image | ZY–3 | 0.45–0.52 | 0.52–0.59 | 0.63–0.69 | 0.77–0.89 | 5.8 |
| ZY–1 02C | –– | 0.52–0.59 | 0.63–0.69 | 0.77–0.89 | 10 | |
| Single Band | Multi–Band | |||
|---|---|---|---|---|
| Bi2 | Bi1/3 | Bi ± Bj | lnBi/(Bi± Bj) | (BiBj)/(Bi + Bj) |
| Bi3 | eBi | BiBj | (Bi ± Bj)/eBi | (Bi − Bj)/(Bi + Bj) |
| Bi0.5 | lnBi | Bi/Bj | (Bi/Bj)/(Bi ± Bj) | (Bi − Bj)/(BiBj) |
| T5–12 | T9–29 | T12–7 | |
|---|---|---|---|
| X1 | (B2 − B3)/(B2B3) | B2 − B4 | B4/B3 |
| X2 | (B3 − B4) × (B3 + B4) | (B1 − B4)/(B1B4) | (B4/B3)/(B4 − B3) |
| X3 | eB4 | (B4 − B2)/(eB4) | lnB3/(B3− B4) |
| X4 | lnB4 | (B3 − B4)/(B3B4) | B3/B4 |
| X5 | B41/3 | (B2/B4)/(B2 − B4) | lnB4/(B4− B3) |
| X6 | B40.5 | (B2/B4)/(B2 + B4) | B4 − B3 |
| X7 | B2 − B4 | (B3/B4)/(B3 + B4) | B3 − B4 |
| X8 | B3 − B4 | B2/B4 | (B3 − B4)/(eB3) |
| X9 | (B3 − B4)/(eB3) | B4/B1 | (B4 − B3)/(eB4) |
| X10 | B4/B3 | B4/B3 | (B3/B4)/(B3 − B4) |
| Tree Species | Degree | Gamma | Coef0 | Epsilon | C | Nu | Shrinking | P |
|---|---|---|---|---|---|---|---|---|
| O. acutissima | 3 | 0.5 | 0.001 | 0.001 | 1 | 0.5 | 1 | 1 |
| R. pseudoacacia | 3 | 0.5 | 0.001 | 0.001 | 1 | 0.5 | 1 | 1 |
Publisher’s Note: MDPI stays neutral with regard to jurisdictional claims in published maps and institutional affiliations. |
© 2022 by the authors. Licensee MDPI, Basel, Switzerland. This article is an open access article distributed under the terms and conditions of the Creative Commons Attribution (CC BY) license (https://creativecommons.org/licenses/by/4.0/).
Share and Cite
Liu, X.; Wang, L.; Li, L.; Zhu, X.; Chang, C.; Lan, H. Optimum Phenological Phases for Deciduous Species Recognition: A Case Study on Quercus acutissima and Robinia pseudoacacia in Mount Tai. Forests 2022, 13, 813. https://0-doi-org.brum.beds.ac.uk/10.3390/f13050813
Liu X, Wang L, Li L, Zhu X, Chang C, Lan H. Optimum Phenological Phases for Deciduous Species Recognition: A Case Study on Quercus acutissima and Robinia pseudoacacia in Mount Tai. Forests. 2022; 13(5):813. https://0-doi-org.brum.beds.ac.uk/10.3390/f13050813
Chicago/Turabian StyleLiu, Xiao, Ling Wang, Langping Li, Xicun Zhu, Chunyan Chang, and Hengxing Lan. 2022. "Optimum Phenological Phases for Deciduous Species Recognition: A Case Study on Quercus acutissima and Robinia pseudoacacia in Mount Tai" Forests 13, no. 5: 813. https://0-doi-org.brum.beds.ac.uk/10.3390/f13050813