
Site Index Modeling of Larch Using a Mixed-Effects Model across Regional Site Types in Northern China


1
Research Institute of Forest Resource Information Techniques, Chinese Academy of Forestry, Beijing 100091, China
2
Key Laboratory of Forest Management and Growth Modeling, National Forestry and Grassland Administration, Beijing 100091, China
3
Faculty of Mathematics and Statistics, Xinyang Normal University, Xinyang 464000, China
4
Research Institute of Forestry, Chinese Academy of Forestry, Beijing 100091, China
*
Author to whom correspondence should be addressed.
Forests 2022, 13(5), 815; https://0-doi-org.brum.beds.ac.uk/10.3390/f13050815
Submission received: 18 April 2022
/
Revised: 19 May 2022
/
Accepted: 20 May 2022
/
Published: 23 May 2022
(This article belongs to the Special Issue Advances in Forest Growth and Site Productivity Modeling)
Abstract
:As the dominant height of the stand at the baseline age, the site index is an important index to evaluate site quality. However, due to the variability of environmental factors, the growth process of the dominant height of the same tree species was variable in different regions which influenced the estimation results of the site index. In this study, a methodology that established site index modeling of larch plantations with site types as a random effect in northern China was proposed. Based on 394 sample plots, nine common base models were developed, and the best model (M8) was selected (R2 = 0.5773) as the base model. Moreover, elevation, aspect, and slope position were the main site factors influencing stand dominant height through the random forest method. Then, the three site factors and their combinations (site types) were selected as random effects and simulated by the nonlinear mixed-effects model based on the model M8. The R2 values had raised from 0.5773 to 0.8678, and the model with combinations (94 kinds) of three site factors had the best performance (R2 = 0.8678). Considering the model accuracy and practical application, the 94 combinations were divided into three groups of site types (3, 5, and 8) by hierarchical clustering. Furthermore, a mixed-effects model considering the random effects of these three groups was established. All the three groups of site types got a better fitting effect (groups 3 R2 = 0.8333, groups 5 R2 = 0.8616, groups 8 R2 = 0.8683), and a better predictive performance (groups 3 R2 = 0.8157, groups 5 R2 = 0.8464, groups 8 R2 = 0.8479 for 20 percent of plots randomly selected per group in the calibration procedure) using the leave-one-out cross-validation approach. Therefore, groups 5 of site types had better applicability and estimation of forest productivity at the regional level and management plan design.
1. Introduction
Site quality evaluation is a fundamental component of forest management and is vitally important for an improved understanding of forest growth processes and optimization of silviculture practices [1,2]. The dominant height growth model (i.e., the site index) has been considered the most suitable approach for assessing site productivity for management purposes in even-aged forest stands [3,4]. However, due to different environmental factors, the growth process of dominant height was variable in different regions, the simulation accuracy of the dominant height growth model is often low, and the estimation results of the site index of the same tree species vary significantly in different regions due to site quality [5,6]. The relationship between the site index and environmental factors has been investigated from the mesoscale to the regional scale [6,7]. In addition, due to increased global climate change research, climatic factors have been recognized as vital influences on the growth process, driving the site index. Thus, many studies on the relationship between the climate, productivity, and the site index have been conducted in the past few years [8,9]. The influence of environmental factors (climate, soil, and topography) should be considered in site index modeling [10]. Moreover, the influences of environmental factors on the site index are often scale-dependent. Therefore, scale is crucial in establishing a site productivity model. Aertsen et al. [11] observed that a small-scale site index model requires high-resolution information to capture the variability of the variables, whereas low-resolution information is sufficient to characterize the variability in large-scale site index models.
Many early site index modeling studies relating the site index to environmental variables used basic statistical methods such as linear regression. Most ecological variables are characterized by nonlinearity and non-constant variance, therefore, a large fraction of the variance remains unexplained by linear models. Aertsen et al. [12] compared and evaluated five modeling techniques (multiple linear regression, classification and regression trees, boosted regression trees, generalized additive models, and artificial neural networks) for site index modeling and found that boosted regression trees provided good ecological interpretability. Pietrzykowski et al. [13] studied the relationship between the site index of Scots pine and the physical, chemical, and biological characteristics of the soil. A logarithmic or square root transformation of several environmental variables was performed, and linear regression analysis was conducted. Nonparametric and machine learning methods are often used to model nonlinear relationships [14,15]. Moreover, there are complex interactions between different environmental factors, which influence the site quality, and simple linear regression is not suitable to explain the relationship between environmental variables and the site index [16].
Some scholars used dummy variables for tree height-age modeling and evaluated site quality using the average height of trees in sample plots instead of site factors [17]. Although this method provides high accuracy for site index modeling, the expression form of the environmental factors in the model requires further study. Site index models can be divided into models with curves of the same shape (simplex method) and polymorphic models. The latter is based on the average dominant height and considers site condition factors [18,19]. The polymorphic site index model describes different growth patterns for different sites and provides better estimates of tree growth than the simplex method. A mixed-effects model is a common modeling approach to process local variability [20,21,22]. The mixed model reflects the overall average tree growth trend for different site types and provides the variance and covariance to reflect differences between individuals.
Larix principis-rupprechtii is a typical zonal tree species. It grows fast and has excellent timber quality, its plasticity to climate is strong and it has the efficiency of soil conservation and wind protection. It is widely used in forest regeneration and afforestation in North China [23]. As the third-largest area of conifer species in China, larch has a wide geographical distribution, and the latitude and longitude affect the height at the middle and large scales [2,24,25]. Meanwhile, site factors (such as altitude, soil layer thickness, aspect, etc.) have significant impacts on the site productivity at the stand-level [26]. For a stand, the site type is a combination of multiple site factors, and this combination may change the independent influence of the site factor on forest productivity. Various site factors and their combinations increase the randomness of forest productivity evaluation. This study aims to establish a polymorphic site index modeling of larch using a mixed-effects model with site factors and their interactions as random effects, and evaluate the site quality at different site factor levels. Moreover, the research results can provide a theoretical and practical foundation for developing a dominant height growth model and site index equation for larch plantations.
2. Materials and Methods
2.1. Site and Data Description
The study was conducted in northern China, including Shanxi province, Hebei province, Beijing, and the Inner Mongolia Autonomous Region (latitude: 34°54′~53°34′ N, longitude: 97°175′~126°075′ E). The study area covers provinces where L. principis-rupprechtii is grown extensively in plantations. These regions have a temperate monsoon climate, with hot and rainy summers and cold and dry winters. The annual rainfall ranges from 400 to 800 mm and the altitude ranges from 690 to 2383 m. Site conditions are predominantly slightly acidic or neutral on shady, semi-shady, or semi-sunny slopes. Soil types include brown mountain soil, dark brown soil, loess, and cinnamon soil.
We established 394 temporary plots with a plot size of 20 m × 30 m in larch plantations in Hebei, Shanxi, Inner Mongolia, and Beijing. The recorded site characteristics of the plots included elevation, slope, aspect, soil layer thickness, and soil type. The stand indexes included diameter at breast height (DBH) (for trees with a DBH ≥ 5 cm) and height. All plots were plantations with accurate age information. The average value of the tallest 3 to 5 trees in each plot was used as the dominant height of the stand (H). The information on stand and site factors are listed in Table 1.
2.2. Influencing Factors of Stand Dominant Height
Elevation, slope gradient, aspect, soil type, and soil thickness were selected as the variables affecting the growth of larch plantation and were classified into different classes according to the technical regulations for the inventory for forest management planning and design [27]. Attention was provided to ensure that any agents (fertilizer, herbicides, or insecticides) were not applied to the larch plantations according to the technical regulations [28].
The random forest method was used to determine the correlation between the dominant height and the site factors [29]. The importance of the six discretized site factors (see Table 2) was ranked by including and excluding age to evaluate the effect of age on the relationship between dominant height and the site factors.
2.3. Clustering of Site Types and Base Model Selection
Many site types were formed by the combination of different class site factors, therefore, it became very complicated to draw the site index curve of larch with the random effects of the site type, and further reduced the usability of the site index model. Moreover, tree growth differed for different groupings of site types, leading to the necessity of clustering the site types. Here, the K-means method and hierarchical clustering [30,31] were used to classify the site types to enable the practical use of the model for complex site types.
The base model was determined before establishing the mixed-effects site index model. Nine frequently used site index equations were fitted and their performances were compared (Table 3). It should be noted that Richard’s formula did not converge and was not used in the basic model.
2.4. Nonlinear Mixed-Effects Model
The site index model of nonlinear mixed-effects for the larch plantation was established by considering the random effects of the forest site types, which consisted of the site variables and their interaction terms. The model was expressed as follows:
where Hij represents the dominant height of the jth plot in the ith forest site type. f(•) is a unary and differentiable function of the average age of each plot, which is denoted as variable Ageij, with the formal parameter vector φij. Aij and Bij are design matrices of the parameter vectors of the fixed effects β and random effects ui, respectively. and are the variance of the normal distribution of the random effects variable ui and random error , which are assumed to be mutually independent random variables. M is the number of forest site types, and ni is the number of plots in the ith forest site type.
2.5. Predicition with Nonlinear Mixed-Effects Model
The site index model of nonlinear mixed-effects for the larch plantation can be applied for predicting stand dominant height with or without random effects. The model setting the random effects as zero is a mean response (M response) or population-specific response, while the model with the adjusted random effects is a localized response or subject-specific response (S response) [32,33]. In this study, the three-step iterative algorithm for estimating random effects based on the empirical best linear unbiased prediction (EBLUP) theory was used [34,35]. The estimated random effect can be obtained by:
where is a q dimensional vector of random effects for the ith forest site type; is a vector of EBLUP for the random effects ; is the estimation vector of the fixed effect parameters ; , and are the estimated variance-covariance matrix of the random effects and the error term respectively; is a dimensional design matrix of the partial derivatives of the function with respect to the random effects . The other signs are the same as in Formula (1).
The localizing process of the mixed-effects model depending on the selected plot in forest site types is usually known as calibration [36]. To account for verifying the predictive performance of the mixed-effects model, the following three alternatives were applied to select 20% of the plot in each forest site type.
- (i)
- 20 percent of plots whose dominant heights are the highest per forest site type (highest);
- (ii)
- 20 percent of plots whose dominant heights are the lowest per forest site type (lowest);
- (iii)
- 20 percent of plots randomly selected per forest site type (random).
The use of random selection methods meant alternative (iii) was repeated 100 times for the sub-sample of plots in each forest site type used for evaluating the predictive performance of the mixed-effects model. However, alternatives (i) and (ii) were implemented just once in each forest site type due to the non-random selection methods.
2.6. Model Evaluation
The evaluation criterion of the base model was better for higher R2 value and lower mean absolute error (MAE), root mean square error (RMSE), and total relative error (TRE). When these indicators were inconsistent, the optimum model was the base model with the highest R2 value.
where Hi is the ith observed value, is the mean value, is the ith estimated value, and n is the number of samples.
After selecting the optimum base model, all possible combinations of the random effects were fitted. Then, the optimum combination was judged by Akaike’s information criterion (AIC), Bayesian information criterion (BIC), and the log-likelihood (LL) [21,37].
Due to limited data, the validity of the mixed-effects models was evaluated using the leave-one-out cross-validation approach, i.e., one forest site type was left out from the full data set in each step and the remaining forest site types were fitted to the mixed-effects models. Then the obtained models were used to predict values of all plots within the deleted forest site type through three alternatives in the calibration procedure. This was conducted for all the 8 forest site types in the full data set. The predictive performance was evaluated by RMSE and R2. All models were implemented in ForStat software 2.0 [38] and R version 4.1.2 [39].
3. Results
3.1. Importance Ranking of the Site Factors
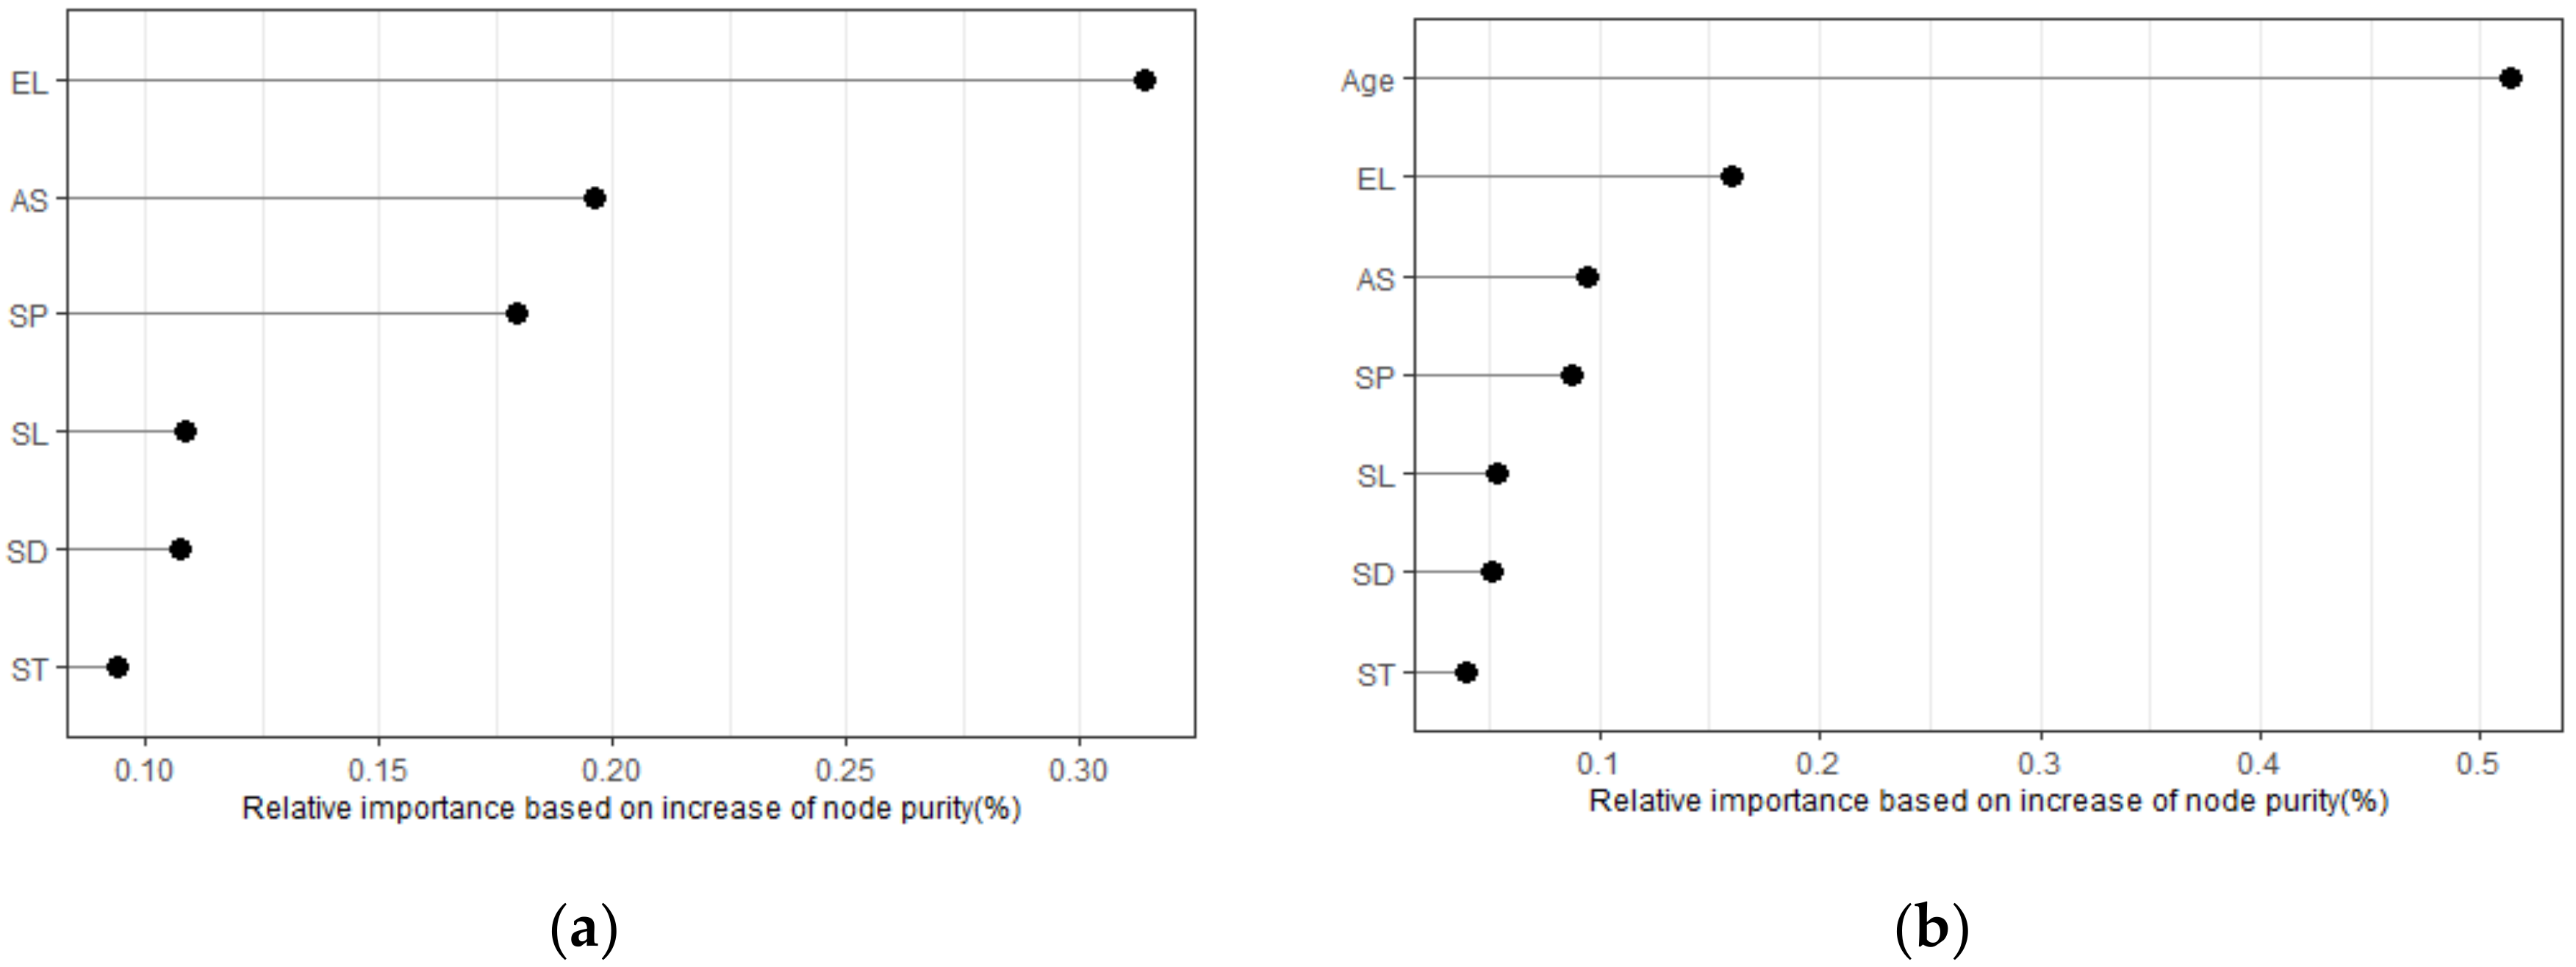
The relative importance based on an increase in node purity is shown in Figure 1. Altitude was the most important site factor influencing stand dominant height, followed by aspect and slope position. The slope, soil depth, and soil type had less influence than the first three variables (Figure 1a). The ranking results of the importance of the site factors were the same with as without the age variable (Figure 1b).
3.2. Base Model Selection and Simulation
According to the evaluation indices of nine basic models (M1–M9), the fitting accuracy was relatively low (Table 4), indicating that the accuracy of the site index model was not high at the regional scale. The R2 of M8 (R2 = 0.5773) was the highest, and the root mean square error (RMSE) and the total relative error (TRE) were the lowest (RMSE = 1.9076 and TRE = 4.1678%), followed by M9, M6, M5, M7, M4, M2, M3, and M1. The parameter estimation of most candidate models was significant (p < 0.05), except for models 5, 6, and 7 (parameter c in M5, b in M6, and c in M7).
3.3. Site Index Models for Different Site Type Combinations
The nonlinear mixed-effects site index model was established by taking the main site factors such as altitude, aspect, slope, soil type, and their interactions as random effects. When the random effects were related to the asymptotic parameter (a), all potential candidate models were convergent and all parameters were significant at a level of 0.05 (Table 5). The mixed-effects site index model in this study can be expressed as follows:
where a, b, and c are the fixed-effects parameters of the model; μi is the random-effects parameter of the site type.
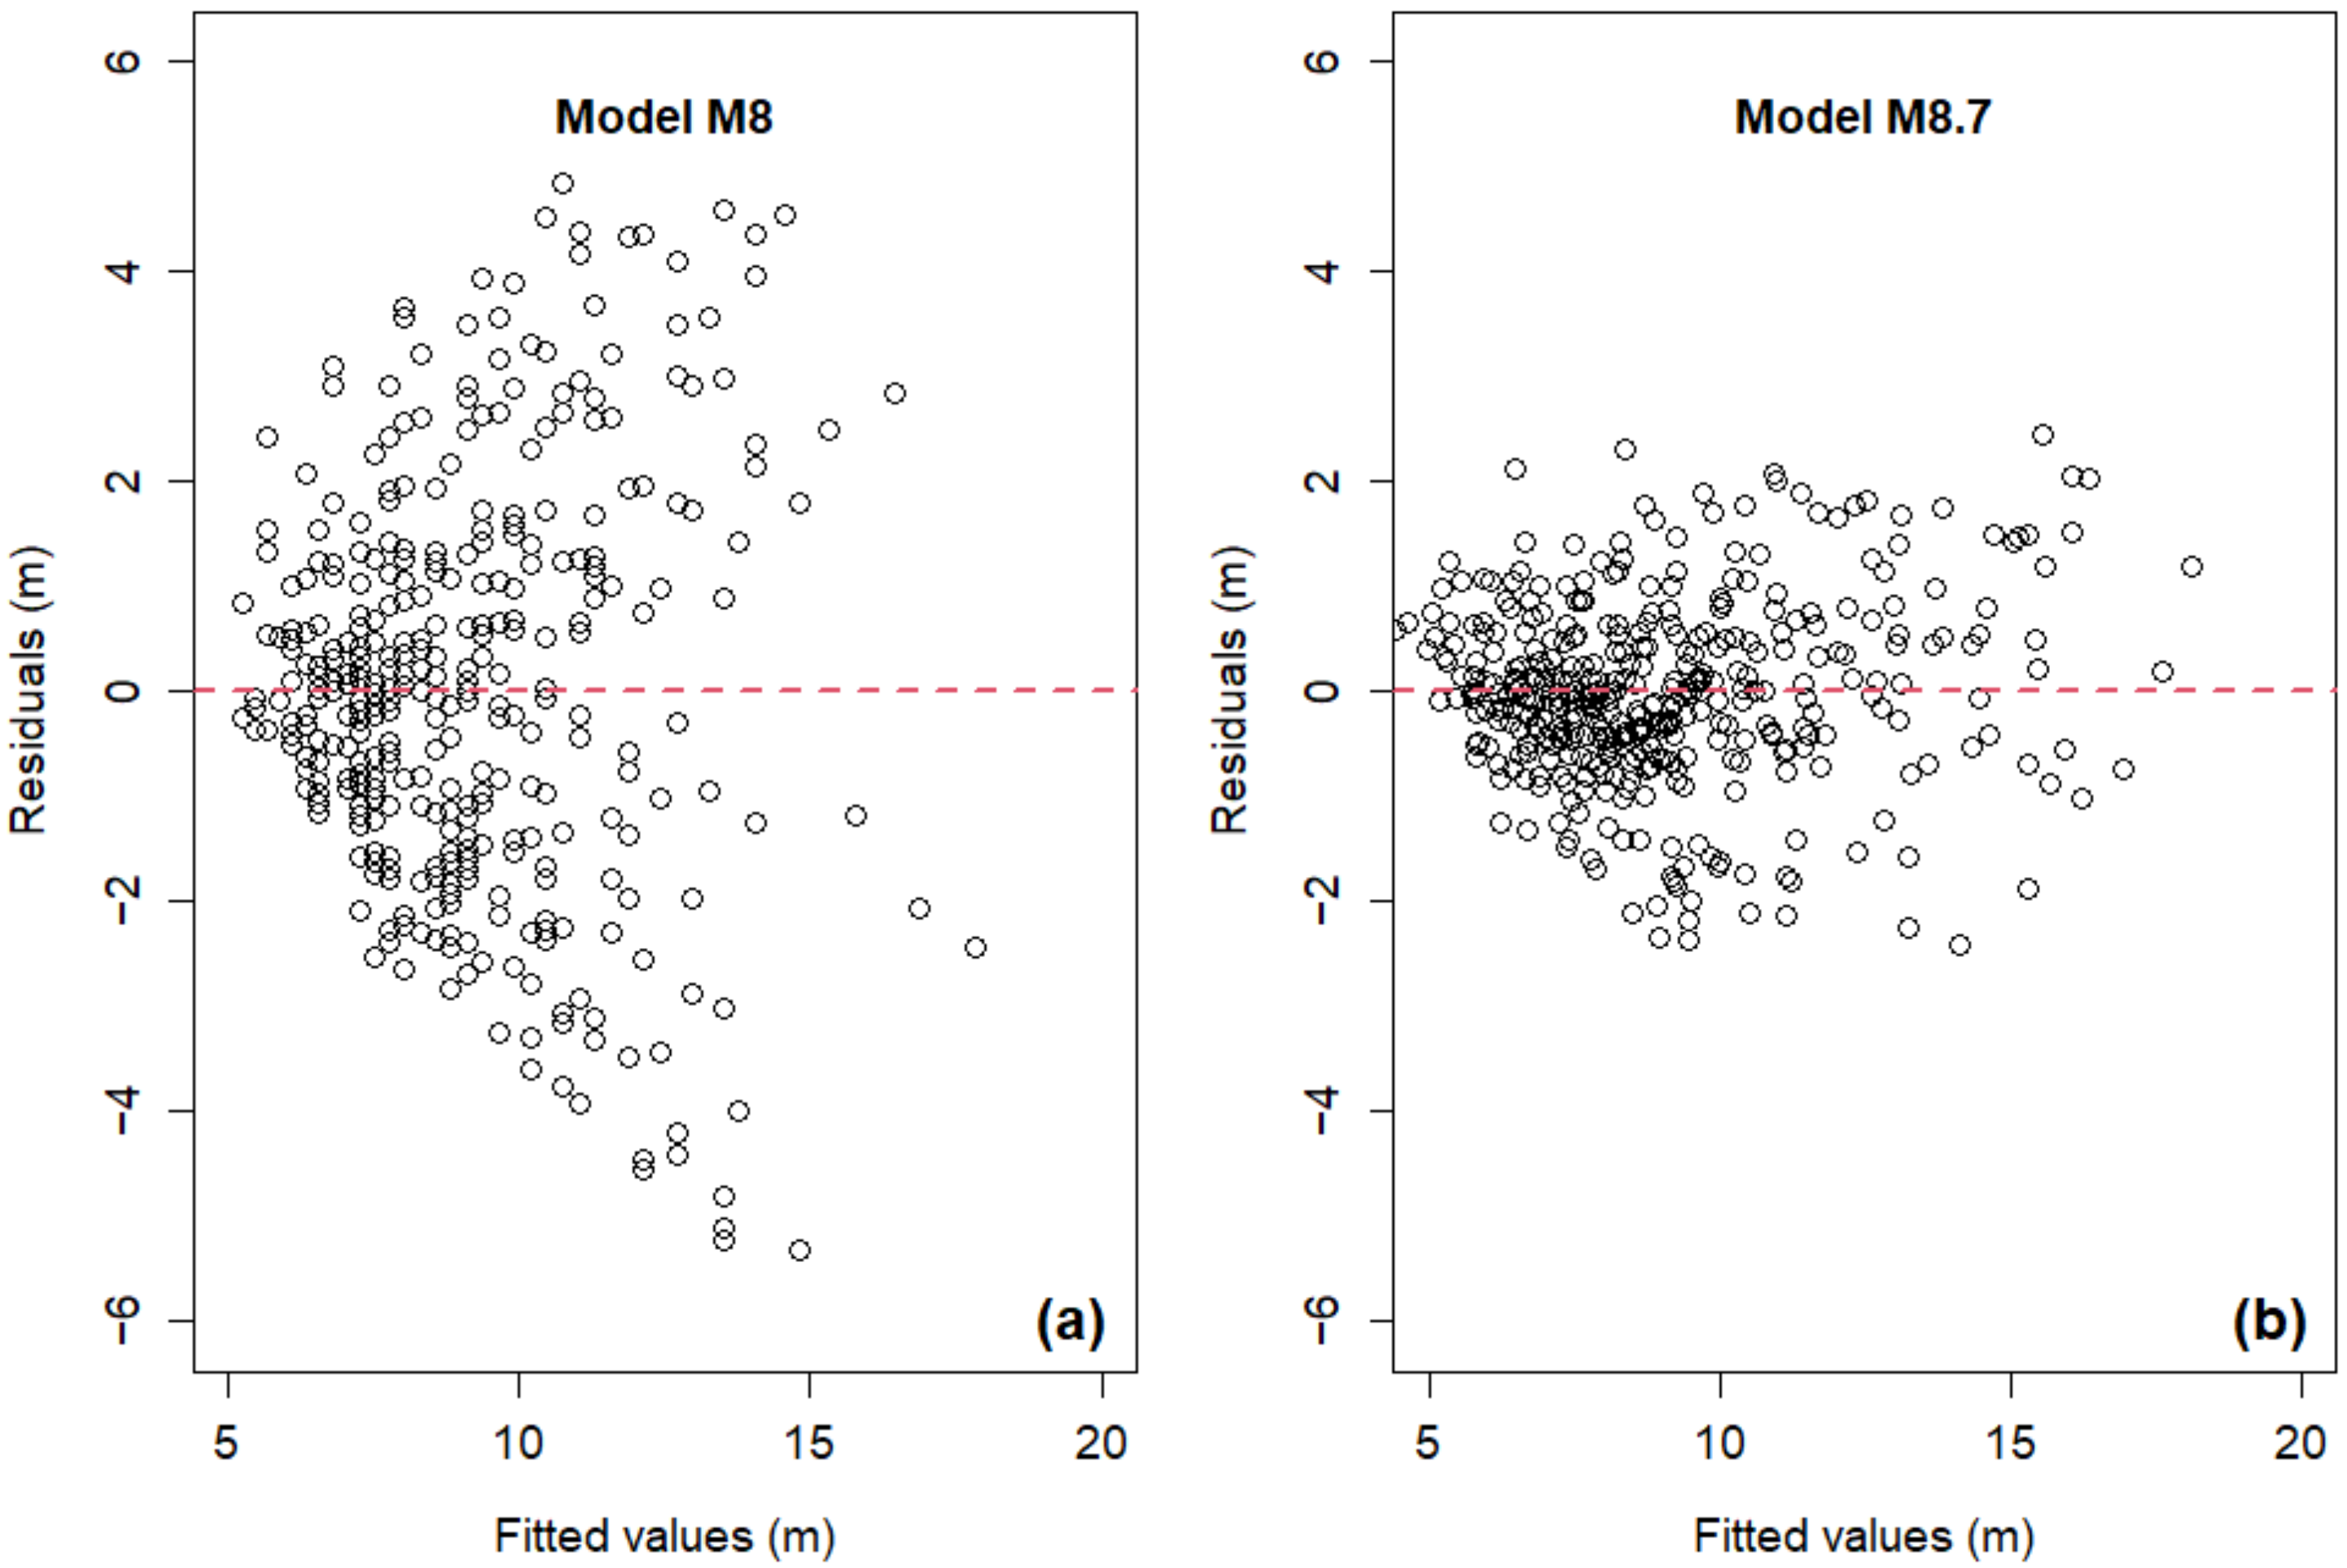
Compared with the basic model (M8), all the models including random effects showed noticeable improvement in the R2 value. Among all the possible interactions, elevation, aspect, and slope position showed the best performance (the AIC and BIC were the lowest, and the log-likelihood and R2 were the highest). Therefore, the mixed-effects site index model with the interaction of the three site factors as random effects (M8.7) was the optimal model. In addition, the mixed-effects model (M8.7) performed better than the base model (M8) regarding the homogeneity of the residual plot (Figure 2).
3.4. Clustering of the Site Types and Model Simulation
According to all combinations of the three main site factors, i.e., elevation, aspect, and slope position, the larch forests in the four provinces were divided into 94 forest site types by model M8.7. For the reason the K-means clustering method is sensitive to the starting point, we chose hierarchical clustering and divided the site types into 3, 5, and 8 groups (Table 6). The clustering results for 3 and 5 site types were the most convenient quantitative unit for site classification. The 8 site types were used to test the precision when increasing the classification levels.
The model performance was noticeably improved by using the mixed effects. The R2 increased from 0.5773 to 0.8683 (Table 5 and Table 7). The R2 of the mixed-effects model for 3 site types (0.8333) was lower than that of the other 2 types with the site factors in the mixed-effects model. The R2 of the model for the 5 site types (0.8616) was close to the value of M8.7 (R2 = 0.8678), and the R2 of the model for the 8 site types (R2 = 0.8683) was the highest and slightly higher than that of M8.7.
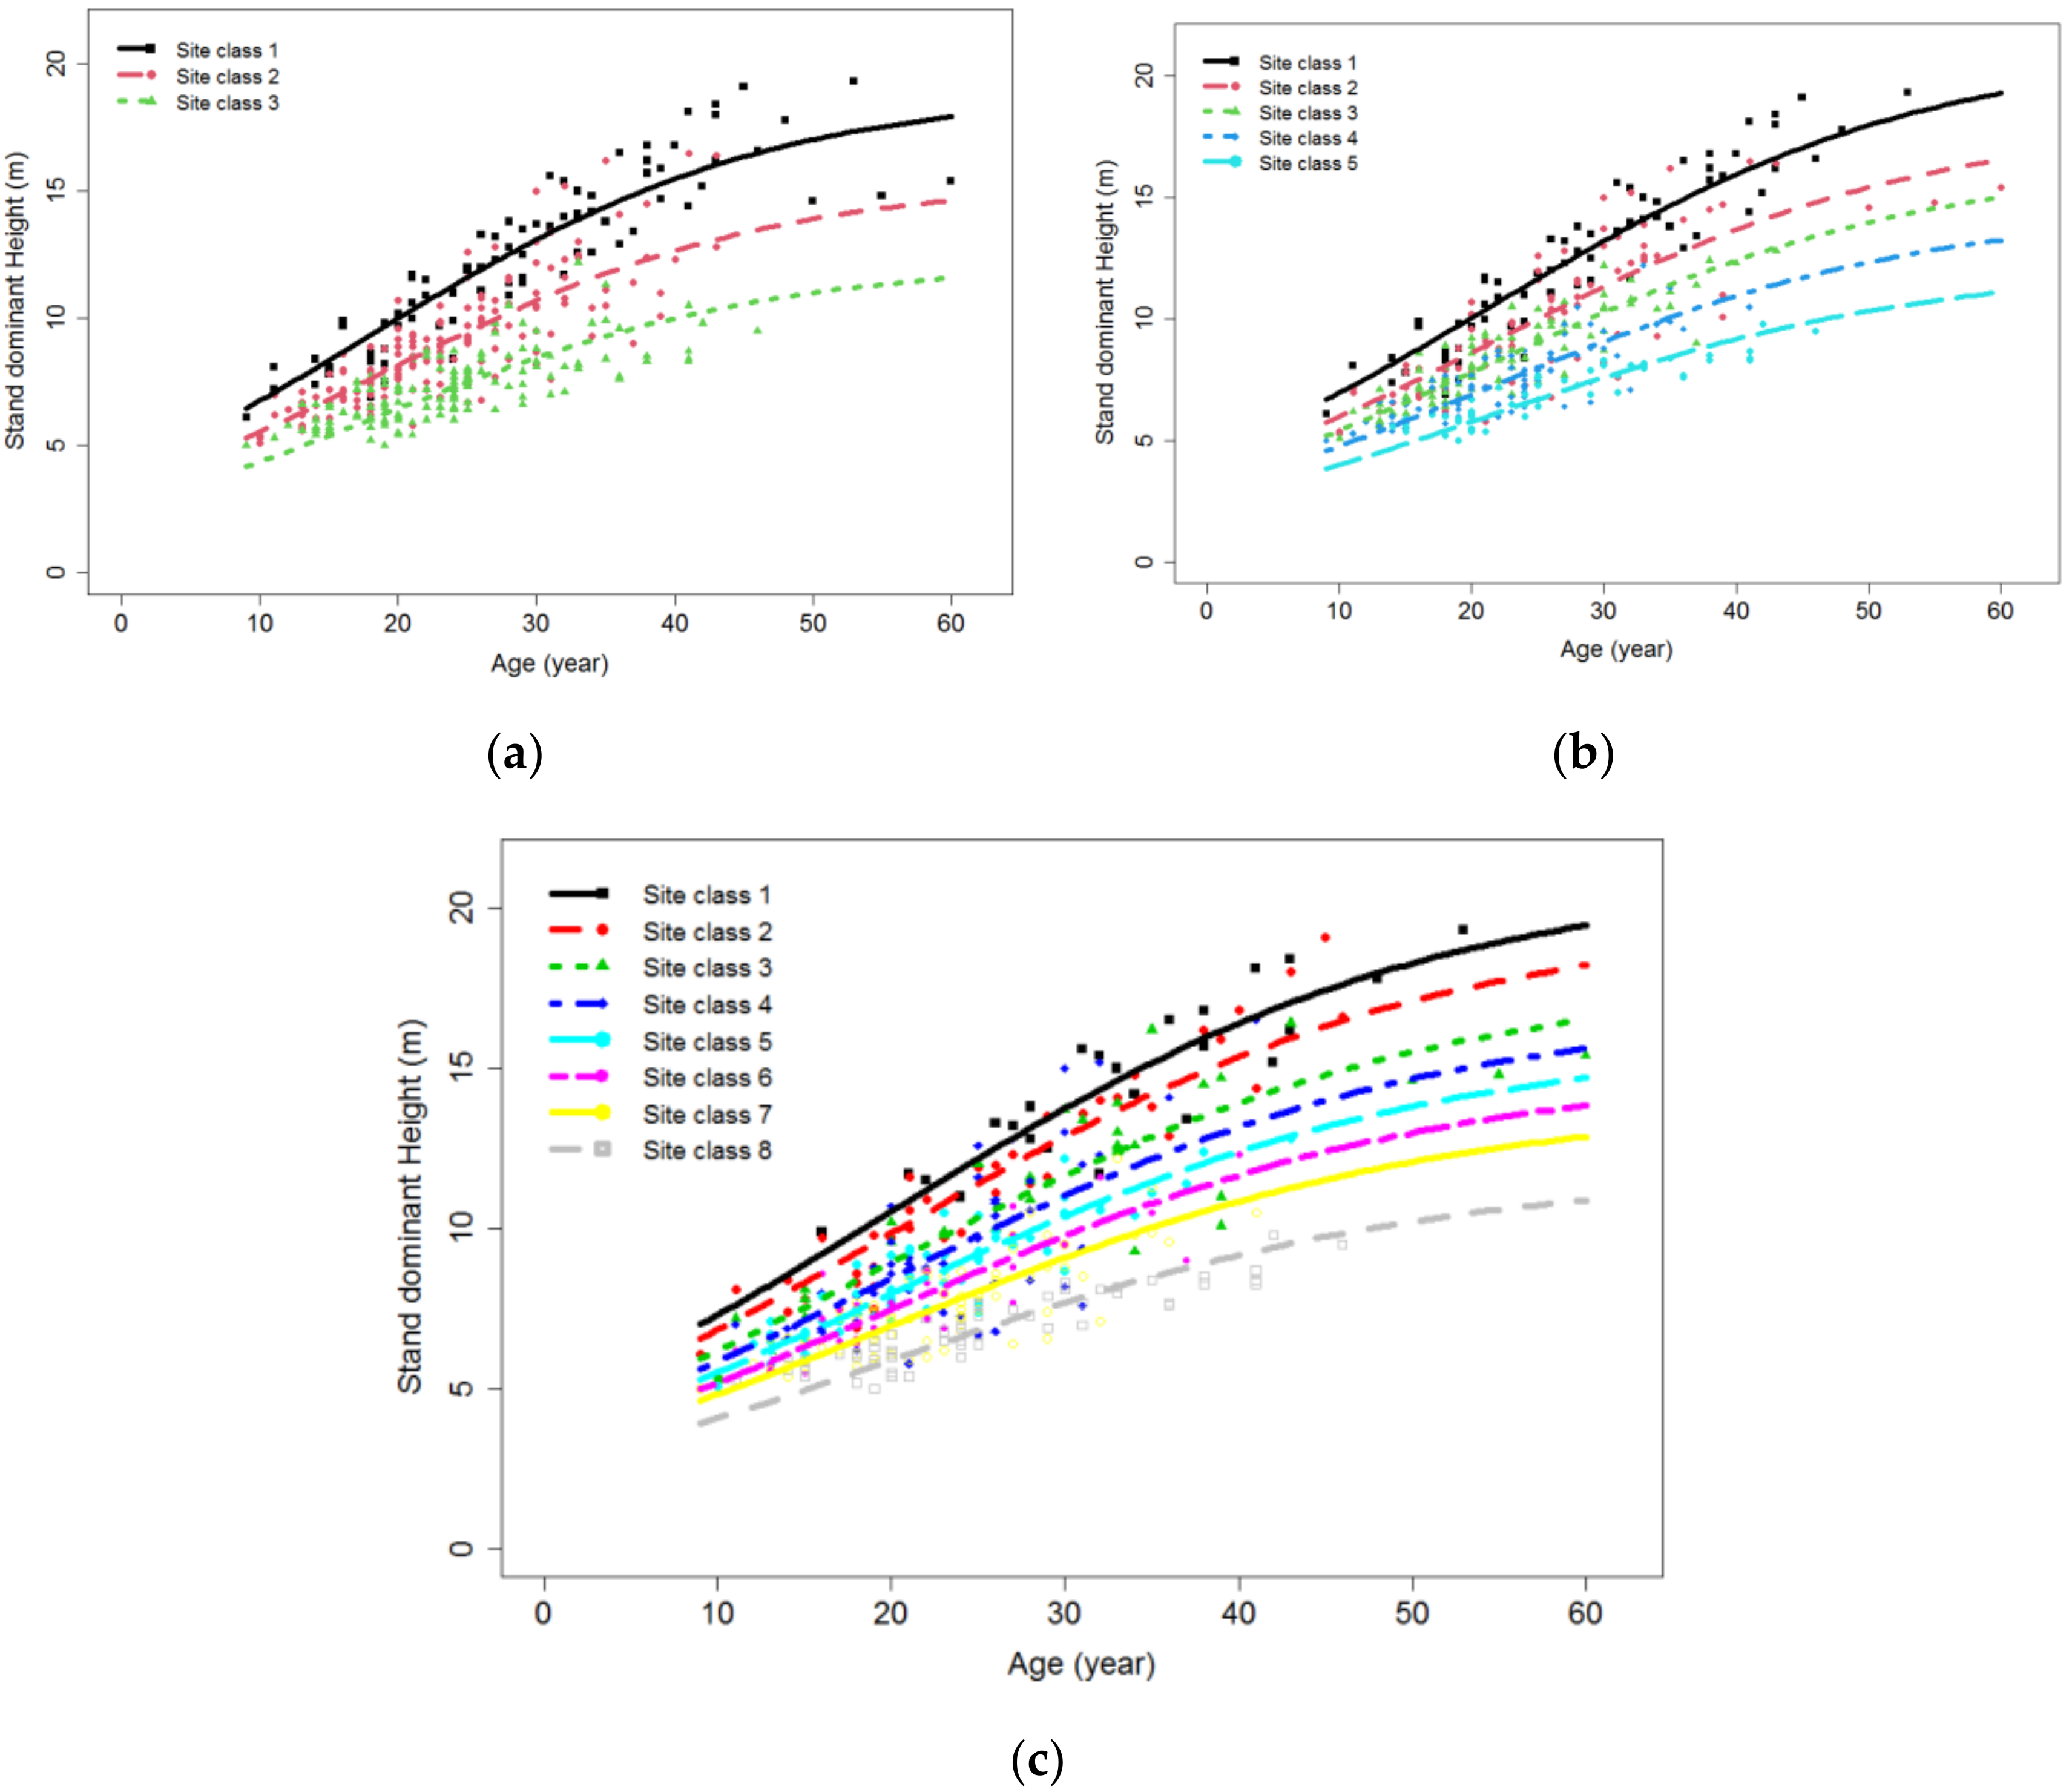
Considering the model’s accuracy and practical application, we created the polymorphic site index curves of L. principis-rupprechtii plantations in northern China (Figure 3). For model 8.7 with 5 groups, the site index value of L. principis-rupprechtii at age 50 were 10.4, 12.4, 13.9, 15.3, and 18.0, respectively.
3.5. Evaluation of the Predictive Performance of Mixed Effects Models
Table 8 presents the predictive results of the three calibrated response patterns based on the leave-one-out cross-validation approach. The value of RMSE and R2 were selected for comparing the mean response (M response) and the subject-specific response (S response) of the mixed-effects model with three combinations of site types.
The predictive performance showed that the S response was always more precise than the M response, and the prediction accuracy was improved as the groups of site types increased through the index RMSE and R2. Among three sub-sampling methods, the alternative of randomly selected plots per forest site type had the best prediction accuracy for all three groups of site types, i.e., model M8.7 with 8 groups produced the smallest RMSE and the highest R2 for the random sampling method. Compared with fitting and predictive performance, the different values of RMSE and R2 among the three mixed-effects models were not evident for the random sampling method, i.e., the proportion of decrement on R2 was 2.11%, 1.76%, and 2.35%, respectively (Table 7 and Table 8). It implied that there was no overfitting problem. However, the prediction accuracy of the M response was considerably lower than the fitting accuracy of model M8. One of the leading factors was that one grouped site type was left out from the full data set in the calibration procedure, and reflected by the model established with the remaining data. Differences in height growth curves among these forest site classes led to the difference between the prediction and fitting accuracy.
4. Discussion
4.1. Dominant Factors of the Site Index
Evaluating site quality and predicting site productivity is a crucial aspect of sustainable forest management. The site index has been recognized globally as an indirect indicator of stand productivity in even-aged pure plantations [40]. In the past few decades, site index prediction based on environmental factors such as climate, topography, and soil has been performed. This research is of great significance for providing a better understanding of the site-growth relationship [18,41].
In this study, we used the random forest method to determine the relative importance of the factors influencing the dominant height. The elevation was the most significant site factor influencing dominant tree height, followed by aspect and slope position (Figure 1). Elevation was also the most influential factor in the geographical distribution of Larix principis-rupprechtii in previous studies [2,24]. The elevation determines the vertical distribution of water and heat, directly influencing the growth of larch, especially in the northwest region with insufficient hydrothermal conditions. The temperature decreases with increasing altitude, and the water conditions in the forest improve. The low temperature was also a major factor affecting the growth of larch [42,43,44]. Numerous studies have shown that among environmental factors related to site conditions, altitude is the dominant factor affecting dominant tree height [41,45,46].
In a mountainous environment, the aspect has a significant impact on factors limiting plant growth, such as light, heat, and water [47,48]. Aspect has a strong influence on temperature due to differences in solar radiation received by areas with different aspects. The slope and the prevailing wind direction also affect temperature [49,50]. The area of landforms with different aspects influences environmental conditions, and this effect is most pronounced in arid and semiarid regions [51,52,53]. Aspect also influences the site index of oriental spruce [54], Norway spruce [46], and Chinese fir [21].
Microtopography affects light, heat, soil moisture, and the spatial distribution of various nutrients, which, in turn, influence plant growth and biomass. The slope position, in particular, affects the seed bank and the spatial distribution, composition, structure, and growth of plants by affecting precipitation and water distribution patterns [55,56,57]. Studies showed that the height and diameter growth of Fraxinus mandshurica tended to increase with the slope position in the northern secondary forest area [58]. The result of a site index study in Douglas-fir plantations in the Massif Central area of France showed that slope position had the largest effect (30.0%) among ecological variables on the site index [18]. Slope position was also the most important variable for predicting the site index of cork oak stands in Portugal and of a subtropical broadleaved forest on Okinawa Island [59].
4.2. Site Index Model
The site index based on the relationship between the stand’s dominant height and age has become an important parameter when assessing site quality in even-aged forests [60,61]. This relationship model has high accuracy and is, therefore, used in practical applications. However, the shape of the curve differs for different tree species due to differences in climate, soil, terrain, and other factors. Therefore, it is not suitable to use the same curve for estimating the growth of different tree species [9,16,40,45,62].
Model selection is particularly important when using environmental factors to predict the site index. The model has limitations for reflecting the temporal and spatial changes in ecological processes, and the environmental factors and site indices often exhibit scale dependence. Scholars often use multiple linear regression methods to investigate the relationship between the site index and environmental factors. However, the relationship does not necessarily satisfy the assumptions of linear regression (linear, normal, independent, and identically distributed), and the data often exhibit heteroscedasticity, making it difficult to interpret. Multicollinearity exists between variables; thus, linear regression may be inappropriate or result in unexplained variance [63].
The nonlinear mixed-effects model has unique advantages in estimating the average effect of the population and individual differences. A site index model with multiple parameters can be established to improve the prediction accuracy. Furthermore, mixed-effects models contain both fixed and random effects and can describe a mean trend and the deviation from the mean trend [64].
Wang et al. [65] used a nonlinear mixed-effects model to predict the mean dominant heights and site indices for different growing conditions of Eucalyptus globulus plantations using annual rainfall and daily maximum temperature. Wang et al. [26] found that the mixed-effects model was more accurate than the traditional method and reduced the prediction error in the study of loblolly pine (Pinus taeda L.). A mixed-effects model was established to determine the site index of different tree species in a mixed forest using inter-species site index conversion equations. The Richards and logistic models were the optimal models for Larix principis-rupprechtii and Betula platyphylla, respectively [22]. In this study, the model performance (R2) increased from 0.5773 to 0.8679 after including the random effects.
4.3. Clustering of the Site Types
Although the nonlinear mixed-effects model provided a high fitting performance by including the environment variables, the site types were too complex (94 site types combination), and the site index model was inconvenient for practical applications. Zhu et al., [21] used K-means clustering to cluster the site types into eight classes and used the grouped site types as random effects to establish a mixed-effects polymorphic site index model. The clustering process improved the model performance, but the eight site types were inconvenient for practical application. We analyzed the relationship between the number of site types and the model accuracy. Although the highest performance was obtained for 8 site types (AIC = 1223.2336, R2 = 0.8683), the result for 5 site types (as random effects) is more practicable (AIC = 1228.1468, R2 = 0.8616). It is easier to group the site types at the regional scale, resulting in convenient planning and design of forest management.
Using a leave-one-out cross-validation approach for evaluating the predictive performance of mixed-effects models with combinations of site types as random effects, the calibration procedure indicated that the sampling method had important effects on the predictive ability, which was also consistent with those of the crown width modeling study by Fu et al. [66] and height-diameter modeling studies by Calama and Montero [36]. The random sampling plots per site type played a greater impact on the predictive ability of the nonlinear mixed-effects models of larch. Due to the complexity of site type combination, the method randomly selected from grouped site types resulted in less biased predictions, compared to that tended to select plots larger or smaller on stand height.
Due to the difficulty and reliability of data acquisition, soil nutrients and climate factors were not selected as environmental variables in the nonlinear mixed-effect model. In the future, it may become easier to investigate the relationship between environmental factors and the site index using big data, digital forestry, intelligent forestry, and other related technologies.
5. Conclusions
The mixed-effects polymorphic site index model of larch in northern China was established by taking the site type as a random effect. The site factors, i.e., elevation, aspect, and slope position, enormously influenced the stand dominant height, and taking the site factors as random effects can noticeably improve the performance of the model. Moreover, hierarchical clustering was used to divide the 94 initial site types into 3, 5, and 8 site-type groups, but the fitting and predictive performance of mixed-effects models with site-type groups were slightly decreased, resulting in more practical planning of forest management. In short, the proposed mixed-effects polymorphic site index model improves regional model accuracy and provides guidance and a robust method for estimating the site productivity of complex site types.
Author Contributions
Conceptualization, X.L. (Xianzhao Liu) and X.L. (Xiangdong Lei); Methodology, X.L. (Xiangdong Lei) and X.Z.; formal analysis, G.D.; resources X.L. (Xiangdong Lei); data curation X.L. (Xianzhao Liu) and G.D.; writing—original draft preparation, G.D.; writing—review and editing, G.D. and X.L. (Xianzhao Liu); visualization, G.D.; supervision, X.L. (Xianzhao Liu) and X.Z. All authors have read and agreed to the published version of the manuscript.
Funding
This research was funded by the Forestry Public Welfare Scientific Research Project (No. 201504303) and the National Key Research and Development Plan of China (No. 2017YFD060040302).
Conflicts of Interest
The authors declare no conflict of interest.
References
- Herrera-fernandez, B.; Campos, J.J.; Kleinn, C. Site productivity estimation using height-diameter relationships in Costa Rican secondary forests. For. Syst. 2004, 13, 295–304. [Google Scholar]
- Liu, X.; Duan, G.; Chhin, S.; Lei, X.; Zhang, X. Evaluation of potential versus realized site productivity of Larix principis-rupprechtii plantations across northern China. For. Ecol. Manag. 2021, 479, 118608. [Google Scholar] [CrossRef]
- Bravo-Oviedo, A.; Tome, M.; Bravo, F.; Montero, G.; Del Rio, M. Dominant height growth equations including site attributes in the generalized algebraic difference approach. Can. J. For. Res. 2008, 38, 2348–2358. [Google Scholar] [CrossRef]
- Westfall, J.A.; Hatfield, M.A.; Sowers, P.A.; O’Connell, B.M. Site index models for tree species in the northeastern United States. For. Sci. 2017, 63, 283–290. [Google Scholar]
- Corona, P. Relationship between environmental factors and site index in douglas-fir plantations in central Italy. For. Ecol. Manag. 1998, 110, 195–207. [Google Scholar] [CrossRef]
- Chen, H.Y.; Krestov, P.V.; Klinka, K. Trembling aspen site index in relation to environmental measures of site quality at two spatial scales. Can. J. For. Res. 2002, 32, 112–119. [Google Scholar] [CrossRef]
- Auten, J. Prediction of site index for yellow poplar from soil and topography. J. For. 1945, 43, 662–668. [Google Scholar]
- Antón-Fernández, C.; Mola-Yudego, B.; Dalsgaard, L.; Astrup, R. Climate-sensitive site index models for Norway. Can. J. For. Res. 2016, 46, 794–803. [Google Scholar] [CrossRef]
- Yue, C.; Kahle, H.P.; Wilpert, K.V.; Kohnle, U. A dynamic environment-sensitive site index model for the prediction of site productivity potential under climate change. Ecol. Model. 2016, 337, 48–62. [Google Scholar] [CrossRef]
- Swenson, J.J.; Waring, R.H.; Fan, W.; Coops, N. Predicting site index with a physiologically based growth model across Oregon, USA. Can. J. For. Res. 2005, 35, 1697–1707. [Google Scholar] [CrossRef] [Green Version]
- Aertsen, W.; Kint, V.; Muys, B.; Orshoven, J. Effects of scale and scaling in predictive modelling of forest site productivity. Environ. Model. Softw. 2012, 31, 19–27. [Google Scholar] [CrossRef] [Green Version]
- Aertsen, W.; Kint, V.; Orshoven, J.V.; Özkan, K.; Muys, B. Comparison and ranking of different modelling techniques for prediction of site index in Mediterranean mountain forests. Ecol. Model. 2010, 221, 1119–1130. [Google Scholar] [CrossRef]
- Pietrzykowski, M.; Socha, J.; Van Doorn, N.S. Scots pine (Pious sylvestris L.) site index in relation to physieo-chemical and biological properties in reclaimed mine soils. New For. 2015, 46, 247–266. [Google Scholar] [CrossRef] [Green Version]
- Kang, Y.; Ozdogan, M.; Zhu, X.; Ye, Z.; Hain, C.; Anderson, M. Comparative assessment of environmental variables and machine learning algorithms for maize yield prediction in the US Midwest. Environ. Res. Lett. 2020, 15, 064005. [Google Scholar] [CrossRef]
- John, K.; Isong, I.A.; Kebonye, N.M.; Ayito, E.O.; Agyeman, P.C.; Afu, S.M. Using Machine Learning Algorithms to Estimate Soil Organic Carbon Variability with Environmental Variables and Soil Nutrient Indicators in an Alluvial Soil. Land 2020, 9, 487. [Google Scholar] [CrossRef]
- Stage, A.R.; Salas, C. Interactions of Elevation, Aspect, and Slope in Models of Forest Species Composition and Productivity. For. Sci. 2007, 53, 486–492. [Google Scholar]
- Zhu, G.; Kang, L.; He, H.; Lv, Y.; Yin, Y.; Wu, Y. Study on polymorphic site index curve model based on height-age classification for Cuninghamia lanceolata plantation. J. Cent. South Univ. For. Sci. Technol. 2017, 7, 18–29. (In Chinese) [Google Scholar]
- Curt, T.; Bouchaud, M.; Agrech, G. Predicting site index of Douglas-fir plantations from ecological variables in the Massif Central area of France. For. Ecol. Manag. 2001, 149, 61–74. [Google Scholar] [CrossRef]
- Jerez-Rico, M.; Moret-Barillas, A.Y.; Carrero-Gamez, O.E.; Macchiavelli, R.E.; Quevedo-Rojas, A.M. Site index curves based on mixed models for teak (Tectona grandis LF) plantations in the Venezuelan plains. Agrociencia 2011, 45, 135–145. [Google Scholar]
- Calegario, N.; Daniels, R.F.; Maestri, R.; Neiva, R. Modeling Dominant Height Growth Based on Nonlinear Mixed-effects Model: A Clonal Eucalyptus Plantation Case Study. For. Ecol. Manag. 2005, 204, 11–21. [Google Scholar] [CrossRef]
- Zhu, G.; Hu, S.; Chhin, S.; Zhang, X.; He, P. Modelling site index of Chinese fir plantations using a random effects model across regional site types in Hunan province, China. For. Ecol. Manag. 2019, 446, 143–150. [Google Scholar] [CrossRef]
- Wang, D.; Hu, X.; Li, D. Creating site index for needle and broadleaved mixed forest using nonlinear mixed effects model. J. Nanjing For. Univ. (Nat. Sci. Ed.) 2020, 44, 159–166. (In Chinese) [Google Scholar]
- Zhang, J.; Meng, D. Spatial pattern analysis of individuals in different age-classes of Larix principis-rupprechtii in Luya mountain reserve, Shanxi, China. Acta Ecol. Sin. 2004, 24, 35–40. (In Chinese) [Google Scholar]
- Liu, X.; Han, W.; Gao, R.; Jia, J.; Bai, J.; Xu, J.; Gao, W. Potential impacts of environmental types on geographical distribution of Larix principis-rupprechtii. Acta Ecol. Sin. 2021, 41, 1885–1893. (In Chinese) [Google Scholar]
- Di, X.; Meng, X.; Wang, M. Range-wide genetic diversity in natural populations of Larix principis-rupprechtii Mayr. J. For. Res. 2020, 32, 319–327. [Google Scholar] [CrossRef]
- Wang, M.; Borders, B.E.; Zhao, D. An empirical comparison of two subject-specific approaches to dominant heights modeling: The dummy variable method and the mixed model method. For. Ecol. Manag. 2008, 255, 2659–2669. [Google Scholar] [CrossRef]
- GB/T 26424-2010; Technical Regulations for Inventory for Forest Management Planning and Design. State Forestry Bureau: Beijing, China, 2010.
- Huang, X.; Ma, C.; Xu, X. Management Technical Procedures for Plantation Forest of Larix Principis-Rupprechtii Mayr; State Forestry Administration (LY/Y 1897–2010): Beijing, China, 2010. [Google Scholar]
- Sabatia, C.O.; Burkhart, H.E. Predicting site index of plantation loblolly pine from biophysical variables. For. Ecol. Manag. 2014, 326, 142–156. [Google Scholar] [CrossRef]
- Hartigan, J.A.; Wong, M.A. A K-Means Clustering Algorithm. J. R. Stat. Soc. Ser. C 1979, 28, 100–108. [Google Scholar]
- Park, B.; Kargupta, H.; Johnson, E.; Sanseverino, E.; Hershberger, D.; Silvestre, L. Distributed, collaborative data analysis from heterogeneous sites using a scalable evolutionary technique. Appl. Intell. 2002, 16, 19–42. [Google Scholar] [CrossRef]
- Fang, Z.; Bailey, R.L. Nonlinear mixed effects modeling for slash pine dominant height growth following intensive silvicultural treatments. For. Sci. 2001, 47, 287–300. [Google Scholar]
- Paulo, J.A.; Tomé, J.; Tomé, M. Nonlinear fixed and random generalized height–diameter models for Portuguese cork oak stands. Ann. For. Sci. 2011, 68, 295–309. [Google Scholar] [CrossRef] [Green Version]
- Lindstrom, M.J.; Bates, D.M. Nonlinear mixed effects models for repeated measures data. Biometrics 1990, 46, 673–687. [Google Scholar] [CrossRef] [PubMed]
- Meng, S.X.; Huang, S. Improved calibration of nonlinear mixed effects models demonstrated on a height growth function. For. Sci. 2009, 55, 238–247. [Google Scholar]
- Calama, R.; Montero, G. Interregional nonlinear height-diameter model with random coefficients for stone pine in Spain. Can. J. For. Res. 2004, 34, 150–163. [Google Scholar] [CrossRef] [Green Version]
- Subedi, N.; Sharma, M. Individual-tree diameter growth models for black spruce and jack pine plantations in northern Ontario. For. Ecol. Manag. 2011, 261, 2140–2148. [Google Scholar] [CrossRef]
- Tang, S.; Lang, K.; Li, H. Statistics and Computation of Biomathematical Models (ForStat Course); Science Press: Beijing, China, 2009. [Google Scholar]
- R Core Team. R: A Language and Environment for Statistical Computing; R Foundation for Statistical Computing: Vienna, Austria, 2021; Available online: https://www.R-project.org/ (accessed on 12 October 2021).
- Bontemps, J.D.; Bouriaud, O. Predictive approaches to forest site productivity: Recent trends, challenges and future perspectives. Forestry 2014, 87, 109–128. [Google Scholar] [CrossRef]
- Farrelly, N.; Ní Dhubháin, Á.; Nieuwenhuis, M. Site index of Sitka spruce (Picea sitchensis) in relation to different measures of site quality in Ireland. Can. J. For. Res. 2011, 41, 265–278. [Google Scholar] [CrossRef]
- Pacheco, C. Evaluating site quality of even-aged maritime pine stands in northern Portugal using direct and indirect methods. For. Ecol. Manag. 1991, 41, 193–204. [Google Scholar]
- Holmgren, P. Topographic and geochemical influence on the forest site quality, with respect to Pinus sylvestris and Picea abies in Sweden. Scand. J. For. Res. 1994, 9, 75–82. [Google Scholar] [CrossRef]
- Lv, Z.; Li, W.; Huang, X.; Zhang, Z. Predicting Suitable Distribution Area of Three Dominant Tree Species under Climate Change Scenarios in Hebei Province. Sci. Silvae Sin. 2019, 55, 13–21. (In Chinese) [Google Scholar]
- Seynave, I.; Gégout, J.C.; Hervé, J.C.; DhTe, J.F.; Drapier, J.; Bruno, É. Picea abies site index prediction by environmental factors and understory vegetation, a two-scale approach based on survey databases. Can. J. For. Res. 2005, 35, 1669–1678. [Google Scholar] [CrossRef]
- Socha, J. Effect of topography and geology on the site index of Picea abies in the West Carpathian, Poland. Scand. J. For. Res. 2008, 23, 203–213. [Google Scholar] [CrossRef]
- Roise, J.P.; Betters, D.R. An aspect transformation with regard to elevation and site productivity models. For. Sci. 1981, 27, 483–486. [Google Scholar]
- Fang, J.; Shen, Z.; Cui, H.T. Ecological characteristics of mountains and research issues of mountain ecology. Biodivers. Sci. 2004, 12, 10–19. [Google Scholar]
- Fekedulegna, D.; Hicks, R.R., Jr.; Colberta, J.J. Influence of topographic aspect, precipitation and drought on radial growth of four major tree species in an Appalachian watershed. For. Ecol. Manag. 2003, 177, 409–425. [Google Scholar] [CrossRef]
- Zhang, B.; Tian, J.; Yao, Y.H. Digital Integration and Patterns of Mountain Altitudinal Belts; Environment Science Press: Beijing, China, 2009; pp. 218–224. [Google Scholar]
- Stage, A.R. An expression for the effect of aspect, slope, and habitat type on tree growth. For. Sci. 1976, 22, 457–460. [Google Scholar]
- Li, C.; Li, C.W. The significance of aspect in mountain geography. Acta Geogr. Sin. 1985, 40, 20–28. [Google Scholar]
- Verbyla, D.L.; Fisher, R.F. Effect of aspect on ponderosa height and diameter growth. For. Ecol. Manag. 1989, 27, 93–98. [Google Scholar] [CrossRef]
- Ercanli, I.; Gunlu, A.; Altun, L.; Baskent, E.Z. Relationship between site indexes of oriental spruce [Picea orientalis (L.) Link] and ecological variables in Maçka, Turkey. Scand. J. For. Res. 2008, 23, 319–329. [Google Scholar] [CrossRef]
- Ashton, P.M.S.; Harris, P.G.; Thadani, R. Soil seed bank dynamics in relation to topographic position of a mixed-deciduous forest in southern New England, USA. For. Ecol. Manag. 1998, 111, 15–22. [Google Scholar] [CrossRef]
- Tian, X.; Gao, K.; Zhang, L.J.; Yu, Y.Q.; Han, G.D. Effect of slope position on spatial distribution of soil water and vegetation in sandy land. Bull. Soil Water Conserv. 2015, 35, 12–16. [Google Scholar]
- Wen, Y.; Hu, J.; Yang, X.; Liu, W.; Zhong, L.; Zhu, C.; Ma, J.H. Study of slop position effect on the tree structure characteristic of mixed pobulus dacidiana and Betula platyphylla plantation. J. Agric. Univ. Hebei 2017, 40, 32–38. [Google Scholar]
- Wang, X.; Sun, H.; Yu, X.; Gu, C.C. Influence of aspect and position of slope on the growth of Mid-age fraxinus mandshurica plantation. J. Shanxi Agric. Univ. (Nat. Sci. Ed.) 2011, 31, 30–34. [Google Scholar]
- Paulo, J.A.; Palma, J.N.; Gomes, A.A.; Faias, S.P.; Tome, J.; Tome, M. Predicting site index from climate and soil variables for cork oak (Quercus suber L.) stands in Portugal. New For. 2015, 46, 293–307. [Google Scholar] [CrossRef] [Green Version]
- Skovsgaard, J.P.; Vanclay, J.K. Forest site productivity: A review of the evolution of dendrometric concepts for even-aged stands. Forestry 2008, 81, 13–31. [Google Scholar] [CrossRef] [Green Version]
- Fang, Z.; Bailey, R.L.; Shiver, B.D. A multivariate simultaneous prediction system for stand growth and yield with fixed and random effects. For. Sci. 2001, 47, 550–562. [Google Scholar]
- Brandl, S.; Mette, T.; Falk, W.; Vallet, P.; Rotzer, T.; Pretzsch, H. Static site indices from different national forest inventories: Harmonization and prediction from site conditions. Ann. For. Sci. 2018, 75, 56. [Google Scholar] [CrossRef] [Green Version]
- Guisan, A.; Edwards, T.C. Generalized linear and generalized additive models in studies of species distributions: Setting the scene. Ecol. Model. 2002, 157, 89–100. [Google Scholar] [CrossRef] [Green Version]
- Yang, Y.; Huang, S. Comparison of different methods for fitting nonlinear mixed forest models and for making predictions. Can. J. For. Res. 2011, 41, 1671–1686. [Google Scholar] [CrossRef]
- Wang, Y.; LeMay, V.M.; Baker, T.G. Modelling and prediction of dominant height and site index of Eucalyptus globulus plantations using a nonlinear mixed-effects model approach. Can. J. For. Res. 2007, 37, 1390–1403. [Google Scholar] [CrossRef]
- Fu, L.; Sharma, R.P.; Hao, K.; Tang, S. A generalized interregional nonlinear mixed-effects crown width model for Prince Rupprecht larch in northern China. For. Ecol. Manag. 2017, 389, 364–373. [Google Scholar] [CrossRef]
Figure 1.
The relative importance of the influence of the site indices and age on stand dominant height ((a) represents variables without age; (b) represents variables with age).
Figure 1.
The relative importance of the influence of the site indices and age on stand dominant height ((a) represents variables without age; (b) represents variables with age).

Figure 2.
The residual diagram of the optimum site index base model (M8) and its corresponding mixed-effects model (M8.7) ((a) represents M8; (b) represents M8.7).
Figure 2.
The residual diagram of the optimum site index base model (M8) and its corresponding mixed-effects model (M8.7) ((a) represents M8; (b) represents M8.7).

Figure 3.
Polymorphic site index curves of larch using the mixed-effect model for different site types groups. ((a) represents M 8.7 with 3 groups; (b) represents M 8.7 with 5 groups; (c) represents M 8.7 with 8 groups).
Figure 3.
Polymorphic site index curves of larch using the mixed-effect model for different site types groups. ((a) represents M 8.7 with 3 groups; (b) represents M 8.7 with 5 groups; (c) represents M 8.7 with 8 groups).


Table 1.
The information on stand and site factors for the 394 plots.
| Province | Number of Plot | Index | DBH (cm) | H (m) | Age (Years) | Stand Basal Area (m2/ha) | Stand Density (n/ha) | Elevation (m) | Slope (˚) | Soil Depth (cm) |
|---|---|---|---|---|---|---|---|---|---|---|
| Total | 394 | Mean | 11.2 | 9.1 | 24.7 | 10.5 | 1009.7 | 1467.5 | 15.4 | 52.2 |
| STD | 3.9 | 2.9 | 8.5 | 8.0 | 598.0 | 395.2 | 8.6 | 13.4 | ||
| Min | 5.5 | 5.0 | 9.0 | 0.3 | 90.0 | 690.0 | 0.0 | 20.0 | ||
| Max | 24.2 | 19.3 | 60.0 | 38.5 | 2970.0 | 2383.0 | 39.0 | 100.0 | ||
| Beijing | 30 | Mean | 12.9 | 10.7 | 29.2 | 11.1 | 703.0 | 1075.0 | 18.0 | 40.4 |
| STD | 3.7 | 3.8 | 9.9 | 11.4 | 453.7 | 334.8 | 7.5 | 12.7 | ||
| Min | 7.5 | 6.0 | 13.0 | 0.9 | 150.0 | 740.0 | 8.0 | 20.0 | ||
| Max | 21.5 | 19.3 | 53.0 | 37.6 | 1710.0 | 1890.0 | 30.0 | 61.0 | ||
| Hebei | 225 | Mean | 11.2 | 8.9 | 24.3 | 10.3 | 1005.0 | 1350.0 | 13.9 | 50.4 |
| STD | 4.1 | 2.9 | 8.1 | 7.6 | 580.1 | 312.6 | 8.9 | 15.7 | ||
| Min | 5.5 | 5.0 | 9.0 | 0.3 | 90.0 | 690.0 | 0.0 | 20.0 | ||
| Max | 24.2 | 18.4 | 46.0 | 32.2 | 2970.0 | 2120.0 | 35.0 | 100.0 | ||
| Inner Mongolia | 44 | Mean | 11.5 | 9.0 | 24.0 | 9.2 | 811.4 | 1398.0 | 10.8 | 58.0 |
| STD | 4.4 | 3.3 | 7.8 | 7.0 | 572.0 | 326.5 | 5.7 | 8.3 | ||
| Min | 5.6 | 5.0 | 10.0 | 0.3 | 120.0 | 970.0 | 3.0 | 30.0 | ||
| Max | 23.7 | 18.0 | 43.0 | 25.5 | 1980.0 | 1890.0 | 25.0 | 65.0 | ||
| Shanxi | 95 | Mean | 10.7 | 8.9 | 24.6 | 11.5 | 1209.5 | 1901.9 | 20.4 | 57.3 |
| STD | 2.8 | 2.3 | 8.9 | 8.0 | 625.4 | 248.0 | 6.8 | 19.3 | ||
| Min | 5.9 | 5.4 | 10.0 | 1.6 | 315.0 | 1480.0 | 2.0 | 20.0 | ||
| Max | 19.4 | 15.4 | 60.0 | 38.5 | 2940.0 | 2383.0 | 39.0 | 100.0 |
H: stand dominant height, STD: standard deviation, Min: minimum, and Max: maximum.
Table 2.
Information on site factors and their different classes.
| Site Factors | Class | |||||
|---|---|---|---|---|---|---|
| EL | 9 classes by 200 m | |||||
| SL | <5° | 5°–14° | 15°–24° | 25°–34° | ≥35° | |
| AS | sunny slope | semi-sunny slope | shady slope | semi-shady slope | ||
| SP | ridge | upper slope | middle slope | lower slope | valley | flat |
| ST | red earth | yellow earth | yellow-brown earth | |||
| SD | <40 cm | 40–79 cm | ≥80 cm | |||
Note: EL: elevation, SL: slope, AS: aspect, SP: slope position, ST: soil type, and SD: soil depth.
Table 3.
Information on site index base models.
| Model | Equation Form | Expression |
|---|---|---|
| M1 | Hyperbolic model | |
| M2 | Logarithm model | |
| M3 | Schumacher model | |
| M4 | Mitscherlich model | |
| M5 | Parabola model | |
| M6 | Hybrid model | |
| M7 | Roляcp model | |
| M8 | Logistic model | |
| M9 | Gompertz model |
Table 4.
Information on parameter estimates and model evaluation of 9 alternative base models.
| Model | a | SE | b | SE | c | SE | MAE | RMSE | R² | TRE |
|---|---|---|---|---|---|---|---|---|---|---|
| M1 | 14.5604 * | 0.3315 | 120.6185 * | 6.8689 | 0.0000 | 2.1950 | 0.4403 | 5.5940 | ||
| M2 | −10.6986 * | 0.9405 | 6.2788 * | 0.2969 | 0.0000 | 2.0052 | 0.5329 | 4.6258 | ||
| M3 | 19.2622 * | 0.6963 | 17.4203 * | 0.8932 | 0.0336 | 2.0398 | 0.5166 | 4.7943 | ||
| M4 | 23.7941 * | 2.575 | 0.0199 * | 0.00289 | 0.0358 | 1.9474 | 0.5594 | 4.3514 | ||
| M5 | 2.9270 * | 0.7223 | 0.2357 * | 0.0535 | 0.0005 | 0.0009 | 0.0000 | 1.9149 | 0.5740 | 4.2012 |
| M6 | 2.5575 * | 0.3204 | 0.1498 | 0.1405 | 1.2003 * | 0.3868 | 0.0002 | 1.9144 | 0.5743 | 4.1987 |
| M7 | 1.5986 * | 0.5343 | 0.4704 * | 0.1432 | −0.0092 | 0.0050 | 0.0011 | 1.9191 | 0.5721 | 4.2205 |
| M8 | 22.2896 * | 3.5595 | 5.1001 * | 0.6161 | 0.0503 * | 0.0074 | 0.0021 | 1.9076 | 0.5773 | 4.1678 |
| M9 | 31.3098 * | 10.3487 | 2.2316 * | 0.2275 | 0.0237 * | 0.0071 | 0.0015 | 1.9109 | 0.5758 | 4.1828 |
Note: * means that the parameter is significant at the level of 0.05 (otherwise not).
Table 5.
Parameter estimates and model evaluation of the mixed-effects model with different combined site effects.
Table 5.
Parameter estimates and model evaluation of the mixed-effects model with different combined site effects.
| Model | Random Effect | RP | Levels | a | b | c | AIC | BIC | Log-Likelihood | R² |
|---|---|---|---|---|---|---|---|---|---|---|
| M8 | None | 22.2896 | 5.1001 | 0.0503 | 1635.0423 | 1650.9477 | −813.5212 | 0.5773 | ||
| M8.1 | EL | a | 9 | 19.6303 | 4.3670 | 0.0521 | 1585.2894 | 1605.1712 | −787.6447 | 0.6542 |
| M8.2 | AS | a | 9 | 21.6037 | 4.8867 | 0.0514 | 1628.4907 | 1648.3725 | −809.2454 | 0.6005 |
| M8.3 | SL | a | 6 | 20.1798 | 4.3664 | 0.0516 | 1617.8581 | 1637.7399 | −803.9291 | 0.6132 |
| M8.4 | EL × AS | a | 56 | 15.8473 | 3.8550 | 0.0676 | 1554.6373 | 1574.5191 | −772.3187 | 0.7517 |
| M8.5 | EL × SL | a | 33 | 15.9739 | 3.8222 | 0.0652 | 1538.0907 | 1557.9725 | −764.0454 | 0.7356 |
| M8.6 | SL × AS | a | 31 | 17.4115 | 4.2344 | 0.0609 | 1607.7826 | 1627.6644 | −798.8913 | 0.6520 |
| M8.7 | EL × AS × SL | a | 94 | 14.1784 | 3.6668 | 0.0760 | 1438.9924 | 1458.8742 | −714.4962 | 0.8678 |
Note: RP: random-effects parameters, LL: log-likelihood.
Table 6.
Classification of site type combinations.
| Groups | Site Type Group | Sample Size (# of Plots) | Number of Site Types |
|---|---|---|---|
| 3 | STG1 | 79 | 17 |
| STG2 | 181 | 42 | |
| STG3 | 134 | 35 | |
| 5 | STG1 | 65 | 13 |
| STG2 | 85 | 17 | |
| STG3 | 108 | 28 | |
| STG4 | 86 | 21 | |
| STG5 | 50 | 15 | |
| 8 | STG1 | 33 | 6 |
| STG2 | 46 | 11 | |
| STG3 | 74 | 14 | |
| STG4 | 76 | 20 | |
| STG5 | 42 | 11 | |
| STG6 | 65 | 15 | |
| STG7 | 30 | 10 | |
| STG8 | 28 | 7 |
Table 7.
Model evaluation statistics of three models.
| Random Effect | a | b | c | AIC | BIC | Log-Likelihood | R² |
|---|---|---|---|---|---|---|---|
| M8.7-with 3 groups | 15.5084 | 3.5906 | 0.0698 | 1290.0387 | 1309.9212 | −640.0194 | 0.8333 |
| M8.7-with 5 groups | 16.4753 | 3.7311 | 0.0610 | 1228.1468 | 1248.0288 | −609.0737 | 0.8616 |
| M8.7-with 8 groups | 15.3467 | 3.4925 | 0.0649 | 1223.2336 | 1243.1153 | −606.6168 | 0.8683 |
Table 8.
Evaluation of predictive performances of the mixed-effects model with three combinations of the site types based on the leave-one-out cross-validation approach. Sub-sampling methods are defined in Section 2.5.
Table 8.
Evaluation of predictive performances of the mixed-effects model with three combinations of the site types based on the leave-one-out cross-validation approach. Sub-sampling methods are defined in Section 2.5.
| Prediction | Sub-Sampling Methods | M8.7-with 3 Groups | M8.7-with 5 Groups | M8.7-with 8 Groups | |||
|---|---|---|---|---|---|---|---|
| RMSE | R² | RMSE | R² | RMSE | R² | ||
| M response | none | 2.6148 | 0.2057 | 2.3180 | 0.3758 | 2.1774 | 0.4492 |
| S response | Highest | 1.4755 | 0.7471 | 1.2830 | 0.8088 | 1.3417 | 0.7909 |
| Lowest | 1.6341 | 0.6898 | 1.5681 | 0.7143 | 1.3969 | 0.7733 | |
| Random | 1.2597 | 0.8157 | 1.1498 | 0.8464 | 1.1444 | 0.8479 | |
Publisher’s Note: MDPI stays neutral with regard to jurisdictional claims in published maps and institutional affiliations. |
© 2022 by the authors. Licensee MDPI, Basel, Switzerland. This article is an open access article distributed under the terms and conditions of the Creative Commons Attribution (CC BY) license (https://creativecommons.org/licenses/by/4.0/).
Share and Cite
MDPI and ACS Style
Duan, G.; Lei, X.; Zhang, X.; Liu, X. Site Index Modeling of Larch Using a Mixed-Effects Model across Regional Site Types in Northern China. Forests 2022, 13, 815. https://0-doi-org.brum.beds.ac.uk/10.3390/f13050815
AMA Style
Duan G, Lei X, Zhang X, Liu X. Site Index Modeling of Larch Using a Mixed-Effects Model across Regional Site Types in Northern China. Forests. 2022; 13(5):815. https://0-doi-org.brum.beds.ac.uk/10.3390/f13050815
Chicago/Turabian StyleDuan, Guangshuang, Xiangdong Lei, Xiongqing Zhang, and Xianzhao Liu. 2022. "Site Index Modeling of Larch Using a Mixed-Effects Model across Regional Site Types in Northern China" Forests 13, no. 5: 815. https://0-doi-org.brum.beds.ac.uk/10.3390/f13050815
Note that from the first issue of 2016, this journal uses article numbers instead of page numbers. See further details here.