Article

Protein Markers for the Identification of Cork Oak Plants Infected with Phytophthora cinnamomi by Applying an (α, β)-k-Feature Set Approach

by
Ana Cristina Coelho
1,2,* and
Gabriela Schütz
2,3
1
Escola Superior de Educação e Comunicação, Universidade do Algarve, 8005-139 Faro, Portugal
2
Center for Electronic, Optoelectronic and Telecommunications (CEOT), Universidade do Algarve, 8005-139 Faro, Portugal
3
Instituto Superior de Engenharia, Universidade do Algarve, 8005-139 Faro, Portugal
*
Author to whom correspondence should be addressed.
Submission received: 16 May 2022 / Revised: 12 June 2022 / Accepted: 13 June 2022 / Published: 15 June 2022
(This article belongs to the Special Issue Fungal–Plant Interactions: Latest Advances and Prospects)

Abstract

:
Cork oak decline in Mediterranean forests is a complex phenomenon, observed with remarkable frequency in the southern part of the Iberian Peninsula, causing the weakening and death of these woody plants. The defoliation of the canopy, the presence of dry peripheral branches, and exudations on the trunk are visible symptoms used for the prognosis of decline, complemented by the presence of Phytophthora cinnamomi identified in the rhizosphere of the trees and adjacent soils. Recently, a large proteomic dataset obtained from the leaves of cork oak plants inoculated and non-inoculated with P. cinnamomi has become available. We explored it to search for an optimal set of proteins, markers of the biological pattern of interaction with the oomycete. Thus, using published data from the cork oak leaf proteome, we mathematically modelled the problem as an α, β-k-Feature Set Problem to select molecular markers. A set of proteins (features) that represent dominant effects on the host metabolism resulting from pathogen action on roots was found. These results contribute to an early diagnosis of biochemical changes occurring in cork oak associated with P. cinnamomi infection. We hypothesize that these markers may be decisive in identifying trees that go into decline due to interactions with the pathogen, assisting the management of cork oak forest ecosystems.

1. Introduction

Cork oak decline in Mediterranean forests is a complex phenomenon, observed with remarkable frequency in the southern part of the Iberian Peninsula, causing the weakening and death of these woody plants [1,2,3,4]. Mediterranean oak forest dynamics mirror the impact of anthropogenic factors and environmental variables over time, with the expectation of a more pronounced decline in the long term [5,6,7]. Canopy defoliation, dry peripheral branches, black spots, and exudations on the trunk are visually observable symptoms used for decline prognostics, sometimes complemented by the identification of Phytophthora cinnamomi in the rhizosphere of trees and the adjacent soils [8,9]. This oomycete invades the roots of the cork oak leading to cell death of the infected tissues, triggering a localized and distal defence response [10,11,12]. In the aerial part of the plant, the evidence of the plant’s interaction with the parasite depends on the extent and degree of the necrotized roots [10]. With global warming, cork oaks are exposed to extreme climate variations that do not favour resilience to biotic stresses such as the interaction with P. cinnamomi [13]. The resilience patterns observed in natural populations are diversified [14], in accordance with the genetic variability typical of this long-lived plant, which constitutes an asset in a long-term process of adaptation [15,16]. Based on the sixth National Forest Inventory data, only 5% of the cork oak stands in Portugal do not show any damage such as defoliation and/or discoloration of the canopy [17]. According to these data, trees are moving away from an optimal vegetative state and the early physiological/biochemical assessment may be decisive in order to understand the tree’s level of resilience to overcome adversity and to recover. Recently, a large proteomics dataset obtained from the leaves of cork oak plants inoculated and not inoculated with P. cinnamomi was made available [12] and can be explored in order to search for an optimal set of proteins, markers of the biological decline pattern. This work has yet to be done.
Statistical methods are commonly used to reduce dimensions and classify data, e.g., principal component analysis (PCA) and exploratory factor analysis (EFA). They are applied to extract features and knowledge from data but require high-dimension data or correlation and distribution conditions.
Combinatorial optimization approaches generally resort to model the research question as a covering problem, either based on features or in patterns, and have been widely applied to solve real world problems in physical and biological sciences such as molecular biology and biochemistry, as well as in engineering and computer sciences [18]. Among the cover problems, we highlight the (α, β)-k-Feature Set Problem (α, β-k-FSP), which can be reduced to the Red-Blue Bipartite Dominating Set problem and is a generalization of the k-Feature Set Problem (FSP). It is also used to extract features and knowledge from data as well as to reduce dimensions and classify data, having been mostly applied in medical sciences helping with the explanation and diagnosis of disease. For example, it was applied to some cancer types [19,20,21,22], Alzheimer’s disease [23,24,25], and epilepsy [26]. As far as we know, this is the first time that it is applied to plant biology, namely to the cork oak–P. cinnamomi interaction. The k-FSP attempts to reduce a given data set by selecting a relevant subset of k-features (minimizing k) that contributes to a better explanation and understanding of the whole data, eliminating unrelated, redundant, or conflicting features. The (α, β)-k-Feature Set Problem (α, β-k-FSP), proposed by Cotta et al. [27], aims to determine the minimum subset of features that enlightens the dichotomy within the samples while reducing the data size. It intends to minimize the number of features (k) and simultaneously to maximize the differences between samples of different groups (α) and the similarities between samples of the same group (β). The selected feature set is as reliable as the greater α and β, although a larger feature set will be obtained. The α, β-k-FSP is NP-hard, since it is a generalisation of a problem that is NP-complete, α = 1 and β = 0 k-FSP. The latter can be reduced to the k-Vertex Cover Problem [28], known to be NP-complete [29]. Therefore, there is no known algorithm to solve exactly the α, β-k-FSP in polynomial time, meaning that it is not probable that there is an algorithm able to find the optimum solution for any instance of the problem in a computational time proportional to a polynomial function of the size of the input, being necessary to use approximate methods. Nevertheless, for small and even for some medium size instances, α, β-k-FSP may be solved exactly, in a reasonable time. Using the published cork oak protein dataset, we mathematically model the problem as an α, β-k-FSP and analyzed the obtained results. We select leaf proteomic markers, finding a set of proteins (features), as small as possible, that represent the dominant effects on the metabolism of the host resulting from the action of the oomycete on the roots, in order to contribute to an early diagnosis of the biochemical changes associated with cork oak infection by P. cinnamomi. Variations in the abundance of these proteins have an impact on the processes of protein production, essential for cellular reprogramming in situations of biotic stress, beta-oxidation of fatty acids in peroxisomes, photosynthesis, and photorespiration. We hypothesize that these markers can be decisive to detect trees that go into decline due to the interaction with the pathogen, helping to manage forest ecosystems in which the cork oak predominates.

2. Materials and Methods

2.1. Public Cork Oak Protein Dataset

In this study, we used 80 proteins out of 424 proteins quantified by SWATH-MS (sequential windowed data-independent acquisition of the total high-resolution mass spectra) in cork oak leaves inoculated in the roots with P. cinnamomi [12]. The biological assay was carried out with 12 cork oak plants, with six being inoculated with P. cinnamomi. Proteins included in the selected group of 80 were identified using the Arabidopsis proteome database as reference showed a p-value below 0.05 or a fold change greater than 2 or less than 0.5 in their ratio levels between inoculated and non-inoculated (control) samples, then being considered as altered. The aforementioned mass spectrometry proteomics data have been deposited to the ProteomeXchange Consortium via the PRIDE [30] partner repository with the dataset identifier PXD021455 and is publicly available.

2.2. Modeling the Cork Oak Protein Dataset as an (α, β)-k-Feature Set Problem

As mentioned before, in the introduction section, we aim to determine a dominant subset of proteins (features) that robustly explains the dichotomy within the cork oak samples. Next, we will present the general definition of the α, β-k-FSP [20,27] followed by its mathematical formalization for our case and a small example.
Definition 1.
Consider a given data set with m samples and n features, represented by a discrete matrix D and an array T. Each element dif of matrix D specifies the value of feature f in sample i. Each element ti of array T specifies the type or class of each sample. α, β, and k are positive integer parameters. Then the (α, β)-k-Feature Set Problem seeks to minimize the size k of a subset S of features (columns of matrix D), such that:
(a) for all pairs of samples (i, j), with i ≠ j, if they do not belong to the same type, ti ≠ tj, there is a subset S′ ⊆ S such that |S′| ≥ α and they have different values, dif ≠ djf, for all feature f of S′;
(b) for all pairs of samples (i, j), with i ≠ j, if they belong to the same type, ti = tj, there is a subset S″ ⊆ S such that |S″| ≥ β and they have the same value, dif = djf, for all feature f of S″.
So, the α, β-k-FSP seeks to determine a subset of features, with minimum cardinality, having at least α features for differentiating between any two samples of different classes and at least β features for coupling any two similar samples of the same class.
In our study, considering our experimental data set, we want to determine the minimum subset of proteins that consistently explains the differences between any pair of control and inoculated samples and the similarities between any pair of control samples or of inoculated samples. This can be modelled as an α, β-k-FSP, as described below.
We used the following notation for the experimental data set:
C = c 1 ,   c 2 , , c m   is the set of cork oak samples;
T = t 1 ,   t 2 , , t m   , t i control ,   inoculated ,   i = 1 , , m , holds the type of the samples;
P = p 1 ,   p 2 , , p n   is the complete set of biological or statistical relevant proteins obtained in the biological experiment;
D a t a = d t c i   p l m × n is the matrix with the experimental data set holding the quantification level of each protein p l in each cork oak sample c i ;
D = d c i   p l 0 ,   1 m × n is the binary matrix got from the data matrix classifying each protein quantification level as less abundant or more abundant represented, respectively, by 0 and 1.
Table 1 shows the above sets for a small example.
We also denoted the minimum proteins set obtained in the solution of the α, β-k-FSP as S = p s 1 ,   p s 2 , , p s k P .
We defined matrices A = a c i ,     c j   p l and B = b c i ,   c j   p l , respectively, for the pairs of samples that belong to different types and for the pairs of samples that belong to the same type as follows:
a c i , c j p l = 1   ,   if   d c i   p l d c j   p l   and   t   c i t   c j 0 ,   otherwise ;
b c i , c j p l = 1   ,   if   d c i   p l = d c j   p l   and   t   c i = t   c j 0 ,   otherwise ,
matrices A and B for the data of Table 1 are presented in Table 2.
Then, we formalized the α, β-k-FSP as a binary linear program as shown below, where the binary variable x p l = 1 if the protein   p l is selected, otherwise x p l = 0 .
min   k = l = 1 n x p l
subject to:
l = 1 n a c i , c j   p l   x p l α ,   c i , c j C   :   t   c i t   c j
l = 1 n b c i , c j   p l   x p l β ,   c i , c j C   :   t   c i = t   c j
x p l 0 , 1
In the above mathematical formalization, the objective function (1) minimizes the number of selected proteins (which will belong to set S). Constraints (2) ensure that for all pairs of samples that belong to different types, there are in set S at least α proteins having different values and constraints (3) ensure that for all pairs of samples that belong to the same type, there are in set S at least β proteins having identical values. Constraints (4) force variables to be binary.
It is very useful to represent the α, β-k-FSP as a graph G(V, E), with V = A B P nodes, and a set of edges, E, linking the nodes according to the 1 values of matrices A and B. So, we obtain the graph of Figure 1 for the example of Table 1 and Table 2.
Clearly, if we consider α = β = 1, then k = 1 is the optimum solution and S = p 1 because protein 1 dominates every node, since it is linked to all of them, see Figure 2a. This is due to the fact that it presents the same value to the same type pairs and opposite values to the different type pairs (see Table 1), being completely coherent. But as mentioned before the selected feature set, S, is as more reliable as the greater α and β are, so we can see in Figure 1 that the largest value that α and β can take is 2, because it is the number of edges linked to nodes c 2 , c 3 , c 1 , c 2 , and c 3 , c 4 , therefore, those nodes cannot be covered more than two times. For α = β = 2, it is clear that the proteins linked to those three nodes must be in the optimum solution, then S = p 1 , p 2 covers node c 2 , c 3 and S = p 1 ,   p 3 , p 5   covers the other two nodes and no more proteins are needed since every node is covered twice (see Figure 2b), being k = 4 and S = S S = p 1 , p 2 ,   p 3 , p 5   the optimum solution of α, β-k-FSP for this example. For the other values, α = 1 and β = 2 or α = 2 and β = 1, the solutions will be, respectively, k = 3, S = p 1 ,   p 3 , p 5 and k = 3, S = p 1 , p 2 ,   p 4 . Note that the higher α and β, the higher the number of proteins selected (value of k). So, usually, for high-dimensional data sets where it is necessary to use approximate methods, that do not guarantee the optimum solution, the problem is solved for some different values of α and β and then the best compromise solution is chosen.
Based on the above formalization, we have implemented the procedures needed to prepare the data and solve the respective α, β-k-FSP in MATLAB (MATrix LABoratory, which is a multi-paradigm programming language). We briefly describe them below.
Input data: It is known, and has been confirmed in our experimental dataset, that statistical significance can be very different from biological meaningfulness. Thus, in this study, we considered the set of 80 proteins quantified for 12 samples, divided into two groups, control and inoculated, each with 6 samples, above-mentioned (in Section 2.1). So, using the above notation, the input was:
C = c 1 ,   c 2 , , c 12 , T = t 1 ,   t 2 , , t 12 , where t 1 ,   t 2 , , t 6 = control   and   t 7 ,   t 8 , , t 12 = inoculated and P = p 1 ,   p 2 , , p 80 .
Construction of matrices: Our biological data set, matrix data, has continuous values for the protein level and it was necessary to consistently separate less abundant quantification level samples from more abundant quantification level samples. Thus, we established for each protein a range, centred on its mean, which clearly separates the less abundant samples (below the range) from the more abundant samples (above the range).
To determine which range should be used, we tested five ranges, being each equal to μ ± l × μ, where μ is the mean and l is equal to 5%, 7.5%, 10%, 12.5%, and 15%.
As matrix D must be binary or discrete, for each protein (column) we assigned 0 and 1, respectively, to less abundant quantification level and to more abundant quantification level samples, while the samples with a level belonging to the above aforementioned ranges were considered with neutral abundance and with no value assignment. Therefore, our matrix D is slightly sparse.
Matrices A and B were computed as defined in the above formalization. Matrix A has 36 lines (6 × 6 = 36 pairs of samples of different types) and matrix B has 30 lines (combination of 6 taken 2 at a time, for control pairs and also for inoculated pairs, that is, 2 × 6 ! 2 !   4 ! = 30 pairs of samples of the same type), both with 80 columns (number of proteins).
Parameters definition: As mentioned above, the largest possible value for α is equal to the minimum number of edges linked to the nodes representing pairs of samples of different types. Analogously, β is at most equal to the minimum number of edges linked to the nodes representing pairs of samples of the same type. Those were the α and β values computed and used in our model.
Optimum solution: The algorithm to solve our α, β-k-FSP was implemented in MATLAB. The binary linear program optimum solution was obtained using the MATLAB intlinprog function, which was appropriately parametrized. The algorithm took an average execution time of 0.4866 ms, varying between 0.374 ms and 0.599 ms, on an Intel i5-4300U CPU (Mobile Haswell, 15 W TDP, 2C/4T, 1.90 GHz nominal and max turbo of 2.90 GHz).

3. Results and Discussion

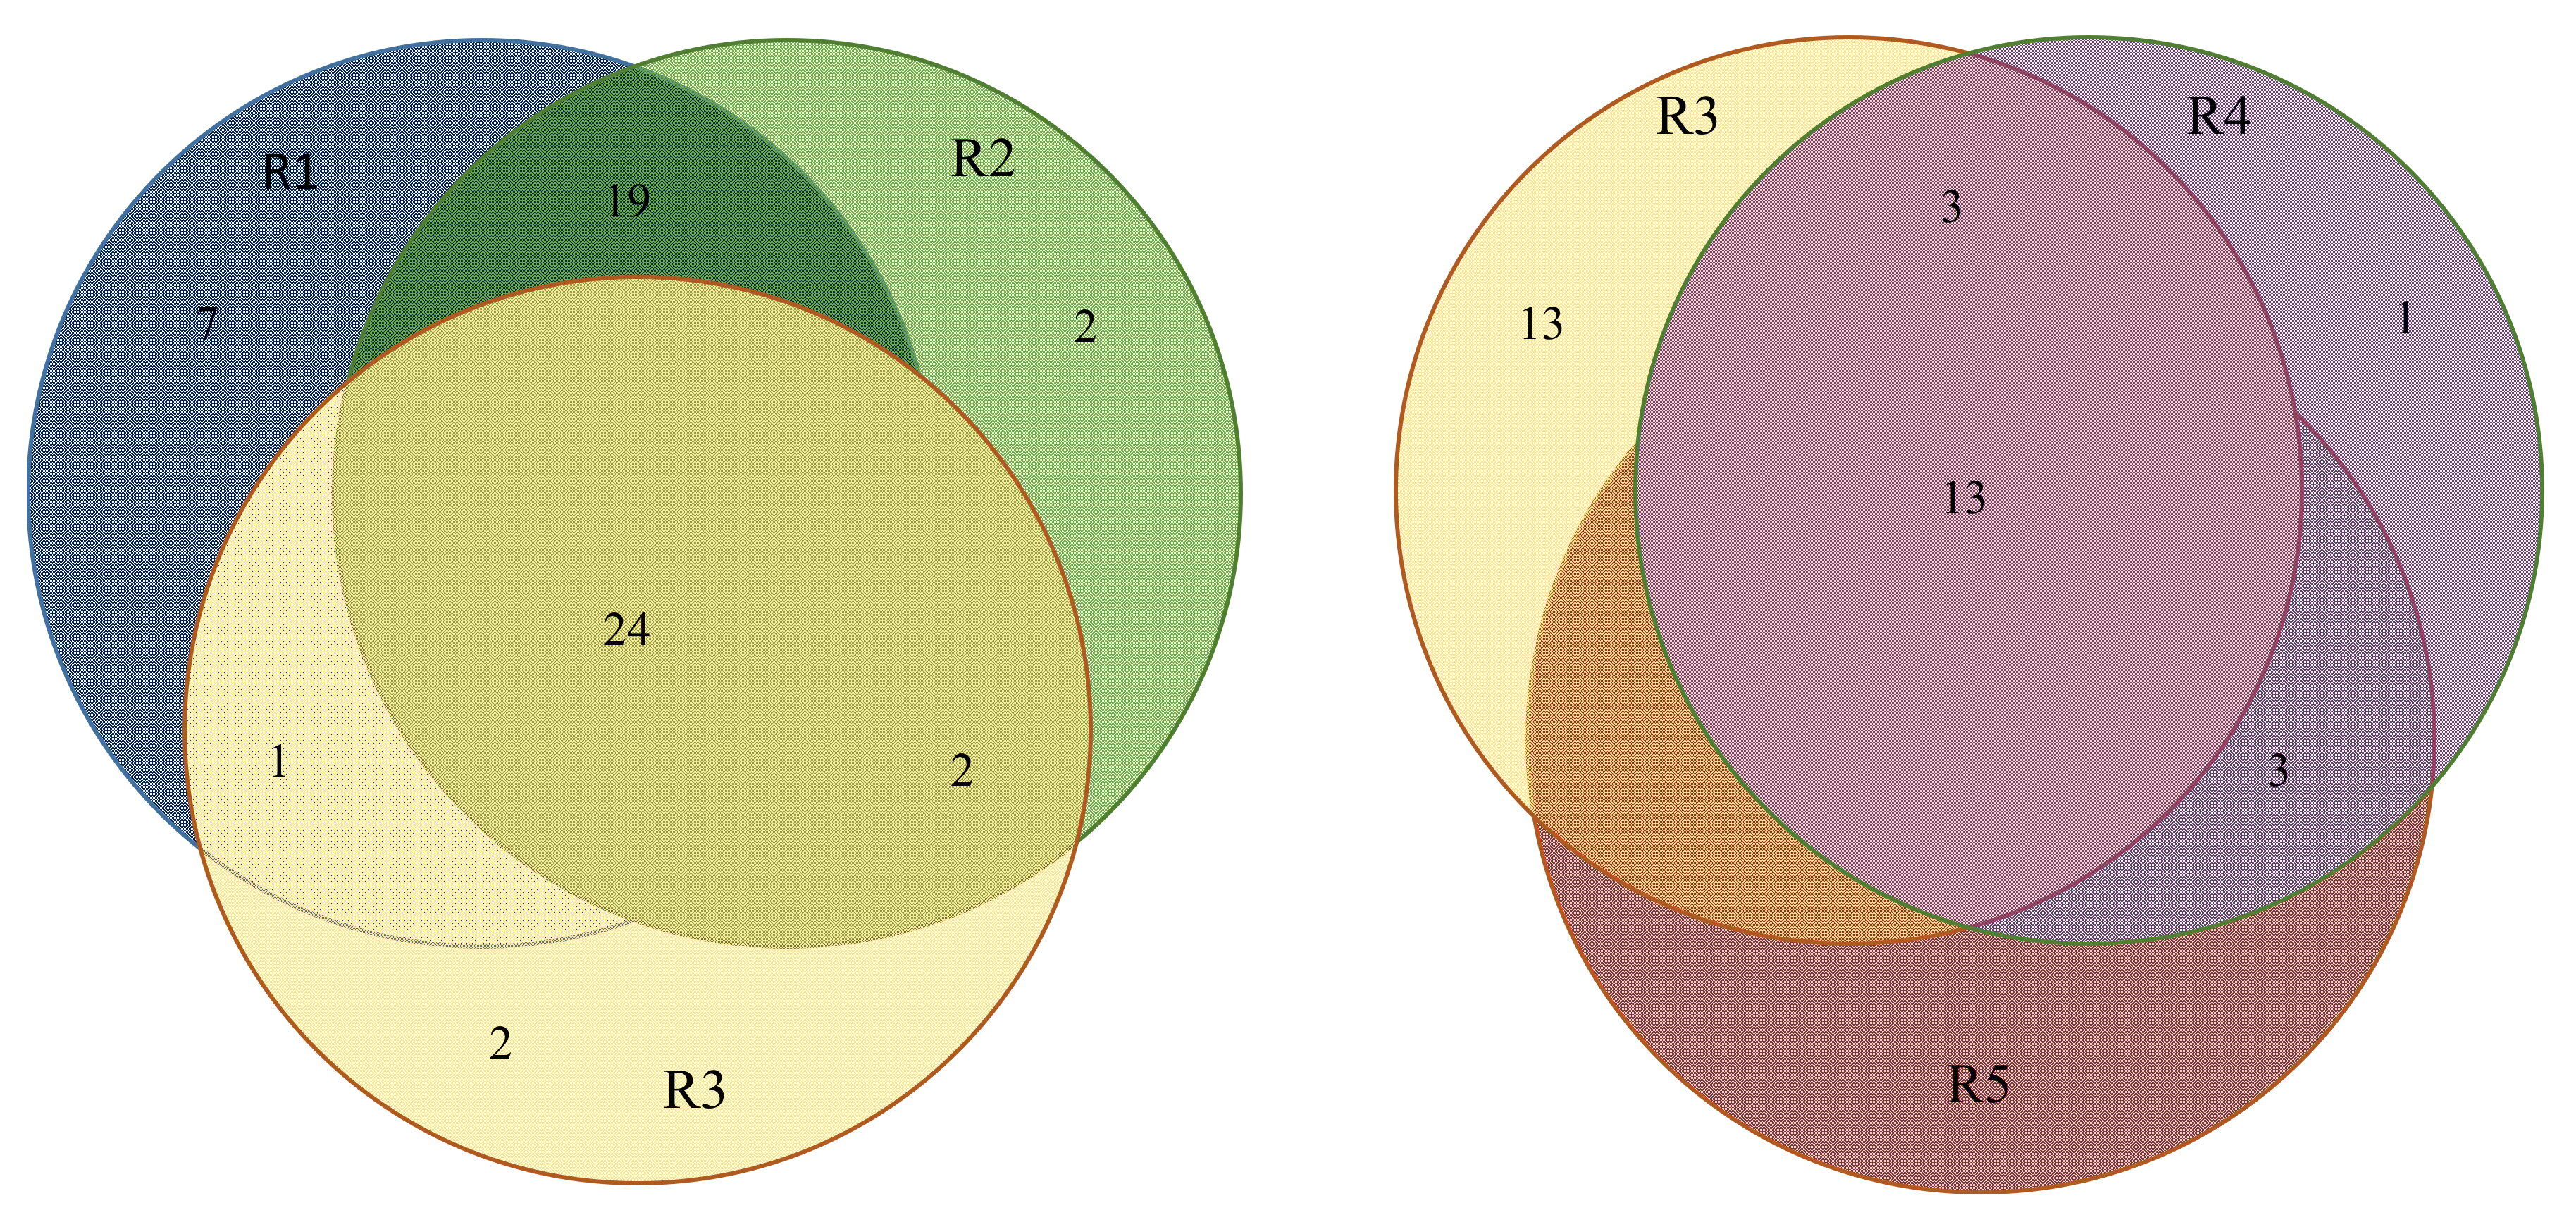
3.1. (α, β)-k-Feature Set Problem

The results obtained for the optimum solution of the α, β-k-FSP, considering the mentioned five ranges for neutral quantification, are shown in Table 3.
It can be seen that for ranges R1 and R2, a high number of proteins are obtained (k), while for R5 the obtained protein set seems rather small. We also observed that the set of proteins obtained, for each range, is included (except for no more than four proteins) in the next larger range, as depicted in Figure 3, where two Venn diagrams were used for a better visualization. Therefore, and considering also the alpha and beta obtained values, we chose the R3 range as the best compromise between the number of proteins and the legitimacy in finding similarities (beta) and dissimilarities (alpha) between samples. Therefore, we will focus our discussion on that optimum set of proteins (S-R3).
The approach carried out allowed the selection of 29 proteins (R3 range), which ensure with a high certainty the existing separation between the group of control plants and the group of plants inoculated with P. cinnamomi. Table 4 details the information regarding the selected group of proteins, including the UniProt accession codes, name, and protein initial.
When graphically representing the protein abundance for S-R3 in the 12 cork oak samples evaluated, a distinct pattern of colours is observed for the two plant groups, control and inoculated (Figure 4). The method allowed for the identification of the smallest number of proteins out of the group of 80 that has the potential to effectively separate, based on the quantification of the proteins identified, plants that are in an interaction with P. cinnamomi from plants that are not in an interaction with the pathogen. For the first 16 proteins on the x-axis, the profile of lower abundance and neutral is characteristic of the control samples, the opposite occurring in the following 13 proteins. Proteins with consistent profiles of more abundant/neutral or less abundant/neutral quantification levels are more frequent in control samples (21 proteins) than in the inoculated samples (10 proteins), showing that the diversity of quantification profiles is more homogeneous in the control samples. This means that the immune response of cork oaks to infection by P. cinnamomi falls within a certain pattern but displays a higher diversity of protein profiles. By using the normalised abundance values for each protein in each of the samples, it can be seen that the quantification profiles of the control samples are plotted in opposite quadrants to those of the inoculated samples, showing the dissimilarity in production levels of each of the proteins in the two types of samples (Figure 5). The heterogeneity of abundance patterns observed for each protein in each of the samples is also evident (column height of the stacked columns in Figure 5). For example, protein P56778 (first column) is always more abundant in control samples than in infected samples but the abundance values vary from sample to sample. In the case of protein P10795 (column fifteen), there is no consistent pattern of abundance in the control samples or in the inoculated samples. In nature, a slow form of cork oak decline predominates, with trees showing gradual degrees of severity of the phenomenon. It is possible that the different patterns observed in the infected samples for the selected proteins have correspondence with the phenotypic characteristics of the trees with decline symptoms. In view of the high degree of genetic diversity observed in Q. suber, it is expected that the homeostatic state of the trees emerging from the interaction with P. cinnamomi is diverse and complex. Thus, the defence response of cork oaks to P. cinnamomi infection observed in this study is heterogeneous and this optimal set of proteins may represent the diversity of protein patterns expected to be found in a natural population challenged by this oomycete. The protein biological features may help in understanding the role they play in trees with a healthy or declining profile.

3.2. Biological Relevance of the S-R3 Protein Set

The S-R3 protein set was used as input data on STRING v11 online platform (search tool for retrieval of interacting genes/proteins) [31,32] to build a protein–protein interaction (PPI) network among the selected proteins and screen for the associated KEGG metabolic pathways [33]. The default parameters have been maintained, with the confidence cut off value set at 0.400 and false discovery rate (FDR) stringency set at 0.05. The PPI network is based on known interactions (from curated databases and experimentally determined), predicted interactions (gene neighbourhood, gene fusions, and gene co-occurrence) and information gathered from text mining, co-expression, and protein homology. The links between proteins exhibit the joint contribution to a given function and allow us to infer about their biological relevance as a group. STRING analysis revealed that 24 of the 29 proteins of S-R3 are connected with each other by 36 edges, with a PPI enrichment p-value < 0.02 (Figure 6). Thus, it can be seen that there are proteins in this group that are partly biologically associated with each other, functioning as a group.
In order to understand which groups of proteins within the network could correspond to functional units, a hierarchical clustering of the string network was carried out using the k-means clustering method. Three main clusters were identified: the blue cluster includes 7 proteins functionally associated with photosynthesis, the red cluster comprises 16 proteins associated mainly with glyoxylate and dicarboxylate metabolism, carbon fixation in photosynthetic organisms, and the citrate cycle, and the green cluster contains 6 proteins associated with ribosomes (Figure 7).
In each of the clusters, the proteins Q9FLN4-50S ribosomal protein L27 (RK27), PMDH2-Malate dehydrogenase (FAKDZ4/PMDH2), P10795-ribulose bisphosphate carboxylase small chain 1A (RBS1A/RBCS1A), and A0A1P8B485-protein translocase subunit Sec A (AGY1) stand out because they interact with many proteins and/or are the link between the group to which they belong and the other groups. The number of edges in the ribosomal protein cluster indicates their functional dependence on each other, that is, alterations produced in one protein should influence the others. Therefore, it is expected that variations in the abundance of the RK27 protein will condition the whole group of ribosomal proteins, affecting the structures and processes of protein production essential for cellular reprogramming in situations of biotic stress. Plastid translation is required for embryo development in Arabidopsis with the engagement of at least nine nuclear-encoded plastid ribosomal proteins (PRPS5, S13, S20, L1, L4, L6, L21, L27, and L35), but the exclusive absence of PRPL27 or L1, L4, or L35 leads to alterations in cell division patterns, showing that L27 is required for basal ribosome activity [34]. This reinforces the image of a pivot protein on the PPI network. Changes in cellular metabolic processes in which the PMDH2, P10795, and AGY1 proteins participate will influence the RK27 protein also, and thus all the proteins from the ribosome cluster.
AGY1 encodes a chloroplast subunit of the protein translocase Sec A and the name originates from albino or glassy yellow phenotypes of Arabidopsis mutants, dysfunctional in the Sec A protein-transporting ATPase [35]. The biosynthesis of chloroplasts is compromised in these homozygous mutants due to the inability to import nuclear-encoded proteins destined to be translocated to the lumen of the thylakoids by the Sec pathway [35,36]. This inability gives rise to genetic reprogramming aimed at the production of proteins related to photosynthetic complexes, protein translocation systems for chloroplasts, and mitochondrial respiratory complexes. In this context, the connection found between AGY1 and RK27 makes sense, since an alteration in AGY function triggers the reprogramming of gene expression at the level of various organelles and concomitant protein synthesis. In cork oak, the interaction with P. cinnamomi induced changes in the amount of AGY1 produced in inoculated plants, reducing the amount when compared with that produced in control plants [12].
The peroxisomal malate dehydrogenase PMDH2 catalyses the re-oxidation of NADH during fatty acid beta-oxidation [37] and this protein is concomitantly implicated in several metabolic pathways in the peroxisomes, such as the glyoxylate and dicarboxylate metabolism, photorespiration, nitrogen metabolism, and plant hormone biosynthesis [38]. Its positioning in the red cluster interacting with several proteins participating in the above biological processes is fitting. Proteins from the red cluster that had connections to PMDH2 and had associated enzyme numbers (EC numbers) were submitted to KEGG [33], choosing the Arabidopsis organism as a reference, to identify the metabolic pathways in which they participate (Figure 8). Four red cluster proteins are assigned to the glyoxylate and dicarboxylate metabolism KEGG map, with malate dehydrogenase (EC:1.1.1.37; PMDH2) associated with the methylaspartate cycle, the thiolase family protein (EC:2.3.1.9; AACT1) associated with the ethylmalonyl pathway of terpenoid biosynthesis, and (S)-2-hydroxy-acid oxidase GLO1 (EC:1.1.3.15; Q9LRR9) and ribulose bisphosphate carboxylase small chain 1A (EC:4.1.1.39; P10795) linked to photorespiration (Figure 8).
Moreover, using the data made available in a previous publication [12], it can be seen that all the proteins mentioned in the previous text were less abundant in cork oak samples inoculated with P. cinnamomi when compared with the controls, showing negative values for Log2FC (fold change ratio logarithm of protein abundance in inoculated over control samples). It is possible that the strategy adopted by the plant to reduce the energy to be expended in reorganising the physiological state resulting from the interaction with the oomycete involves decreasing the abundance of proteins, which interferes with several metabolic processes simultaneously, some being housed exclusively in the peroxisome. In the context of biotic stress, the NO signaling molecule could eventually be responsible for the regulation of photorespiration and beta-oxidation in peroxisomes through S-nitrosylation of the H2O2-producing GLO1 proteins (EC:1.1.3.15; Figure 8) or the PMDH isoforms, in agreement with the hypothesis raised by Ortega-Galisteo and colleagues [39].

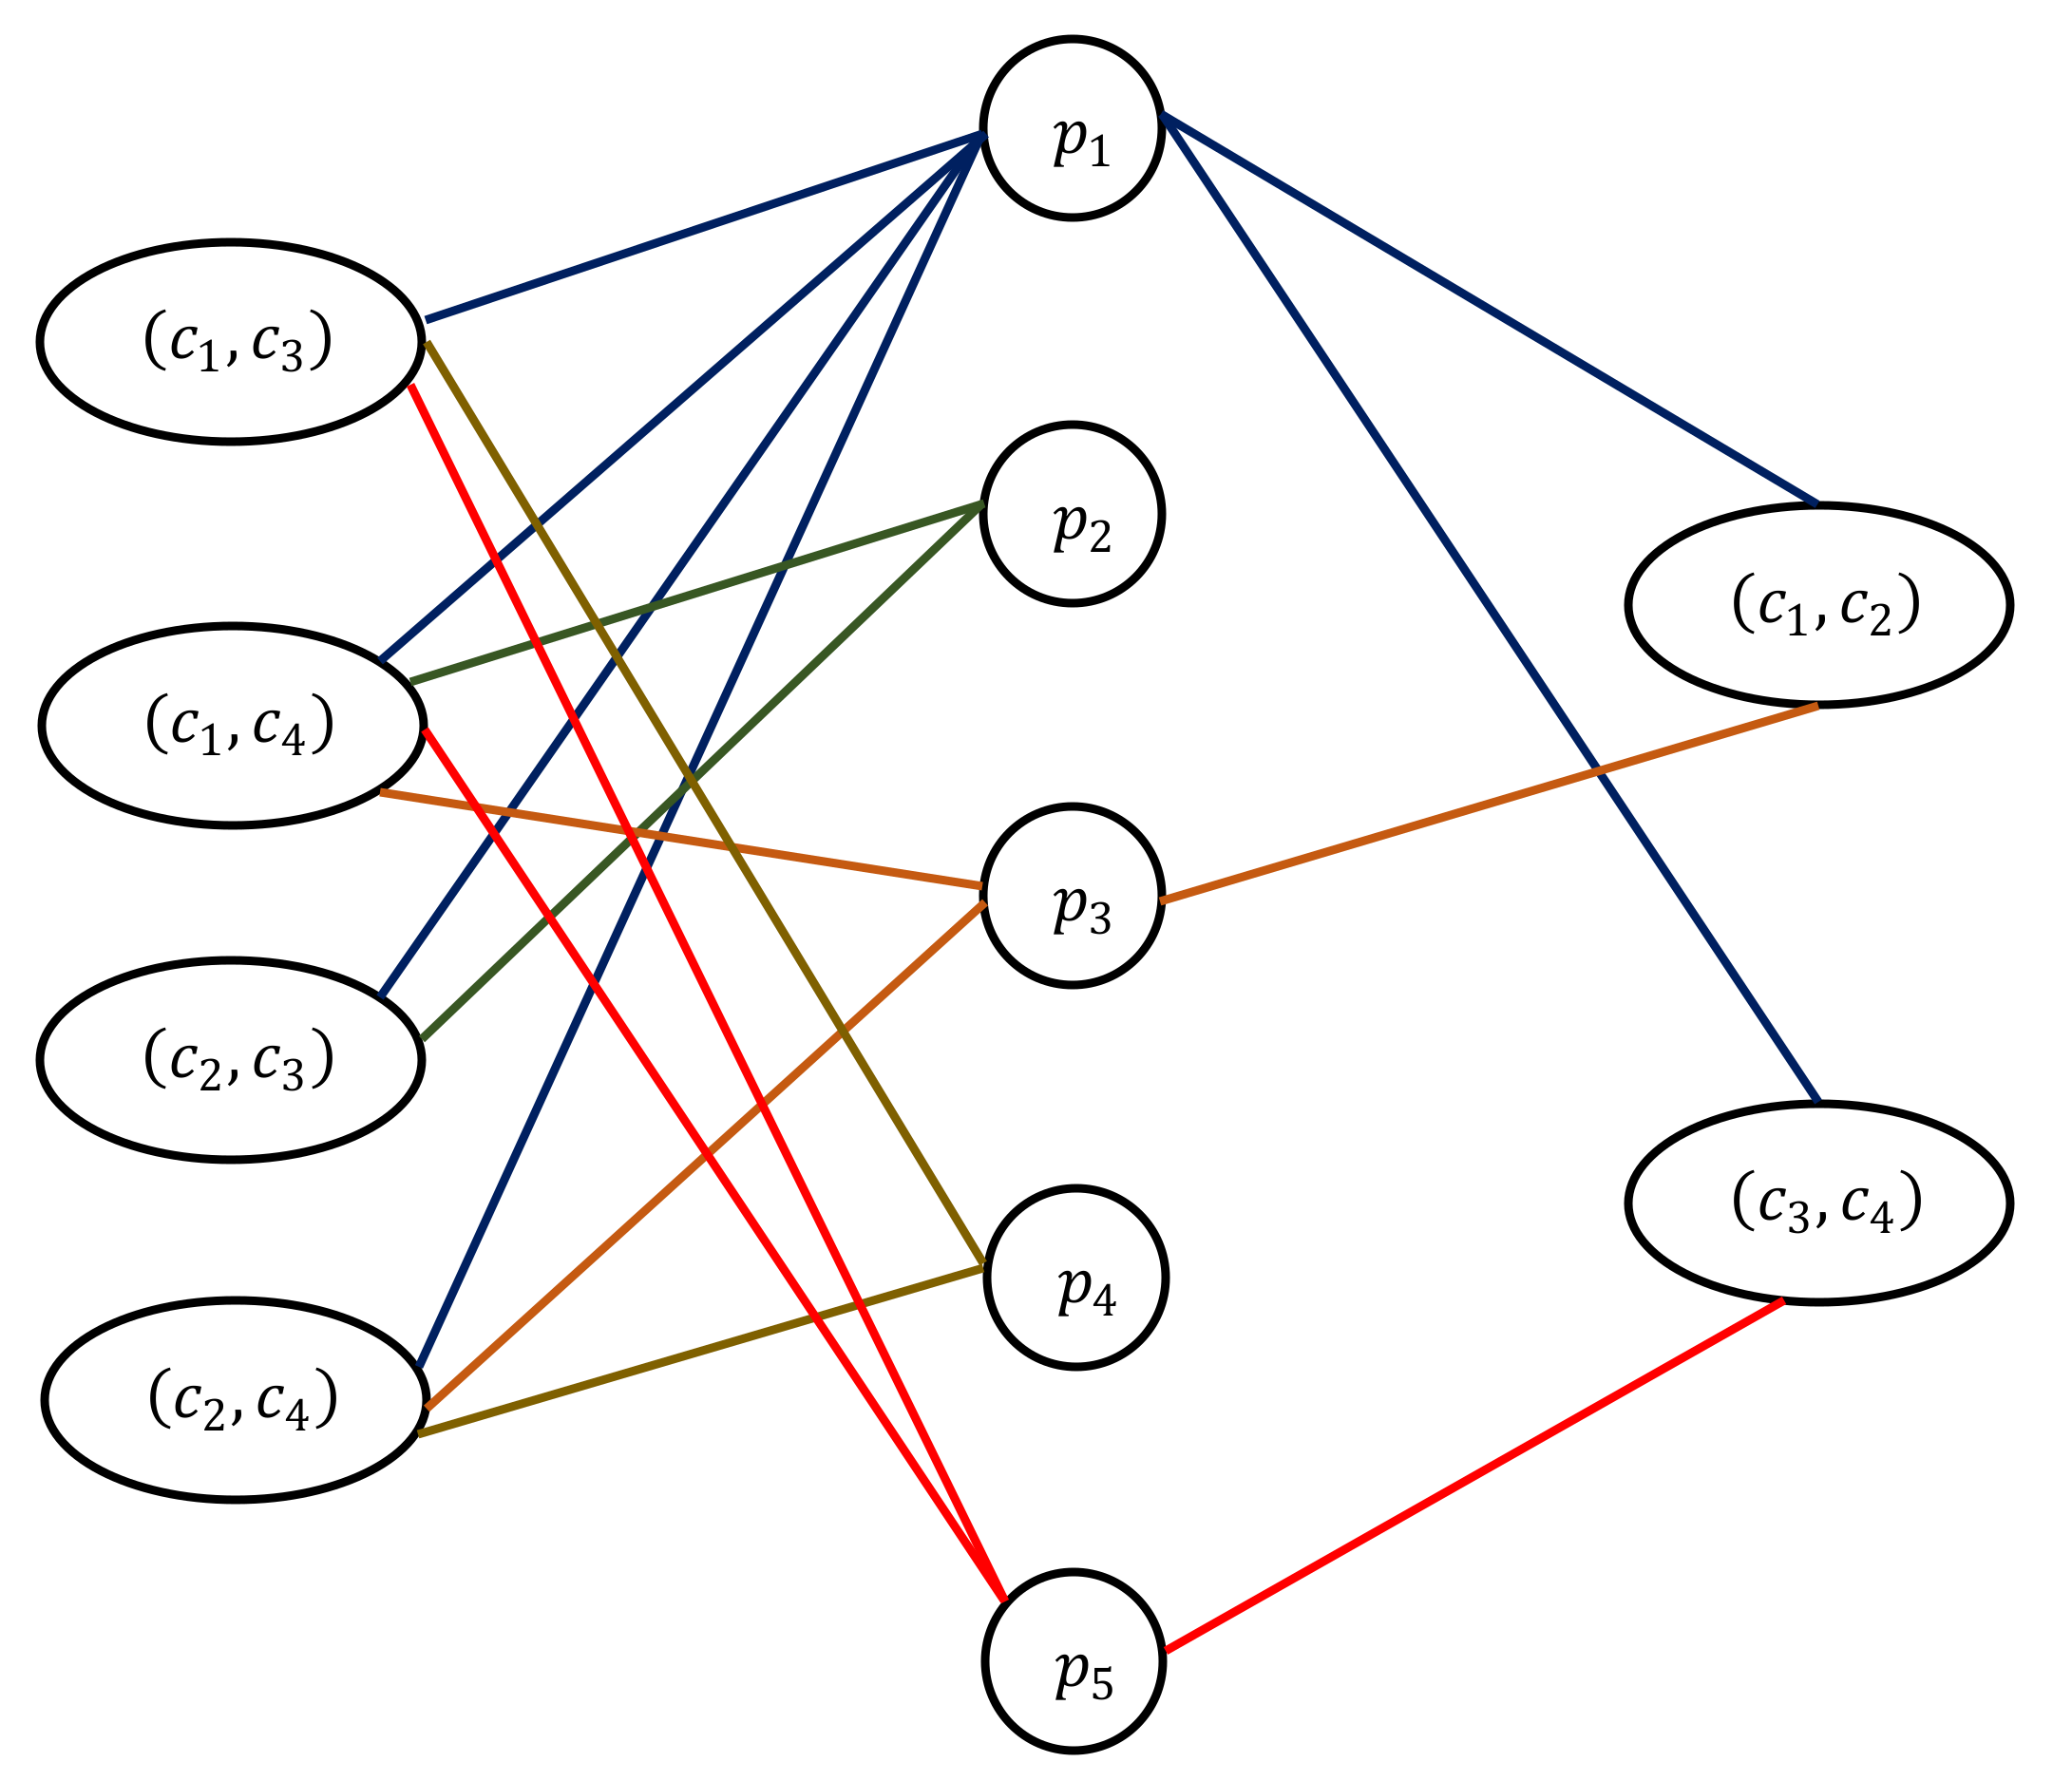
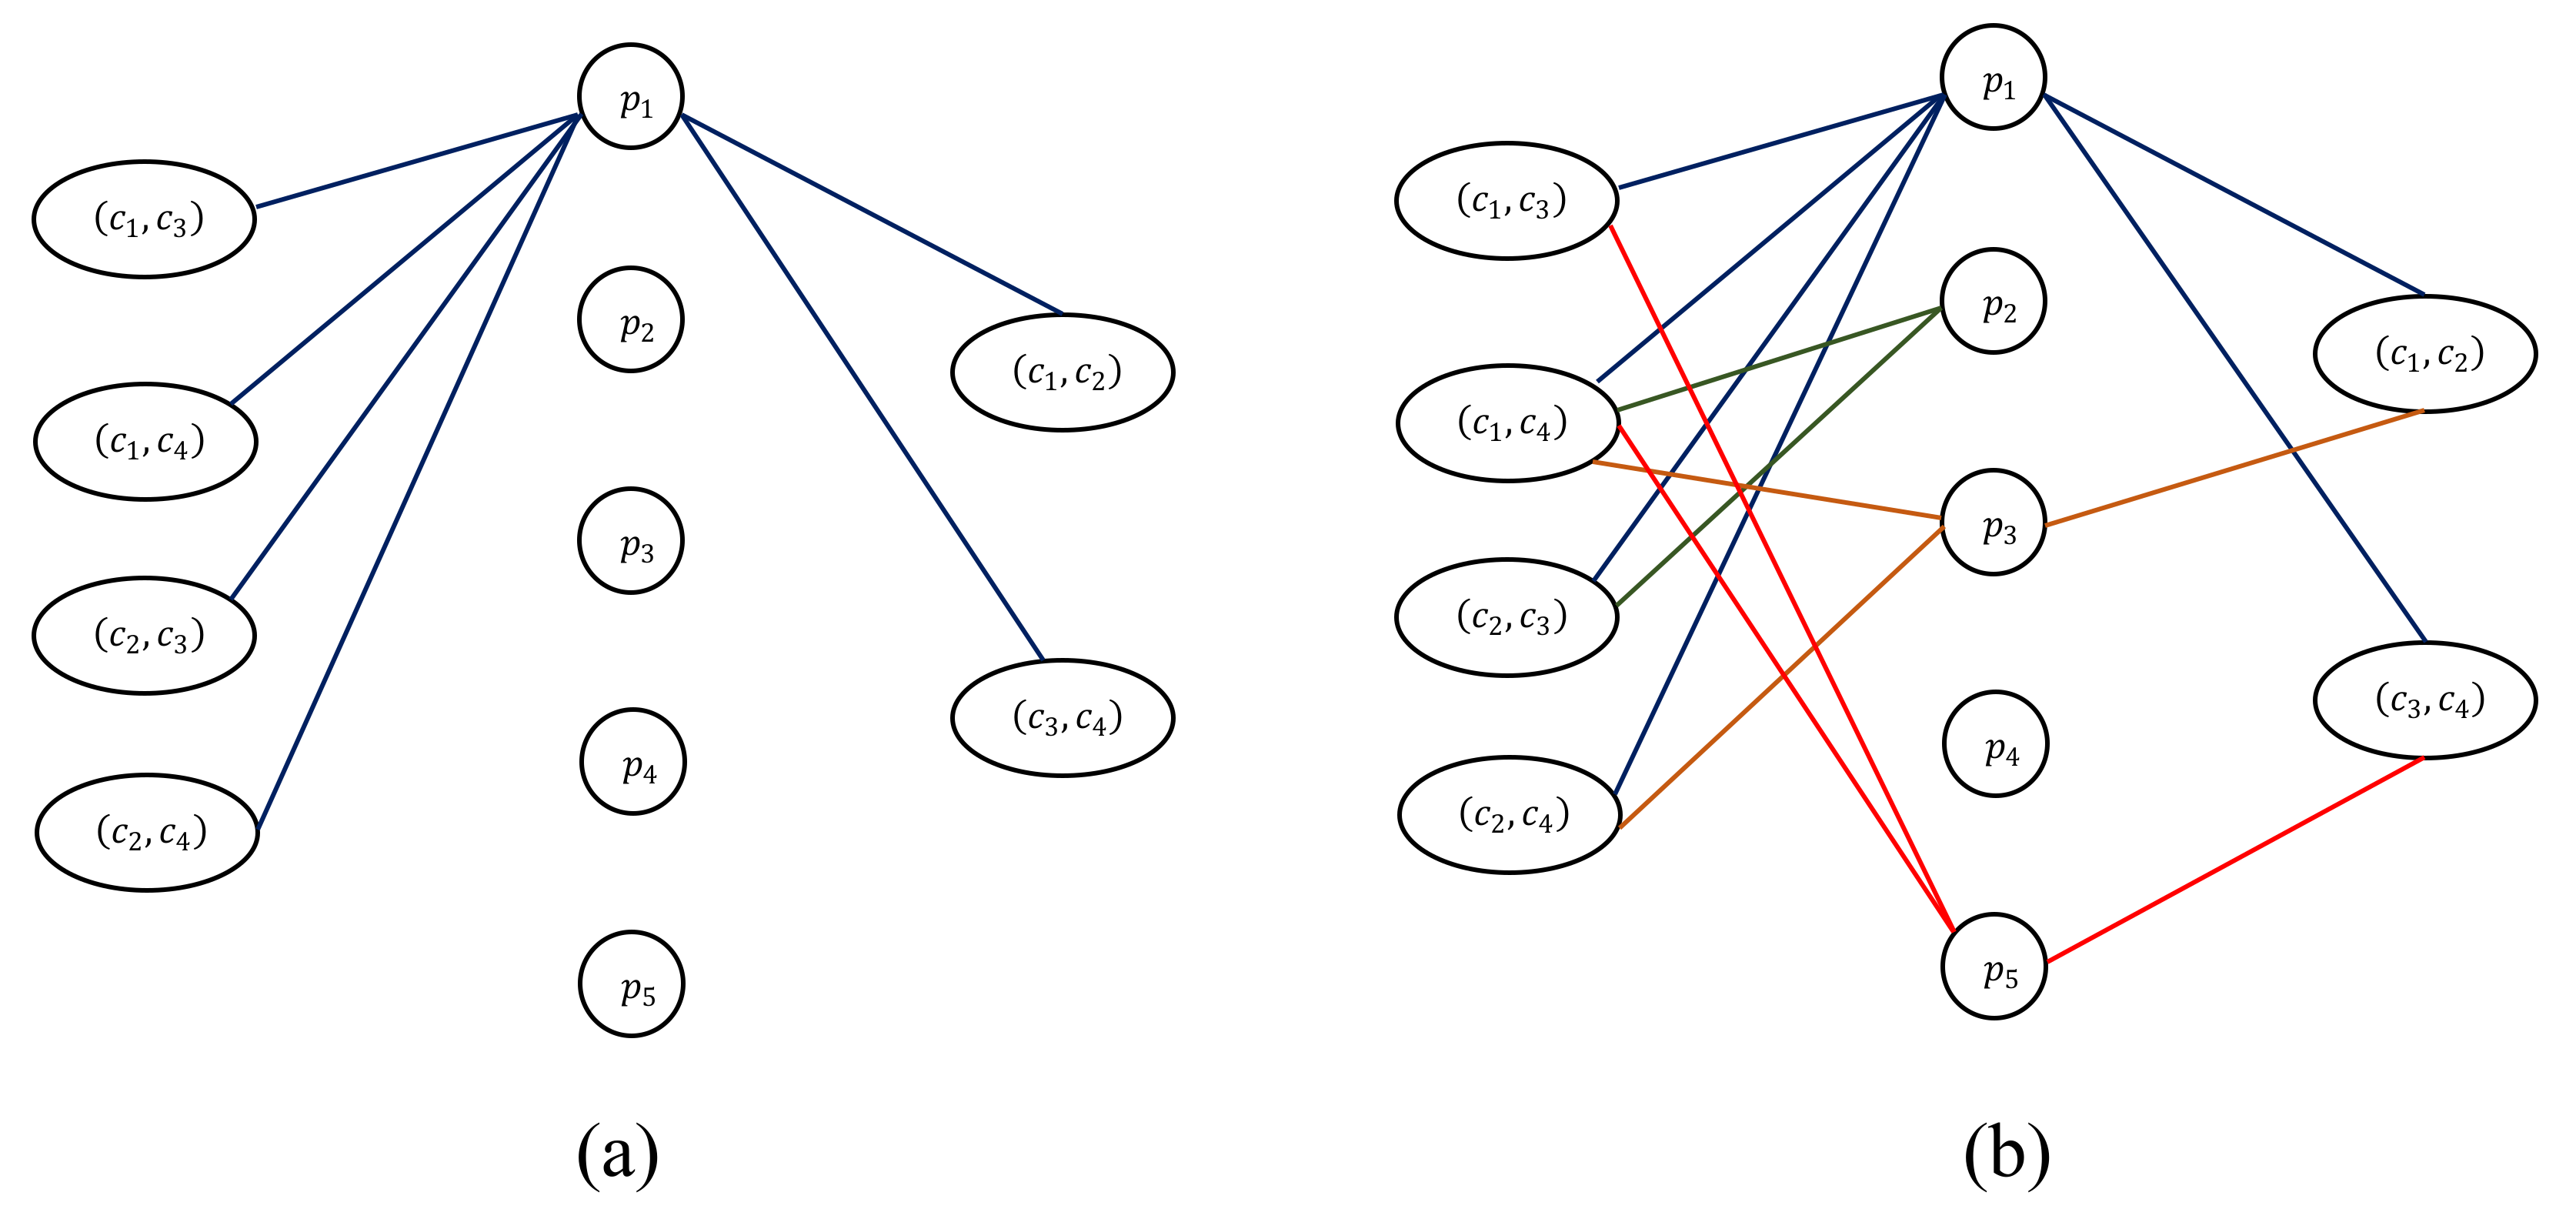
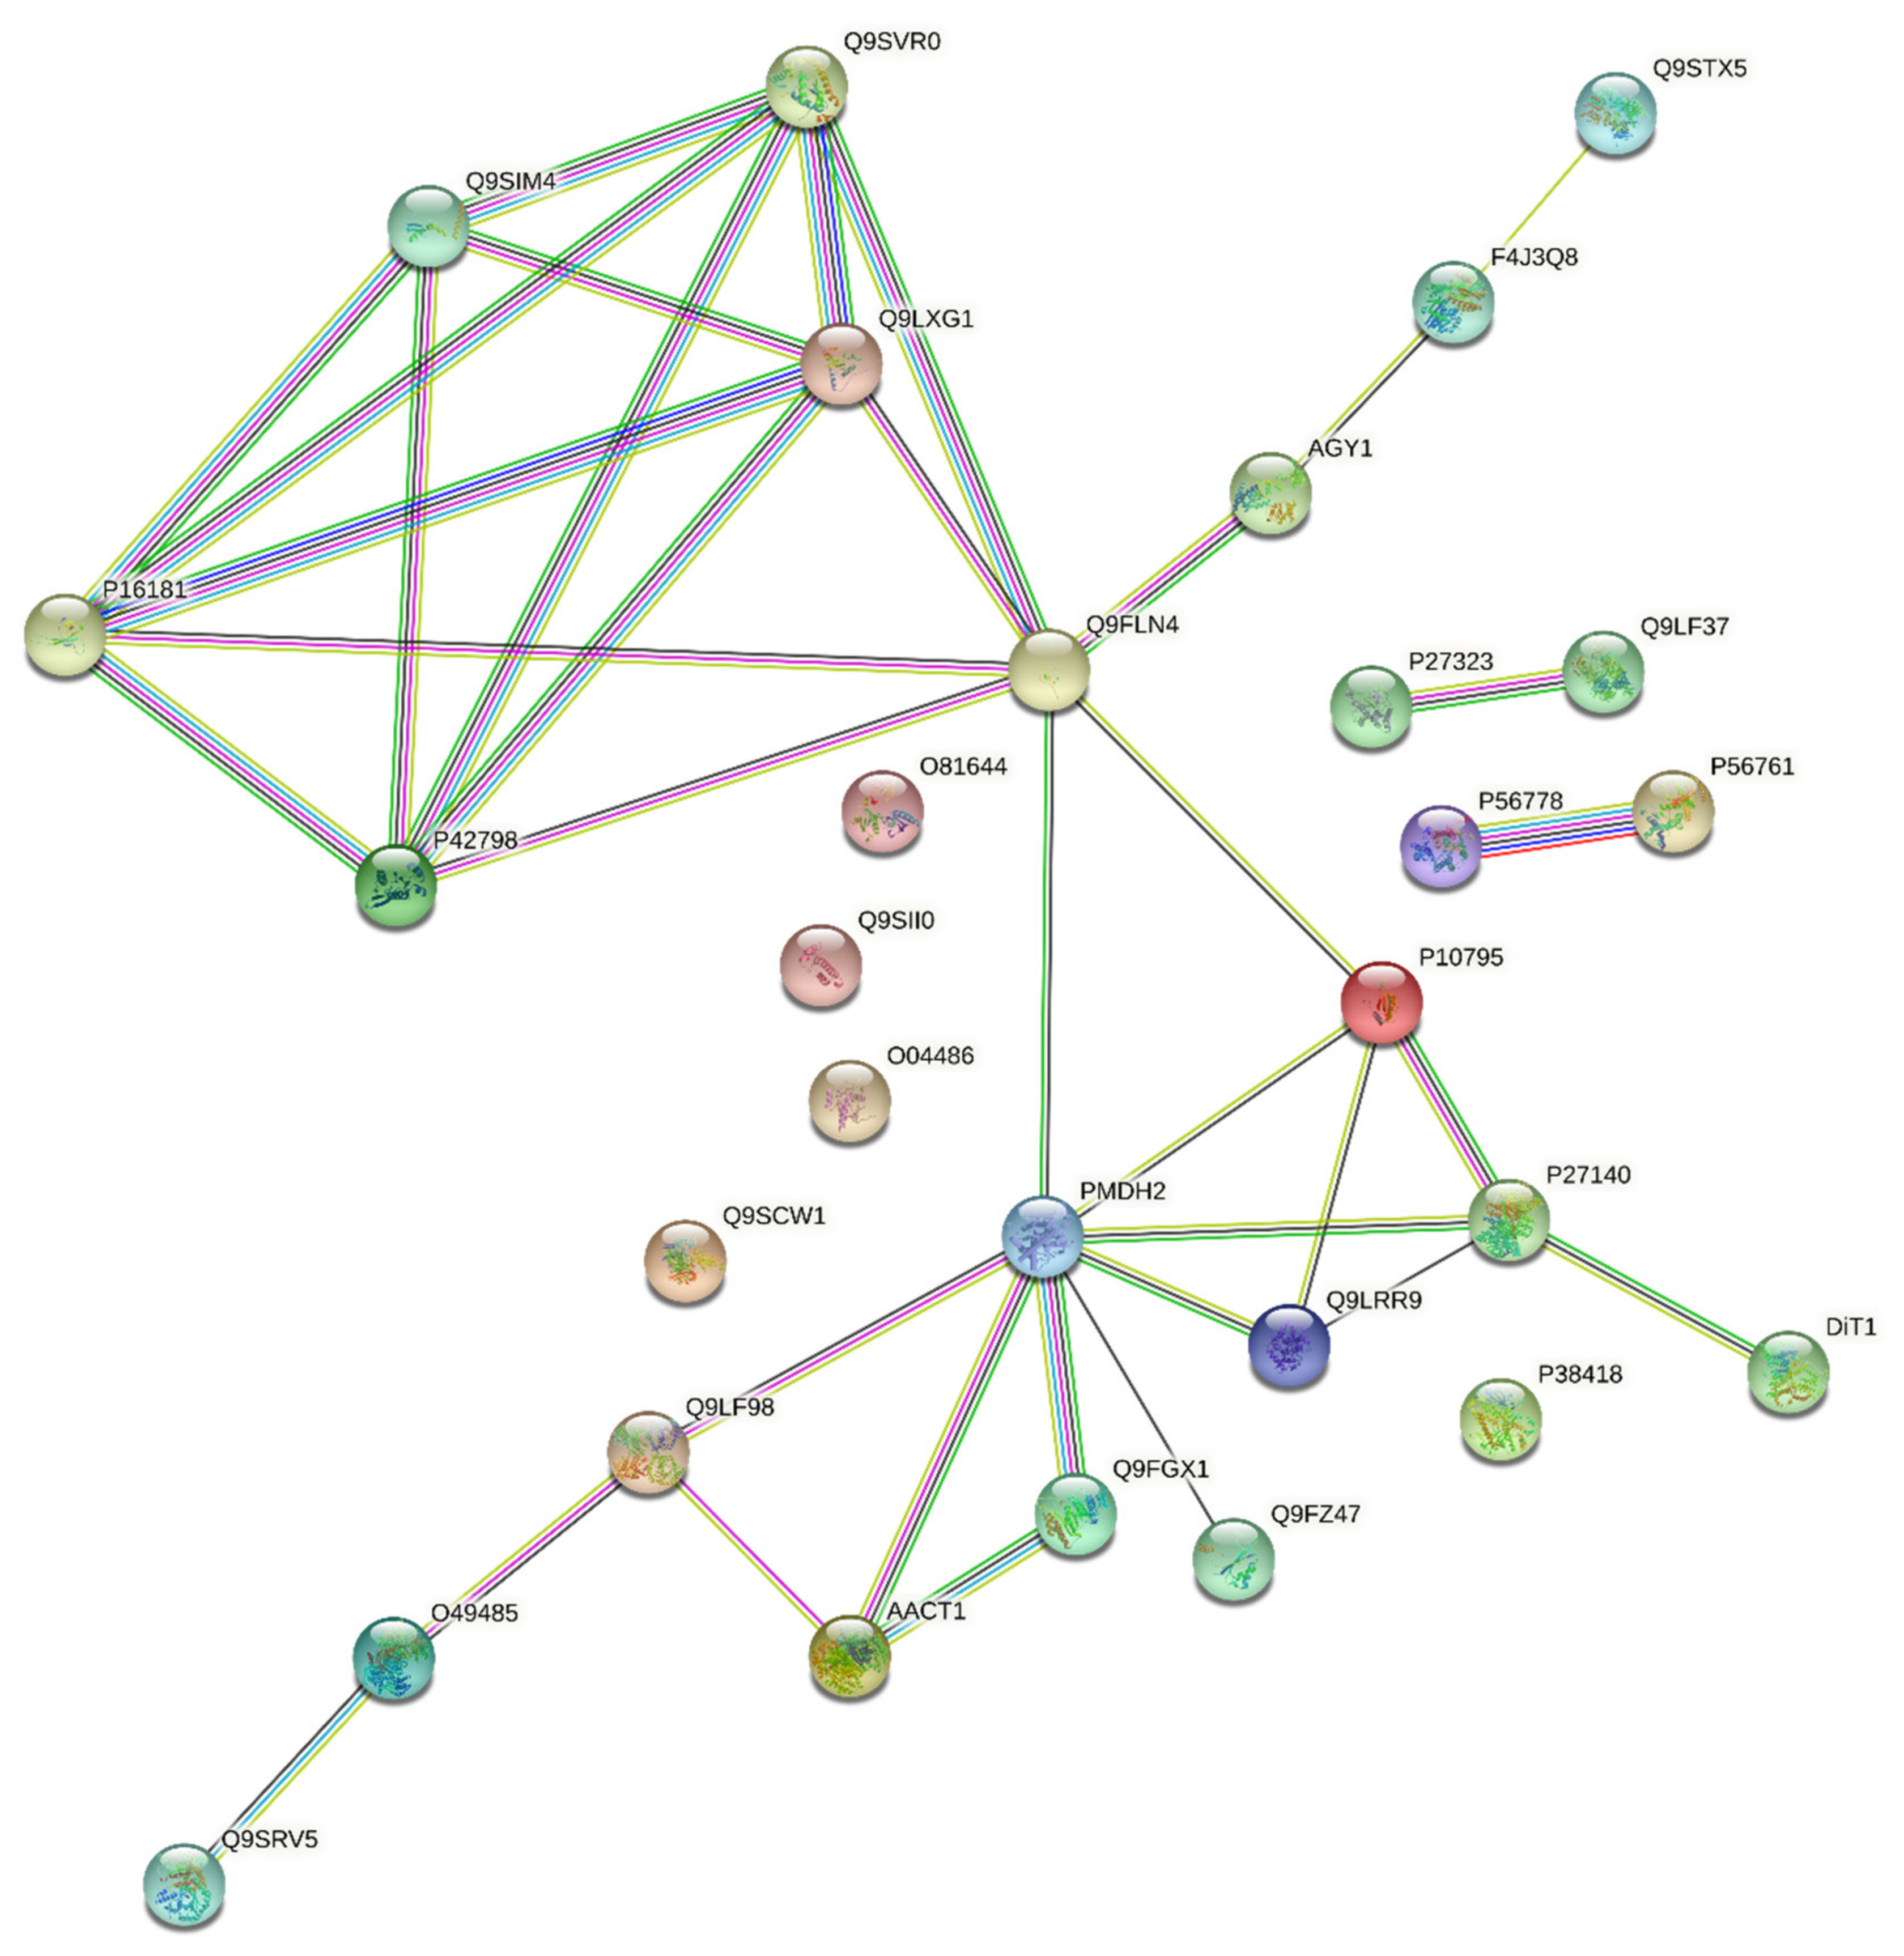
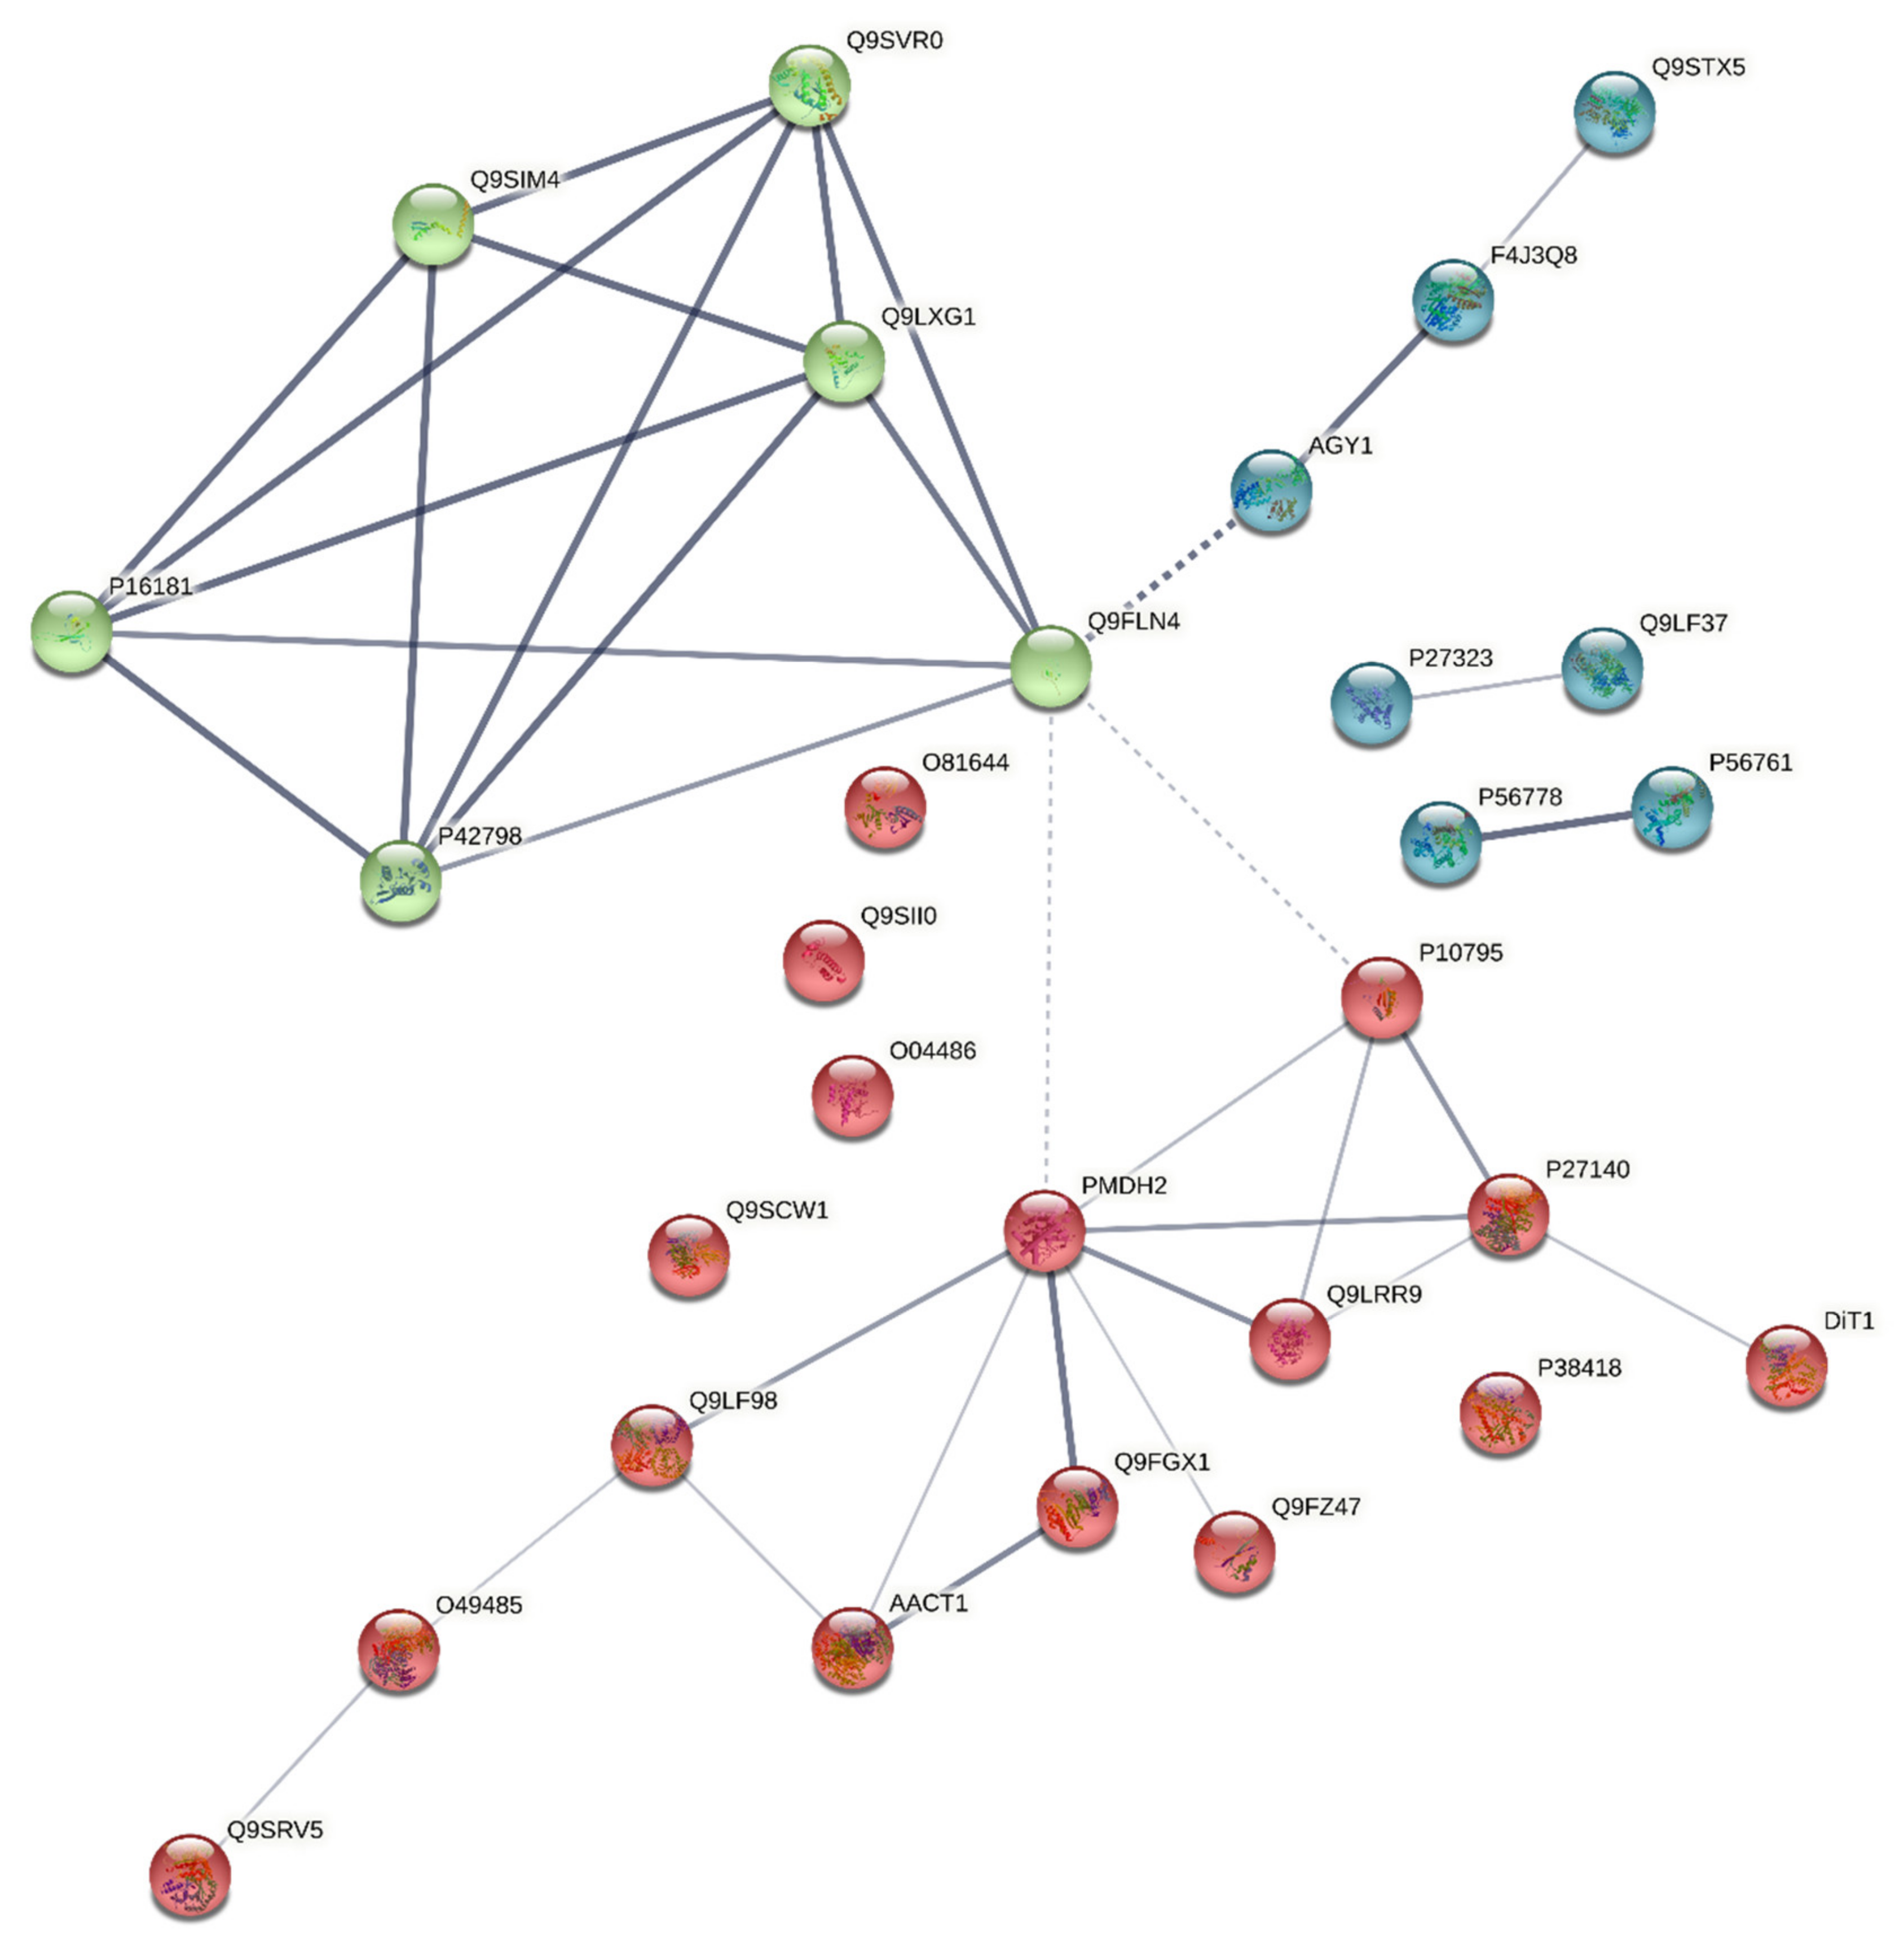
3.3. Harmonisation between the PPI Network and the Coverage Problem Approach

Looking to the coverage problem approach, based on the quantification level of the proteins, a correspondence between the biological processes enrolled in the clusters of the PPI network and some proteins of the optimal set S-R3 stand out. In Table 5, we considered protein synthesis, photosynthesis, and glyoxylate and dicarboxylate metabolism that stand out in the PPI network. We also present their quantification levels for six, two, and four proteins, respectively, for the six control and six inoculated samples. Each of these biological processes includes 36, 12, and 24 measurements of quantification levels for each type of samples, given that each biological process includes p proteins, thus, it has N quantification level measures, for the control and for the inoculated samples, where N = 6 × p .
Regarding the quantification abundance level of the six proteins, with a full match to the green cluster in the PPI network, we see that the control and inoculated samples present opposite behaviours. For the control samples, 91% of quantifications have less (58%) or neutral (33%) abundance, while 80% of quantifications for the inoculated samples have more (61%) or neutral (19%) abundance.
The group of proteins belonging to photosynthesis is also very clear; 100% of quantifications for the control samples show more (50%) or neutral (50%) abundance, while 100% of quantifications for the inoculated samples have less (58%) or neutral (42%) abundance. Proteins P56761 (EC:1.10.3.9) and P56778 from the blue cluster in the PPI network are components of photosystem II (PSII) that uses light energy to abstract electrons from water, generating molecular oxygen and a proton gradient subsequently used for ATP formation. The altered production of these proteins is a sign that the infection of Q. suber roots by P. cinnamomi interfere with the photosynthetic process that occurs in the leaves and in cells distant from the site of infection. Necrosis of the host roots caused by P. cinnamomi infection and the disappearance of the thinner roots limit water uptake by the plant, and the inefficient functioning of photosystem II may be related to water availability. With regard to plant–pathogen interactions, there is also evidence of the disruption of photosystem II functioning during plant–bacteria interactions resulting from the action of effector molecules. According to Torres-Zabala et al. [40], effector molecules produced by Pseudomonas syringae reprogramme the expression of nuclear-encoded chloroplast genes and inhibit photosynthetic CO2 assimilation through the disruption of photosystem II. This type of acting may well extend to oomycetes.
In the group of four proteins associated to glyoxylate and dicarboxylate metabolism included in the red cluster, 75% of quantifications have more (71%) or neutral (4%) abundance for the control samples, while 75% of quantifications for the inoculated samples have less (58%) or neutral (17%) abundance.
Therefore, we hypothesize that cork oak leaves point to a physiological state associated with an immune response resulting from the interaction with P. cinnamomi, with a focus on protein synthesis, photosynthesis, and glyoxylate and dicarboxylate metabolism biological processes when they contain:
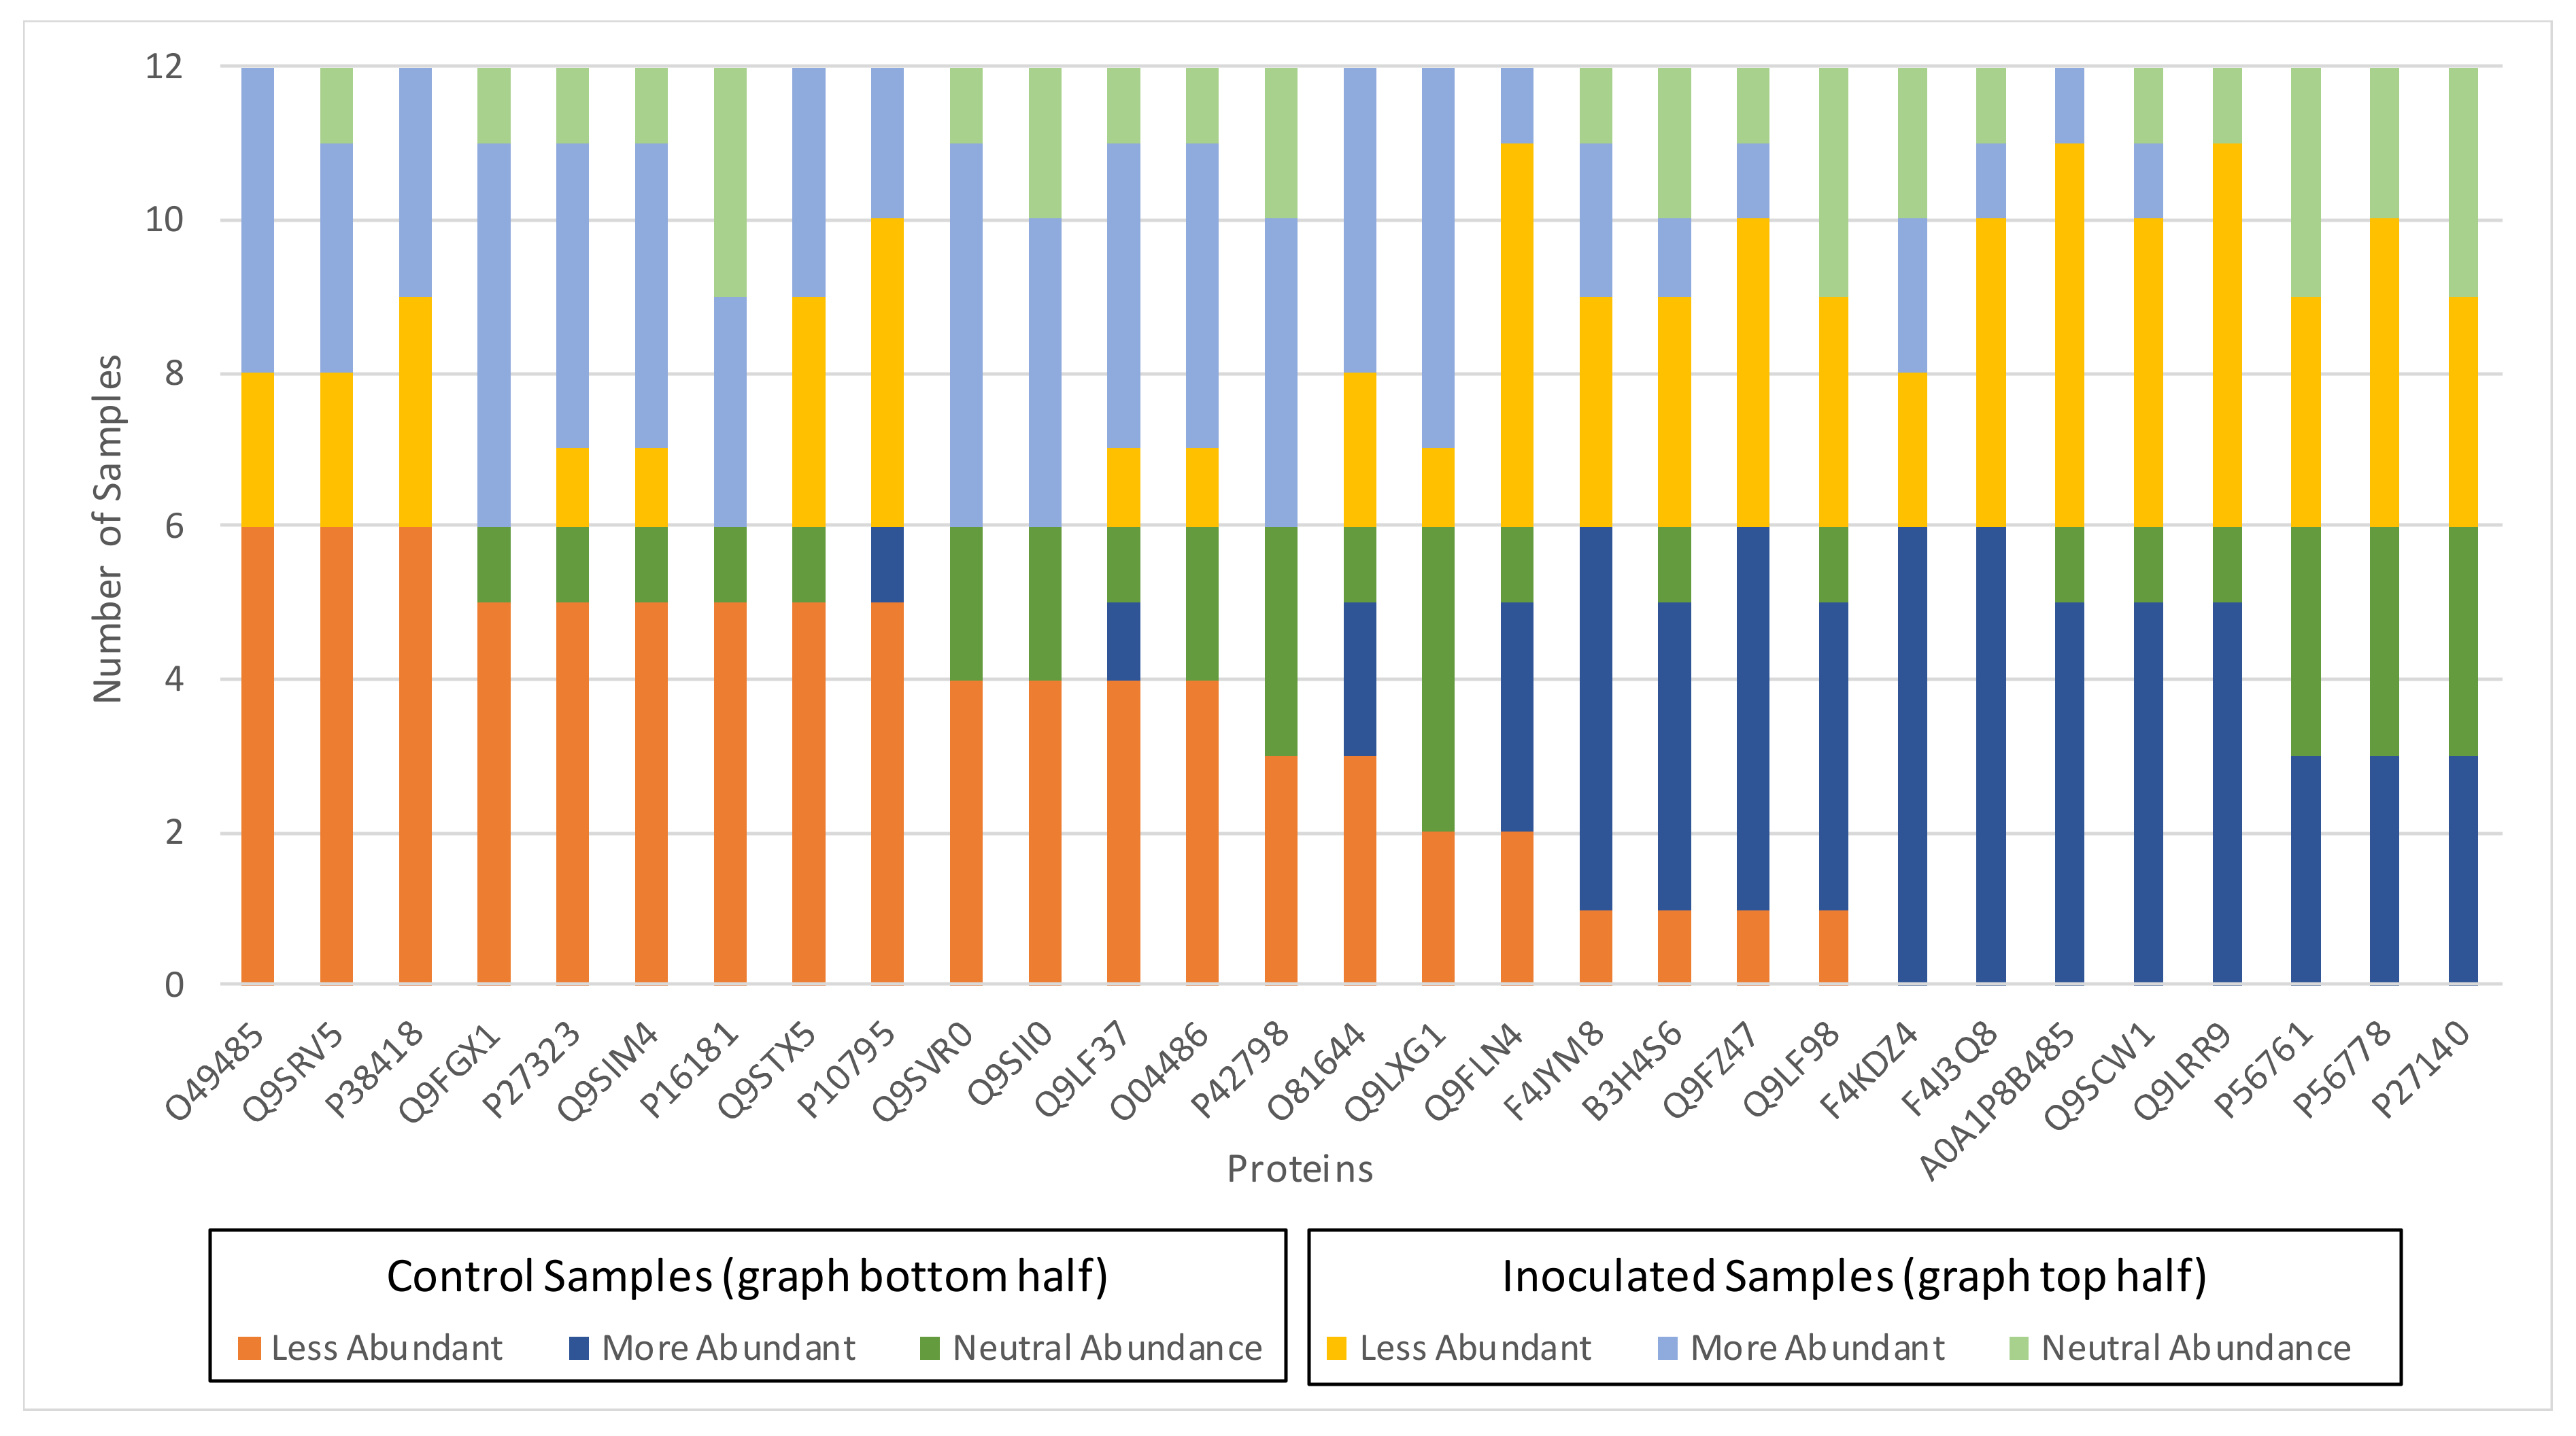
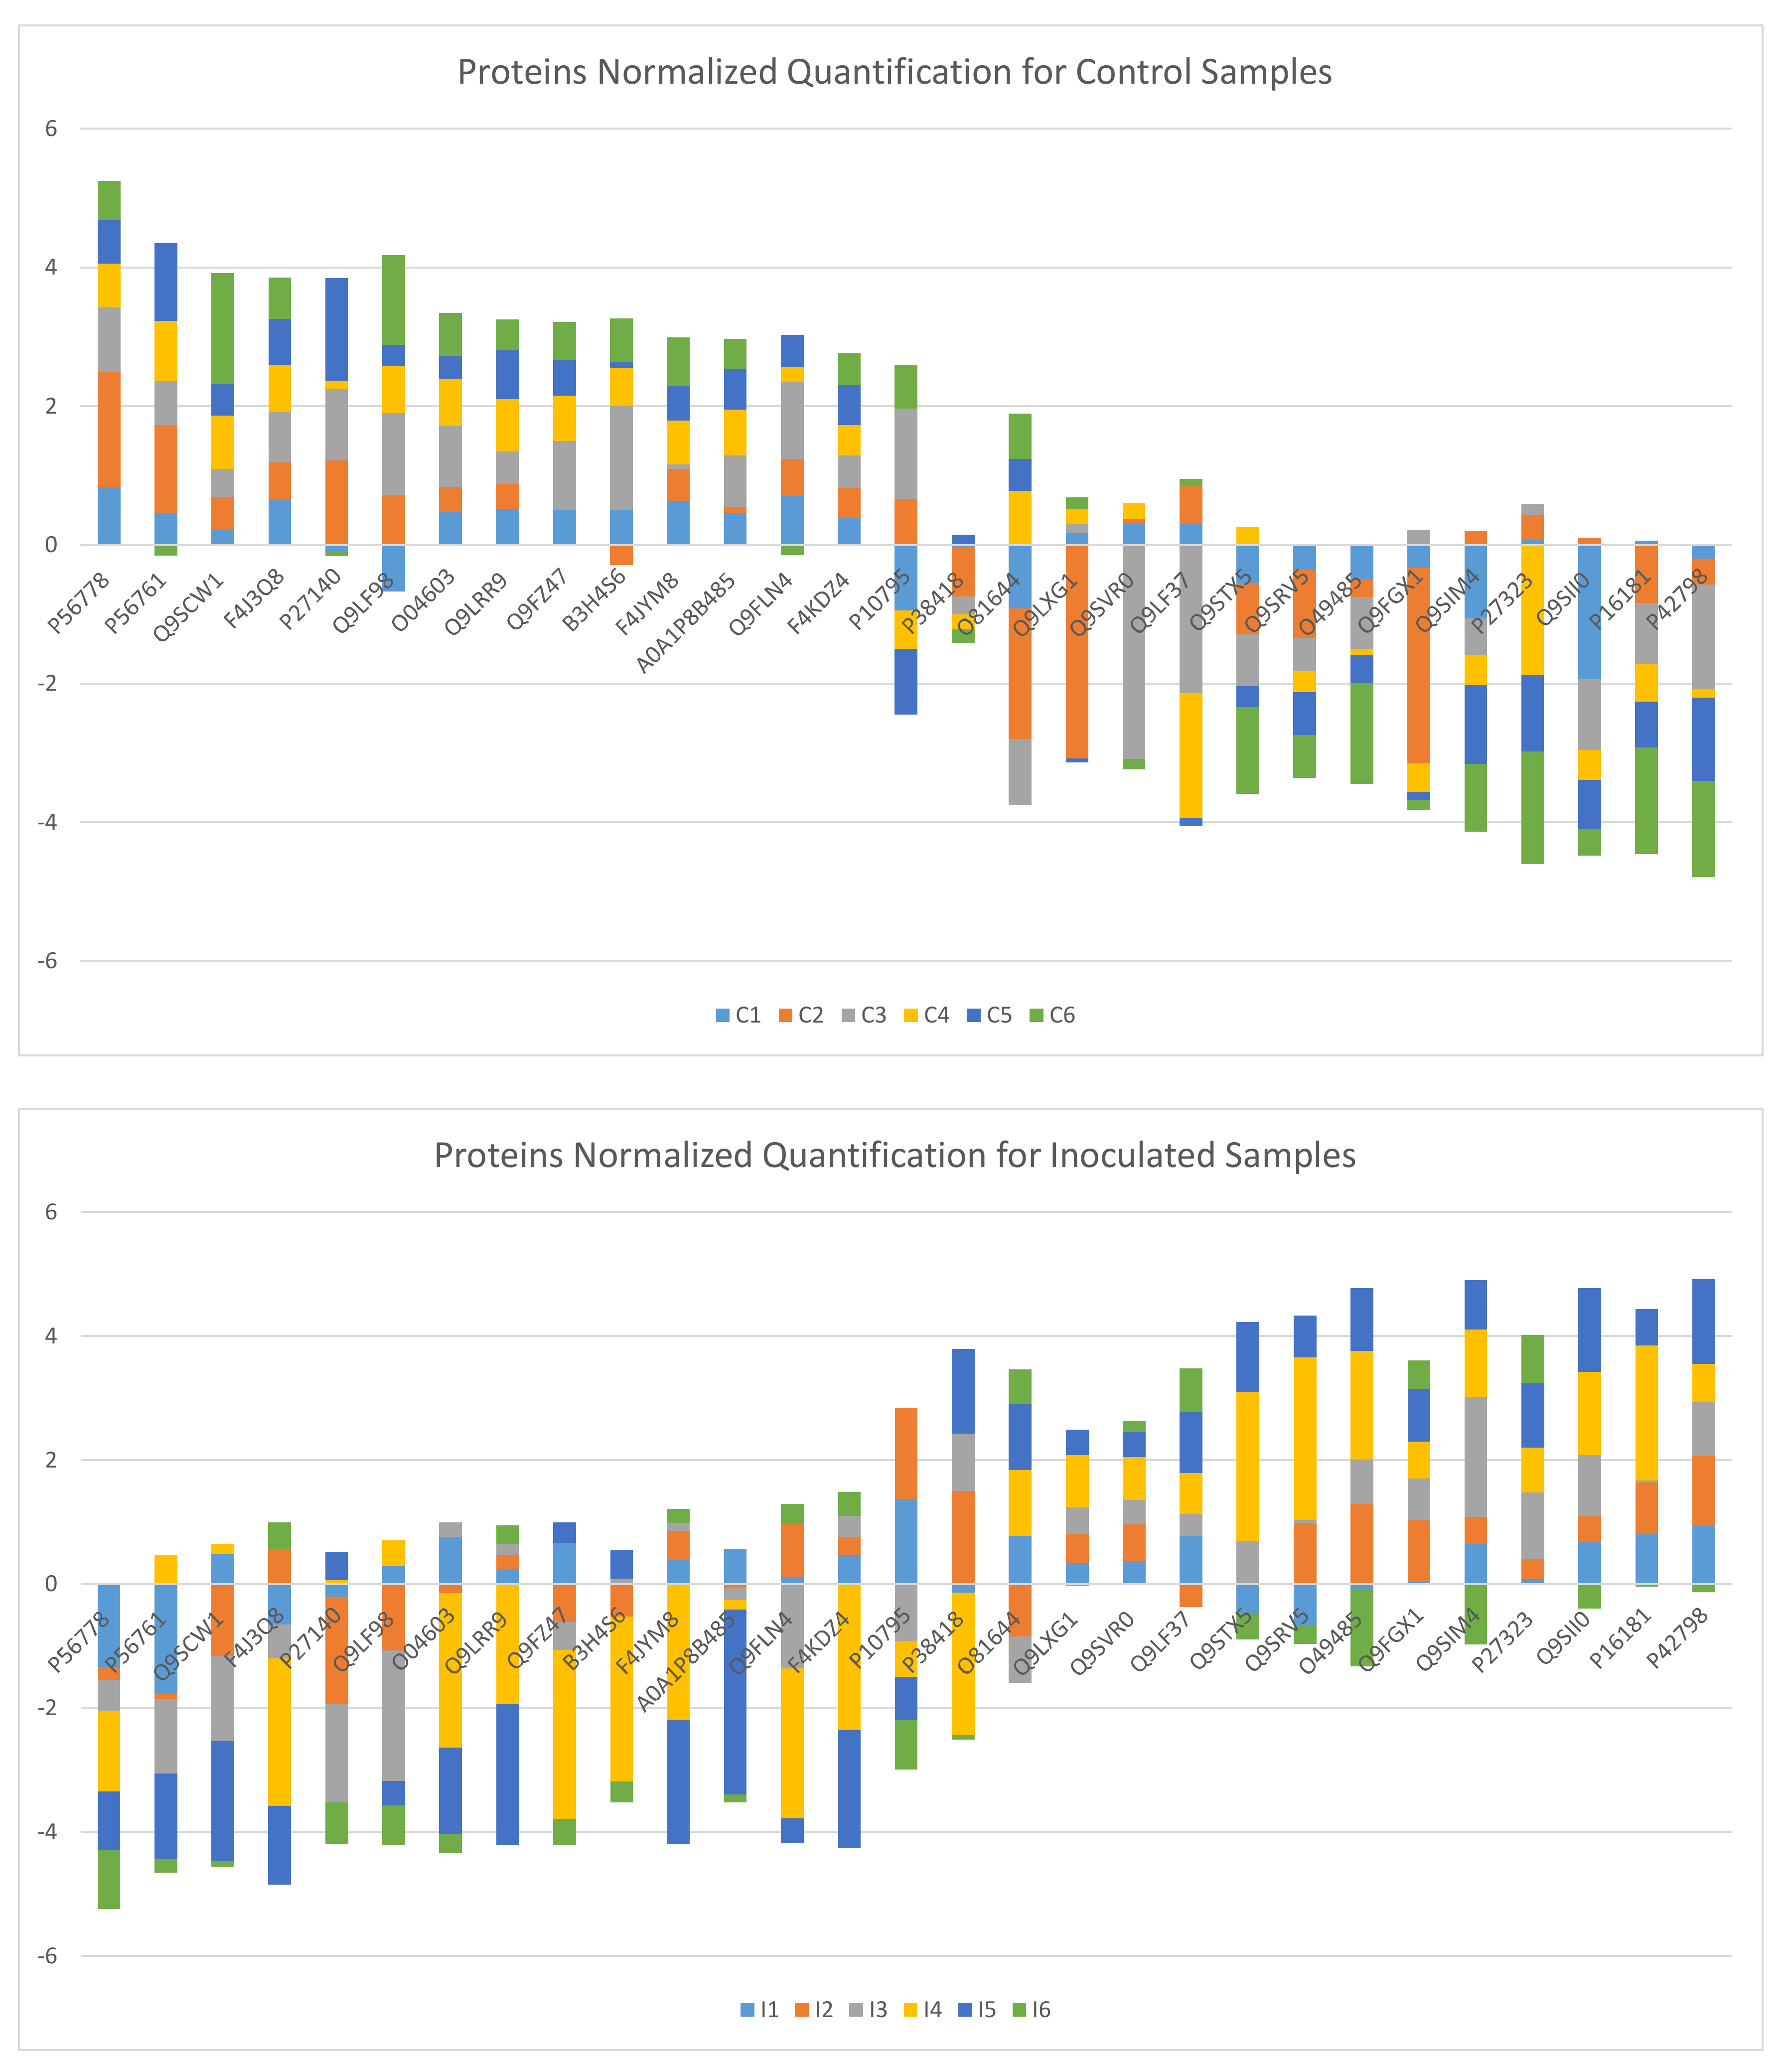
A more or neutral abundant level of the proteins P16181, P42798, Q9SIM4, Q9SVR0, Q9LXG1, and Q9FLN4;
A less or neutral abundant level of the proteins P56761 and P56778;
A less or neutral abundant level of the proteins PMDH2, AACT1, Q9LRR9, and P10795.

4. Conclusions

The α, β-k-Feature Set Problem approach, applied to the group of proteins (80) previously identified as being associated with the cork oak immune response to inoculation by P. cinnamomi, allowed finding several subsets of proteins (solutions of the problem) that separate the control plants from the inoculated plants. These protein subsets are examples of molecular markers of the homeostatic state of cork oak plants that are in interaction with the oomycete. The best solution found (S-R3) includes 29 proteins highly connected between them in a network of protein–protein interactions, comprising three clusters uncovered through STRING analysis. These clusters are linked to each other through pivotal proteins that act as eventual regulators of the functioning of the whole group. Particularly noteworthy are the proteins Q9FLN4-50S ribosomal protein L27 (RK27), PMDH2-Malate dehydrogenase (FAKDZ4/PMDH2), P10795-ribulose bisphosphate carboxylase small chain 1A (RBS1A/RBCS1A), and A0A1P8B485-protein translocase subunit Sec A (AGY1). Interference with the production of these proteins may compromise protein synthesis, photosynthesis, chloroplast biogenesis, and glyoxylate and dicarboxylate metabolism.
An early diagnosis of the biochemical changes that occur in cork oaks in natural stands associated with infection by P. cinnamomi will contribute to the recognition of this pathogen as a real threat to cork oak ecosystems and will also allow the identification of trees with immunological profiles of resistance or tolerance. Monitoring the vegetative status of trees using protein molecular markers can greatly assist in the management of cork oak stands, helping producers to identify plants that interact with P. cinnamomi but do not die suddenly or show observable signs of decline (asymptomatic). We hypothesize that these 29 markers may be decisive for detecting trees that go into decline due to interactions with the pathogen, assisting the management of cork oak forest ecosystems.

Author Contributions

Conceptualization, A.C.C. and G.S.; methodology, G.S. and A.C.C.; formal analysis, A.C.C. and G.S.; investigation, A.C.C. and G.S.; resources, A.C.C. and G.S.; writing—original draft preparation, A.C.C. and G.S.; writing—review and editing, A.C.C. and G.S.; funding acquisition, A.C.C. and G.S. All authors have read and agreed to the published version of the manuscript.

Funding

This research was funded by Fundação para a Ciência e a Tecnologia (FCT), grant number UIDB/00631/2020 CEOT BASE and grant number UIDB/00631/2020 CEOT PROGRAMÁTICO.

Data Availability Statement

The data used in this study are openly available in PRIDE repository with the dataset identifier PXD21455.

Conflicts of Interest

The authors declare no conflict of interest.

References

  1. Ávila, J.M.; Linares, J.C.; García-Nogales, A.; Sánchez, M.E.; Gomez-Aparicio, L. Across-scale patterning of plant–soil–pathogen interactions in Quercus suber decline. Eur. J. For. Res. 2017, 136, 677–688. [Google Scholar] [CrossRef]
  2. Camilo-Alves, C.D.E.P.; da Clara, M.I.E.; Ribeiro, N.M.C.D. Decline of Mediterranean oak trees and its association with Phytophthora cinnamomi: A review. Eur. J. For. Res. 2013, 132, 411–432. [Google Scholar] [CrossRef]
  3. Lopéz-Tirado, J.; Hidalgo, P.J. Predictive modelling of climax oak trees in southern Spain: Insights in a scenario of global change. Plant Ecol. 2016, 217, 451–463. [Google Scholar] [CrossRef]
  4. Acha, A.; Newing, H.S. Cork Oak Landscapes, Promised or Compromised Lands? A Case Study of a Traditional Cultural Landscape in Southern Spain. Hum. Ecol. 2015, 43, 601–611. [Google Scholar] [CrossRef]
  5. Acácio, V.; Dias, F.; Catry, F.X.; Rocha, M.; Moreira, F. Landscape dynamics in Mediterranean oak forests under global change: Understanding the role of anthropogenic and environmental drivers across forest types. Glob. Change Biol. 2017, 23, 1199–1217. [Google Scholar] [CrossRef] [PubMed]
  6. Duque-Lazo, L.; Navarro-Cerrillo, R.M.; Ruíz-Gómez, F.J. Assessment of the future stability of cork oak (Quercus suber L.) afforestation under climate change scenarios in Southwest Spain. For. Ecol. Manag. 2018, 409, 444–456. [Google Scholar] [CrossRef]
  7. Ibáñez, B.; Gómez-Aparicio, L.; Ávila, J.M.; Pérez-Ramos, I.M.; Marañón, T. Effects of Quercus suber Decline on woody Plant Regeneration: Potential Implications for Successional Dynamics in Mediterranean Forests. Ecosystems 2017, 20, 630–644. [Google Scholar] [CrossRef] [Green Version]
  8. Sánchez, M.E.; Caetano, P.; Ferraz, J.; Trapero, A. Phytophthora disease of Quercus ilex in southwestern Spain. For. Pathol. 2002, 32, 5–18. [Google Scholar] [CrossRef]
  9. Cardillo, E.; Abad, E.; Meyer, S. Iberian oak decline caused by Phytophthora cinnamomi: A spatiotemporal analysis incorporating the effect of host heterogeneities at landscape scale. For. Pathol. 2021, 00, e12667. [Google Scholar] [CrossRef]
  10. Serrano, M.S.; Rios, P.; Gonzalez, M.; Sánchez, M.E. Experimental minimum threshold for Phytophthora cinnamomi root disease expression on Quercus suber. Phytopathol. Mediterr. 2015, 54, 461–464. [Google Scholar] [CrossRef]
  11. Sghaier-Hammami, B.; Valero-Galvàn, J.; Romero-Rodríguez, M.C.; Navarro-Cerrillo, R.M.; Abdelly, C.; Jorrín-Novo, J. Physiological and proteomics analyses of Holm oak (Quercus ilex subsp. ballota [Desf.] Samp.) responses to Phytophthora cinnamomi. Plant Physiol. Biochem. 2013, 71, 191–202. [Google Scholar] [CrossRef]
  12. Coelho, A.C.; Pires, R.; Schütz, G.; Santa, C.; Manadas, B.; Pinto, P. Disclosing proteins in the leaves of cork oak plants associated with the immune response to Phytophthora cinnamomi inoculation in the roots: A long-term proteomics approach. PLoS ONE 2021, 16, e0245148. [Google Scholar] [CrossRef]
  13. Gómez-Aparicio, L.; Domínguez-Begines, J.; Kardol, P.; Ávila, J.M.; Ibáñez, B.; Garcia, L.V. Plant-soil feedbacks in declining forests: Implications for species coexistence. Ecology 2017, 98, 1908–1921. [Google Scholar] [CrossRef] [Green Version]
  14. Costa, C.; Madeira, M.; Plieninger, T. Cork oak woodlands patchiness: A signature of imminent deforestation? Appl. Geogr. 2014, 54, 18–26. [Google Scholar] [CrossRef]
  15. Vanhove, M.; Pina-Martins, F.; Coelho, A.C.; Branquinho, C.; Costa, A.; Batista, D.; Silva, A.; Sousa, P.; Marques, I.; Belkadi, B.; et al. Using Gradient Forest to predict climate response and adaptation in Cork Oak. J. Evol. Biol. 2021, 34, 910–923. [Google Scholar] [CrossRef]
  16. Ramírez-Valiente, J.A.; Valladares, F.; Aranda, I. Exploring the impact of neutral evolution on intrapopulation genetic differentiation in functional traits in a long-lived plant. Tree Genet. Genomes 2014, 10, 1181–1190. [Google Scholar] [CrossRef]
  17. Inventário Florestal Nacional (6º IFN); ICNF—Instituto de Conservação da Natureza e das Florestas: Lisboa, Portugal, 2015.
  18. Lancia, G.; Mathieson, L.; Moscato, P. Separating sets of strings by finding matching patterns is almost always hard. Theor. Comput. Sci. 2017, 665, 73–86. [Google Scholar] [CrossRef] [Green Version]
  19. Rocha de Paula, M.; Berretta, R.; Moscato, P. A fast meta-heuristic approach for the (α, β)-k-feature set problem. J. Heuristics 2016, 22, 199–220. [Google Scholar] [CrossRef]
  20. Berretta, R.; Mendes, A.; Moscato, P. Selection of discriminative genes in microarray experiments using mathematical programming. J. Res. Pract. Inf. Technol. 2007, 39, 287–299. [Google Scholar]
  21. Mendes, A.; Scott, R.J.; Moscato, P. Microarrays-identifying molecular portraits for prostate tumors with different Gleason patterns. In Clinical Bioinformatics Methods in Molecular Medicine; Trent, R.J., Ed.; Humana Press: Totowa, NJ, USA, 2008; Volume 141, pp. 131–151. [Google Scholar] [CrossRef]
  22. Arefin, A.; Inostroza-Ponta, M.; Mathieson, L.; Berretta, R.; Moscato, P. Clustering nodes in large-scale biological networks using external memory algorithms. In Algorithms and Architectures for Parallel Processing; Springer: Berlin/Heidelberg, Germany, 2011. [Google Scholar] [CrossRef]
  23. Gómez Ravetti, M.; Moscato, P. Identification of a 5-protein biomarker molecular signature for predicting Alzheimer’s disease. PLoS ONE 2008, 3, e3111. [Google Scholar] [CrossRef] [Green Version]
  24. Gómez Ravetti, M.; Rosso, O.A.; Berretta, R.; Moscato, P. Uncovering molecular biomarkers that correlate cognitive decline with the changes of hippocampus’ gene expression profiles in Alzheimer’s disease. PLoS ONE 2010, 5, e10153. [Google Scholar] [CrossRef] [Green Version]
  25. Berretta, R.; Costa, W.; Moscato, P. Combinatorial optimization models for finding genetic signatures from gene expression datasets. Methods Mol. Biol. 2008, 453, 363–377. [Google Scholar] [CrossRef]
  26. Rosso, O.A.; Mendes, A.; Berretta, R.; Rostas, J.A.; Hunter, M.; Moscato, P. Distinguishing childhood absence epilepsy patients from controls by the analysis of their background brain electrical activity (II): A combinatorial optimization approach for electrode selection. J. Neurosci. Methods 2009, 181, 257–267. [Google Scholar] [CrossRef]
  27. Cotta, C.; Sloper, C.; Moscato, P. Evolutionary search of thresholds for robust feature set selection: Application to the analysis of microarray data. In Applications of Evolutionary Computing; EvoWorkshops, Raidl, G.R., Cagnoni, S., Branke, J., Wolfe Corne, D., Drechsler, R., Jin, Y., Johnson, C.G., Machado., O., Marchiori, E., et al., Eds.; Springer: Berlin/Heidelberg, Germany, 2004; Volume 3005, pp. 21–30. [Google Scholar]
  28. Davies, S.; Russell, S. NP-completeness of searches for smallest possible feature sets. In Proceedings of the AAAI Symposium on Relevance; Greiner, R., Subramanian, D., Eds.; AAAI Press: New Orleans, CA, USA, 1994; pp. 41–43. [Google Scholar]
  29. Richard, M.K. Reducibility among combinatorial problems. In Complexity of Computer Computations; Miller, R.E., Thatcher, J.W., Eds.; Plenum: New York, NY, USA, 1972; pp. 85–103. [Google Scholar]
  30. Vizcaíno, J.A.; Csordas, A.; Del-Toro, N.; Dianes, J.A.; Griss, J.; Lavidas, I.; Mayer, G.; Perez-Riverol, Y.; Reisinger, F.; Ternent, T.; et al. 2016 update of the PRIDE database and its related tools. Nucleic Acids Res. 2016, 44, D447–D456. [Google Scholar] [CrossRef]
  31. STRING: Functional Protein Associations Networks. Available online: http://string-db.org (accessed on 28 February 2022).
  32. Szklarczyk, D.; Gable, A.L.; Lyon, D.; Junge, A.; Wyder, S.; Huerta-Cepas, J.; Simonovic, M.; Doncheva, N.T.; Morris, J.H.; Bork, P.; et al. STRING v11: Protein–protein association networks with increased coverage, supporting functional discovery in genome-wide experimental datasets. Nucleic Acids Res. 2019, 47, D607–D613. [Google Scholar] [CrossRef] [Green Version]
  33. KEGG: Kyoto Encyclopedia of Genes and Genomes. Available online: http://www.kegg.jp (accessed on 3 May 2022).
  34. Romani, I.; Tadini, L.; Rossi, F.; Masiero, S.; Pribil, M.; Jahns, P.; Kater, M.; Leister, D.; Pesaresi, P. Versatile roles of Arabidopsis plastid ribosomal proteins in plant growth and development. Plant J. 2012, 72, 922–934. [Google Scholar] [CrossRef]
  35. Liu, D.; Gong, Q.; Ma, Y.; Li, P.; Li, J.; Yang, S.; Yuan, L.; Yu, Y.; Pan, D.; Xu, F.; et al. cpSecA, a thylakoid protein translocase subunit, is essential for photosynthetic development in Arabidopsis. J. Exp. Bot. 2010, 61, 1655–1669. [Google Scholar] [CrossRef] [Green Version]
  36. Yuan, J.; Henry, R.; McCaffery, M.; Cline, K. SecA homolog in protein transport within chloroplasts: Evidence for endosymbiont-derived sorting. Science 1994, 266, 796–798. [Google Scholar] [CrossRef]
  37. Pracharoenwattana, I.; Cornah, J.E.; Smith, S.M. Arabidopsis peroxisomal malate dehydrogenase functions in b-oxidation but not in the glyoxylate cycle. Plant J. 2007, 50, 381–390. [Google Scholar] [CrossRef]
  38. Hu, J.; Baker, A.; Bartel, B.; Linka, N.; Mullen, R.T.; Reumann, S.; Zolman, B.K. Plant Peroxisomes: Biogenesis and Function. Plant Cell 2012, 24, 2279–2303. [Google Scholar] [CrossRef] [PubMed] [Green Version]
  39. Ortega-Galisteo, A.P.; Rodríguez-Serrano, M.; Pazmiño, D.M.; Gupta, D.K.; Sandalio, L.M.; Romero-Puertas, M.C. S-Nitrosylated proteins in pea (Pisum sativum L.) leaf peroxisomes: Changes under abiotic stress. J. Exp. Bot. 2012, 63, 2089–2103. [Google Scholar] [CrossRef] [PubMed]
  40. Torres-Zabala, M.; Littlejohn, G.; Jayaraman, S.; Studholme, D.; Bailey, T.; Lawson, T.; Tillich, M.; Licht, D.; Bölter, B.; Delfino, L.; et al. Chloroplasts play a central role in plant defence and are targeted by pathogen effectors. Nat. Plants 2015, 1, 15074. [Google Scholar] [CrossRef] [PubMed]
Figure 1. Graph representation of the α, β-k-FSP for the example given in Table 1 and Table 2.
Forests 13 00940 g001
Figure 2. Optimum solution of the α, β-k-FSP (a) for α = β = 1 and (b) α = β = 2.
Forests 13 00940 g002
Figure 3. Venn diagrams, considering the optimum solutions (number of proteins) obtained for the 5 neutral ranges R1 to R5. The left diagram includes R1 to R3 solutions and the other includes R3 to R5.
Forests 13 00940 g003
Figure 4. Stacked columns for the quantification level of the optimal protein set.
Forests 13 00940 g004
Figure 5. Stacked columns for the normalized quantification level of the optimal protein set for control samples (up) and inoculated samples (down).
Forests 13 00940 g005
Figure 6. PPI network of the S-R3 protein set. Coloured network nodes represent proteins and edges represent protein–protein associations. In this scheme, twenty-four proteins are connected by 36 edges and 16 proteins have more than two connections.
Forests 13 00940 g006
Figure 7. The PPI network of the S-R3 protein set was constructed using the k-means clustering method and shows 3 clusters identified by the colours green, blue, and red. Line thickness expresses the degree of confidence (from zero to one) associated with the interactions between proteins. Blue cluster proteins are functionally associated with photosynthesis; red cluster proteins are associated mainly to glyoxylate and dicarboxylate metabolism, carbon fixation in photosynthetic organisms, and citrate cycle; and green cluster proteins are associated with ribosome.
Forests 13 00940 g007
Figure 8. KEGG map for metabolic pathways of glyoxylate and dicarboxylate metabolism. Malate dehydrogenase (EC:1.1.1.37; PMDH2) is associated to methylaspartate cycle and is colored in pink; thiolase family protein (EC:2.3.1.9; AACT1) are signed in yellow and is associated to ethylmalonyl pathway of terpenoid synthesis; and proteins (S)-2-hydroxy-acid oxidase GLO1 (EC:1.1.3.15; Q9LRR9) and ribulose bisphosphate carboxylase small chain 1A (EC:4.1.1.39; P10795) are associated to photorespiration and are marked in green.
Forests 13 00940 g008
Table 1. Data for a small example.
DProteins (P)
p 1 p 2 p 3 p 4 p 5 T
Samples (C) c 1 00110Control
c 2 01101Control
c 3 10101Inoculated
c 4 11011Inoculated
Table 2. Matrices A and B for the data of Table 1.
Proteins (P)
p 1 p 2 p 3 p 4 p 5
Sample pairsA
c 1 , c 3 10011
c 1 , c 4 11101
c 2 , c 3 11000
c 2 , c 4 10110
B
c 1 , c 2 10100
c 3 , c 4 10001
Table 3. Optimum values obtained for the α, β-k-feature set problem.
R1R2R3R4R5
μ ± 0.05 μμ ± 0.075 μμ ± 0.1 μμ ± 0.125 μμ ± 0.15 μ
Bio/statistical significative proteins8080808080
Alpha (α)1611865
Beta (β)1815954
Optimum number of proteins (k)5147292016
Table 4. Description of the optimum set of proteins (S) for R3 range (S-R3).
SProtein Information a
R3
Arabidopsis
UniProt
Accession
Protein NameInitial
P1618140S ribosomal protein S11-1RS111
P4279840S ribosomal protein S15a-1R15A1
Q9STX5Endoplasmin homologENPL
P10795Ribulose bisphosphate carboxylase small chain 1ARBS1A/RBCS1A
Q9SIM460S ribosomal protein L14-1RL141
Q9LF37Chaperone proteinClpB3
F4J3Q8P-loop containing nucleoside triphosphate hydrolases superfamilyF4J3Q8
Q9SII0Probable histone H2A variant 2H2AV2
Q9LRR9(S)-2-hydroxy-acid oxidase GLO1GLO1/GOX1
Q9LXG140S ribosomal protein S9-1RS91
Q9SVR060S ribosomal protein L13a-3R13A3
P56761Photosystem II D2 PSBD
F4JYM8Thiolase family proteinF4JYM8/AACT1
O04486Ras-related protein RABA2a
Q9FZ47ACT domain-containing protein ACR11 ACR11
P38418Lipoxygenase 2 LOX 2
Q9FLN450S ribosomal protein L27 RK27
Q9FGX1ATP-citrate synthase beta chain protein 2 ACLB2
Q9SRV55-methyltetrahydropteroyltriglutamate-homocysteine methyltransferase 2METE2
P27140Beta carbonic anhydrase 1 BCA1
Q9SCW1Beta-galactosidase 1 BGAL1
B3H4S6Dicarboxylate transporter 1DiT1
O49485D-3-phosphoglycerate dehydrogenase 1 SERA1
Q9LF98Fructose-bisphosphate aldolase 8 ALFC8/FBA8
P27323Heat shock protein 90-1 HSP90-1
F4KDZ4Malate dehydrogenase FAKDZ4/PMDH2
P56778Photosystem II CP43 reaction center protein PSBC
A0A1P8B485Protein translocase subunit Sec A AGY1
O81644Villin-2 VILI2
a UniProt accession codes, protein name, and protein initials arise from the annotation using the Arabidopsis proteome database as a reference.
Table 5. Biological processes that stand out from the S-R3 solution in the cover problem approach.
Biological ProcessArabidopsis UniProt AccessionNumber (N) and Relative Frequency (f) of Abundance Quantifications
Control SamplesInoculated Samples
LessMoreNeutralLessMoreNeutral
Protein synthesisP16181; P42798
Q9SIM4; Q9SVR0
Q9LXG1; Q9FLN4
N
f
21
0.58
3
0.08
12
0.33
7
0.19
22
0.61
7
0.19
PhotosynthesisP56778; P56761N
f
0
0.0
6
0.5
6
0.5
7
0.58
0
0.0
5
0.42
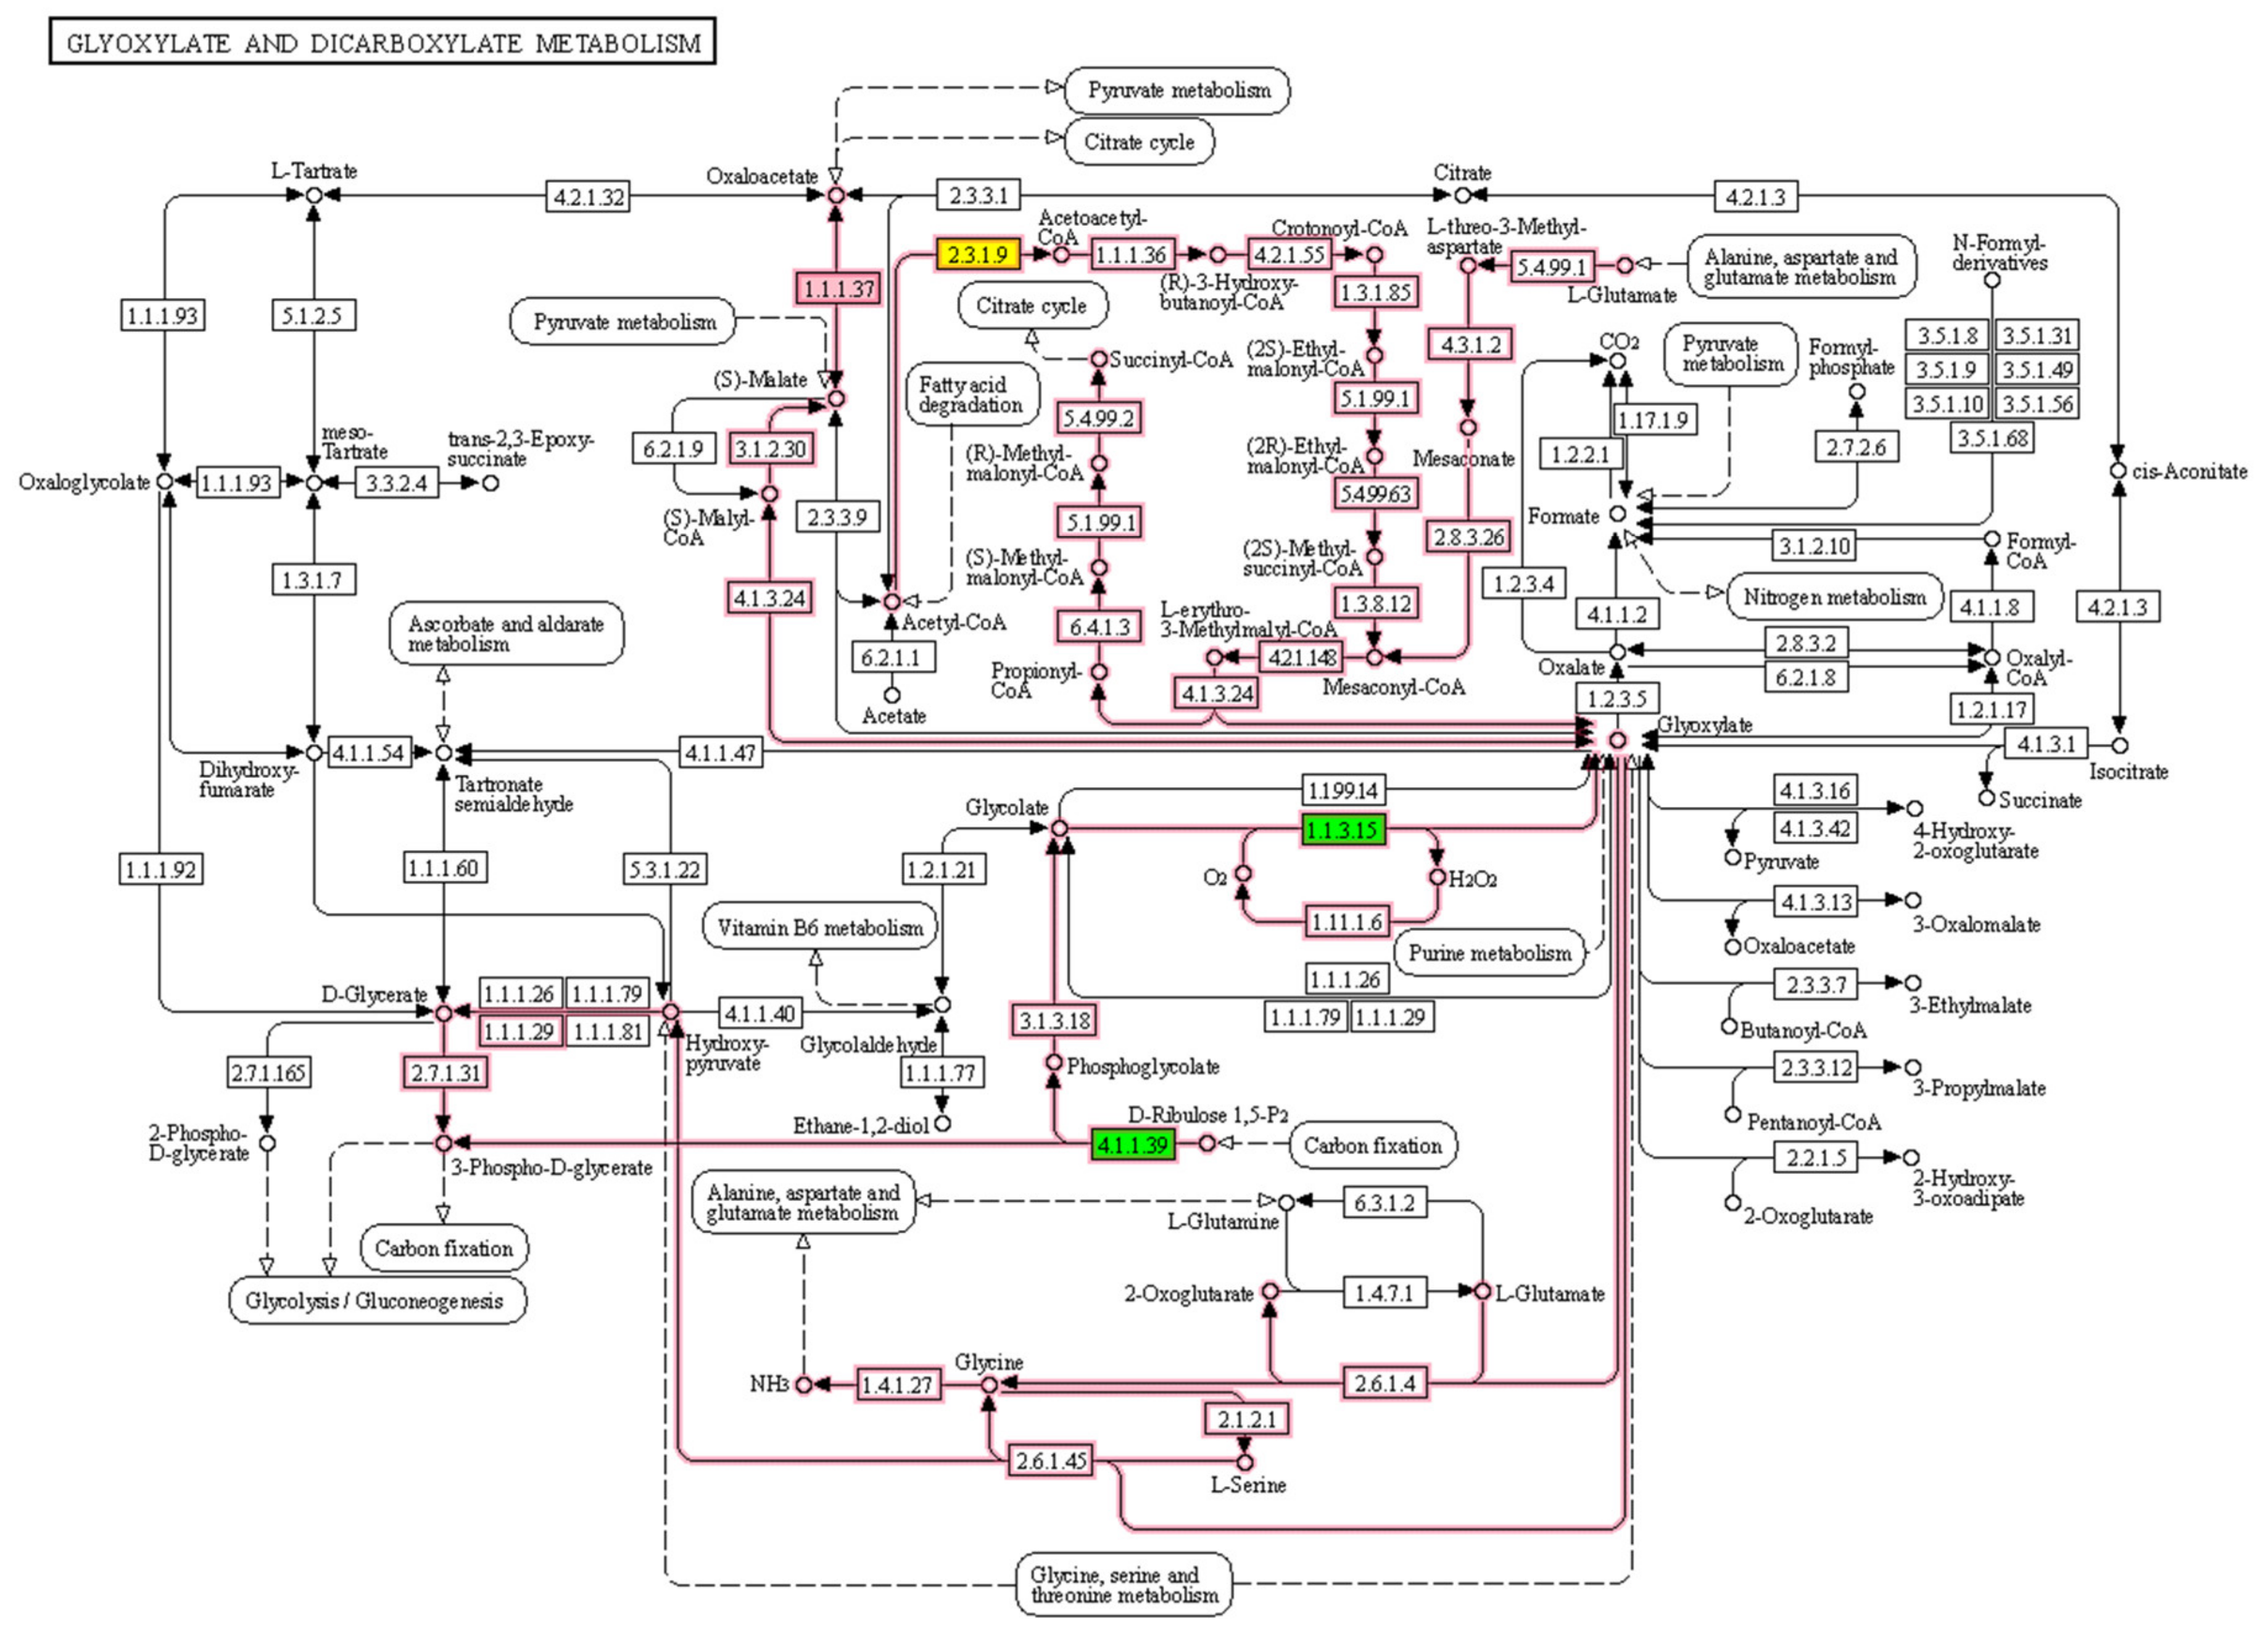
Glyoxylate and
dicarboxylate
metabolism
PMDH2; AACT1; Q9LRR9; P10795N
f
6
0.25
17
0.71
1
0.04
14
0.58
6
0.25
4
0.17
Publisher’s Note: MDPI stays neutral with regard to jurisdictional claims in published maps and institutional affiliations.

