
Audio-Visual Preferences for the Exercise-Oriented Population in Urban Forest Parks in China


1
Department of Tourism Management, South China University of Technology, Guangzhou 510006, China
2
State Key Laboratory of Subtropical Building Science, Guangzhou 510641, China
3
Key Laboratory of Digital Village and Sustainable Development of Culture and Tourism, Guangzhou 510641, China
4
Guangdong Tourism Strategy and Policy Research Center, Guangzhou 510641, China
*
Author to whom correspondence should be addressed.
Forests 2022, 13(6), 948; https://0-doi-org.brum.beds.ac.uk/10.3390/f13060948
Submission received: 21 May 2022
/
Revised: 12 June 2022
/
Accepted: 14 June 2022
/
Published: 17 June 2022
(This article belongs to the Special Issue Soundscape in Urban Forests)
Abstract
:The purpose of this study is to explore the audio-visual preferences of exercisers in urban forest parks in China and to make practical suggestions for park landscape design. Taking Beigushan Forest Park in Lianyungang City, Jiangsu Province as a case, based on field research and questionnaire survey, this study analyzed the audio-visual preference characteristics of exercisers in the park, revealed the correlation between audio-visual preference and exercisers’ behaviors and individual characteristics, and explored the influence of audio-visual preferences on exercise feelings by establishing a structural equation model. It was found that (1) the forest and its avenue landscape and birdsong are most preferred by exercisers; (2) the audio-visual preferences of people with different exercise forms differ, for example, people who slowly walk, run, and briskly walk have stronger preferences for natural soundscape and visual landscape, while people who use fitness equipment have stronger inclusiveness for human activity sound and prefer public facility-based landscapes. In addition, some individual characteristics such as exercise intensity and exercise frequency significantly affect exercisers’ audio-visual preferences; (3) visual landscape preferences have a greater direct impact on exercise feelings, with natural waterscape having the greatest direct impact, but overall soundscape preferences do not have a high degree of direct impact on exercise feelings, with natural sound still having a strong positive impact. These findings provide a more quantitative basis for the landscape design of urban forest parks from the perspective of exercise behavior.
1. Introduction
As a new type of park arising from urbanization in the era of ecological civilization [1], urban forest parks have multiple functions such as recreation, recuperation, and avoiding the heat, which help improve air quality [2], reduce noise [3], and provide a pleasant environment for people to promote physical and mental health development [4]. Forest parks can meet the needs of urban residents for environment, leisure, and sports, thus attracting an increasing number of urban residents for physical exercise close to nature [5]. In China, where urbanization is accelerating, the relationship between the health level and quality of life of urban residents and urban forest parks has become increasingly important [6], especially in the context of COVID-19, where the demand for parks and outdoor green spaces has increased rather than decreased [7]. Studies have shown that physical exercise in green spaces can release stress and enhance the body’s ability to fight infectious diseases [7,8,9]. Therefore, it can be predicted that in the future, the demand for forest parks and exercise activities will continue to grow and more urban residents can benefit from the services of forests and parks [10]. In this context, exercisers in urban forest parks and their audio-visual preferences become the focus of this study.
In the studies on exercise behavior in urban forest parks, many scholars have devoted their research to exploring the main factors that influence the attractiveness and satisfaction of exercise in parks. For example, Li et al. found that open activity space with waterscape, landscape sketch, can attract more people toward exercise activities [11]; McCormack et al. summarized qualitative studies about the relationship between park use and physical exercise and found that safety, aesthetics, park facilities, and landscape maintenance were important factors influencing satisfaction with park use [12]. Although some scholars have also emphasized the importance of individual perceptual factors in influencing park use satisfaction [13,14], the majority of scholars have focused on objective factors such as facilities and public services provided by parks, and have not paid enough attention to people’s underlying psychological motivations and preferences. Therefore, an investigation of people’s exercise satisfaction from the perspective of their visual and auditory preferences at the psychological level would provide a relevant complement to the current research on the factors influencing exercise satisfaction in parks.
People’s perceptions of the landscape initially originate from human intuitive experiences, in which people rely on their eyes to obtain 87% of the information from the outside world, and 75–90% of human activities is visually induced [15]. Studies have shown that individual visual aesthetic preferences influence people’s perceptions of ecological and aesthetic values, which further influence their behavioral choices. [16]. For example, Ma et al. explored the influence of the degree of visual landscape heterogeneity on landscape aesthetic quality and public visual perception effects [17]; Zhang et al. used eye-tracking to explore the visual preferences of different types of visitors to trail landscapes and revealed the reasons for the differences in visitors’ landscape gaze time [18]. Visual factors also affect people’s perception and evaluation of soundscapes, and the relationship between these two is the focus of this study. In this regard, many scholars have made significant research contributions. Cassina et al., proposed a linear model for predicting perceived tranquility in different environments based on visual and acoustic features [19]. Romero et al. found that visual factors such as ocean visibility can affect the perception of the soundscape quality in the areas with road traffic [20], and they also found there are color associations between people and different urban soundscapes [21]. Preis et al. found that the addition of visual information increases the noise annoyance assessment [22]. Moreover, numerous studies have also demonstrated that people’s visual preferences affect the perception of landscape and environmental behavior [23,24].
Soundscape is the acoustic environment perceived by an individual, group, or community in a given scene [25] and is highly relevant to people’s health [26]. With the increasing concern about health, urbanization, and globalization, more and more studies are focusing on soundscape. It has been shown that people’s perceptions and preferences of soundscapes can play a key role in the construction of related landscapes in urban forest parks [27]. Currently, most of the soundscape studies focus on people’s perception. Among them, scholars have found that people’s perception of soundscape is related to the type of soundscape, people’s personal preferences and sensitivities, and demographic indicators related to soundscape [28,29,30,31,32]. For example, Fang et al. found that five main dimensions of social, demographic, and behavioral attributes (age and familiarity of site, educational and economic condition, companion and type of recreational use, gender, and length of stay) were associated with people’s soundscape perceptions and preferences [33]. In addition, scholars have expanded their research in related fields, such as Hong et al. who analyzed the relationship between each soundscape element that has an impact on forest park soundscapes and its physical stimulus amount and people’s soundscape preferences [34]. Subdivided into the field of soundscape preference research, some scholars have found that natural sounds are more preferred by people [35]; some scholars have put people’s soundscape preferences in the context of COVID-19 and found that individual characteristics such as age, occupation, education level, and life happiness are the main factors affecting soundscape preferences [36]; in addition, the frequency of visits to destinations also affects people’s preferences for beautiful soundscapes [37]. Although the above studies have addressed different influencing factors of soundscape preference, few studies have focused on soundscape preference among a population with specific behaviors; therefore, the variability in soundscape preference cannot be explained in a more behavioral characteristic sense.
At present, many research results in the field of audio-visual perception are directed to the applied science fields such as medicine and engineering, but there are still few reports in the natural science fields such as landscape and ecology, as well as natural and social interdisciplinary subjects. Among the studies on landscape and ecological environment that focus on audio-visual perception, there are mostly studies on people’s single-sensory perception and preference, but there is a lack of studies on multisensory preference and its interaction. Therefore, this study investigates the audio-visual preferences of the exercisers, which will be helpful to explore and improve the research on the audio-visual field of the exercisers in urban forest parks. In this study, 406 exercisers in Beigushan Forest Park, Lianyungang, Jiangsu Province, were surveyed according to the subjective evaluation method. The purpose of this study is to explore the audio-visual preferences of exercisers in China’s urban forest parks, and to reveal the correlation between these preferences and exercisers’ behaviors and individual characteristics, so as to put forward practical suggestions for park landscape design. Unlike most previous studies, this study is novel in that it focuses on audio-visual preferences among a specific behavioral population and reveals differences in audio-visual preferences from an environmental behavioral perspective. However, the restrictions on pedestrian flow in the park under the influence of the epidemic and the impact of some precautionary measures on people’s landscape evaluation pose certain challenges to this study. Overall, the study helps to maximize the usefulness of natural resources and provide auxiliary visual and acoustic landscape design for urban forest park designers and planners, while providing better exercise experience for exercise groups and improving people’s quality of life and happiness.
This paper is divided into four parts. The method part mainly introduces the study area, questionnaire design, and field research. In the result part, firstly, the reliability and validity test results of the collected questionnaires and the statistical results of the respondents’ personal characteristics are analyzed, then the audio-visual preference characteristics of the exercisers are revealed, and the correlation between the audio-visual preferences and exercisers’ behaviors as well as their personal characteristics is discussed through correlation analysis. Finally, the influence of audio-visual preferences on the exercise feeling is explored by establishing a structural equation model. On the basis of comparing and summarizing the similarities and differences between this study and the existing scholars’ research, this discussion section explores the landscape design of urban forest parks from the perspective of exercise behavior. In the conclusion section, the full text and its important points are reviewed, while the limitations and future work of this study are also summarized.
This study explores the following issues to be addressed:
- What are the audio-visual preferences of exercisers in urban forest parks?
- What is the correlation between audio-visual preferences and exercise behavior choices and individual characteristics?
- What is the effect of each audio-visual preference on people’s exercise feelings?
2. Materials and Methods
2.1. Study Area
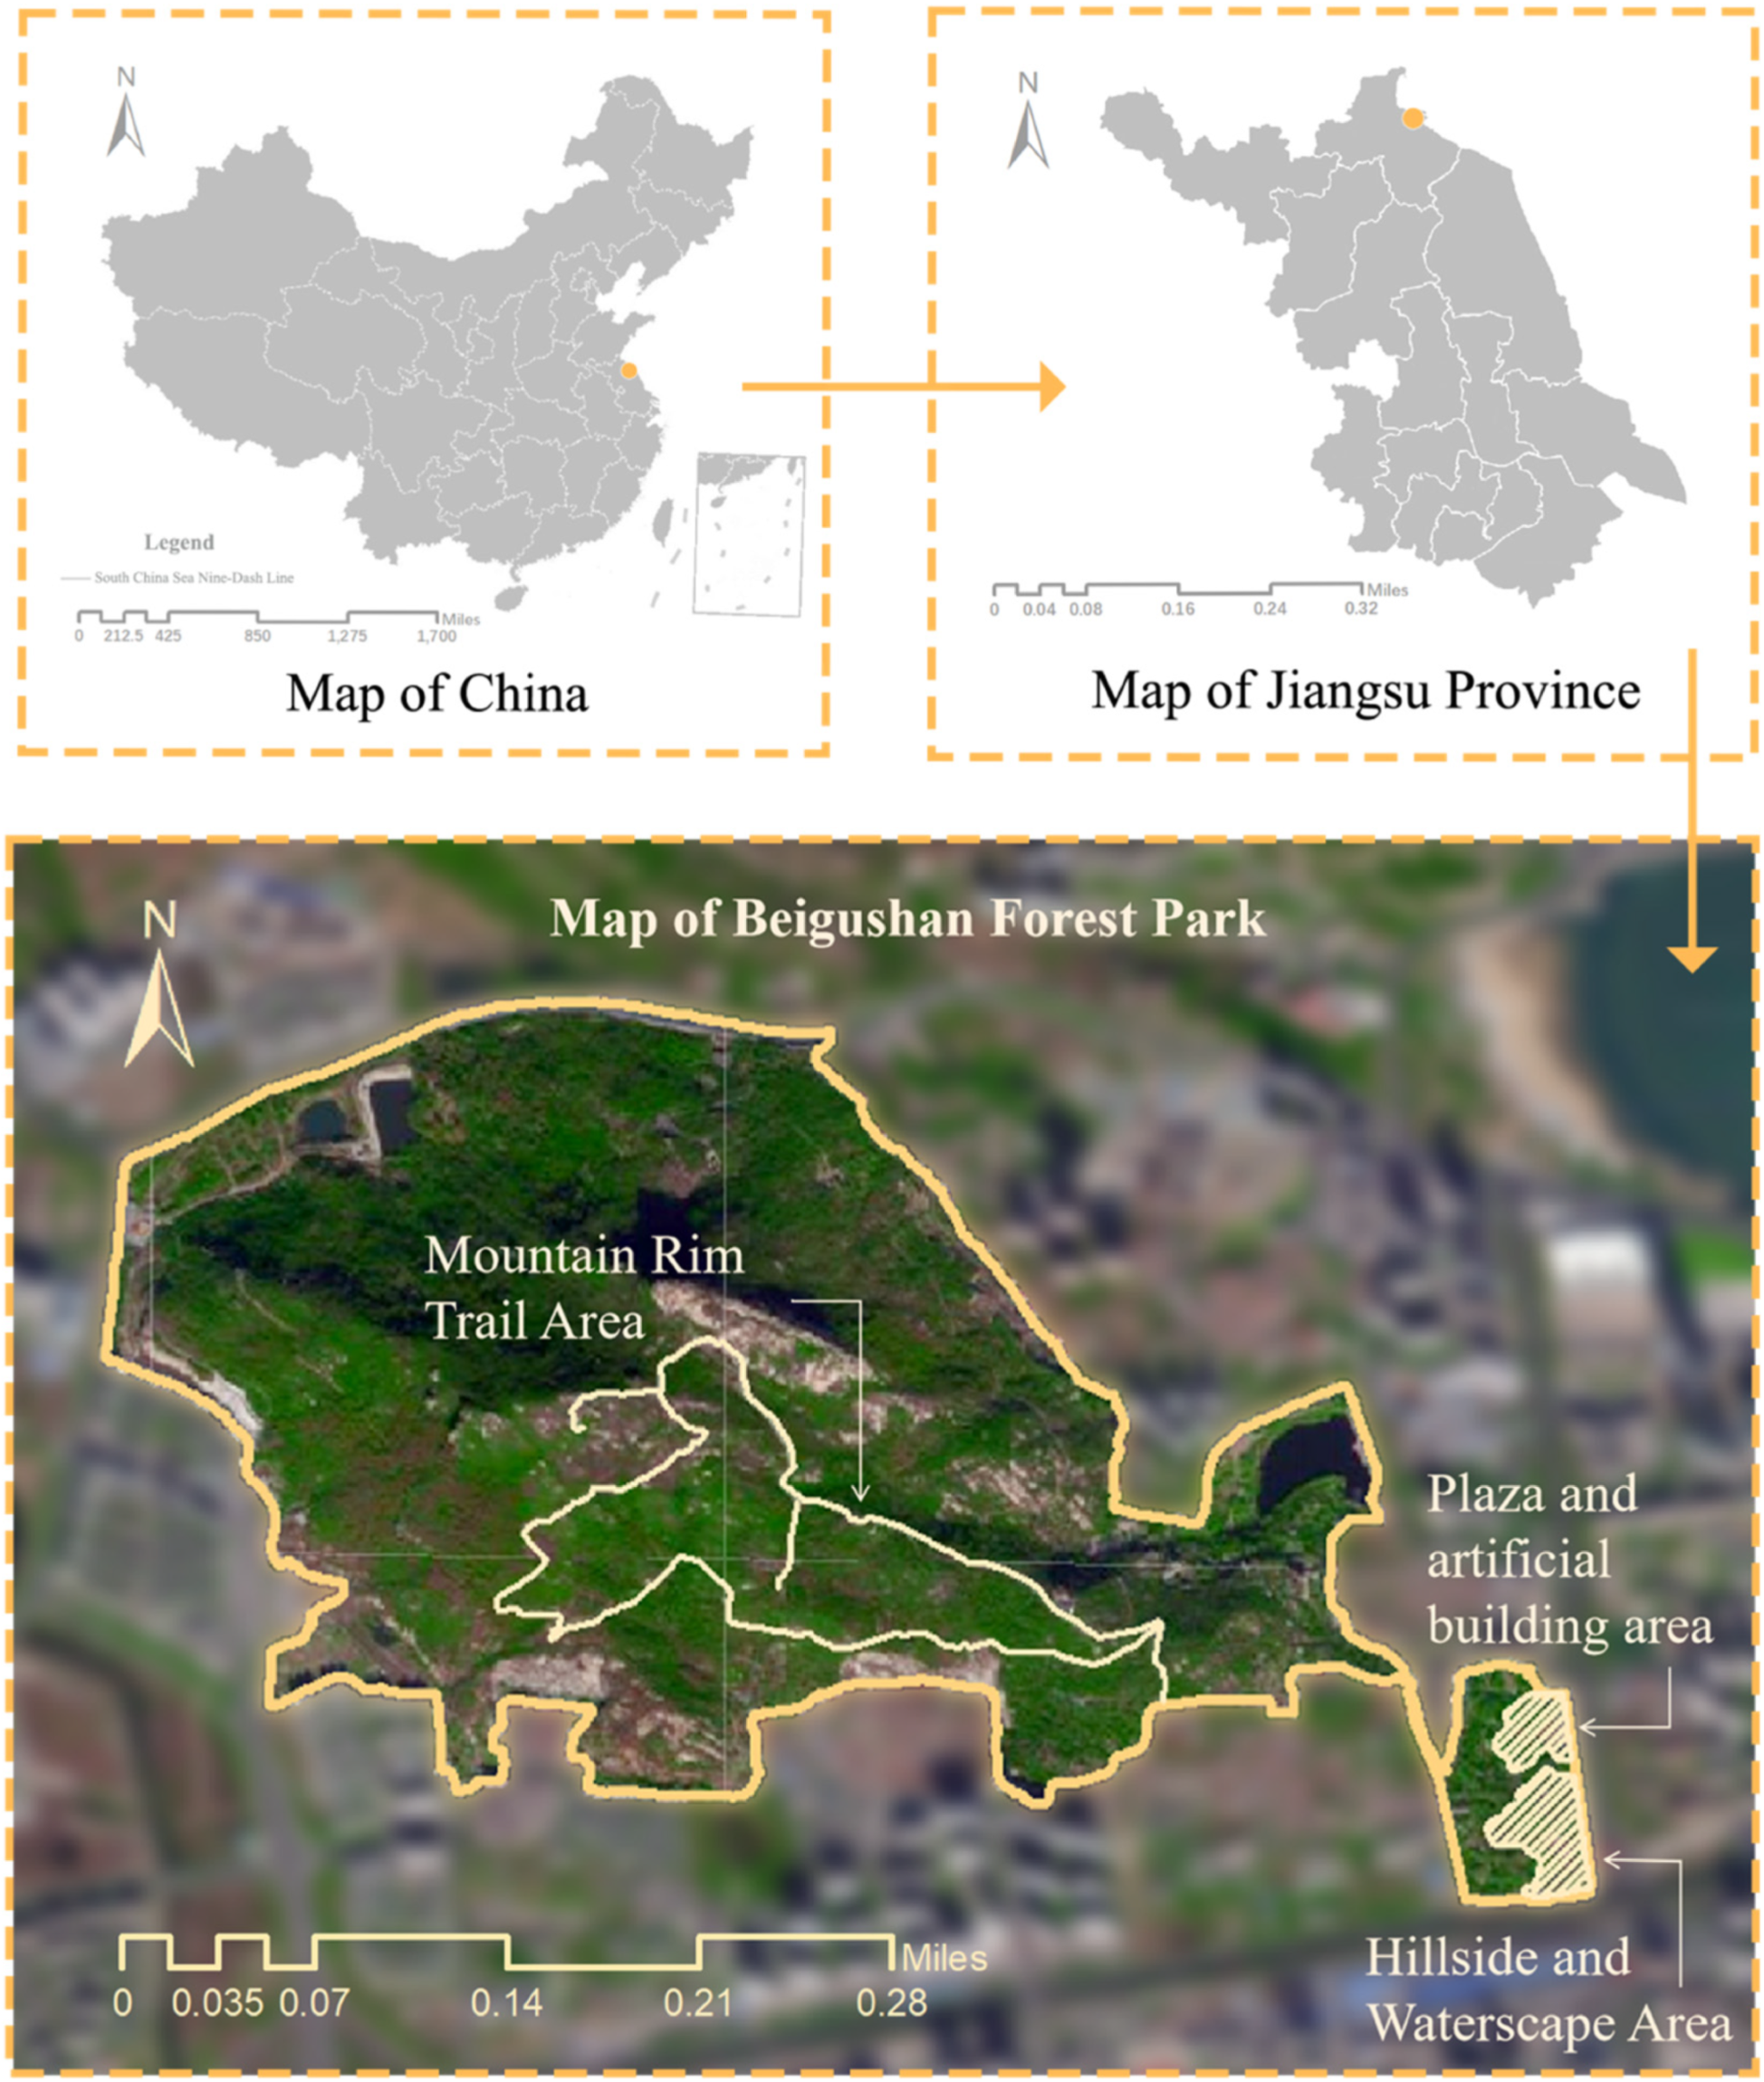
Beigushan Forest Park in Lianyungang City, Jiangsu Province, China, was selected as the case site for the study. The location map of Beigushan Forest Park is shown in Figure 1. The park has three major ecosystems: marine, forest, and wetland, with a forest coverage of 86.3%. Beigushan Forest Park is a mountainous forest park, which is the most common type of forest park in China. The average annual temperature is 14 °C, which is similar to China’s average annual temperature of 13 °C. The park has good accessibility and experiences strong demand from residents; the trail around the mountain was officially opened to the public in March 2017 with new facilities. It is 5000 m in length, which circles around Beigu Mountain, and won the “2017 Jiangsu Most Beautiful Running Route” award. The exercisers account for 19% of visitors to this park, which is comparable to the percentage of Chinese nationals exercising in urban forest parks [38], and is highly representative as a case study for this study.
Before conducting the questionnaire survey, through fieldwork, Beigushan Forest Park can be divided into a plaza and artificial building area, a hillside and waterscape area, and a mountain rim trail area. There are 17 main types of landscapes in Beigushan Forest Park, including natural waterscape (streams, ponds, and lakes), topographic landscape (lawns, avenues, hillsides, and lakesides), natural vegetation (shrubs, ornamental flowers, and forests), artificial landscape (rockery, parterres, fountains, sculptures, bridges, and pavilions), artificial facilities (fitness equipment, squares, and public buildings). We often hear 16 different kinds of sounds, including natural sounds (sound of wind, birdsong, cry of insects, rustle of leaves, and water flow sound), human activity sounds (conversational voice, sound of children playing, footstep, and exercise sound), and artificial sounds (traffic sound, entertainment sound, device music, construction noise, machine noise, and broadcast).
2.2. Questionnaire Design
Respondents were asked to fill out the questionnaires created by “Questionnaire Star” using the tablet PCs provided to them by the researchers (“Questionnaire Star” is a professional, unlimited free online questionnaire, assessment, voting platform, focusing on providing users with a powerful, user-friendly online questionnaire design; free to use the program, it provides powerful, fast, easy to use, and low-cost obvious advantages [39]. The questionnaire star program has released a total of 154 million questionnaires, which can fully meet the number of questionnaire research and question type setting requirements; https://www.wjx.cn/, accessed on 25 January 2022). In addition, the researchers also prepared a certain number of paper questionnaires for the elderly who cannot use electronic devices skillfully.
The questionnaire consisted of four parts, with 18 questions in total. The first part was designed to collect demographic information about the respondents, such as age, gender, number of participants in exercise activities, distance of residence from the target park, and activities performed in the park other than exercise; the second part focused on the exercise profile of the respondents, including exercise mode, exercise time, exercise duration, exercise frequency, driving factors for exercising, reasons for choosing the park as an exercise site, specific location of exercise, and exercise frequency. The second part focused on the respondents’ exercise patterns, exercise time, exercise duration, exercise frequency, exercise site, exercise intensity, overall feelings of exercise, and willingness to exercise in parks in the future. In the third and fourth sections, the three types that constitute a soundscape as defined by Kraus [40] (abiotic natural sounds from the physical environment, nonhuman biological sounds emitted by all organisms in a given habitat, and anthropomorphic sounds emitted by stationary and moving man-made objects) were used as the basis for classifying the types of soundscapes in the questionnaire. On this basis, the scales used in the study of landscape perception by scholars such as Zheng Zhao [41] and the scales involved in the study of urban forest park soundscape by Wei Zhao [42] and Banu Chitra [43], respectively, were used, and the scales used in this study were appropriately adjusted and modified by combining the ISO [44] definition and classification of soundscape and the actual situation of Beigushan Forest Park in Lianyungang. The third part focused on the understanding of individual visual landscape preferences, mainly using a five-point Likert scale (strongly dislike (−2), dislike (−1), average (0), like (1), and like very much (2)) to illustrate their overall preferences for visual landscapes. In the fourth section, a selection of the frequency of occurrence of 16 soundscapes and a five-point rating of the soundscapes (from very dislike (−2) to very like (2)) were included to illustrate the overall preference of respondents for common soundscapes. After a pre-research test with 20 people, the average response time was 4 min and 39 s, all of whom had no objections to answer the questionnaire questions. The relevant contents of the questionnaire are shown in Table 1.
2.3. Field Research
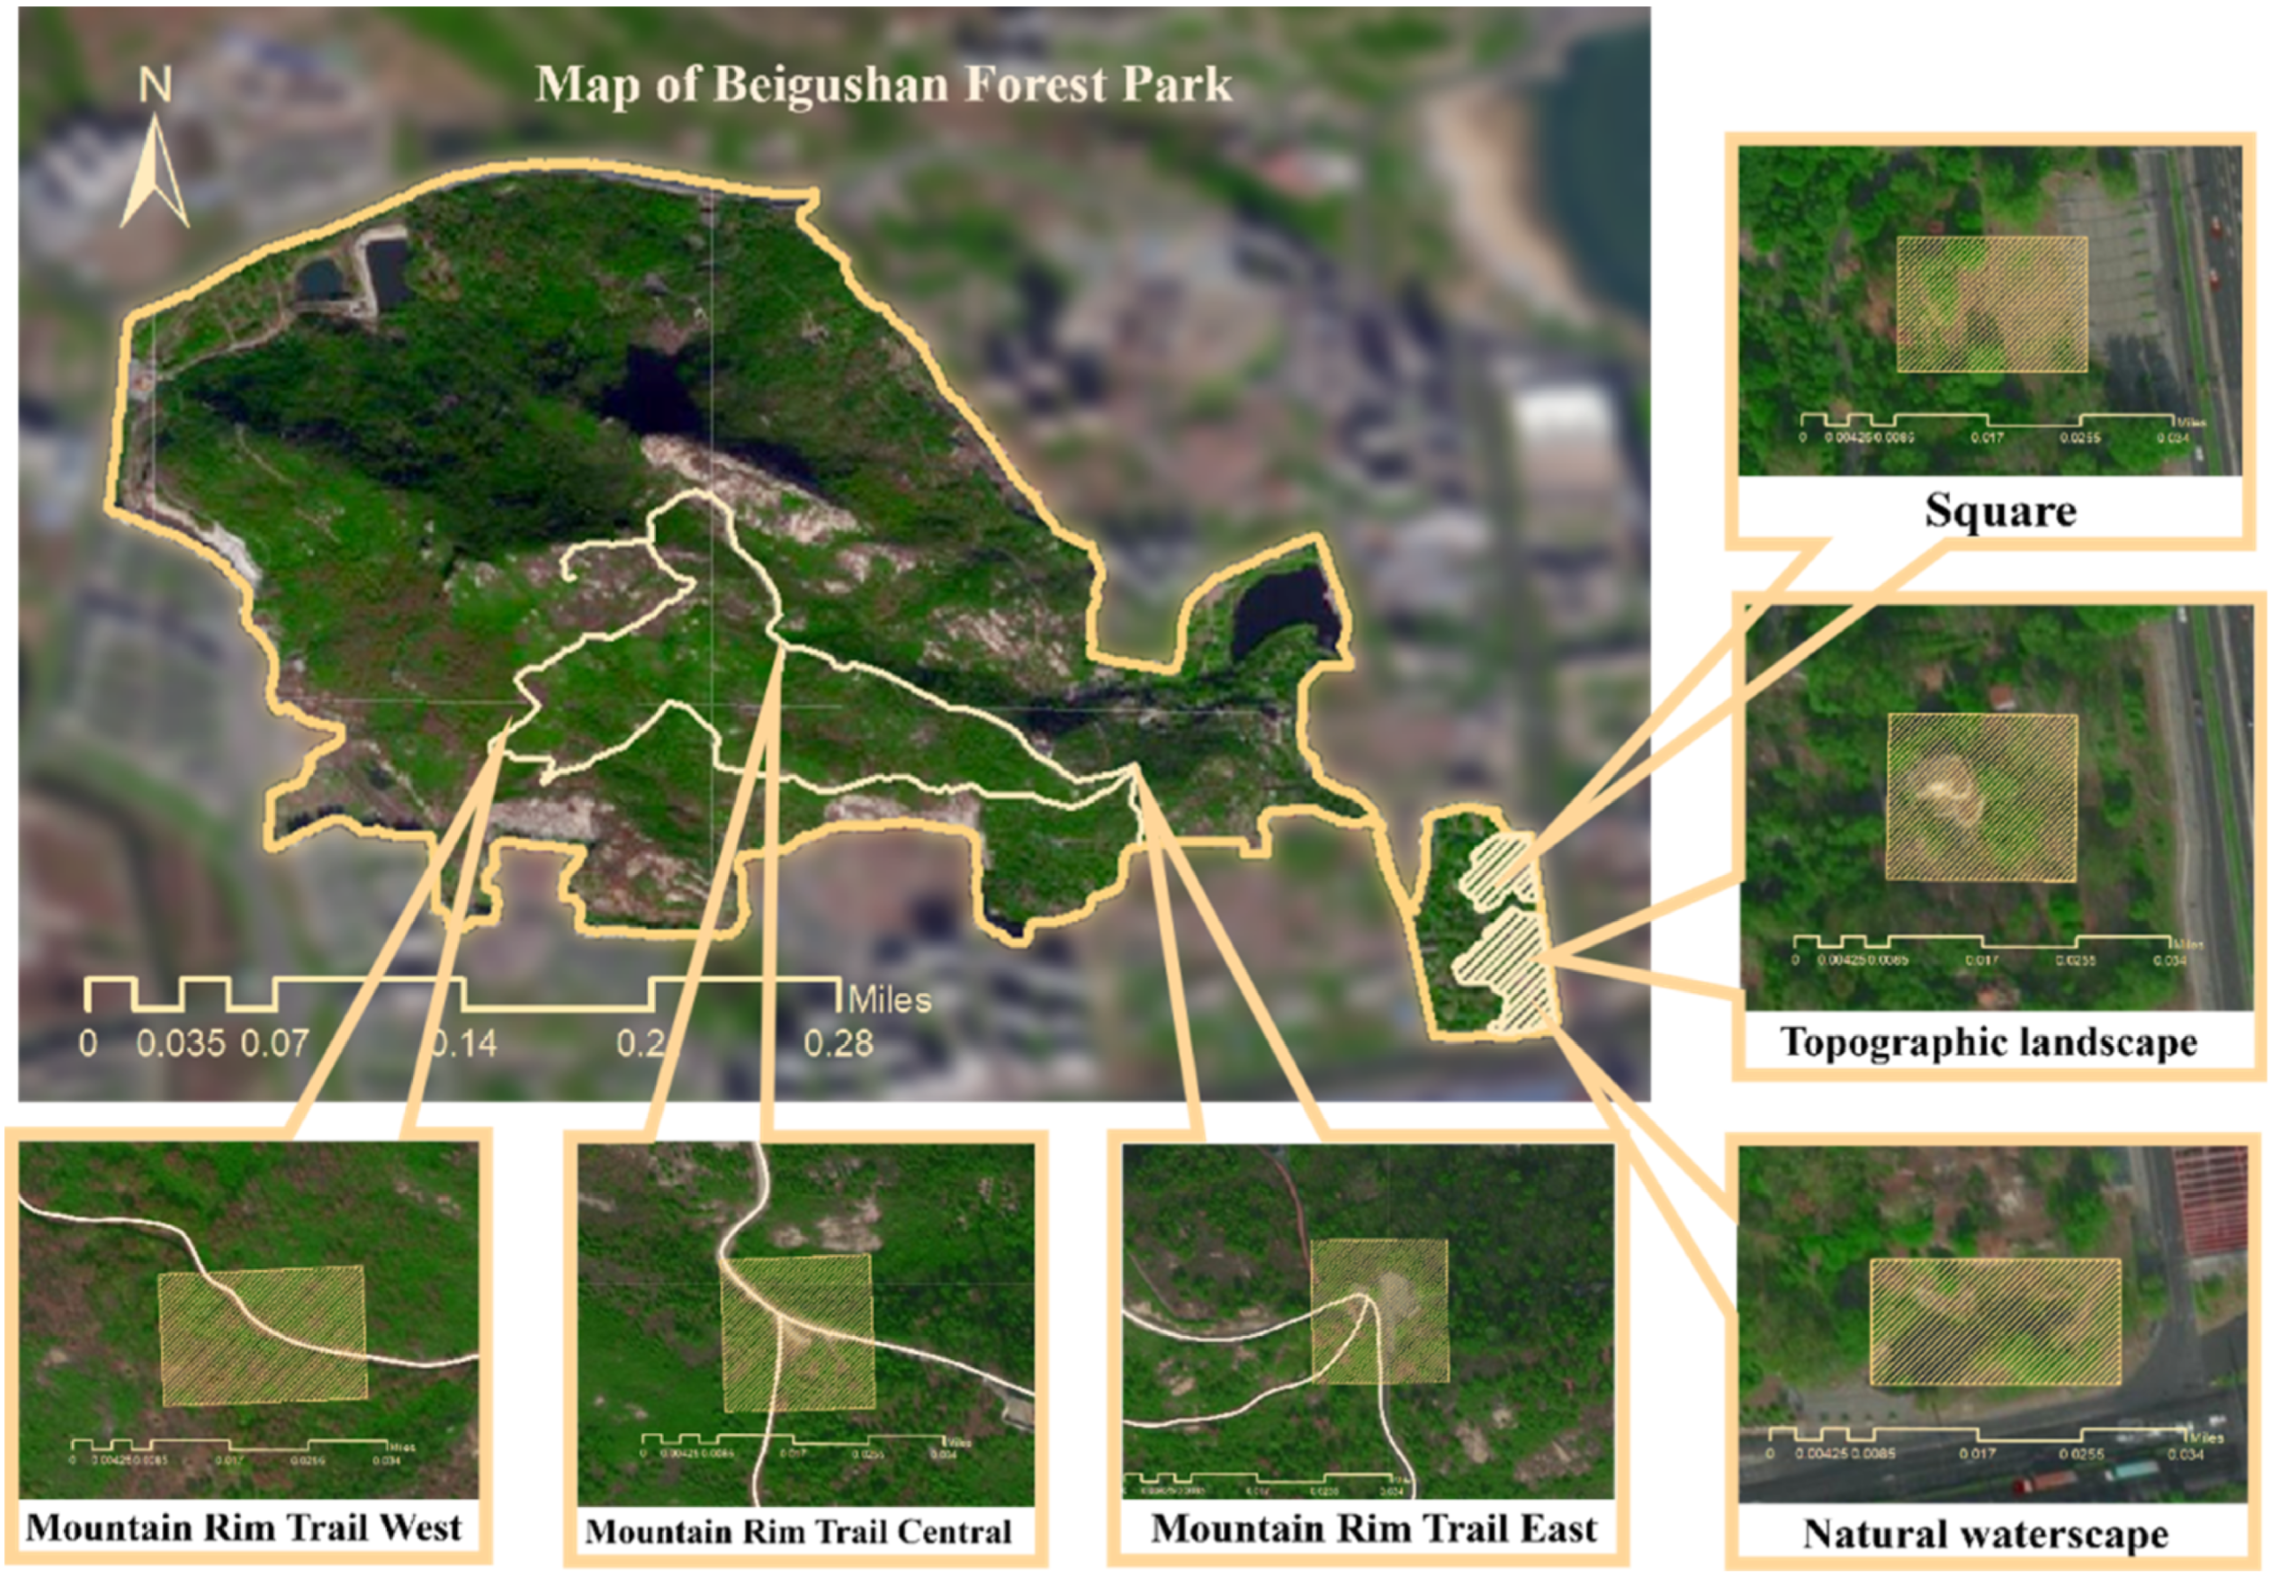
The sampling sites covered three subdivisions in the park, including three sampling sites in the mountain rim trail area, two sampling sites in the hillside and water area, and one sampling site in the plaza and artificial building area, for a total of six sampling sites, the specific locations of which are shown in Figure 2. The survey was conducted during the daytime in April 2021 under sunny weather, and each survey lasted for eight hours (from about 9:00 to 17:00); when the average temperature is about 17 °C, the climate is suitable, the vegetation is abundant, the residents are willing to travel more, and the number of exercise activities is higher. Before each part of research, attention was paid to temperature, relative humidity and wind speed, and similar weather was used for the research to avoid differences in audio-visual preferences of respondents due to climate effects. Additionally, to reduce any bias due to the selection of respondents at a specific time, each sampling site was surveyed twice on different days. The research was conducted using anonymous random interviews, where respondents were first explained the purpose and procedures of the survey, which did not mention positive or negative sounds, noise pollution, etc. They were then informed that their responses would be anonymous. To avoid distractions from other participants during their stay on the site, those who wished to participate in the survey were given a tablet containing the questionnaire and invited to fill it out individually. Respondents were invited to go to a secluded place near their location while the questionnaire was being filled out, and the ambient sound was tested using a decibel meter to ensure that there were no significant sound disturbances in the surroundings. Due to the short duration of the questionnaire and the fact that only a limited number of sounds may be present during a given time period, participants were asked to respond for the length of time chosen in the questionnaire, based on their long-term experience in the park. In addition to this, for the issue of hearing impairment, specific questioning was conducted prior to the study and observations were made to ensure that respondents did not have any significant hearing impairment.
In order to reduce the influence of the order effect on the accuracy of the questionnaire results due to the single form of questions, the researcher randomly switched the order of scoring questions to improve the accuracy of the questionnaire results before interviewing the respondents, and used the method of setting irrelevant interfering items to filter the questionnaire (eliminating the questionnaire with irrelevant interfering items), so as to guarantee the authenticity and credibility of the questionnaire results to the greatest extent. For the final collection of 406 questionnaires, the number of actual valid questionnaires was 344, and the questionnaire efficiency was 84.7%.
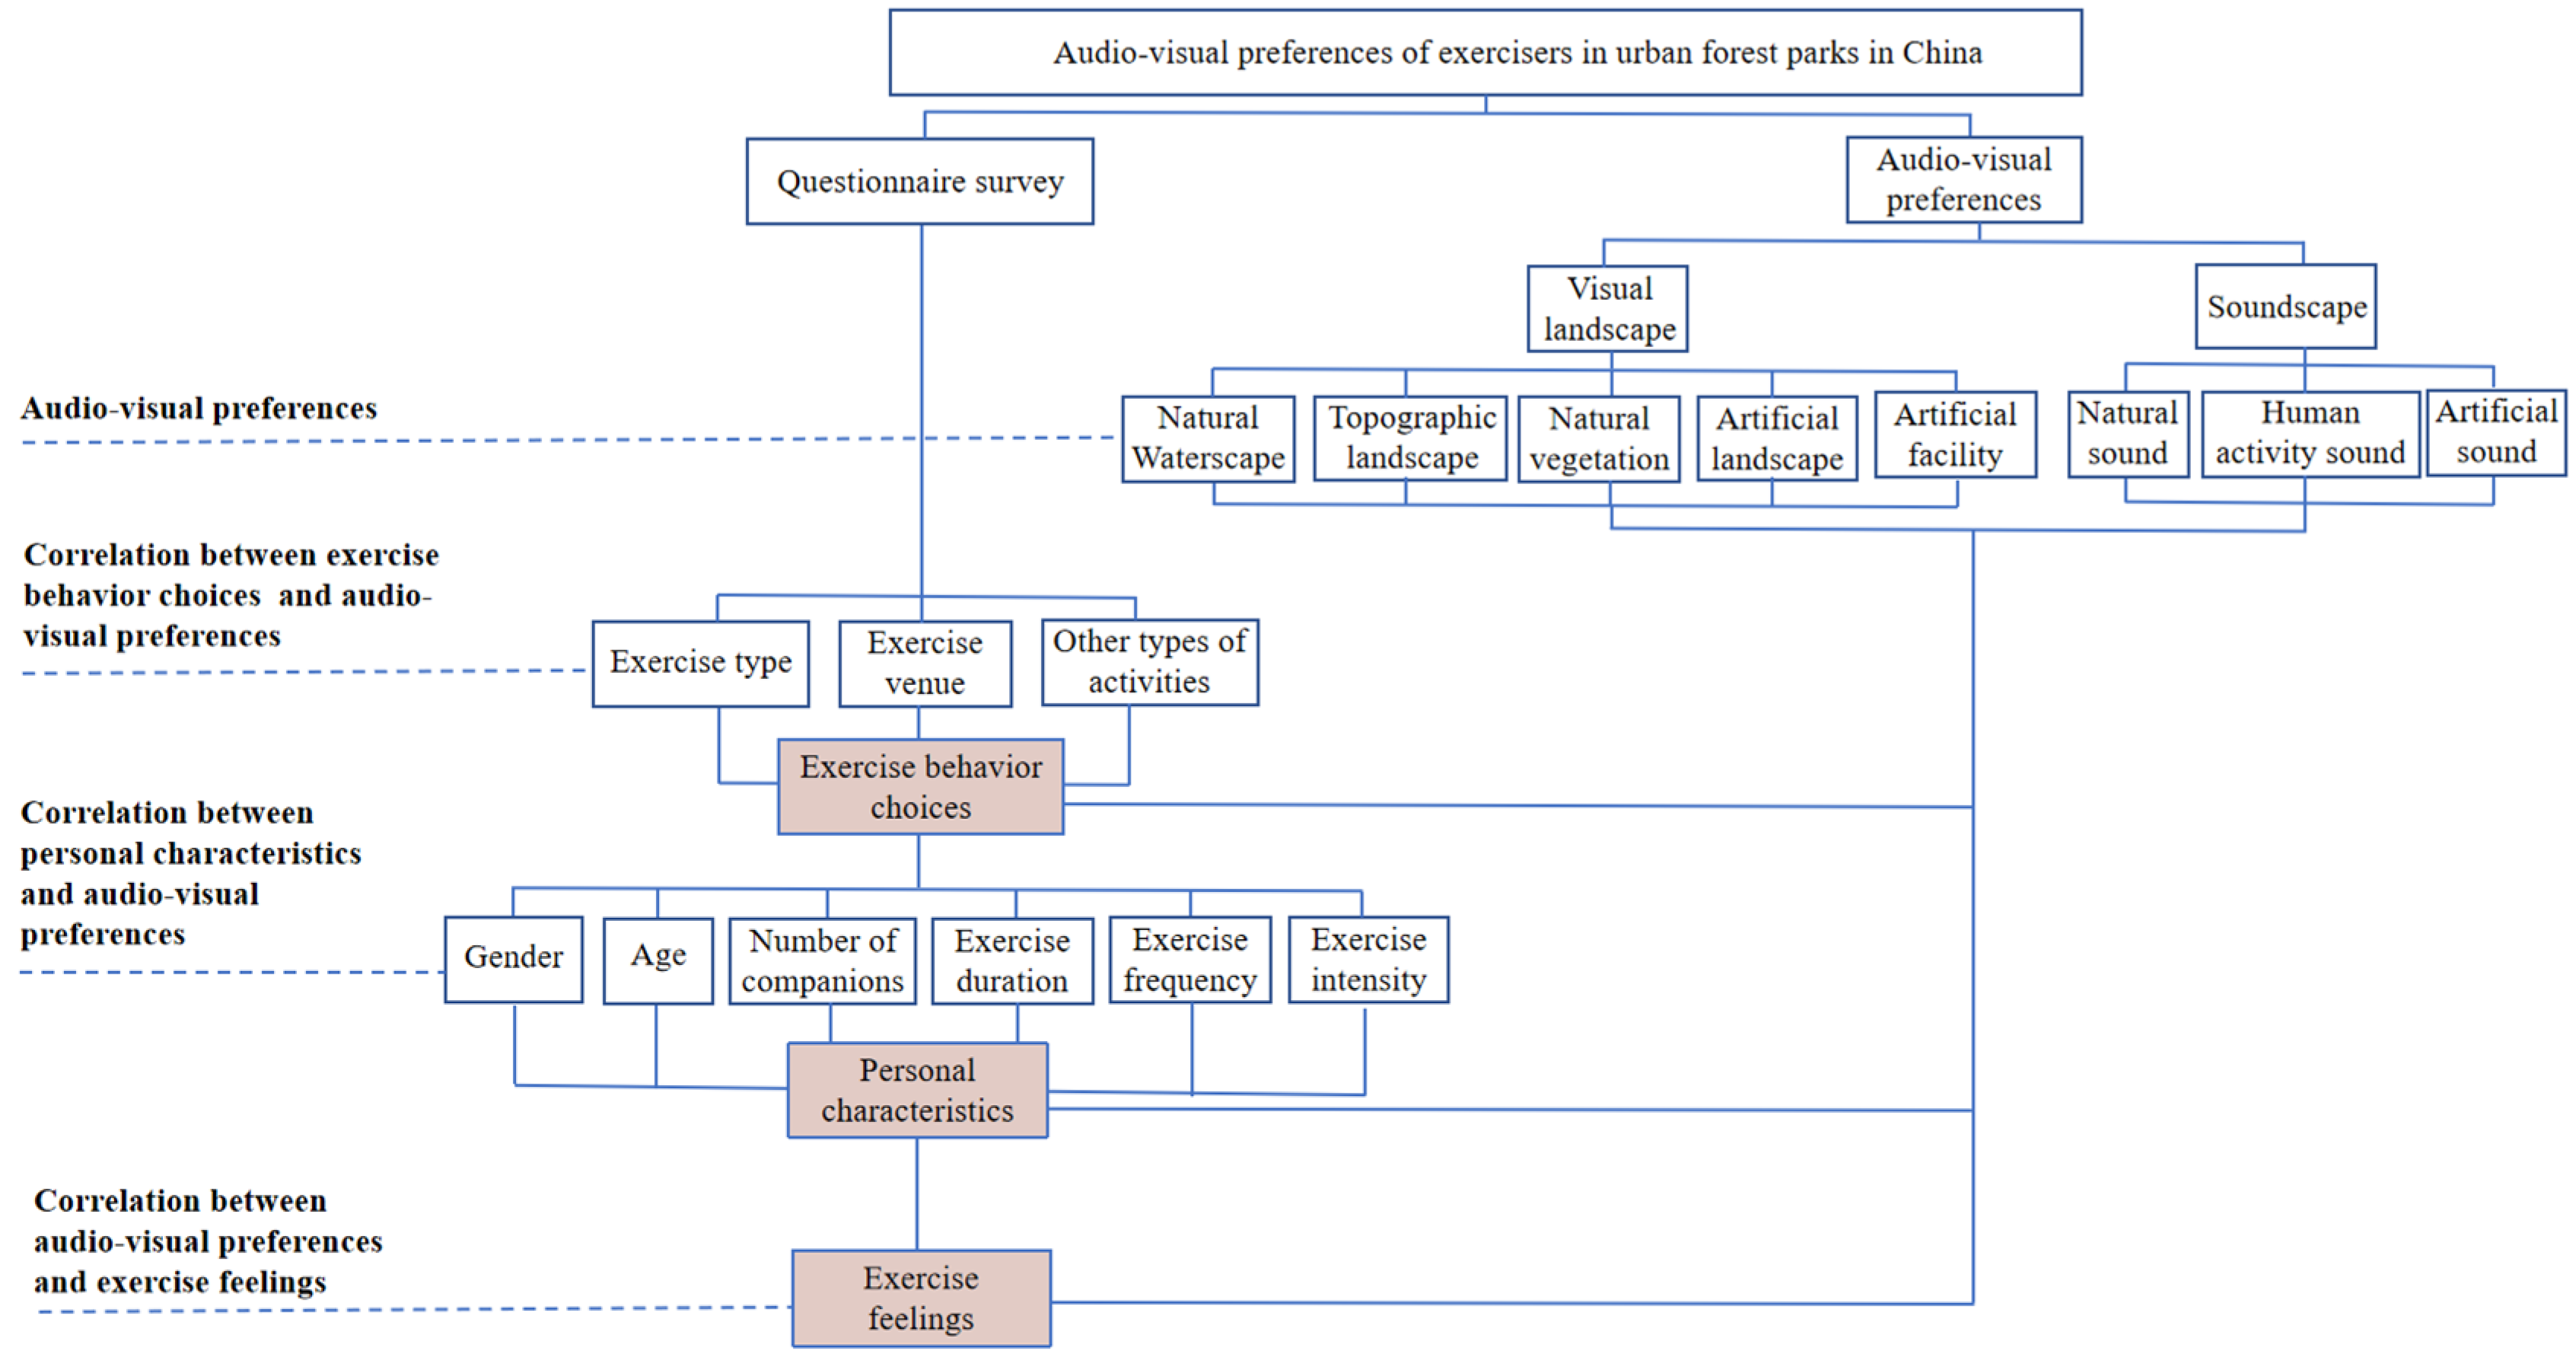
The research framework is shown in Figure 3.
3. Results
3.1. Data Testing and Demographic Analysis
After the 344 valid questionnaires were collected and sorted, SPSS 26.0 software (IBM, Armonk, NY, USA) was used to test the reliability and validity of the questionnaire data. In this study, Cronbach’s alpha was used to analyze the reliability of the questionnaire, and α ≥ 0.7 represents reliable results [46]. The results of the questionnaire were calculated to meet this reliability criterion: natural water features (0.8), topographic landscapes (0.862), natural vegetation (0.772), artificial landscapes (0.891), and public facilities (0.849); natural sounds (0.839), activity sounds (0.936), and artificial sounds (0.921). The reliability of the overall perception factor was 0.914. Thus, it can be seen that the reliability of the questionnaire meets the survey requirements. In this study, the validity of KMO was tested by factor analysis, and KMO = 0.92, which satisfied the condition of factor analysis (KMO ≥ 0.6), indicating that the validity of the questionnaire also met the requirements. Bartlett’s ball test approximated a chi-square value of 9331.808, corresponding to a probability value of 0.000 (p < 0.01), indicating that the questionnaire measures significant correlation of the question items and that the data are valid.
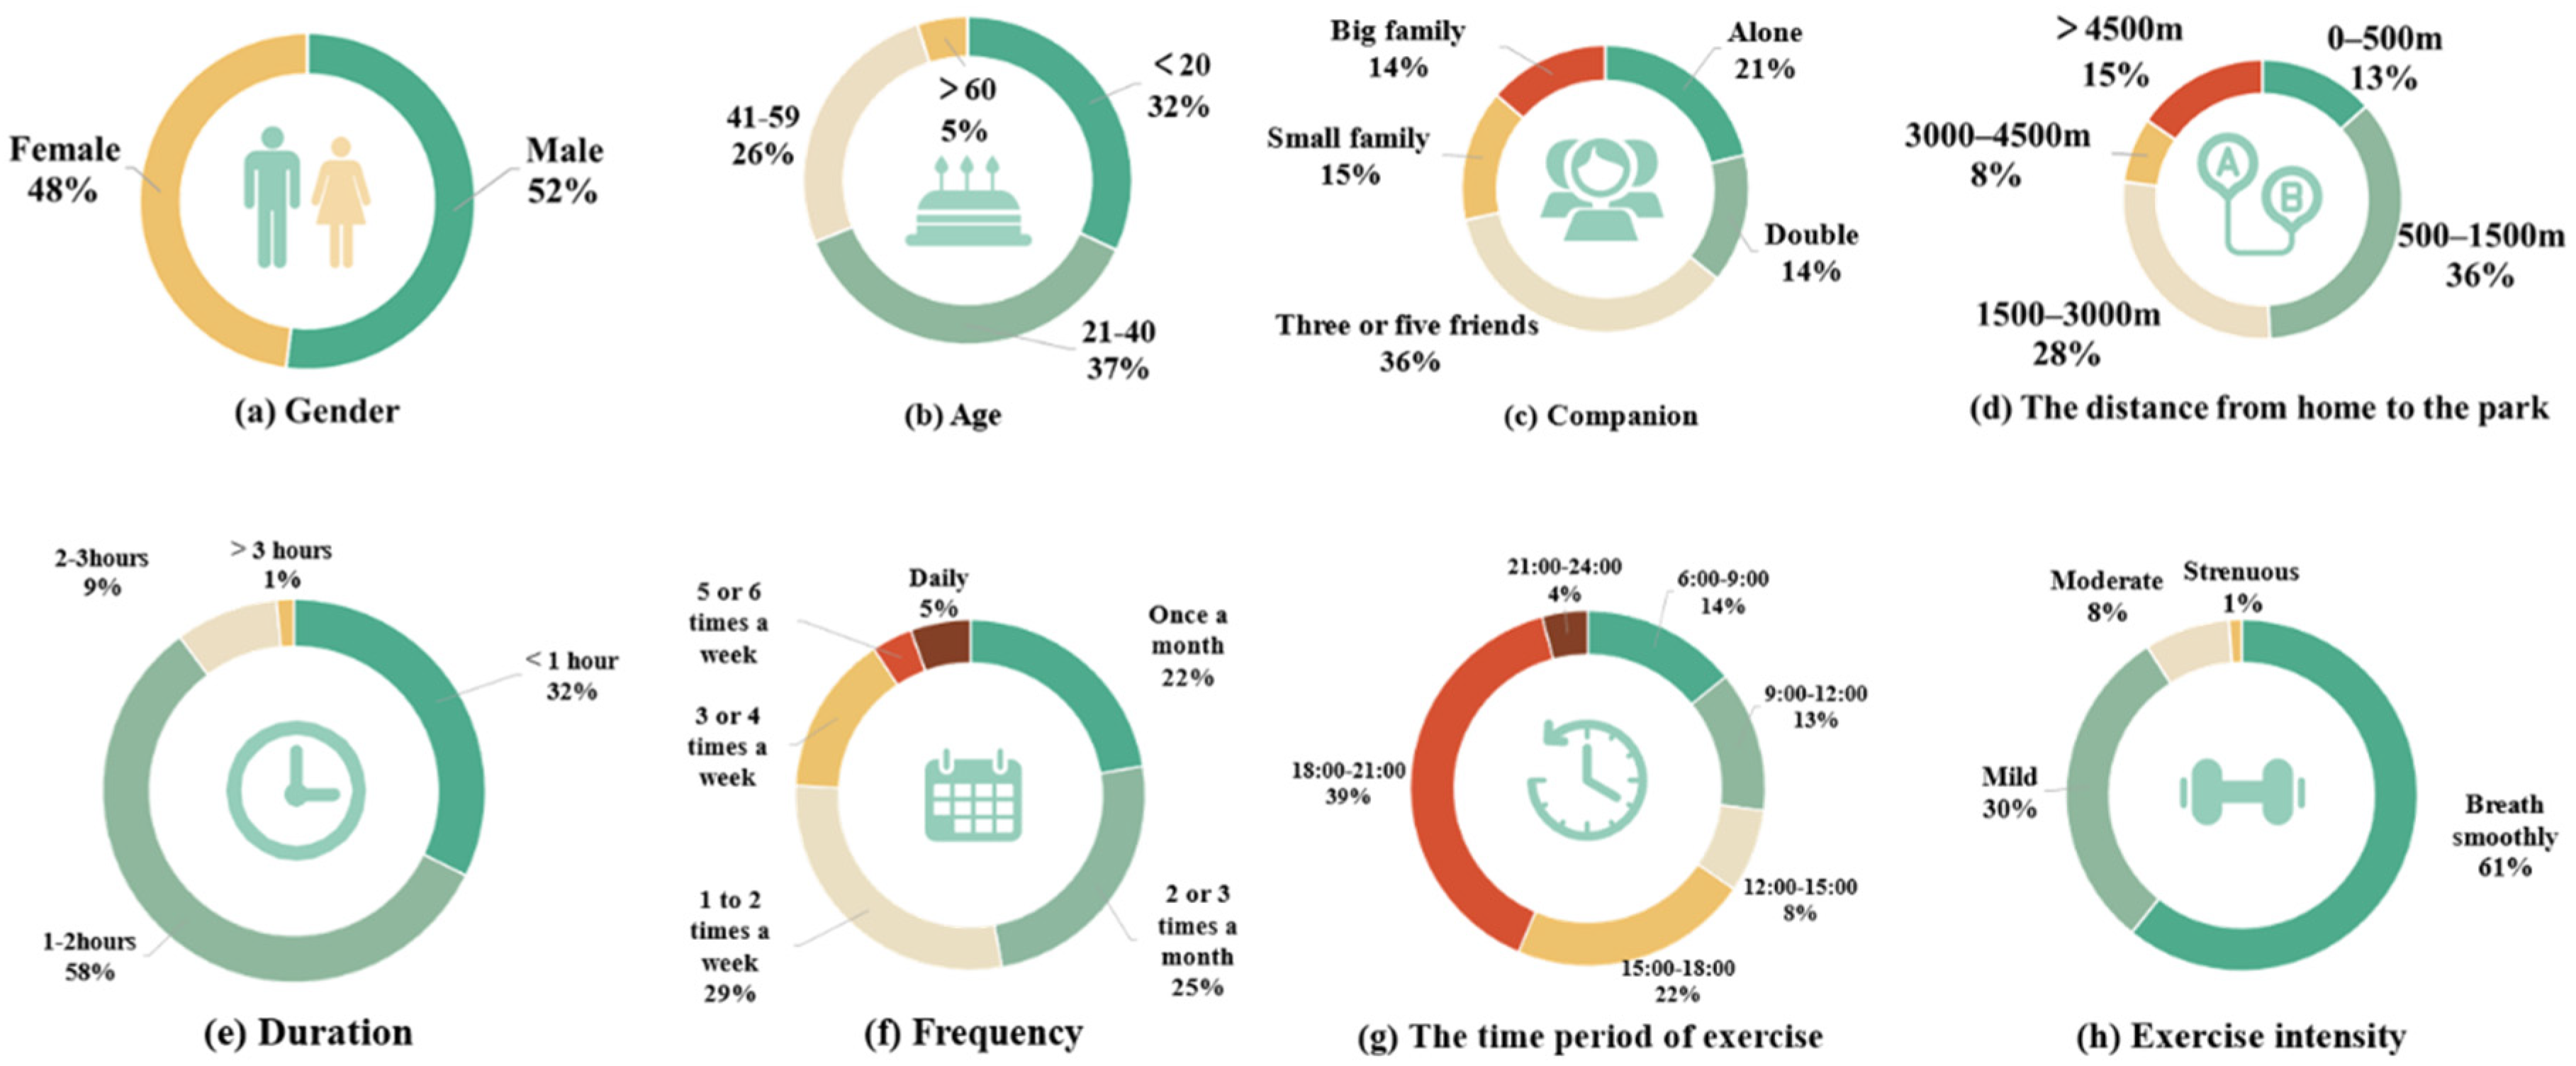
The personal characteristics of the respondents are shown in Figure 4. The proportions of respondents were 48% and 52% for men and women, respectively, which were relatively equal (Figure 4a), but there were fewer respondents over the age of 60, and the respondents were mainly the young and middle-aged group (Figure 4b). In terms of travel mode (Figure 4c), respondents traveled in a variety of ways, and exercising with three to five friends was the composition of the largest number of exercisers. In terms of the distance of the respondents’ addresses from the park (Figure 4d), 500–3000 m (36% for 500–1500 m and 28% for 1500–3000) accounted for the majority, and the majority of exercisers were living near the park (Figure 4e) About 58% of the respondents exercised for 1–2 h, and the overall frequency of exercise was low (Figure 4f), generally concentrated on once a month, 2–3 times a month and 1–2 times a week, and more respondents (39%) exercised during the time period of 18:00–21:00 (Figure 4g), with 61% of respondents only exercising lightly (Figure 4h), exercisers generally exercised less intensely.
3.2. Audio-Visual Preference Characteristics of Exercisers in Urban Forest Park
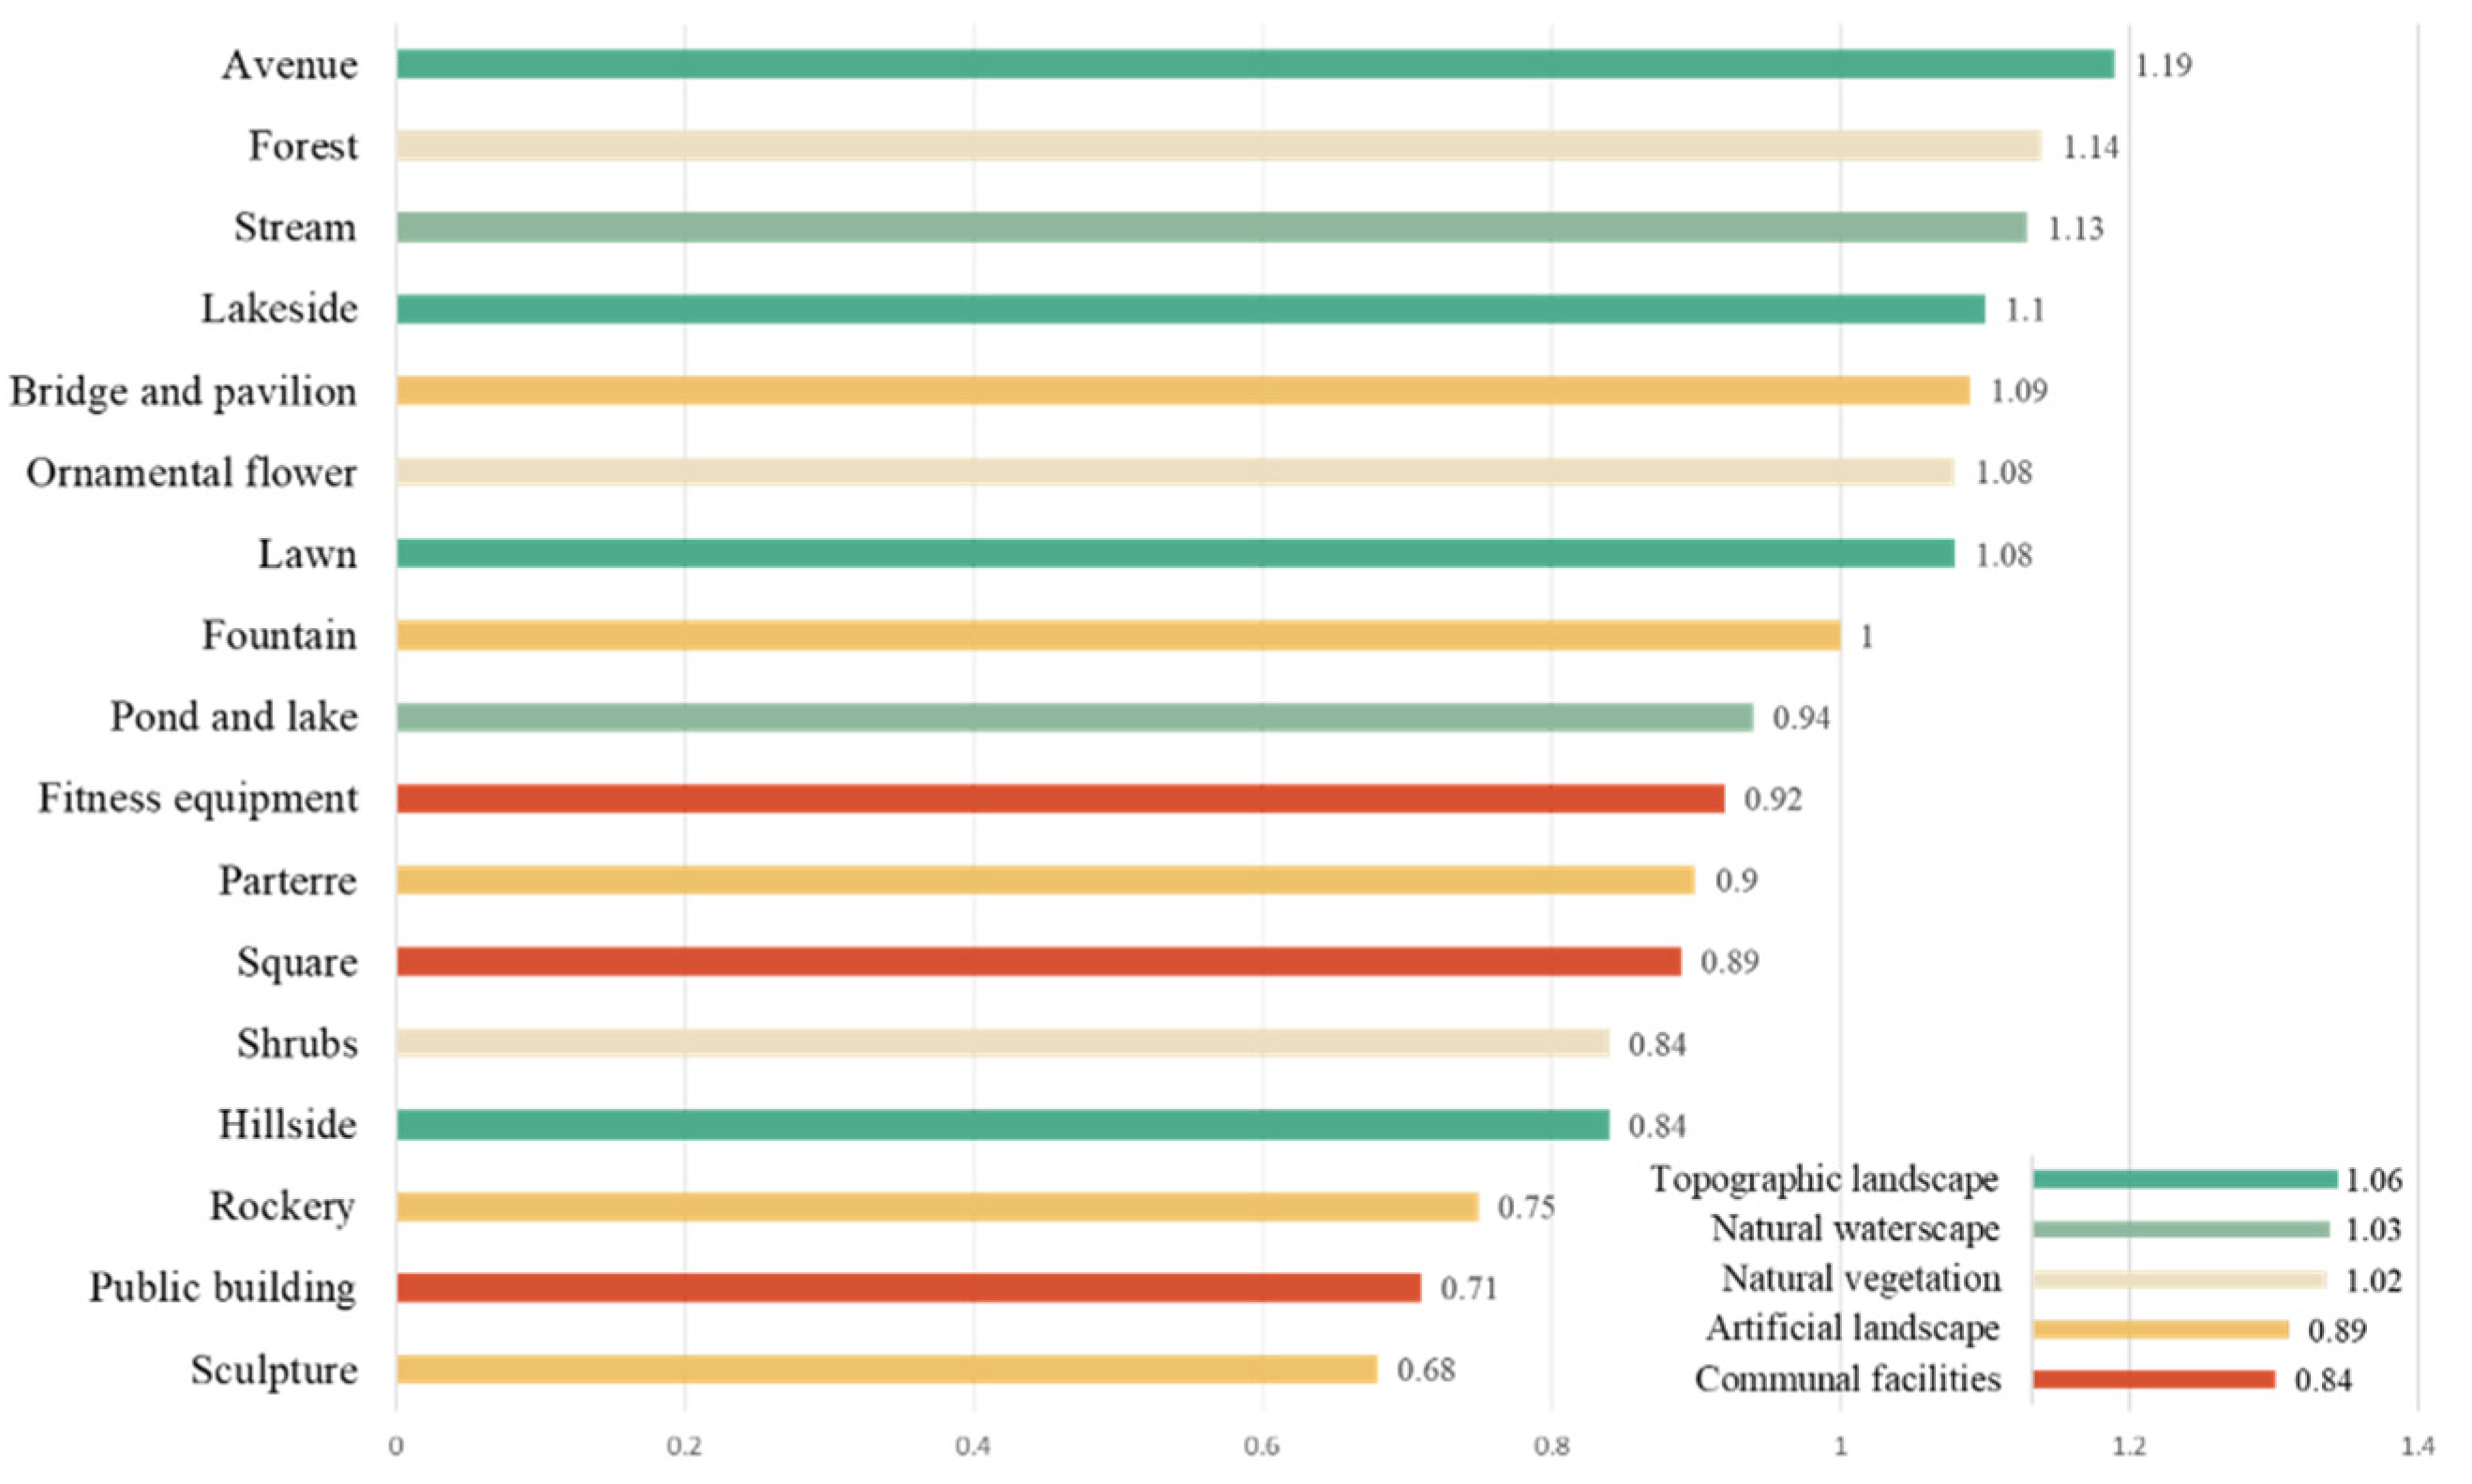
As shown in Figure 5, the most preferred visual landscapes for people exercising in urban forest parks are, in order of preference: avenues, forests, streams, lakesides, bridges and pavilions, ornamental flowers, and lawns, and less preferred landscapes are rockery, public buildings, and sculptures. In terms of overall categories, people prefer topographic landscapes and natural landscapes, and have a lower preference for artificial landscapes.
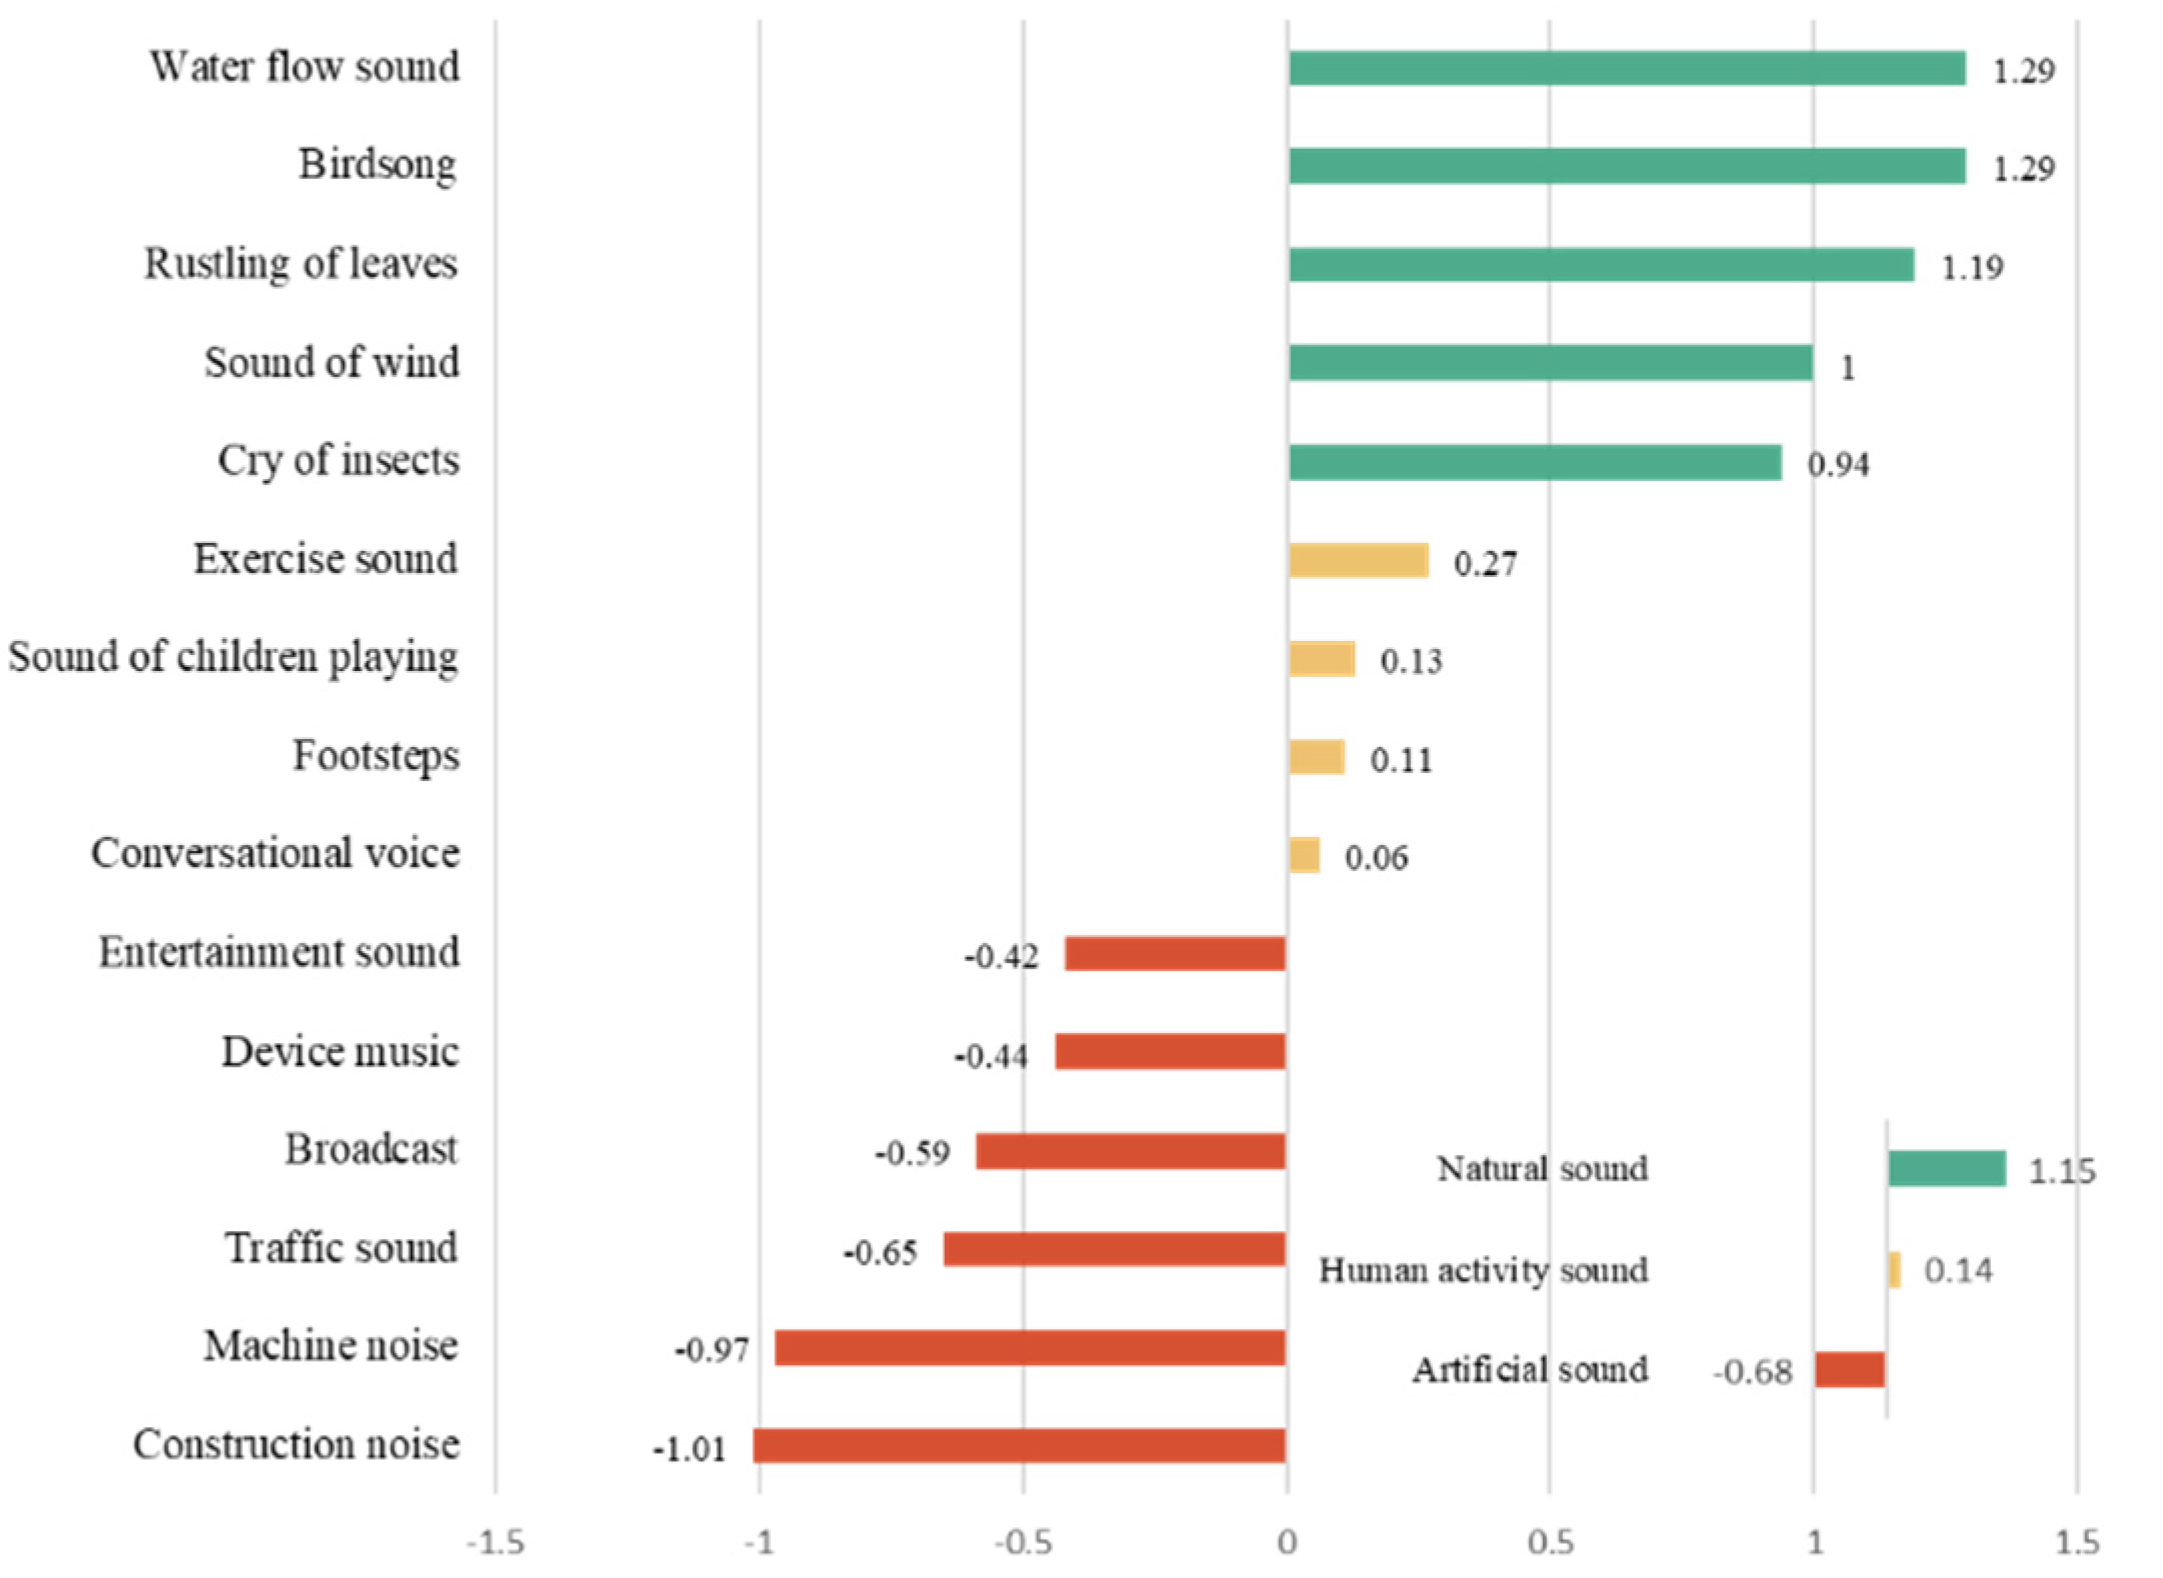
As shown in Figure 6, the most preferred sounds for the exercisers were birdsong, water flow sound, and rustling of leaves, and the least preferred sounds for landscapes were construction noise, machine noise, traffic sounds, and broadcasts. The exercise population prefers nature-related landscapes and soundscapes more, and were less fond of sounds and landscapes generated or created by people.
3.3. The Effect of Exercisers’ Exercise Style and Venue Choice on Audio-Visual Preference
3.3.1. Effects of Exercise Modality and Exercise Site Selection on Soundscape Preference
As the results of the correlation analysis (Table 2) show, different exercise methods affect people’s preference for soundscape. Those who chose jogging and brisk walking had a higher potential preference for natural sounds, while this group tended to choose exercise sites that were close to the natural landscape in the form of lawn, forest, and lakeside footpath.
Since the venues for dance and gymnastics are limited by the mountainous terrain and are far from the mountains and forests, those who choose these activities have less exposure to natural sounds [47]. There is a positive correlation between the preference for device music and the crowd of square dancers and gymnasts, but they have a stronger aversion to activity sound and artificial noise. People using fitness equipment showed a higher acceptance for activity sound on a potential level.
The data in Table 3 indicate that there is a positive correlation between the choice of footpath in forests and lawns and preference for natural sounds, especially sounds in the forest, and a negative correlation between preference for activity sounds and artificial noise. There was a positive correlation between the choice of lakeside footpath and preference for water flow sounds. People exercising in square open spaces and fitness equipment venues had a higher tolerance for the sound of human activity and the sound of playing music. Almost all people in different exercise areas have different levels of aversion to traffic, construction, and machine sounds.
3.3.2. Effects of Exercise Modality and Exercise Site Selection on Visual Landscape Preference
As shown in Table 4, in terms of visual landscape, there is a significant positive correlation between slow walking, jogging, and brisk walking crowds and preference for natural landscape, with the people who run showing a lower preference for artificial landscape compared to the other two categories. In contrast, the fitness crowd and the square dancing crowd have a higher preference for fitness equipment and squares. There is a positive correlation between the choice of carrying out gymnastics activities, Chinese martial arts, ball games, and the preference for artificial landscapes, but a lower degree of relationship with the preference for natural landscapes, in which those who perform ball games do not show a positive preference for natural landscapes.
The data in Table 5 illustrate that there is a strong positive correlation between the choice of fitness equipment site and the preference for natural landscape, artificial landscape, and communal facilities. Weak correlations exist between the choice of being on a lawn or forest trail and the preference for artificial landscapes, while positive correlations exist with natural landscapes. There is a strong positive correlation between the choice of lakeside footpath and preference for fountains, bridges and pavilions, and parterres.
3.3.3. Effects of Choice of Activity Type Other Than Exercise on Audio-Visual Preference
Considering that exercise is not the only purpose for which people visit urban forest, and that most exercisers engage in concurrent activities, such as family, social, and leisure activities, it is necessary to explore the visual landscape and soundscape preferences for these activities as well.
The data in Table 6 and Table 7 illustrate that there is a positive correlation between those who perform family activities and all visual landscape preferences after exercise, but such activities show a weaker correlation with natural water features, hillside, and rockery preferences, while there is a positive correlation with natural sound preferences, which are more averse to noise. There is a positive correlation between the choice of social activities, leisure activities and group activities and preference for communal facilities, with a higher tolerance for activity sound. In contrast, there was a positive correlation between the choice of quiet–type activities and the preference for avenues, hillsides, and forests, and a negative correlation between the preference for artificial sound and activity sound.
3.4. The Influence of Individual Characteristics of Urban Forest Park Exercisers on Audio-Visual Preferences
To explore the differences in soundscape and visual landscape preferences under other exercise-related factors, we conducted an ANOVA between soundscape and visual landscape preferences under different individual characteristic indicators and plotted radar plots. If significant differences were presented (p < 0.05 or p < 0.01), the specific differences were described by specifically comparing the mean size; if no significance was presented, it means that there were no significant differences in audio-visual preferences under different individual characteristics. The analysis revealed that distance from home to the park and time period did not have significant effects on audio-visual preferences (p > 0.05), so the effects of the major individual characteristic factors of gender, age, number of companions, frequency, and exercise intensity were mainly explored.
3.4.1. The Relationship between Gender and Audio-Visual Preference
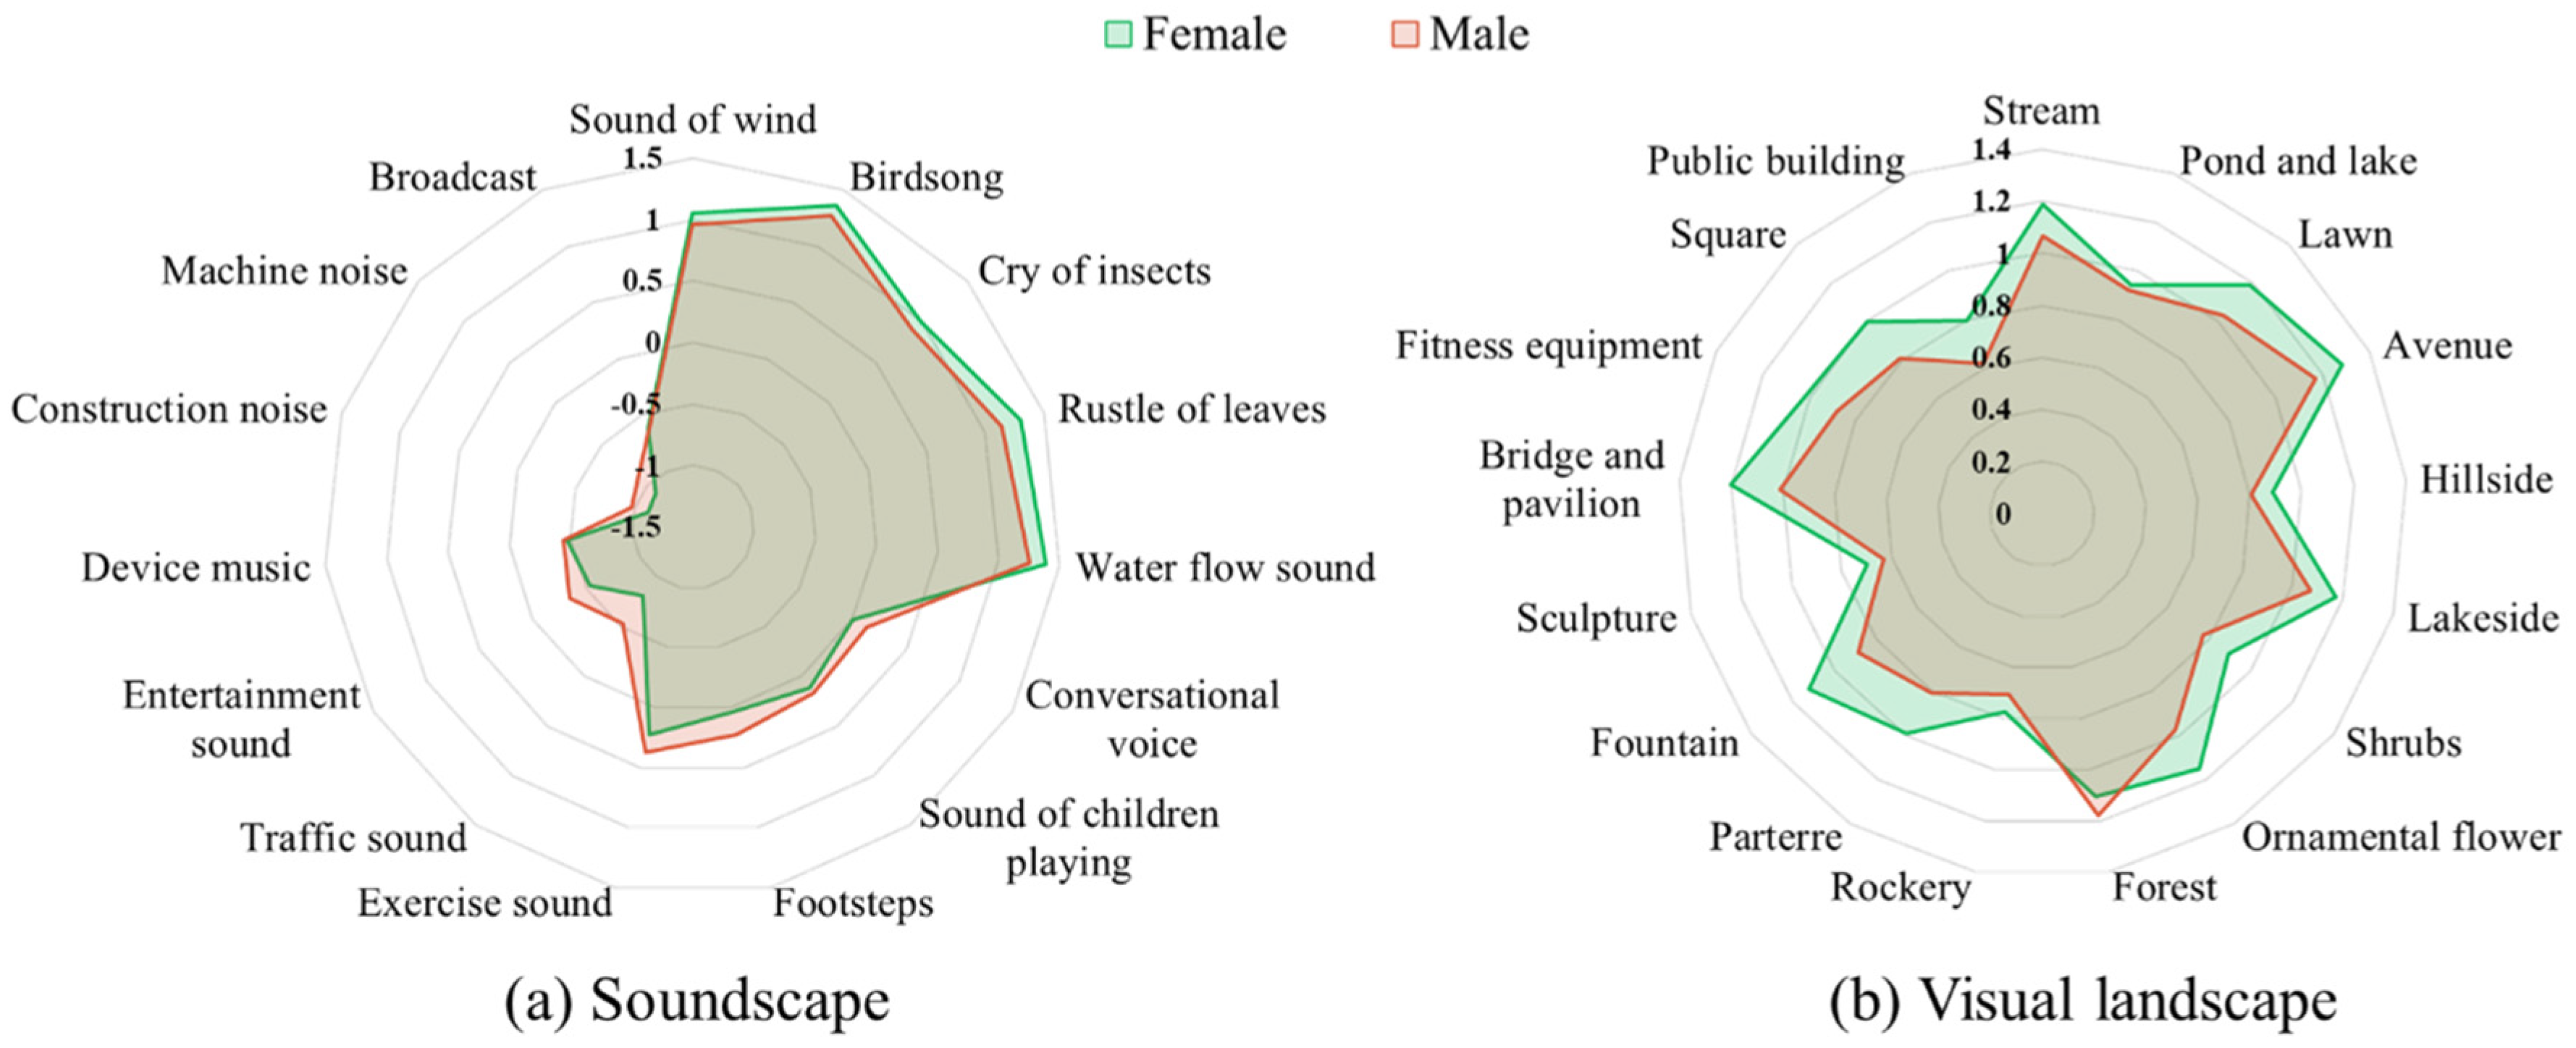
As shown in Figure 7a, females generally preferred natural sounds more than males, while males had a higher acceptance for activity and artificial sounds. Males and females showed significant differences in their preferences for traffic sound (p = 0.006 **), construction noise (p = 0.038 *), and mechanical noise (p = 0.007 **), with females showing more significant aversions to these three types of sounds. Figure 7b shows that females preferred visual landscapes in the park more than males, significantly in terms of preference for ornamental flowers (p = 0.049 *), fountains (p = 0.02 *), and bridge and pavilion (p = 0.039 *).
3.4.2. The Relationship between Age and Audio-Visual Preference
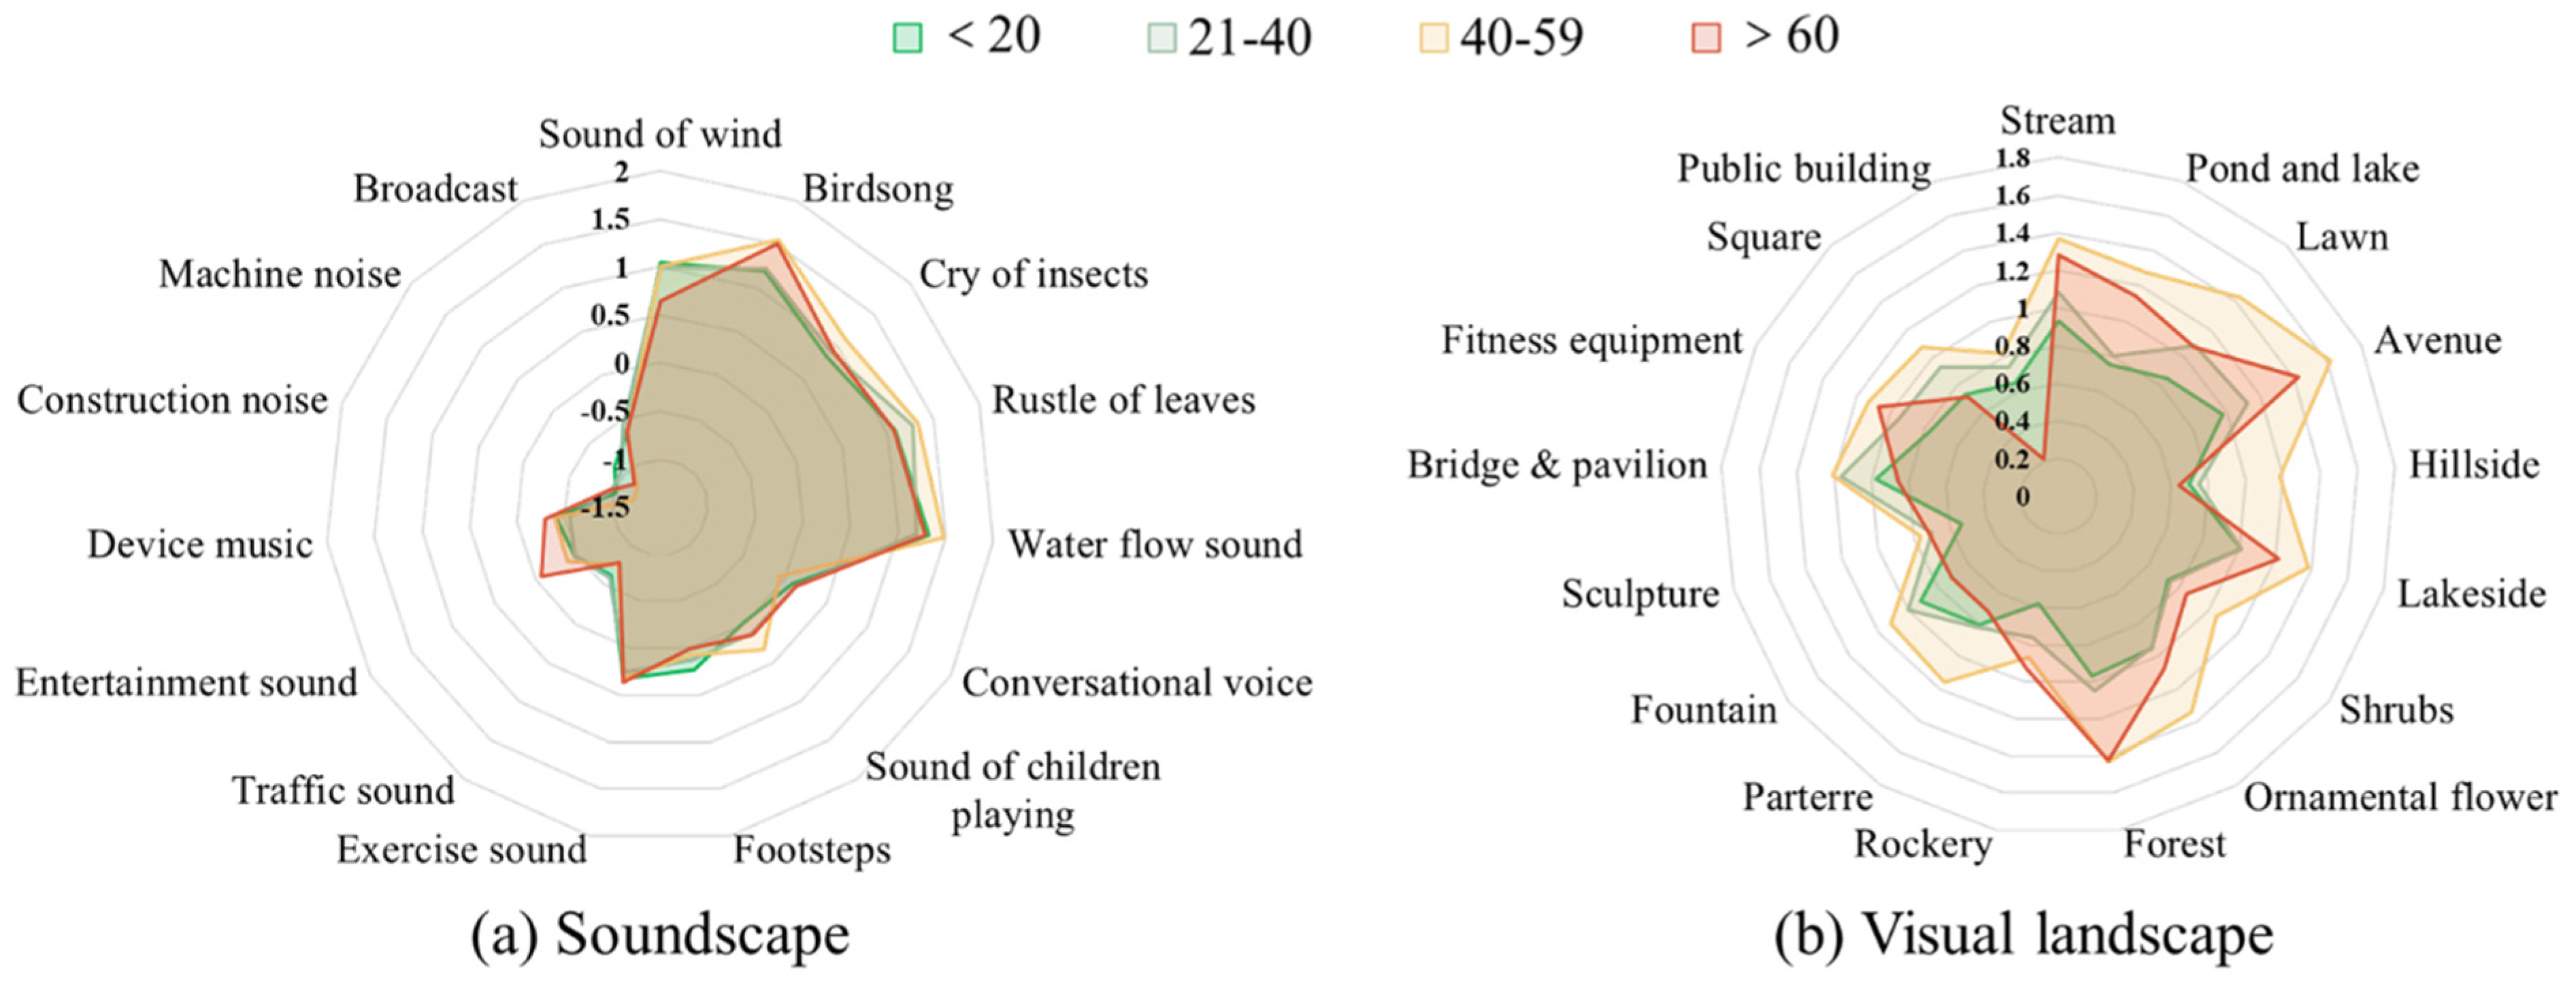
ANOVA results show that people aged 40–59 years have a higher preference for natural sounds, particularly birdsong (p = 0.009 **), cry of insects (p = 0.047 *), and water flow sound (p = 0.018 *). Older people are more tolerant of activity sounds, significantly for the sound of children playing (p = 0.02 *) and entertainment sounds (p = 0.032 *). The visualized mean data are shown in Figure 8a.
According to the ANOVA results, people aged 40–59 years showed a more significant preference for streams (p = 0.006 **), ponds and lakes (p = 0.001 **), lawns (p = 0.000 **), avenues (p = 0.000 **), hillsides (p = 0.002 **), lakesides (p = 0.000 **), ornamental flowers (p = 0.001 **), forests (p = 0.000 **), parterres (p = 0.001 **), and fitness equipment (p = 0.02 *) compared to other age groups. This is also shown in Figure 8b, where middle-aged people have a higher preference for the overall park landscape compared to other age groups.
3.4.3. The Relationship between Companion Number and Audio-Visual Preference
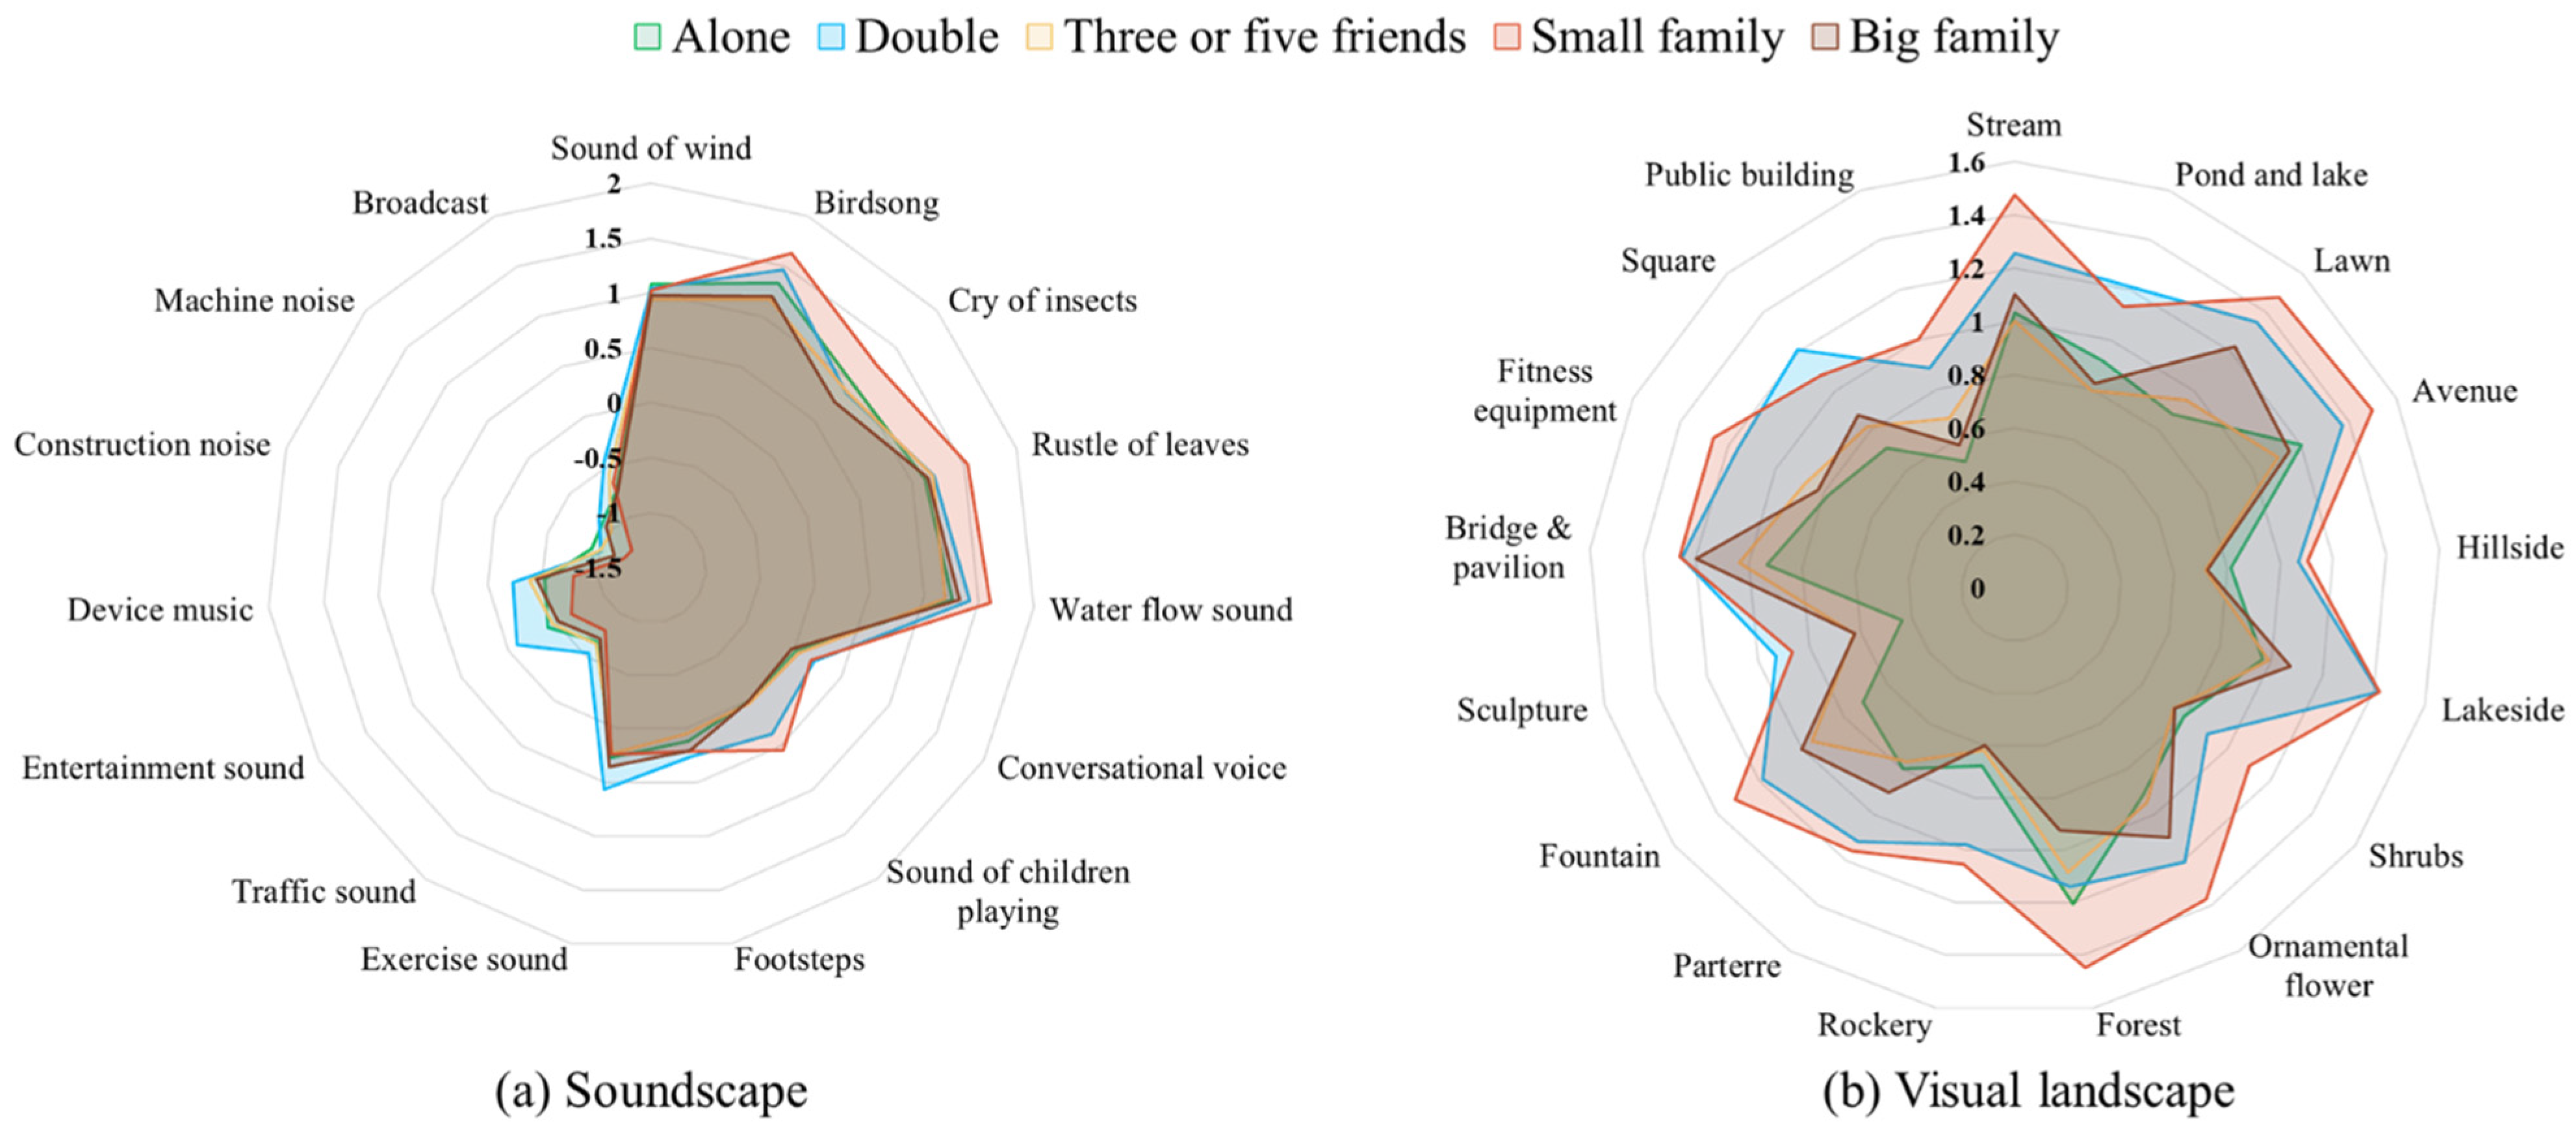
According to the results of the ANOVA, those who went with small families showed a significant preference for the four natural sounds of birdsong (p = 0.005 **), insects (p = 0.045 **), leaves (p = 0.046 *), water flow (p = 0.028 **) and the sound of children playing (p = 0.001 **) compared to the rest of the population. In addition, according to Figure 9a, people traveling with small families were more averse to artificial noise and entertainment equipment, but no significant differences were found in the ANOVA. Those who were accompanied by a companion showed a higher preference for soundscapes compared to those who were alone, while being more averse to noise.
According to the results of the ANOVA and in conjunction with Figure 9b, the visual landscape preferences of the exercisers showed significant differences for different numbers of companions, except for the bridges and pavilions (p = 0.132). Those who traveled in small families showed more significant preferences for streams (p = 0.003 **), ponds and lakes (p = 0.008 **), lawns (p = 0.000 **), avenues (p = 0.011 *), hillsides (p = 0.004 **), lakesides (p = 0.001 **), shrubs (p = 0.047 *), ornamental flowers (p = 0.006 **), forests (p = 0.007 **), rockeries (p = 0.01 *), parterres (p = 0.003 **), fountains (p = 0.001 **), fitness equipment (p = 0.002 **), and public buildings (p = 0.02 *), while those who traveled in pairs showed more significant preferences for sculptures (p = 0.029 *) and squares (p = 0.003 **).
3.4.4. The Relationship between Exercise Frequency and Audio-Visual Preference
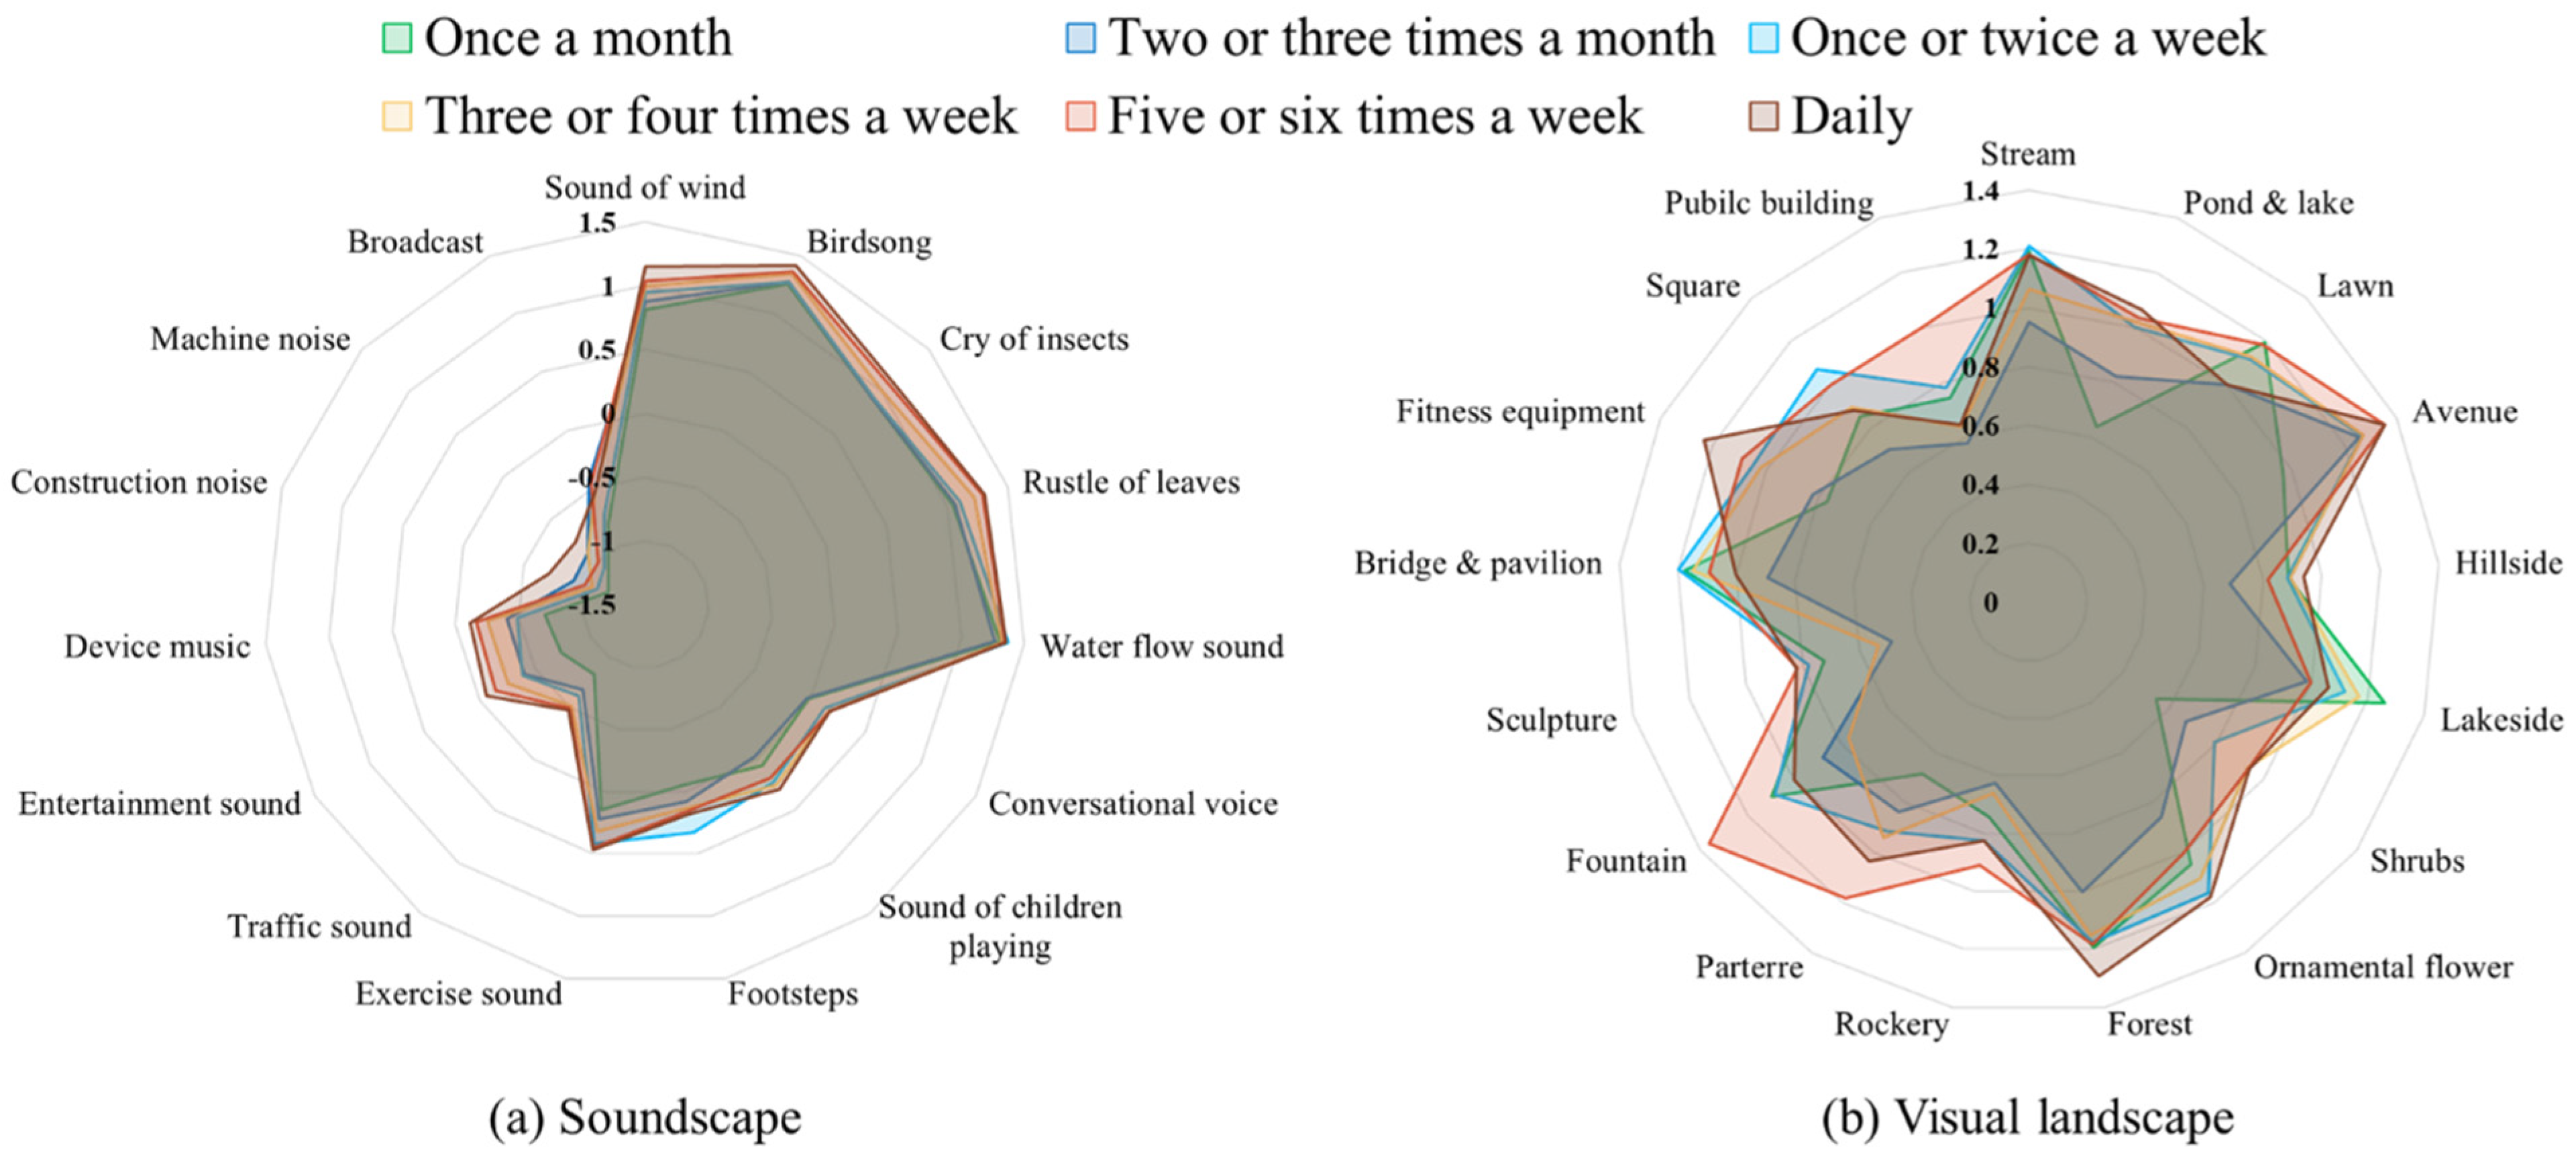
According to the variance results and in conjunction with the results shown in Figure 10a, people who exercise more frequently show a significant preference for natural sounds such as wind (p = 0.012 *), birdsong (p = 0.04 *), cry of insects (p = 0.014 *), rustle of leaves (p = 0.007 **), and water flow (p = 0.024 *), and a more significant tolerance for noise: device music (p = 0.024 *), entertainment sound (p = 0.022 *), and traffic sound (p = 0.045 *). People with lower activity frequencies show opposite trends in sound preference to those with higher activity frequencies.
The results of the ANOVA showed that those who exercised more frequently showed a significant preference for ponds and lakes (p = 0.015 *), avenues (p = 0.021 *), shrubs (p = 0.045 *), parterres (p = 0.015 *), and fitness equipment (p = 0.027 *), while those who exercised less frequently showed a lower preference for all these landscapes.
3.4.5. The Relationship between Exercise Intensity and Audio-Visual Preference
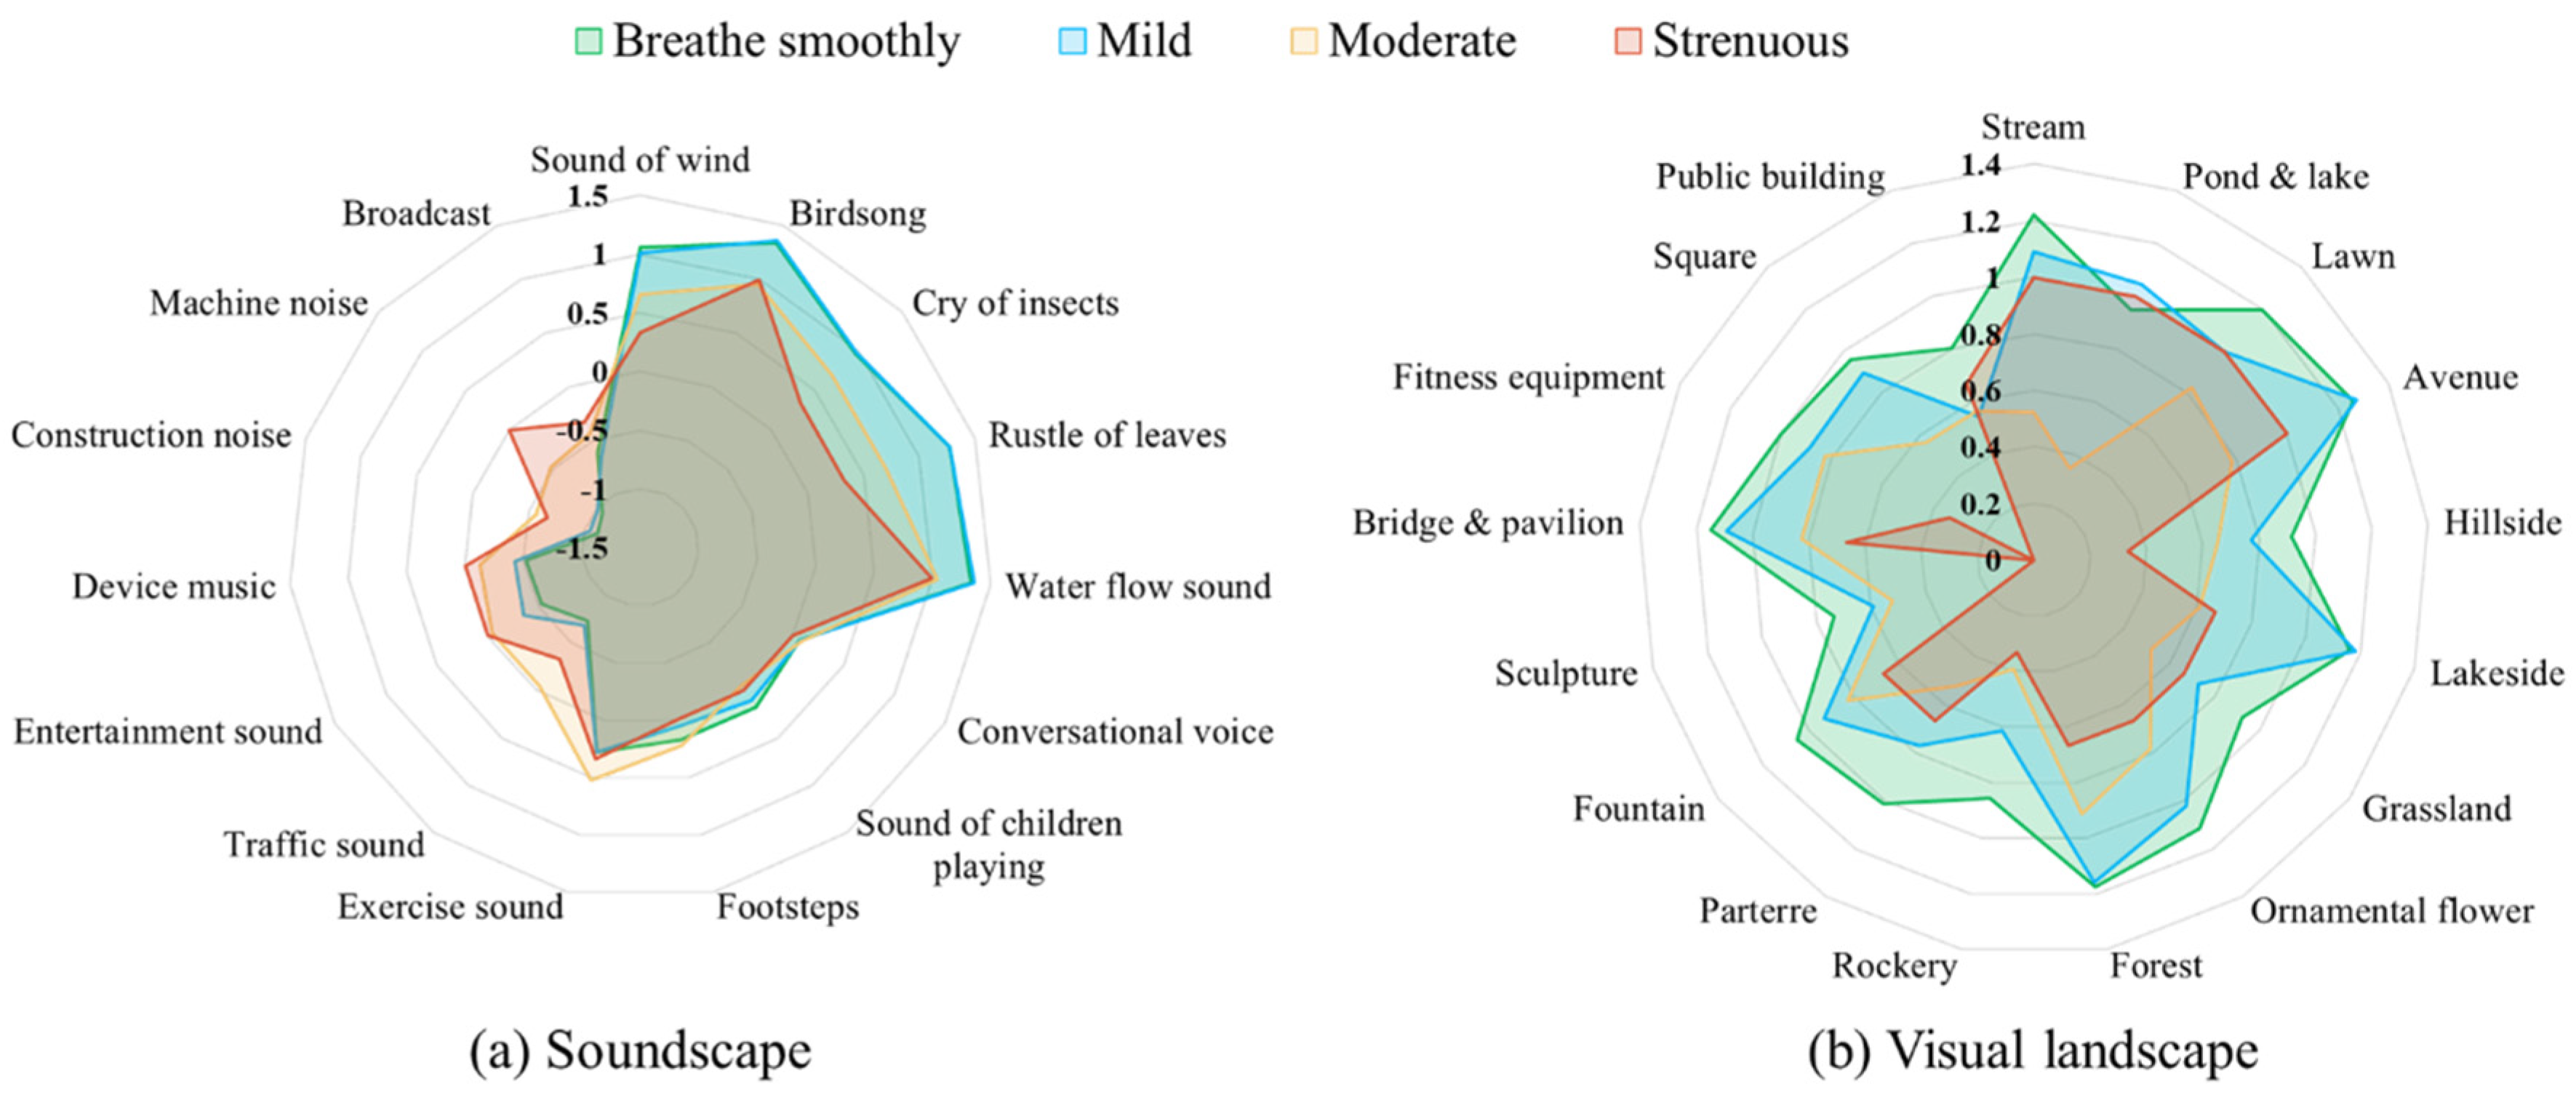
According to the ANOVA results, the light exercisers showed a significant preference for natural sounds such as wind (p = 0.047 *), birdsong (p = 0.022 *) and leaves (p = 0.000 **) compared to the strenuous exercisers, while the strenuous exercisers showed a more significant tolerance for noise such as traffic (p = 0.015 *), construction (p = 0.03 *), and machine noise (p = 0.009 **). These trends are also shown in Figure 11a.
Using ANOVA, we found that the light exercise group showed a significant preference for the categories of streams (p = 0.001 **), ponds and lakes (p = 0.015 *), avenues (p = 0.025 *), lakesides (p = 0.003 **), parterres (p = 0.05 *), and squares (p = 0.021 *). Figure 11b also reflects that the heavy exercisers showed a lower preference for these types of landscapes compared to the light exercisers.
3.5. The Effect of Audio-Visual Preference on Exercise Perception among Urban Forest Park Exercisers
Structural equation modeling was first developed by Swedish statisticians as a multivariate statistical analysis method for analyzing the complex structure of relationships between multi-indicator variables, SEM, which has similar aims to regression analysis but has two advantages over regression analysis [48]. Firstly, SEM is able to take into account the estimated residuals of the observed variables, which gives a more realistic picture of the sample information [49]. Secondly, SEM allows the reader to understand the relationship between variables in a more intuitive way by presenting the results in a simple graphical output [50].
In this paper, in order to explore the influence of soundscape and visual landscape preferences on the perceptions of exercising people in the park, methods that can reveal the relationships that exist between multiple variables need to be used. Combining the properties and advantages of SEM, we ultimately used SEM to explore the influence of relationships between the variables. The visual and acoustic landscapes were divided into previously classified categories and the mean scores were used to calculate the scores for each dimension. The mean score is the most commonly used dimensional induction treatment. For the accuracy of the model, a multicollinearity test was performed to ensure that there was no multicollinearity between the variables. If tolerance ≤ 0.1 or VIF ≥ 10, it exist multicollinearity. According to what is shown in Table 8, none of the observed variables in the model are subject to multicollinearity.
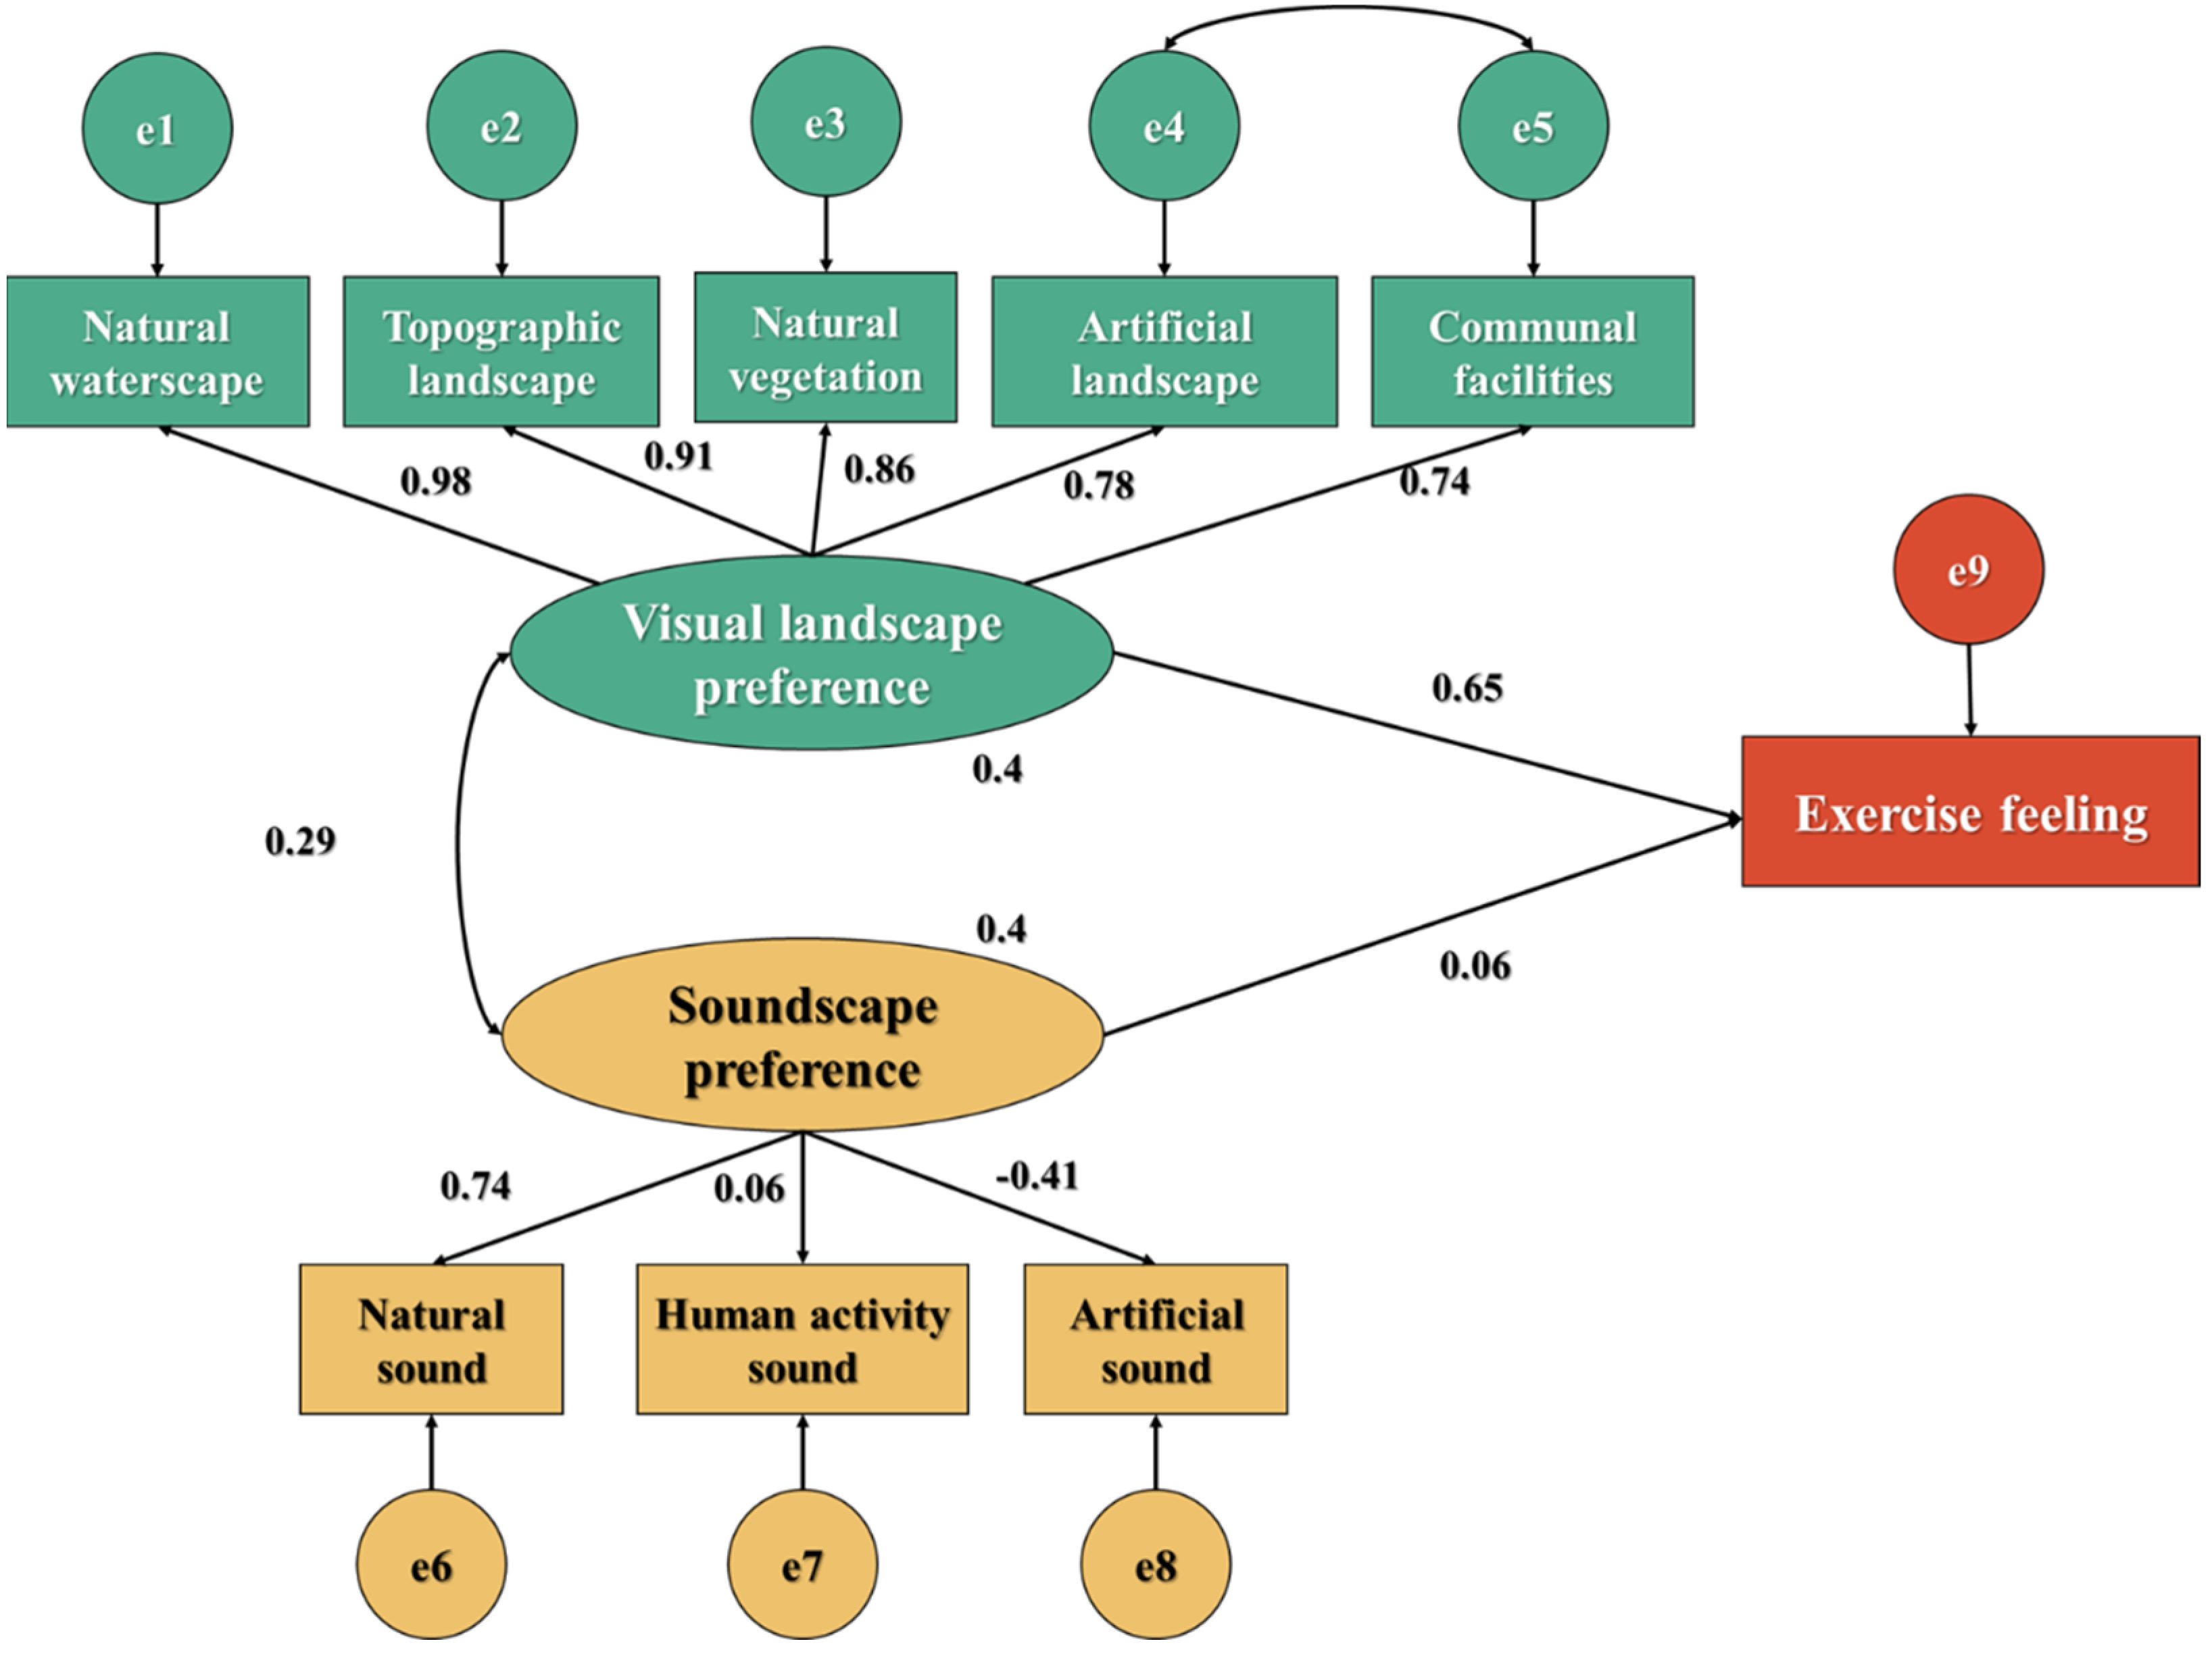
Model plotting was performed in SPSS AMOS software (IBM, Armonk, NY, USA), and relevant data were imported for computational analysis; the final model plot is shown in Figure 12. The oval in the figure represents the latent variable and the rectangle represents the observed variable, which is the measurement item in the questionnaire. Each measurement term must have a residual term, which is a circular term from e1–e9 in the figure.
In the model, soundscape and visual landscape preferences are latent variables, and the dependent variable exercise perception is the observed variable. Natural sound, human activity sound, and artificial sound are used as observed variables for soundscape preference, and natural waterscape, topographic landscape, natural vegetation, artificial landscape, and communal facilities are used as observed variables for visual landscape preference. According to the principles of SEM, residual terms need to be added to the latent variables and double arrows added between the exogenous latent variables. The model fit indices were as follows, CMIN/DF = 2.595(<3), GFI = 0.958(>0.9), AGFI = 0.925(>0.9), RMR = 0.023(<0.05), CFI = 0.973(>0.9), reflecting the overall goodness of fit of the model. The validation level α = 0.05 and each estimated parameter is significant. The results of the optimal model path coefficient estimation are shown in Table 9.
Correlation analysis of each visual landscape preference and exercise perceptions found that they were all significantly correlated. Figure 12 of the structural equation model shows that the overall visual landscape preference (0.65) has a greater direct effect on the exercise population’s perception in the park and has the highest direct effect status for natural waterscape (0.98), followed by topographic landscape (0.91), and less direct effect for artificial landscape (0.78) and communal facilities (0.74). Additionally, the linear regression of the single term shows that sculptures have a significant negative effect on exercise perception.
The correlation analysis between soundscape preference and exercise perception found that most of them had significant correlation with perception, except for conversational sounds, footsteps, music, and entertainment equipment sounds that belonged to personal activity sounds. The structural equation model showed that the overall soundscape preference (0.06) did not have a high degree of direct effect on perception, and the activity sound had a relatively minor effect, which was also consistent with the correlation analysis results. However, noise still plays a negative influence in it. There is still a strong positive influence of natural sound, and in the regressions of individual items, bird song and water flow sound are found to have a more significant influence, which has some connection with landscape preference.
4. Discussion
This discussion section explores the landscape design of urban forest parks from the perspective of exercise behavior on the basis of comparing and summarizing the similarities and differences between this study and existing scholars’ research views.
4.1. Audio-Visual Preference Characteristics of Exercisers in Urban Forest Parks
This study found that the exercise population had a higher preference for natural soundscapes and visual landscapes and a lower preference for man-made landscapes and human-generated sounds, and developed an aversion to noise in particular, which is consistent with the findings of Jeon et al. [51,52,53]. Among them, forests and footpaths and bird songs in it were most preferred by the exercising population, followed by streams and the water flow sounds they produce. Significant aversion was shown toward construction noise, traffic sounds, and machine noise, confirming the findings of Fang [33]. Park designers can install trails within the natural landscape or in the surrounding areas to increase the frequency of exercisers’ contact with the natural landscape and optimize people’s exercise experience in forest parks. At the same time, noise needs to be controlled. Some studies have shown that the use of bird calls to mask noise may improve people’s soundscape perception [29]. On the one hand, park designers can consider artificially setting up some bird nests or bird feeders in the forest to attract birds to nest, thereby increasing bird calls; on the other hand, sound insulation panels can be installed next to noise sources for noise reduction.
4.2. The Effect of Exercise Style and Individual Characteristics on Audio-Visual Preferences
4.2.1. Effects of Exercise Modality Choices on Audio-Visual Preferences
Among the different exercise activities, it is worth attention that the crowd of square dancers prefer squares and fitness equipment sites, probably because square dancing requires flat and open sites. They also prefer ornamental flowers and parterres compared to the crowd of other activities. The researchers’ observation and questioning found that most of this group were middle-aged and older women who preferred flowers. There was a positive correlation between the square dancing and gymnastics crowd and the preference for music sound played by the equipment, but they had a strong aversion to activity sound and artificial noise. After questioning, it was found that they did not like the activity sound and artificial noise of people around them to interfere with the music sound they played. People using fitness equipment showed a higher acceptance for activity sound at the potential level, because there are often more people gathered at the fitness equipment in the park, and there are many children playing around.
4.2.2. Effects of Exercise Site Selections on Audio-Visual Preferences
Those who choose forest and lawn footpaths are more concerned about the purity of the surrounding natural landscape and do not want artificial landscapes in the natural landscape, while being very averse to fire announcements in the forest. Those who choose lakeside footpath are more interested in small bridges and pavilions, fountains, parterres, waterscapes, and water sounds. Compared with other groups, those who choose the square open space are more interested in artificial landscape, and those who choose the fitness equipment site are very receptive to the landscape in the park. Both of these two types of exercise groups have a higher tolerance for activity sound as well as music sound.
Chen et al. showed that when the surrounding conditions can satisfy park users to engage in active health behaviors, they will still engage in exercise behaviors even if the landscape preference is weak, while when the conditions are not satisfied, they will not engage in exercise behaviors despite the strong landscape preference [54], which partly explains the differences in landscape preferences among people with different exercise behaviors. Park designers can try to provide adequate exercise conditions by installing some fitness equipment and trails at the interface area between natural and man-made landscapes. When planning forest footpaths, the purity of the surrounding natural landscape can be ensured by minimizing the involvement of man-made landscape and sound elements along the trails.
4.2.3. Effects of Factors Other Than Exercise on Audio-Visual Preferences
Most of the population will also perform some other activities, and there is a relationship between these activities and audio-visual preferences. Those who engage in family activities prefer visual landscapes, but have a lower preference for natural waterscapes, hillsides, and rockeries, perhaps because parents are concerned that their children may be harmed in these areas. Park designers may consider putting signs and hints in prominent places to indicate potential hazards. Moreover, noise is more uncomfortable for them, probably because parents are more concerned about their children’s feelings, so designers can consider creating special areas for children’s activities away from noise.
The recreational crowd with public participation type of activities prefers to be near communal facilities and artificial landscapes, while having a higher tolerance for activity sound. Some studies have shown that people who come to play with children and gather with family and friends prefer to stay in areas that can accommodate group activities, such as lawns and recreation areas [55]. Designers can consider providing them with some resting benches or tables and chairs in areas close to human activity sites. Quiet-type activity groups prefer to be in less crowded avenues, hillsides, and forests, away from artificial landscapes and places with dense activity sounds, and designers can consider installing resting facilities in these areas for them to use.
4.2.4. Effects of Individual Characteristics on Exercisers’ Audio-Visual Preferences
Among the different individual characteristics, the distance from home to the park and the time period of exercise had a low degree of influence on audio-visual preference, while gender, age, number of companions, exercise frequency, and intensity factors had an influence on audio-visual preference.
The present study found that gender has an effect on soundscape preference, which fits with Hedblom’s findings [56]. Among them, female exercisers preferred natural sounds more than males, probably because females are more sensitive to some sounds and can easily perceive sounds that males ignore [57]. Moreover, similar to Gozalo’s view in this study is that men have a higher acceptance for activity and artificial sounds, probably because it is usually women who take care of children and they are closer to artificial sound sources and thus need to endure the distress caused by this part of the sound [58]. In addition, females prefer visual landscapes in parks more than males, although males have a greater preference for forest landscapes.
The effect of age on audio-visual preferences also deserves our attention. The present study showed that as residents age, their evaluation of natural sounds increases and their tolerance for musical and activity sounds increases, and these results are generally consistent with Zhou’s findings [59], which may result from the decline of human perception of high-frequency sounds with age [60]. Compared to middle-aged and young adults, older adults have a stronger perception of natural sounds. Some studies have shown that older adults are more likely to derive a sense of calm from natural sounds [56]. This study found that middle-aged exercisers had the highest preference for various park landscapes, and in line with Paneerchelvam et al.’s study, it was found that older adults enjoyed parks more than younger people, with a particular preference for natural landscapes [61]. Park designers may consider installing facilities within or around natural landscapes that are convenient for the elderly, such as handrails along the footpaths or adding anti-slip features to the trails.
This study found that the number of companions showed an effect on both auditory and visual landscape preferences. The audio-visual preference characteristics were similar for people on small family outings and those in the parent-child category. Accompanied exercisers are more likely to resent noise than those who are alone, possibly because the presence of noise tends to interfere with the activity they are carrying out or their interaction with their partner. People who traveled in pairs and small families had a stronger preference for the visual landscape in the park, and those who moved alone and in large groups appeared to be less concerned about the visual landscape.
The present study found a significant effect of exercise frequency on audio-visual preference, which was not mentioned in previous studies. People who exercised more frequently had a greater preference for the sounds of birds, insects, and water flow, and had a higher tolerance for noise, probably because this group of people was more accustomed to the surrounding soundscape environment. People with low exercise frequency are more sensitive to the noise, and are susceptible to the negative effects of noise. People with high exercise frequency also have more preference for visual landscape in the park, while people with low frequency do not perceive visual landscape significantly.
Exercise intensity also had a significant effect on exercisers’ audio-visual preferences, and a correlation between greenway built environment and exercise intensity has been demonstrated by Dong et al. [62]. The present study found a higher degree of preference for natural sounds and natural landscapes among people with mild exercise intensity by further investigation. However, the phenomenon that the moderate and heavy exercise population found in this study had lower preference for each soundscape and visual landscape still needs further discussion. The author believes that this group is more concerned with the process of exercise itself to motivate themselves to achieve the desired exercise effect, so they may not pay attention to the surrounding sound and visual scenery.
4.3. Effect of Audio-Visual Preferences on Exercisers’ Perception of Exercise
In this study, natural landscapes and soundscapes had the effect of enhancing people’s exercise perceptions, which is consistent with Stigsdotter and Watts. Natural landscape spaces representing the tranquil type were rated as having the most restorative potential [63]. The inclusion of natural soundscapes in the environment helps to create a tranquil atmosphere and stimulate positive and pleasant emotions [64]. Interestingly, the overall soundscape preference did not have a high degree of direct effect on exercise perception, a finding that needs to be verified in further discussions. It is possible that the heavier breathing sounds produced during exercise or the preference of some exercisers to wear headphones to listen to music during exercise may have affected their ability to capture the surrounding sounds.
5. Conclusions
This study was based on a field questionnaire in Beigushan Urban Forest Park, Lianyungang City, Jiangsu Province, China. The survey examined the different preferences for sound and visual landscapes among people exercising in urban forest parks. In terms of overall audio-visual preferences, natural soundscapes and visual landscapes were generally preferred, but artificially generated sounds and constructed landscapes were preferred to a relatively lesser extent. In terms of specific factors, the study analyzed the relationship between exercise style, exercise venue, other activities, and audio-visual preferences, and showed that these factors differed in terms of people’s audio-visual preferences. People’s audio-visual preferences for their surroundings influence their choice of exercise venue. Other types of activities outside of exercise also have an effect on the audio-visual preference of exercisers, for example, the crowd of family activities are more concerned about the possible harm caused by rockeries, hillsides, waterscapes, and noise to children. The study also used ANOVA to investigate whether different individual characteristics had a significant effect on audio-visual preferences. The results show that audio-visual preferences vary by gender, age, number of companions, frequency, and intensity of exercise, which provides important information for park planners to consider when designing their parks. However, when studying the effect of age on audio-visual preferences, due to the fact that some elderly people and children are not proficient in the use of electronic devices and require substantial manpower to assist in the research, and that this group has a weaker perception of the landscape, a large amount of insensitive data were screened out, resulting in a small sample size for these two groups. The sample size of the elderly and children will be further increased in the future for more in-depth supplementary research.
By constructing a structural variance model between soundscape preference, visual landscape preference and exercise perception, it was found that visual landscape has a more direct impact on exercise perception than soundscape for exercisers, and that soundscape planning can be taken into account when planning parks while ensuring visual landscape planning.
Author Contributions
Conceptualization, J.X., M.L., Z.G. and Y.X.; data curation, J.X. and Z.G.; funding acquisition, J.X. and M.L.; methodology, J.X. and Z.G.; project administration, J.X. and M.L.; resources, J.X., Z.G., Y.X. and N.J.; supervision, M.L.; validation, J.X. and M.L.; visualization, Z.G; writing—original draft, J.X., Z.G., Y.X. and N.J.; writing—review and editing, J.X., Z.G. and Y.X. All authors have read and agreed to the published version of the manuscript.
Funding
Project funding was provided by “The Study on Rural Tourism Revitalization Planning and Sustainable Living Coordination Mechanism”, the International Cooperation Open Project of State Key Laboratory of Subtropical Building Science, South China University of Technology [grant numbers: 2019ZA02].
Institutional Review Board Statement
The study was conducted in accordance with the Declaration of Helsinki, and approved by the Institutional Review Board of The Department of Tourism Management, South China University of Technology.
Informed Consent Statement
Informed consent was obtained from all subjects involved in the study.
Data Availability Statement
The data for this study can be accessed through the uploaded affiliated files or by contacting the relevant author.
Acknowledgments
We would especially like to thank Jian Xu and Muchun Li for their assistance in proofreading the manuscript and the International Cooperation Open Project of State Key Laboratory of Subtropical Building Science, South China University of Technology. Furthermore, we are grateful to the 406 park exercisers for their participation in our questionnaire survey.
Conflicts of Interest
The authors declare no conflict of interest.
References
- Sun, W.T. Planning and layout optimization of urban forest park considering ecological environment protection. Environ. Sci. Manag. 2021, 46, 43–47. (In Chinese) [Google Scholar]
- Liao, Z.-N.; Xu, H.-J.; Ma, J.; Li, M.; He, C.; Zhang, Q.; Xu, S. Seasonal and vegetational variations of culturable bacteria concentrations in air from urban forest parks: A case study in Hunan, China. Environ. Sci. Pollut. Res. 2022, 29, 28933–28945. [Google Scholar] [CrossRef] [PubMed]
- Saninah, T.N.; Rushayati, S.B.; Hermawan, R. Iop in urban forest development at landside of Hang Nadim Batam Airport based on the microclimate and noise study. In Proceedings of the 2nd International Conference on Environment and Forest Conservation (ICEFC), Bogor, Indonesia, 1–3 October 2020; Mindanao State University: Bogor, Indonesia, 2019. [Google Scholar]
- Liu, P.; Liu, M.; Xia, T.; Wang, Y.; Guo, P. The relationship between landscape metrics and facial expressions in 18 Urban Forest Parks of Northern China. Forests 2021, 12, 1619. [Google Scholar] [CrossRef]
- Cai, M.; Cui, C.; Lin, L.; Di, S.; Zhao, Z.; Wang, Y. Residents’ spatial preference for urban forest park route during physical activities. Int. J. Environ. Res. Public Health 2021, 18, 11756. [Google Scholar] [CrossRef]
- Wang, Y.A.; Chang, Q.; Fan, P.L. A framework to integrate multifunctionality analyses into green infrastructure planning. Landsc. Ecol. 2021, 36, 1951–1969. [Google Scholar] [CrossRef]
- Geng, D.H.; Innes, J.; Wu, W.L.; Wang, G.Y. Impacts of COVID-19 pandemic on urban park visitation: A global analysis. J. For. Res. 2021, 32, 553–567. [Google Scholar] [CrossRef]
- Ugolini, F.; Massetti, L.; Calaza-Martinez, P.; Carinanos, P.; Dobbs, C.; Ostoic, S.K.; Marin, A.M.; Pearlmutter, D.; Saaroni, H.; Sauliene, I.; et al. Effects of the COVID-19 pandemic on the use and perceptions of urban green space: An international exploratory study. Urban For. Urban Green. 2020, 56, 126888. [Google Scholar] [CrossRef]
- Toselli, S.; Bragonzoni, L.; Grigoletto, A.; Masini, A.; Marini, S.; Barone, G.; Pinelli, E.; Zinno, R.; Mauro, M.; Pilone, P.L.; et al. Effect of a park-based physical activity intervention on psychological wellbeing at the time of COVID-19. Int. J. Environ. Res. Public Health 2022, 19, 6028. [Google Scholar] [CrossRef]
- Bamwesigye, D.; Fialova, J.; Kupec, P.; Lukaszkiewicz, J.; Fortuna-Antoszkiewicz, B. Forest recreational services in the face of COVID-19 pandemic stress. Land 2021, 10, 1347. [Google Scholar] [CrossRef]
- Li, F.Y.; Zhu, Z.M.; Zhou, L.; Hu, G.M.; Zhong, L.L. Attraction of green exercise space in suburban forest park based on multiple regression model. J. Northwest For. Univ. 2020, 35, 288–295. (In Chinese) [Google Scholar]
- McCormack, G.R.; Rock, M.; Toohey, A.M.; Hignell, D. Characteristics of urban parks associated with park use and physical activity: A review of qualitative research. Health Place 2010, 16, 712–726. [Google Scholar] [CrossRef] [PubMed]
- Kim, H.; Woo, E.; Uysal, M. Tourism experience and quality of life among elderly tourists. Tour. Manag. 2015, 46, 465–476. [Google Scholar] [CrossRef]
- Han, H.; Hyun, S.S. Customer retention in the medical tourism industry: Impact of quality, satisfaction, trust, and price reasonableness. Tour. Manag. 2015, 46, 20–29. [Google Scholar] [CrossRef]
- Song, Y.; Wu, D.R.; Lv, Q.Z. A study of the application of visual identity system (VI) of rural areas in the landscape design of Banshancun Village. J. Zhejiang Univ. Technol. (Soc. Sci.) 2017, 16, 266–271. (In Chinese) [Google Scholar]
- Cottet, M.; Piegay, H.; Bornette, G. Does human perception of wetland aesthetics and healthiness relate to ecological functioning? J. Environ. Manag. 2013, 128, 1012–1022. [Google Scholar] [CrossRef]
- Ma, B.Q.; Xu, C.Y.; Liu, J.; Chang, C.; Zhao, K.; Kong, X.Q.; Long, J.Y. Visual heterogeneity and visual landscape quality of urban forests as an architectural backdrop. J. Zhejiang A&F Univ. 2019, 36, 366–374. (In Chinese) [Google Scholar]
- Zhang, Y.Q.; Zhu, X.; Gao, M. A study on visual preference of walking path in urban wetland park based on eye tracking. In Proceedings of the 2020 Annual Meeting of Chinese Society of Landscape Architecture, Chengdu, China, 21–23 November 2020; pp. 450–454. (In Chinese). [Google Scholar]
- Cassina, L.; Fredianelli, L.; Menichini, I.; Chiari, C.; Licitra, G. Audio-visual preferences and tranquillity ratings in urban areas. Environments 2018, 5, 1. [Google Scholar] [CrossRef] [Green Version]
- Romero, V.P.; Maffei, L.; Brambilla, G.; Ciaburro, G. Acoustic, visual and spatial indicators for the description of the soundscape of waterfront areas with and without road traffic flow. Int. J. Environ. Res. Public Health 2016, 13, 934. [Google Scholar]
- Puyana-Romero, V.; Ciaburro, G.; Brambilla, G.; Garzon, C.; Maffei, L. Representation of the soundscape quality in urban areas through colours. Noise Mapp. 2019, 6, 8–21. [Google Scholar] [CrossRef]
- Preis, A.; Hafke-Dys, H.; Szychowska, M.; Kocinski, J.; Felcyn, J. Audio-visual interaction of environmental noise. Noise Control Eng. J. 2016, 64, 34–43. [Google Scholar] [CrossRef]
- Van Heezik, Y.; Freeman, C.; Falloon, A.; Buttery, Y.; Heyzer, A. Relationships between childhood experience of nature and green/blue space use, landscape preferences, connection with nature and pro-environmental behavior. Landsc. Urban Plan. 2021, 213, 104135. [Google Scholar] [CrossRef]
- Huang, A.S.H.; Lin, Y.J. The effect of landscape colour, complexity and preference on viewing behaviour. Landsc. Res. 2020, 45, 214–227. [Google Scholar] [CrossRef]
- Acoustics-Soundscape—Part 1: Definition and Conceptual Framework. ISO 12913-1:2014; ISO: Geneva, Switzerland, 2014. Available online: https://www.iso.org/standard/52161.html (accessed on 20 January 2022).
- Aletta, F.; Oberman, T.; Kang, J. Associations between positive health-related effects and soundscapes perceptual constructs: A systematic review. Int. J. Environ. Res. Public Health 2018, 15, 2392. [Google Scholar] [CrossRef] [PubMed] [Green Version]
- Hong, X.C.; Zhu, Z.P.; Liu, J.; Geng, D.H.; Wang, G.Y.; Lan, S.R. Perceived occurrences of soundscape influencing pleasantness in urban forests: A comparison of broad-leaved and coniferous forests. Sustainability 2019, 11, 4789. [Google Scholar] [CrossRef] [Green Version]
- Van Renterghem, T.; Vanhecke, K.; Filipan, K.; Sun, K.; De Pessemier, T.; De Coensel, B.; Joseph, W.; Botteldooren, D. Interactive soundscape augmentation by natural sounds in a noise polluted urban park. Landsc. Urban Plan. 2020, 194, 103705. [Google Scholar] [CrossRef]
- Hong, J.Y.; Ong, Z.T.; Lam, B.; Ooi, K.; Gan, W.S.; Kang, J.; Feng, J.; Tan, S.T. Effects of adding natural sounds to urban noises on the perceived loudness of noise and soundscape quality. Sci. Total Environ. 2020, 711, 134571. [Google Scholar] [CrossRef]
- Jian, K. From dBA to soundscape indices: Managing our sound environment. Front. Eng. Manag. 2017, 4, 184–192. [Google Scholar]
- Kang, J.; Aletta, F.; Gjestland, T.T.; Brown, L.A.; Botteldooren, D.; Schulte-Fortkamp, B.; Lercher, P.; van Kamp, I.; Genuit, K.; Fiebig, A.; et al. Ten questions on the soundscapes of the built environment. Build Environ. 2016, 108, 284–294. [Google Scholar] [CrossRef] [Green Version]
- Liu, F.F.; Kang, J. A grounded theory approach to the subjective understanding of urban soundscape in Sheffield. Cities 2016, 50, 28–39. [Google Scholar] [CrossRef] [Green Version]
- Xingyue, F.; Tian, G.; Marcus, H.; Naisheng, X.; Yi, X.; Mengyao, H.; Yuxuan, C.; Ling, Q. Soundscape perceptions and preferences for different groups of users in urban recreational forest parks. Forests 2021, 12, 468. [Google Scholar]
- Hong, X.-C.; Wang, X.; Duan, R.; Zhang, H.; Chi, M.-W.; Lan, S.-R. Evaluation of soundscape preference in forest park based on soundwalk approach. Tech. Acoust. 2018, 37, 584–588. [Google Scholar]
- Li, J.; Burroughs, K.; Halim, M.F.; Penbrooke, T.L.; Seekamp, E.; Smith, J.W. Assessing soundscape preferences and the impact of specific sounds on outdoor recreation activities using qualitative data analysis and immersive virtual environment technology. J. Outdoor Recreat. Tour.—Res. Plan. Manag. 2018, 24, 66–73. [Google Scholar] [CrossRef]
- Liu, J.; Xu, J.; Wu, Z.; Cheng, Y.; Gou, Y.; Ridolfo, J. Soundscape preference of urban residents in China in the post-pandemic era. Front. Psychol. 2021, 12, 750421. [Google Scholar] [CrossRef] [PubMed]
- Ma, K.W.; Mak, C.M.; Wong, H.M. Effects of environmental sound quality on soundscape preference in a public urban space. Appl. Acoust. 2021, 171, 107570. [Google Scholar] [CrossRef]
- The National Physical Fitness Testing Center Issued the Bulletin on the Investigation of National Fitness Activities in 2020. Available online: https://www.ciss.cn/tzgg/info/2021/32029.html (accessed on 20 January 2022). (In Chinese).
- Yu, Y.; Jia, X.B. Application of “Questionnaire Star” in information technology classroom test. Ind. Sci. Trib. 2015, 14, 66–67. (In Chinese) [Google Scholar]
- Krause, B. Bioacoustics, Habitat ambience in ecological balance. Whole Earth Rev. 1987, 57, 14–18. [Google Scholar]
- Zhao, Z.; Wang, Y.; Hou, Y. Residents’ spatial perceptions of urban gardens based on soundscape and landscape differences. Sustainability 2020, 12, 6809. [Google Scholar] [CrossRef]
- Zhao, W.; Li, H.; Zhu, X.; Ge, T. Effect of birdsong soundscape on perceived restorativeness in an urban park. Int. J. Environ. Res. Public Health 2020, 17, 5659. [Google Scholar] [CrossRef]
- Chitra, B.; Jain, M.; Chundelli, F.A. Understanding the soundscape environment of an urban park through landscape elements. Environ. Technol. Innov. 2020, 19, 100998. [Google Scholar] [CrossRef]
- Brown, A.L.; Kang, J.; Gjestland, T. Towards standardization in soundscape preference assessment. Appl. Acoust. 2011, 72, 387–392. [Google Scholar] [CrossRef]
- Calogiuri, G.; Patil, G.G.; Aamodt, G. Is green exercise for all? A descriptive study of green exercise habits and promoting factors in adult norwegians. Int. J. Environ. Res. Public Health 2016, 13, 1165. [Google Scholar] [CrossRef] [PubMed] [Green Version]
- Song, Y.; Wei, W.Z. Research on the Quality Improvement of MICE Tourism in Resource-based Tourism Cities Based on IPA—Take Huangshan City as an example. J. Chongqing Univ. Sci. Technol. (Soc. Sci. Ed.) 2013, 1, 108–111. [Google Scholar]
- Li, H.; Xie, H.; Woodward, G. Soundscape components, perceptions, and EEG reactions in typical mountainous urban parks. Urban For. Urban Green. 2021, 64, 127269. [Google Scholar] [CrossRef]
- Jöreskog, K.G.; Goldberger, A.S. Estimation of a model with multiple indicators and multiple causes of a single latent variable. J. Am. Stat. Assoc. 2012, 70, 631–639. [Google Scholar]
- Hair, J.; Anderson, R.; Tatham, R.; Black, W. Multivariate Data Analysis, 5th ed.; Prentice Hall PTR: Hoboken, NJ, USA, 1998. [Google Scholar]
- Wang, L.N.; Li, S.S. Misunderstanding and Countermeasures of structural equation model in correction and intermediary analysis. Chin. J. Health Stat. 2017, 34, 361–363. (In Chinese) [Google Scholar]
- Jeon, J.Y.; Jo, H.I. Effects of audio-visual interactions on soundscape and landscape perception and their influence on satisfaction with the urban environment. Build Environ. 2020, 169, 106544. [Google Scholar] [CrossRef]
- Liu, J.; Wang, Y.; Zimmer, C.; Kang, J.; Yu, T. Factors associated with soundscape experiences in urban green spaces: A case study in Rostock, Germany. Urban For. Urban Green. 2019, 37, 135–146. [Google Scholar] [CrossRef]
- Jahani, A.; Kalantary, S.; Alitavoli, A. An application of artificial intelligence techniques in prediction of birds soundscape impact on tourists? mental restoration in natural urban areas. Urban For. Urban Green. 2021, 61, 127088. [Google Scholar] [CrossRef]
- Chen, W.C.; Zheng, W.F. Correlation analysis between landscape preference and active health behavior of tourists in mountain parks—Take Fuzhou Feifengshan Olympic Sports Park as an example. Shandong For. Sci. Technol. 2021, 51, 7–15. (In Chinese) [Google Scholar] [CrossRef]
- Zhai, Y.J.; Baran, P.K.; Wu, C.Z. Spatial distributions and use patterns of user groups in urban forest parks: An examination utilizing GPS tracker. Urban For. Urban Green. 2018, 35, 32–44. [Google Scholar] [CrossRef]
- Hedblom, M.; Heyman, E.; Antonsson, H.; Gunnarsson, B. Bird song diversity influences young people’s appreciation of urban landscapes. Urban For. Urban Green. 2014, 13, 469–474. [Google Scholar] [CrossRef]
- O’Brien, E.A. Publics* and woodlands in England: Well-being, local identity, social learning, conflict and management. Forestry 2005, 78, 321–336. [Google Scholar] [CrossRef]
- Rey Gozalo, G.; Barrigon Morillas, J.M.; Montes Gonzalez, D.; Atanasio Moraga, P. Relationships among satisfaction, noise perception, and use of urban green spaces. Sci. Total Environ. 2018, 624, 438–450. [Google Scholar] [CrossRef] [PubMed]
- Zhou, Z.Y.; Kang, J.; Jin, H. Study on sound preference evaluation and its influencing factors in urban historical areas. Build. Sci. 2012, 28, 40–45, 88. (In Chinese) [Google Scholar]
- Chen, Z.S.; Yu, L.M. The present situation and development trend of elderly hearing in China. Chin. Sci. J. Hear. Speech Rehabil. 2020, 18, 245–249. (In Chinese) [Google Scholar]
- Paneerchelvam, P.T.; Maruthaveeran, S.; Maulan, S.; Abd Shukor, S.F. The use and associated constraints of urban greenway from a socioecological perspective: A systematic review. Urban For. Urban Green. 2020, 47, 126508. [Google Scholar] [CrossRef]
- Dong, W.; Zhu, X.; Zhao, X.L. Research on correlation between built environment characteristics of community greenway and intensity of physical activities: A case study of Shenzhen. Landsc. Archit. 2021, 28, 93–99. (In Chinese) [Google Scholar]
- Stigsdotter, U.K.; Corazon, S.S.; Sidenius, U.; Refshauge, A.D.; Grahn, P. Forest design for mental health promotion—Using perceived sensory dimensions to elicit restorative responses. Landsc. Urban Plan. 2017, 160, 1–15. [Google Scholar] [CrossRef]
- Watts, G.R.; Pheasant, R.J. Tranquillity in the Scottish Highlands and Dartmoor National Park—The importance of soundscapes and emotional factors. Appl. Acoust. 2015, 89, 297–305. [Google Scholar] [CrossRef] [Green Version]
Figure 1.
Geographical location of Beigushan Forest Park in Lianyungang.

Figure 2.
Sampling point distribution map.

Figure 3.
Research framework.

Figure 4.
Statistical results of respondents’ personal characteristics (a–h): gender, age, companion, the distance from home to the park, duration, frequency, and the time period of exercise and exercise intensity.
Figure 4.
Statistical results of respondents’ personal characteristics (a–h): gender, age, companion, the distance from home to the park, duration, frequency, and the time period of exercise and exercise intensity.

Figure 5.
Average landscape preferences of exercisers in urban forest park.

Figure 6.
Average soundscape preferences of exercisers in urban forest park.

Figure 7.
Radar map of soundscape (a) and visual landscape (b) preferences distribution of exercisers at different genders.
Figure 7.
Radar map of soundscape (a) and visual landscape (b) preferences distribution of exercisers at different genders.

Figure 8.
Radar map of soundscape (a) and visual landscape (b) preferences distribution of exercisers at different ages.
Figure 8.
Radar map of soundscape (a) and visual landscape (b) preferences distribution of exercisers at different ages.

Figure 9.
Radar map of soundscape (a) and visual landscape (b) preferences distribution of exercisers at different companions.
Figure 9.
Radar map of soundscape (a) and visual landscape (b) preferences distribution of exercisers at different companions.

Figure 10.
Radar map of soundscape (a) and visual landscape (b) preferences distribution of exercisers at different exercise frequencies.
Figure 10.
Radar map of soundscape (a) and visual landscape (b) preferences distribution of exercisers at different exercise frequencies.

Figure 11.
Radar map of soundscape (a) and visual landscape (b) preferences distribution of exercisers at different exercise intensity.
Figure 11.
Radar map of soundscape (a) and visual landscape (b) preferences distribution of exercisers at different exercise intensity.

Figure 12.
Structural equation model of audio-visual preferences and exercise feelings.


Table 1.
Exerciser landscape and soundscape preference system.
| Question | Sub-Factors | Type | Key Findings | Reference |
|---|---|---|---|---|
| Q5 Activities other than exercise | Family bonding type activities | Activity type | Exercisers may engage in activities in the park other than those related to exercise activities, and these activities may influence, to some extent, exercisers’ preferences for landscape and soundscape. | [33] |
| Social activities | ||||
| Leisure activities | ||||
| Quiet-type activities | ||||
| Group activities | ||||
| Just exercise | ||||
| Q6 Based on different types of exercise | Slow walking | Exercise form | The common types of exercise in the park are listed, and the correlation with landscape type and soundscape type is explored from the perspective of exercise type. | [45] |
| Jogging | ||||
| Brisk walking | ||||
| Using fitness equipment | ||||
| Square dance | ||||
| Gymnastics | ||||
| Chinese Martial arts | ||||
| Ball games | ||||
| Q10 Different types of areas based on parks | Square open space | Exercise site | Focus on the main types of sites present in the park, and study the preference of the exercisers for landscape types and soundscape types through the analysis of site types. | [40] |
| Lawn footpath | ||||
| Forest footpath | ||||
| Lakeside footpath | ||||
| Fitness equipment venue | ||||
| Q14 Evaluation of the landscape | Natural waterscape | Landscape | A comprehensive overview of the existing landscape in the park from five aspects: natural waterscape, topographic landscape, natural vegetation, artificial landscape, and artificial facilities, based on which to study the preference of exercisers for a certain landscape or landscape type. | [40] |
| Topographic landscape | ||||
| Natural vegetation | ||||
| Artificial landscape | ||||
| Artificial facilities | ||||
| Q15 Evaluation of Soundscape | Natural sounds | Soundscape | The soundscape is divided into three categories: natural, human activity and artificial sound, and the preference of the exercise population in the park for a certain soundscape is explored. | [33] |
| Human activity sounds | ||||
| Artificial sounds |
Table 2.
Correlation between different exercise forms and soundscape preferences.
| Sound Classification | Exercise Options | ||||||||
|---|---|---|---|---|---|---|---|---|---|
| Slow Walking | Jogging | Brisk Walking | Use Fitness Equipment | Square Dance | Gymnastics | Chinese Martial Arts | Ball Games | ||
| Natural sound | Sound of wind | 0.058 | 0.122 | −0.060 | −0.027 | 0.067 | −0.011 | −0.072 | −0.063 |
| Birdsong | 0.158 ** | 0.102 | 0.101 | 0.043 | 0.095 | 0.013 | 0.063 | −0.067 | |
| Cry of insects | 0.110 * | 0.070 | −0.031 | 0.043 | 0.082 | 0.017 | −0.004 | −0.067 | |
| Rustle of leaves | 0.117 * | 0.141 ** | 0.130 * | 0.013 | 0.079 | −0.017 | −0.032 | −0.071 | |
| Water flow sound | 0.157 ** | 0.023 | 0.086 | 0.024 | 0.032 | 0.007 | 0.123 * | 0.010 | |
| Human activity sound | Conversational voice | 0.023 | 0.071 | 0.021 | 0.062 | −0.034 | −0.083 | −0.049 | −0.019 |
| Sound of children playing | 0.024 | −0.009 | 0.009 | 0.075 | −0.016 | −0.048 | −0.025 | 0.020 | |
| Footsteps | 0.046 | 0.058 | −0.004 | 0.013 | −0.063 | −0.141 ** | −0.073 | 0.014 | |
| Exercise sound | −0.042 | 0.101 | −0.009 | 0.096 | 0.059 | −0.029 | 0.096 | 0.036 | |
| Artificial sound | Traffic sound | 0.028 | −0.033 | 0.005 | 0.015 | −0.066 | −0.019 | −0.039 | 0.017 |
| Entertainment sound | −0.017 | −0.024 | 0.008 | 0.017 | −0.031 | 0.059 | −0.005 | −0.024 | |
| Device music | −0.069 | −0.051 | −0.016 | 0.005 | 0.019 | 0.033 | −0.012 | 0.017 | |
| Construction noise | 0.043 | −0.007 | 0.000 | −0.010 | −0.148 ** | 0.012 | 0.021 | 0.019 | |
| Machine noise | 0.020 | 0.006 | −0.037 | 0.012 | −0.095 | −0.005 | −0.001 | 0.056 | |
| Broadcast | 0.022 | −0.088 | −0.011 | 0.078 | −0.084 | 0.012 | 0.013 | 0.054 | |
* Correlation is significant at the 0.05 level. ** Correlation is significant at the 0.01 level.
Table 3.
Correlation between different exercise site selections and soundscape preferences.
| Sound Classification | Field Options | |||||
|---|---|---|---|---|---|---|
| Square Open Space | Lawn Footpath | Forest Footpath | Lakeside Footpath | Fitness Equipment Venue | ||
| Natural sound | Sound of wind | −0.083 | 0.021 | 0.146 ** | 0.047 | 0.082 |
| Birdsong | −0.097 | 0.095 | 0.168 ** | 0.032 | 0.077 | |
| Cry of insects | −0.077 | 0.054 | 0.184 ** | −0.011 | 0.059 | |
| Rustle of leaves | 0.060 | 0.089 | 0.195 ** | 0.050 | 0.147 ** | |
| Water flow sound | −0.118 * | 0.036 | 0.052 | 0.135 * | 0.165 ** | |
| Human activity sound | Conversational voice | 0.080 | −0.052 | −0.034 | 0.025 | 0.096 |
| Sound of children playing | 0.012 | 0.018 | −0.021 | 0.020 | 0.048 | |
| Footsteps | 0.051 | −0.113 * | −0.075 | 0.002 | 0.025 | |
| Exercise sound | 0.074 | −0.156 ** | −0.089 | −0.075 | 0.127 * | |
| Artificial sound | Traffic sound | −0.024 | −0.012 | 0.006 | −0.032 | −0.018 |
| Entertainment sound | −0.010 | −0.029 | 0.060 | −0.056 | 0.044 | |
| Device music | 0.024 | −0.032 | 0.011 | −0.099 | 0.036 | |
| Construction noise | −0.113 * | −0.023 | −0.026 | −0.054 | −0.079 | |
| Machine noise | −0.070 | −0.056 | −0.052 | −0.077 | −0.053 | |
| Broadcast | −0.003 | 0.013 | −0.053 | −0.006 | 0.035 | |
* Correlation is significant at the 0.05 level. ** Correlation is significant at the 0.01 level.
Table 4.
Correlation between different exercise forms and visual landscape preferences.
| Landscapes | Exercise Options | ||||||||
|---|---|---|---|---|---|---|---|---|---|
| Slow Walking | Jogging | Brisk Walking | Use Fitness Equipment | Square Dance | Gymnastics | Chinese Martial Arts | Ball Games | ||
| Natural waterscape | Stream | 0.054 | 0.034 | 0.111 * | 0.018 | 0.087 | 0.011 | 0.073 | 0.023 |
| Pond and lake | 0.113 * | 0.084 | 0.091 | 0.028 | 0.106 | 0.015 | −0.015 | −0.020 | |
| Topographic landscape | Lawn | 0.059 | 0.039 | 0.064 | 0.045 | 0.145 ** | 0.033 | 0.045 | −0.056 |
| Avenue | 0.075 | 0.057 | 0.125 * | 0.094 | 0.142 * | 0.019 | 0.011 | −0.081 | |
| Hillside | 0.081 | 0.037 | 0.031 | 0.009 | 0.082 | 0.054 | −0.003 | −0.025 | |
| Lakeside | 0.085 | 0.005 | 0.059 | 0.008 | 0.109 | 0.009 | 0.062 | 0.008 | |
| Natural vegetation | Shrubs | −0.050 | 0.076 | 0.107 * | −0.096 | 0.034 | 0.028 | −0.043 | −0.034 |
| Ornamental flower | 0.048 | 0.006 | 0.021 | 0.032 | 0.123 * | 0.055 | 0.111 * | −0.005 | |
| Forest | 0.040 | 0.079 | 0.155 ** | 0.039 | 0.097 | −0.069 | 0.080 | 0.033 | |
| Artificial landscape | Rockery | 0.051 | 0.001 | 0.038 | −0.022 | 0.099 | 0.066 | 0.111 * | −0.033 |
| Parterre | 0.069 | 0.018 | 0.045 | 0.010 | 0.118 * | 0.077 | 0.129 * | 0.055 | |
| Fountain | 0.05 | −0.029 | 0.012 | 0.013 | 0.080 | 0.090 | 0.064 | 0.071 | |
| Sculpture | 0.049 | −0.030 | 0.005 | 0.003 | 0.056 | 0.079 | 0.081 | 0.075 | |
| Bridge and pavilion | 0.081 | −0.037 | 0.005 | 0.067 | 0.140 ** | 0.087 | 0.046 | 0.060 | |
| Communal facilities | Fitness equipment | −0.047 | 0.075 | 0.061 | 0.139 ** | 0.180 ** | 0.062 | 0.121 * | 0.007 |
| Square | 0.004 | 0.066 | −0.040 | 0.049 | 0.133 * | −0.004 | 0.063 | 0.074 | |
| Public building | −0.018 | 0.054 | −0.078 | 0.021 | 0.082 | 0.044 | −0.016 | 0.049 | |
* Correlation is significant at the 0.05 level. ** Correlation is significant at the 0.01 level.
Table 5.
Correlation between different exercise site selections and visual landscape preferences.
| Landscapes | Field Options | |||||
|---|---|---|---|---|---|---|
| Square Open Space | Lawn Footpath | Forest Footpath | Lakeside Footpath | Fitness Equipment Venue | ||
| Natural waterscape | Stream | 0.066 | 0.017 | 0.108 * | 0.100 | 0.129 * |
| Pond and lake | 0.015 | 0.002 | 0.120 * | 0.110 | 0.105 | |
| Topographic landscape | Lawn | 0.008 | 0.183 | 0.033 | 0.026 | 0.136 * |
| Avenue | 0.005 | 0.062 | 0.118 * | −0.050 | 0.092 | |
| Hillside | 0.050 | 0.051 | 0.069 | 0.041 | 0.150 ** | |
| Lakeside | 0.056 | −0.021 | −0.009 | 0.115 | 0.092 | |
| Natural vegetation | Shrubs | −0.046 | −0.018 | 0.110 * | −0.036 | 0.069 |
| Ornamental flower | 0.016 | 0.009 | 0.031 | −0.006 | 0.086 | |
| Forest | −0.012 | 0.043 | 0.110 * | −0.029 | 0.077 | |
| Artificial landscape | Rockery | 0.006 | −0.010 | 0.009 | 0.013 | 0.117 * |
| Parterre | 0.084 | 0.002 | 0.003 | 0.039 | 0.129 * | |
| Fountain | −0.013 | −0.022 | −0.006 | 0.068 | 0.145 ** | |
| Sculpture | 0.058 | 0.003 | −0.073 | 0.039 | 0.121 | |
| Bridge and pavilion | −0.028 | 0.007 | −0.057 | 0.096 | 0.130 * | |
| Communal facilities | Fitness equipment | 0.088 | −0.048 | −0.006 | −0.036 | 0.238 ** |
| Square | 0.114 * | −0.039 | −0.038 | −0.028 | 0.227 ** | |
| Public Building | 0.039 | −0.063 | −0.044 | 0.025 | 0.172 ** | |
* Correlation is significant at the 0.05 level. ** Correlation is significant at the 0.01 level.
Table 6.
Correlation between the choices of other types of activities other than exercise and visual landscape preferences.
Table 6.
Correlation between the choices of other types of activities other than exercise and visual landscape preferences.
| Landscapes | Other Activities besides Exercise | ||||||
|---|---|---|---|---|---|---|---|
| Family Activities | Social Activities | Leisure Activities | Quiet–Type Activities | Group Activities | Just Exercise | ||
| Natural waterscape | Stream | 0.123 ** | 0.025 | 0.060 | 0.008 | 0.086 | −0.046 |
| Pond and lake | 0.107 * | 0.013 | 0.067 | −0.006 | 0.038 | −0.020 | |
| Topographic landscape | Lawn | 0.234 ** | −0.010 | −0.009 | 0.000 | 0.017 | −0.035 |
| Avenue | 0.176 ** | −0.022 | −0.034 | 0.058 | 0.021 | −0.037 | |
| Hillside | 0.102 | 0.012 | 0.059 | 0.038 | 0.021 | −0.007 | |
| Lakeside | 0.144 ** | 0.047 | 0.015 | −0.016 | 0.025 | −0.043 | |
| Natural vegetation | Shrubs | 0.124 | −0.009 | 0.038 | −0.099 | −0.036 | −0.020 |
| Ornamental flower | 0.196 ** | 0.043 | 0.014 | −0.140 ** | −0.008 | −0.044 | |
| Forest | 0.122 * | −0.024 | 0.042 | 0.023 | 0.012 | −0.087 | |
| Artificial landscape | Rockery | 0.093 | 0.070 | 0.082 | −0.110 * | 0.040 | 0.002 |
| Parterre | 0.194 ** | 0.026 | 0.069 | −0.081 | 0.090 | −0.001 | |
| Fountain | 0.180 ** | 0.054 | 0.088 | −0.115 * | 0.120 * | −0.006 | |
| Sculpture | 0.133 * | 0.112 * | 0.106 * | −0.062 | 0.082 | −0.050 | |
| Bridge and pavilion | 0.170 ** | 0.072 | 0.078 | −0.016 | 0.103 | −0.001 | |
| Communal facilities | Fitness equipment | 0.174 ** | 0.044 | 0.095 | −0.042 | 0.155 ** | 0.001 |
| Square | 0.166 ** | 0.017 | 0.120 * | −0.012 | 0.133 * | −0.020 | |
| Public Building | 0.137 * | 0.086 | 0.090 | −0.017 | 0.144 ** | −0.070 | |
* Correlation is significant at the 0.05 level. ** Correlation is significant at the 0.01 level.
Table 7.
Correlation between the choices of other types of activities other than exercise and soundscape preferences.
Table 7.
Correlation between the choices of other types of activities other than exercise and soundscape preferences.
| Sound Classification | Other Activities besides Exercise | ||||||
|---|---|---|---|---|---|---|---|
| Family Activities | Social Activities | Leisure Activities | Quiet–Type Activities | Group Activities | Just Exercise | ||
| Natural sound | Sound of wind | 0.040 | 0.064 | 0.068 | 0.031 | 0.081 | 0.023 |
| Birdsong | 0.142 ** | −0.012 | 0.009 | 0.023 | 0.035 | 0.000 | |
| Cry of insects | 0.160 ** | 0.019 | 0.018 | 0.060 | 0.045 | −0.087 | |
| Rustle of leaves | 0.141 ** | 0.025 | 0.060 | 0.035 | 0.094 | −0.024 | |
| Water flow sound | 0.171 ** | 0.002 | 0.072 | 0.050 | 0.085 | −0.020 | |
| Human activity sound | Conversational voice | 0.006 | 0.120 * | 0.122 * | −0.056 | 0.041 | −0.036 |
| Sound of children playing | 0.086 | 0.091 | 0.104 | −0.048 | 0.082 | −0.054 | |
| Footsteps | 0.081 | 0.046 | 0.151 ** | −0.031 | 0.026 | −0.070 | |
| Exercise sound | 0.017 | 0.008 | 0.072 | −0.031 | 0.015 | 0.037 | |
| Artificial sound | Traffic sound | −0.093 | 0.028 | −0.022 | −0.026 | −0.004 | −0.003 |
| Entertainment sound | −0.105 | 0.025 | −0.070 | −0.058 | 0.038 | −0.004 | |
| Device music | −0.069 | 0.071 | −0.028 | −0.047 | 0.029 | 0.004 | |
| Construction noise | −0.020 | 0.022 * | 0.023 | −0.048 | 0.024 | −0.105 | |
| Machine noise | −0.051 | −0.021 * | 0.036 | −0.045 | 0.009 | −0.092 | |
| Broadcast | 0.012 | 0.068 | 0.003 | −0.029 | −0.006 | −0.106 * | |
* Correlation is significant at the 0.05 level. ** Correlation is significant at the 0.01 level.
Table 8.
Collinearity diagnostics.
| Collinearity Diagnostics | ||
|---|---|---|
| Tolerance | VIF | |
| Waterscape | 0.393 | 2.545 |
| Topography | 0.329 | 3.042 |
| Natural vegetation | 0.321 | 3.120 |
| Manufactured Landscapes | 0.330 | 3.030 |
| Communal facilities | 0.422 | 2.369 |
| Natural sound | 0.588 | 1.701 |
| Human activity sound | 0.984 | 1.016 |
| Artificial sound | 0.882 | 1.133 |
Table 9.
Path analysis of modified structural equation model.
| Path | Estimate | S.E. | C.R. | p |
|---|---|---|---|---|
| Waterscape ← Visual landscape preference | 0.976 | 0.054 | 17.979 | <0.001 |
| Topography ← Visual landscape preference | 0.913 | 0.046 | 19.991 | <0.001 |
| Natural vegetation ← Visual landscape preference | 0.863 | 0.045 | 19.257 | <0.001 |
| Manufactured Landscapes ← Visual landscape preference | 0.777 | 0.050 | 15.508 | <0.001 |
| Communal facilities ← Visual landscape preference | 0.741 | 0.057 | 13.029 | <0.001 |
| Natural sound ← Soundscape preference | 0.740 | 0.041 | 18.003 | <0.001 |
| Human activity sound ← Soundscape preference | 0.060 | 0.031 | 1.938 | 0.047 |
| Artificial sound ← Soundscape preference | −0.414 | 0.083 | −4.971 | <0.001 |
| Exercise feeling ← Visual landscape preference | 0.649 | 0.095 | 6.807 | <0.001 |
| Exercise feeling ← Soundscape preference | 0.059 | 0.101 | 0.579 | 0.034 |
Publisher’s Note: MDPI stays neutral with regard to jurisdictional claims in published maps and institutional affiliations. |
© 2022 by the authors. Licensee MDPI, Basel, Switzerland. This article is an open access article distributed under the terms and conditions of the Creative Commons Attribution (CC BY) license (https://creativecommons.org/licenses/by/4.0/).
Share and Cite
MDPI and ACS Style
Xu, J.; Li, M.; Gu, Z.; Xie, Y.; Jia, N. Audio-Visual Preferences for the Exercise-Oriented Population in Urban Forest Parks in China. Forests 2022, 13, 948. https://0-doi-org.brum.beds.ac.uk/10.3390/f13060948
AMA Style
Xu J, Li M, Gu Z, Xie Y, Jia N. Audio-Visual Preferences for the Exercise-Oriented Population in Urban Forest Parks in China. Forests. 2022; 13(6):948. https://0-doi-org.brum.beds.ac.uk/10.3390/f13060948
Chicago/Turabian StyleXu, Jian, Muchun Li, Ziyang Gu, Yongle Xie, and Ningrui Jia. 2022. "Audio-Visual Preferences for the Exercise-Oriented Population in Urban Forest Parks in China" Forests 13, no. 6: 948. https://0-doi-org.brum.beds.ac.uk/10.3390/f13060948
Note that from the first issue of 2016, this journal uses article numbers instead of page numbers. See further details here.