Article

Phenotypic Variation in Seed Morphochemical and Seedling Traits in Four Chinese Provenances of Xanthoceras sorbifolium

1
Key Laboratory for Silviculture and Conservation, Ministry of Education, Beijing Forestry University, 35 East Qinghua Road, Haidian District, Beijing 100083, China
2
Department of Horticulture and Landscape Architecture, Purdue University, West Lafayette, IN 47907, USA
*
Author to whom correspondence should be addressed.
Submission received: 8 April 2022 / Revised: 12 June 2022 / Accepted: 15 June 2022 / Published: 19 June 2022
(This article belongs to the Section Forest Ecophysiology and Biology)

Abstract

:
Variability in seed and seedling traits of Xanthoceras sorbifolium Bunge was evaluated at the population level. Seed samples were collected from four provenances in China and examined for variations in morphometric traits, chemical components, and seedling growth in the nursery stage. There were significant differences in the seed length, width, dry weight, 1000-seed weight, oil concentration, Mg and Cu concentrations, root biomass, and root–stem biomass ratio. The largest seed in terms of size and weight was from Ongniud Banner, Inner Mongolia (OB), but these seeds also had the lowest seed oil concentration. At the end of the first growing season in the nursery, seedlings stopped growing one month earlier in height than in diameter. The provenance difference in height was significant at the first 2 months after sowing but disappeared later. Genotypic variance (Vg) was found to be higher than corresponding environmental (Ve) variance for seed length, seed width, seed dry weight, 1000-seed weight, diameter, and root biomass, indicating that these parameters were strongly inherited and there was ample scope for improvement. Moreover, correlations between seed and seedling traits and climatic and geographical factors were assessed. Some significant intercharacter correlations were found, such as between seed length, width and seed weight, between oil concentration and seed size, and between seedling height, diameter, and root biomass. Combining the seed- and seedling-related parameters, our results indicated that Mulei, Xinjiang (ML) may be used as an ideal material for a further improvement program.

1. Introduction

Xanthoceras sorbifolium Bunge, commonly known as yellow horn, is an oil-rich seed species that belongs to the Sapindaceae family. The oil concentration is about 55–66% in the seed kernel. Historically, X. sorbifolium seed oil was used for illuminating oil and cooking oil [1]. Recently, it has been used to produce renewable and environmentally friendly biodiesel and was considered as one of the eight species listed by the national authorities for the production of biodiesel. Moreover, so far, the planted area of yellow horn has increased to 5 × 10⁵ ha. [2]. As an alternative to petrodiesel, the production of X. sorbifolium has received much attention [3,4,5,6,7]. It was reported that yellow horn has experienced extensive management and a ratio of female to male flowers over the past several decades, which has led to low seed yields, i.e., the average yield of mature trees was 670 kg/ha, while 2000 kg/ha was expected under the elite germplasm choice and optimal cultivation and management [8,9]. The performance can be improved if the seed from a broad genetic base or from provenance selection is used to match specific site conditions.
Genetic variation within and between populations and seed sources are essential to exploit the improvement potential. Provenance variation, with respect to seed and seedling morphological, anatomical, physiological, and biochemical traits, has been well studied for a number of tree species [10,11,12]. Therefore, a screening test is necessary to take advantage of the naturally available genetic variation so to select the ideal planting material for better productivity.
X. sorbifolium has large range of distribution in North China, extending from 28°34′–47°20′ N, 73°20′–120°25′ E, and at a mean annual rainfall of between 43 and 969 mm [8]. Since the environmental conditions vary extensively within the natural range of the species, genetic variation among X. sorbifolium provenances would be expected in some traits. However, to date, little work has been done on the relationship between seed traits and seedling growth performance. In this study, seeds of four provenances from across the natural range of X. sorbifolium were examined for differences in both seed morphochemical traits and seedling growth and architectural traits in the nursery. The specific aims of this study were to: (1) determine the variation in seed and seedling traits among four different X. sorbifolium provenances; (2) evaluate the broad-sense heritability and correlations among traits in X. sorbifolium; (3) assess the correlations among seed and seedling traits and correlations between these traits and environmental conditions; (4) evaluate the four provenances based on these traits. The results will illustrate the relationship between the morphological and chemical traits of seeds from four provenances and help to choose seeds with desired chemical components based on that relationship. Furthermore, this study will offer guidance on how to predict the seedling growth performance according to the seed morphochemical traits.

2. Materials and Methods

2.1. Plant Materials

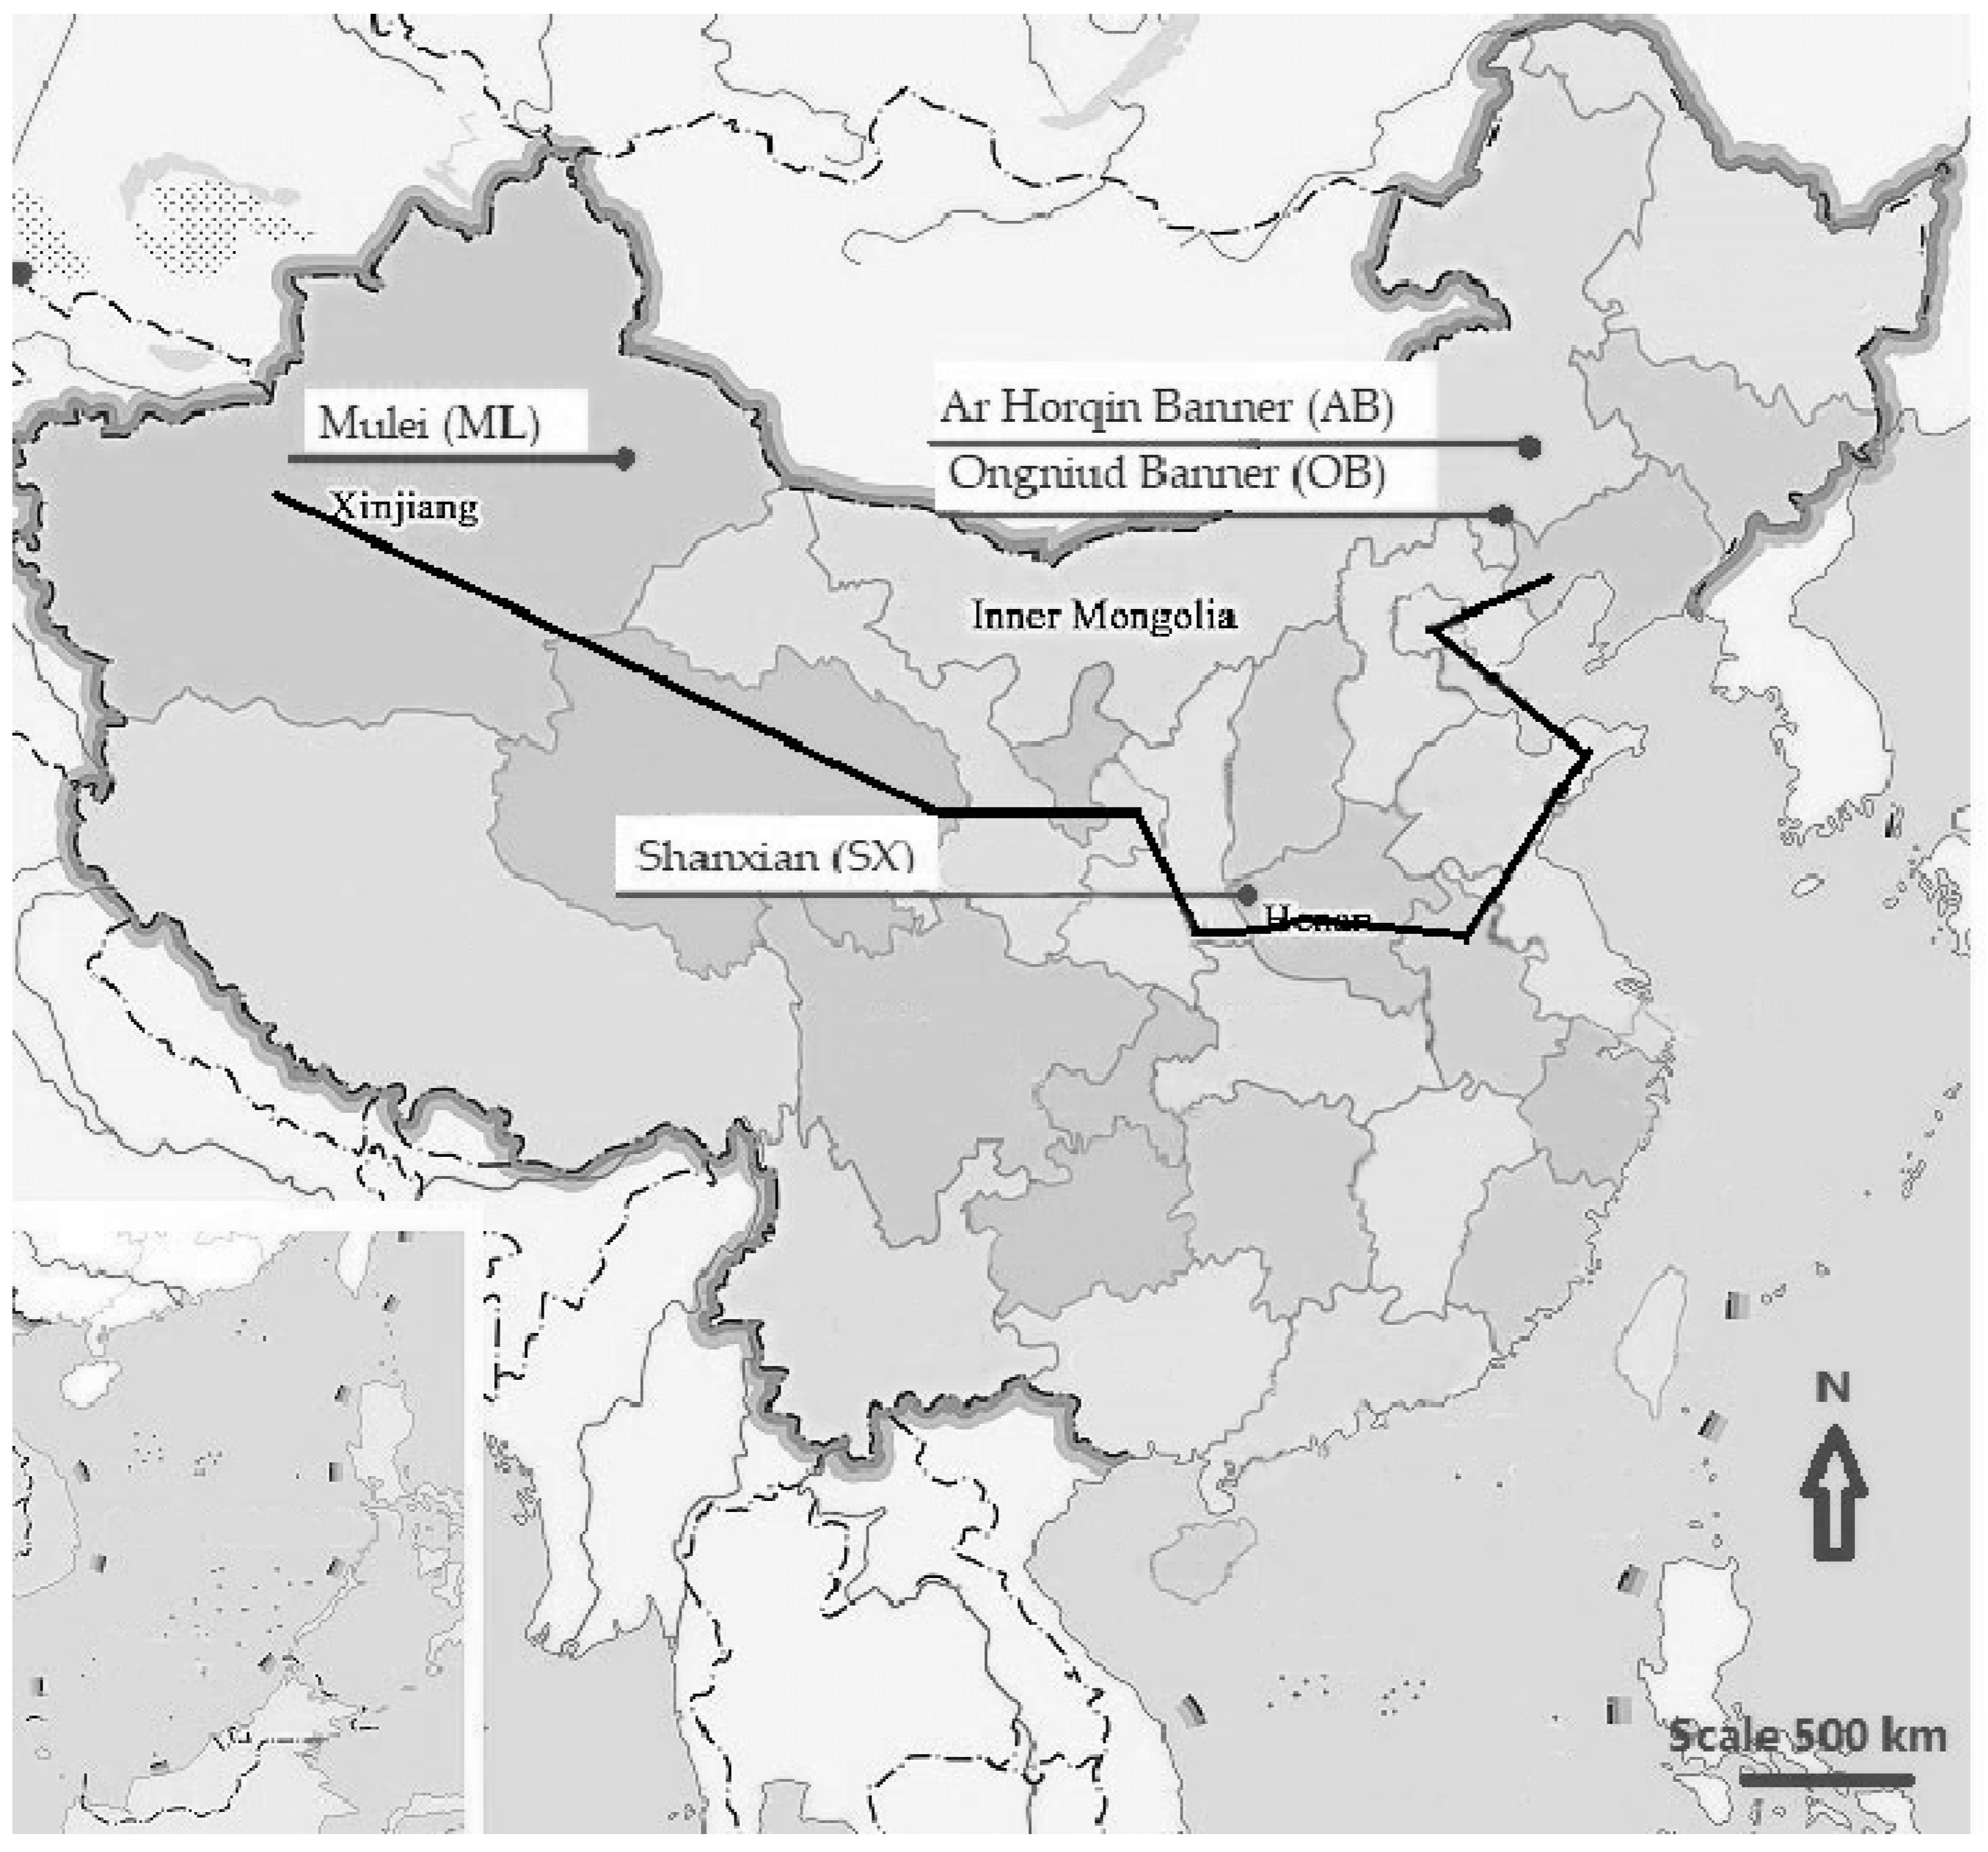
X. sorbifolium seeds were harvested from four provenances in China, arrayed from east to west: Ar Horqin Banner, Inner Mongolia Autonomous Region (AB); Ongniud Banner, Inner Mongolia Autonomous Region (OB); Shanxian, Henan Province (SX); Mulei, Xinjiang Uygur Autonomous Region (ML). The four provenances span the natural distribution range of the species in China, with the AB, ML, and SX provenances representing the northeastern, northwestern, and southern ranges of distribution of the species, respectively [13]. The geographic locations and climatic conditions of the different provenances are presented in Table 1 and Figure 1. These trees were established by farmers from locally collected seeds from wild sources. In each provenance, to ensure the maximum genetic variation within the population, 2 kg of seeds were collected from all directions of the outer crown of 30 dominant candidate trees. These trees were spaced 30–40 m apart and the seeds were extracted from fruits collected at the peak of the fruit season (July–August) in 2014. All seeds from the same provenance were pooled. Seeds were placed in partially sealed polyethylene bags (100 μm thick, permeable to carbon dioxide and oxygen, yet largely impermeable to moisture), and stored at 2 °C.

2.2. Determination of Seed Characteristics

Determination of seed characteristics was made on each of the 40 seed replicates, drawn at random from the pooled samples from each provenance. Measurement of each trait was performed on the specified number of samples. Five samples of 40 seeds from each provenance were used to measure seed size. Seed length (SL) and width (SW) were measured using a digital vernier caliper (Deli LLC, Ningbo, China). The 1000-seed weight (1000 SW) was determined by measuring the fresh weight (digital balance, UX820H, Shanghai Xiangfan Instruments Ltd., Shanghai, China) of eight samples of 100 seeds, and the 1000-seed weight was calculated. After measuring the morphological parameters, the seeds were oven dried at 80 °C for 4–5 h to determine individual seed dry weight (SDW).
Dried seeds were then crushed into powder, and about 0.2 g of each sample was sieved through a 0.25 mm screen. Determination was carried out after four technical replications of sieving. The samples were wet-digested using the H2SO4–H2O2 method [14]. Total nitrogen concentration was determined by the micro-Kjeldehl method (UDK-152, Velp Scientifica, Deer Park, NY, USA) [15]. Seed crude protein concentration (SCPC) was then estimated by the multiplication of factor 6.25 with N concentration [16]. Seed soluble sugar concentration (SSSC) was determined on five replicates using an anthrone colorimetry method [17].
To determine seed oil concentration (SOC), each 100-seed sample was dried to a constant weight at 80 °C, and then pulverized with ball mills. The organic solvent was petroleum ether (boiling point, 60 °C). The kernel oil components were extracted using Soxhlet extraction (Soxtec 8000, FOSS, Hillerod, Denmark) through the following process: boil pulverized seeds at 120 °C for 5 min, leach oils for 1 h, and recover oils for 25 min. The kernel oil weight of five replicates was calculated according to the weight difference between the extraction products and the samples [3].
Seed mineral concentrations (N, P, K, Ca, Mg, Cu, Zn, Fe, and Mn) of five replicates were determined using atomic-absorption spectrophotometry (Varian SpectrAA 220FS, VARIAN Technology Co., Ltd., Palo Alto, CA, USA). Samples were prepared according to the standard method as described in AOAC [18].

2.3. Assessment of Seedling Traits

For assessment of the variability in seedling growth parameters, a nursery experiment was performed in a greenhouse at the Beijing Forestry University Forest Science Co., Ltd. (Beijing, China, 40°00′ N, 116°34′ E). Four replicates of 60 seeds per provenance were randomly sampled and arranged in a completely randomized design. Seeds were sown on 2 April 2014 (one seed per container) at a depth of 1–2 cm in a 1050 mL plastic cuboid-shaped container (8 cm diameter × 20 cm deep) filled with a peat: vermiculite 3:1 ratio by volume. Trays were placed on rolling benches under natural light in the greenhouse and rotated weekly to minimize microsite effects. The seedlings were irrigated as needed and grown in temperatures of 24:21 °C (day:night).
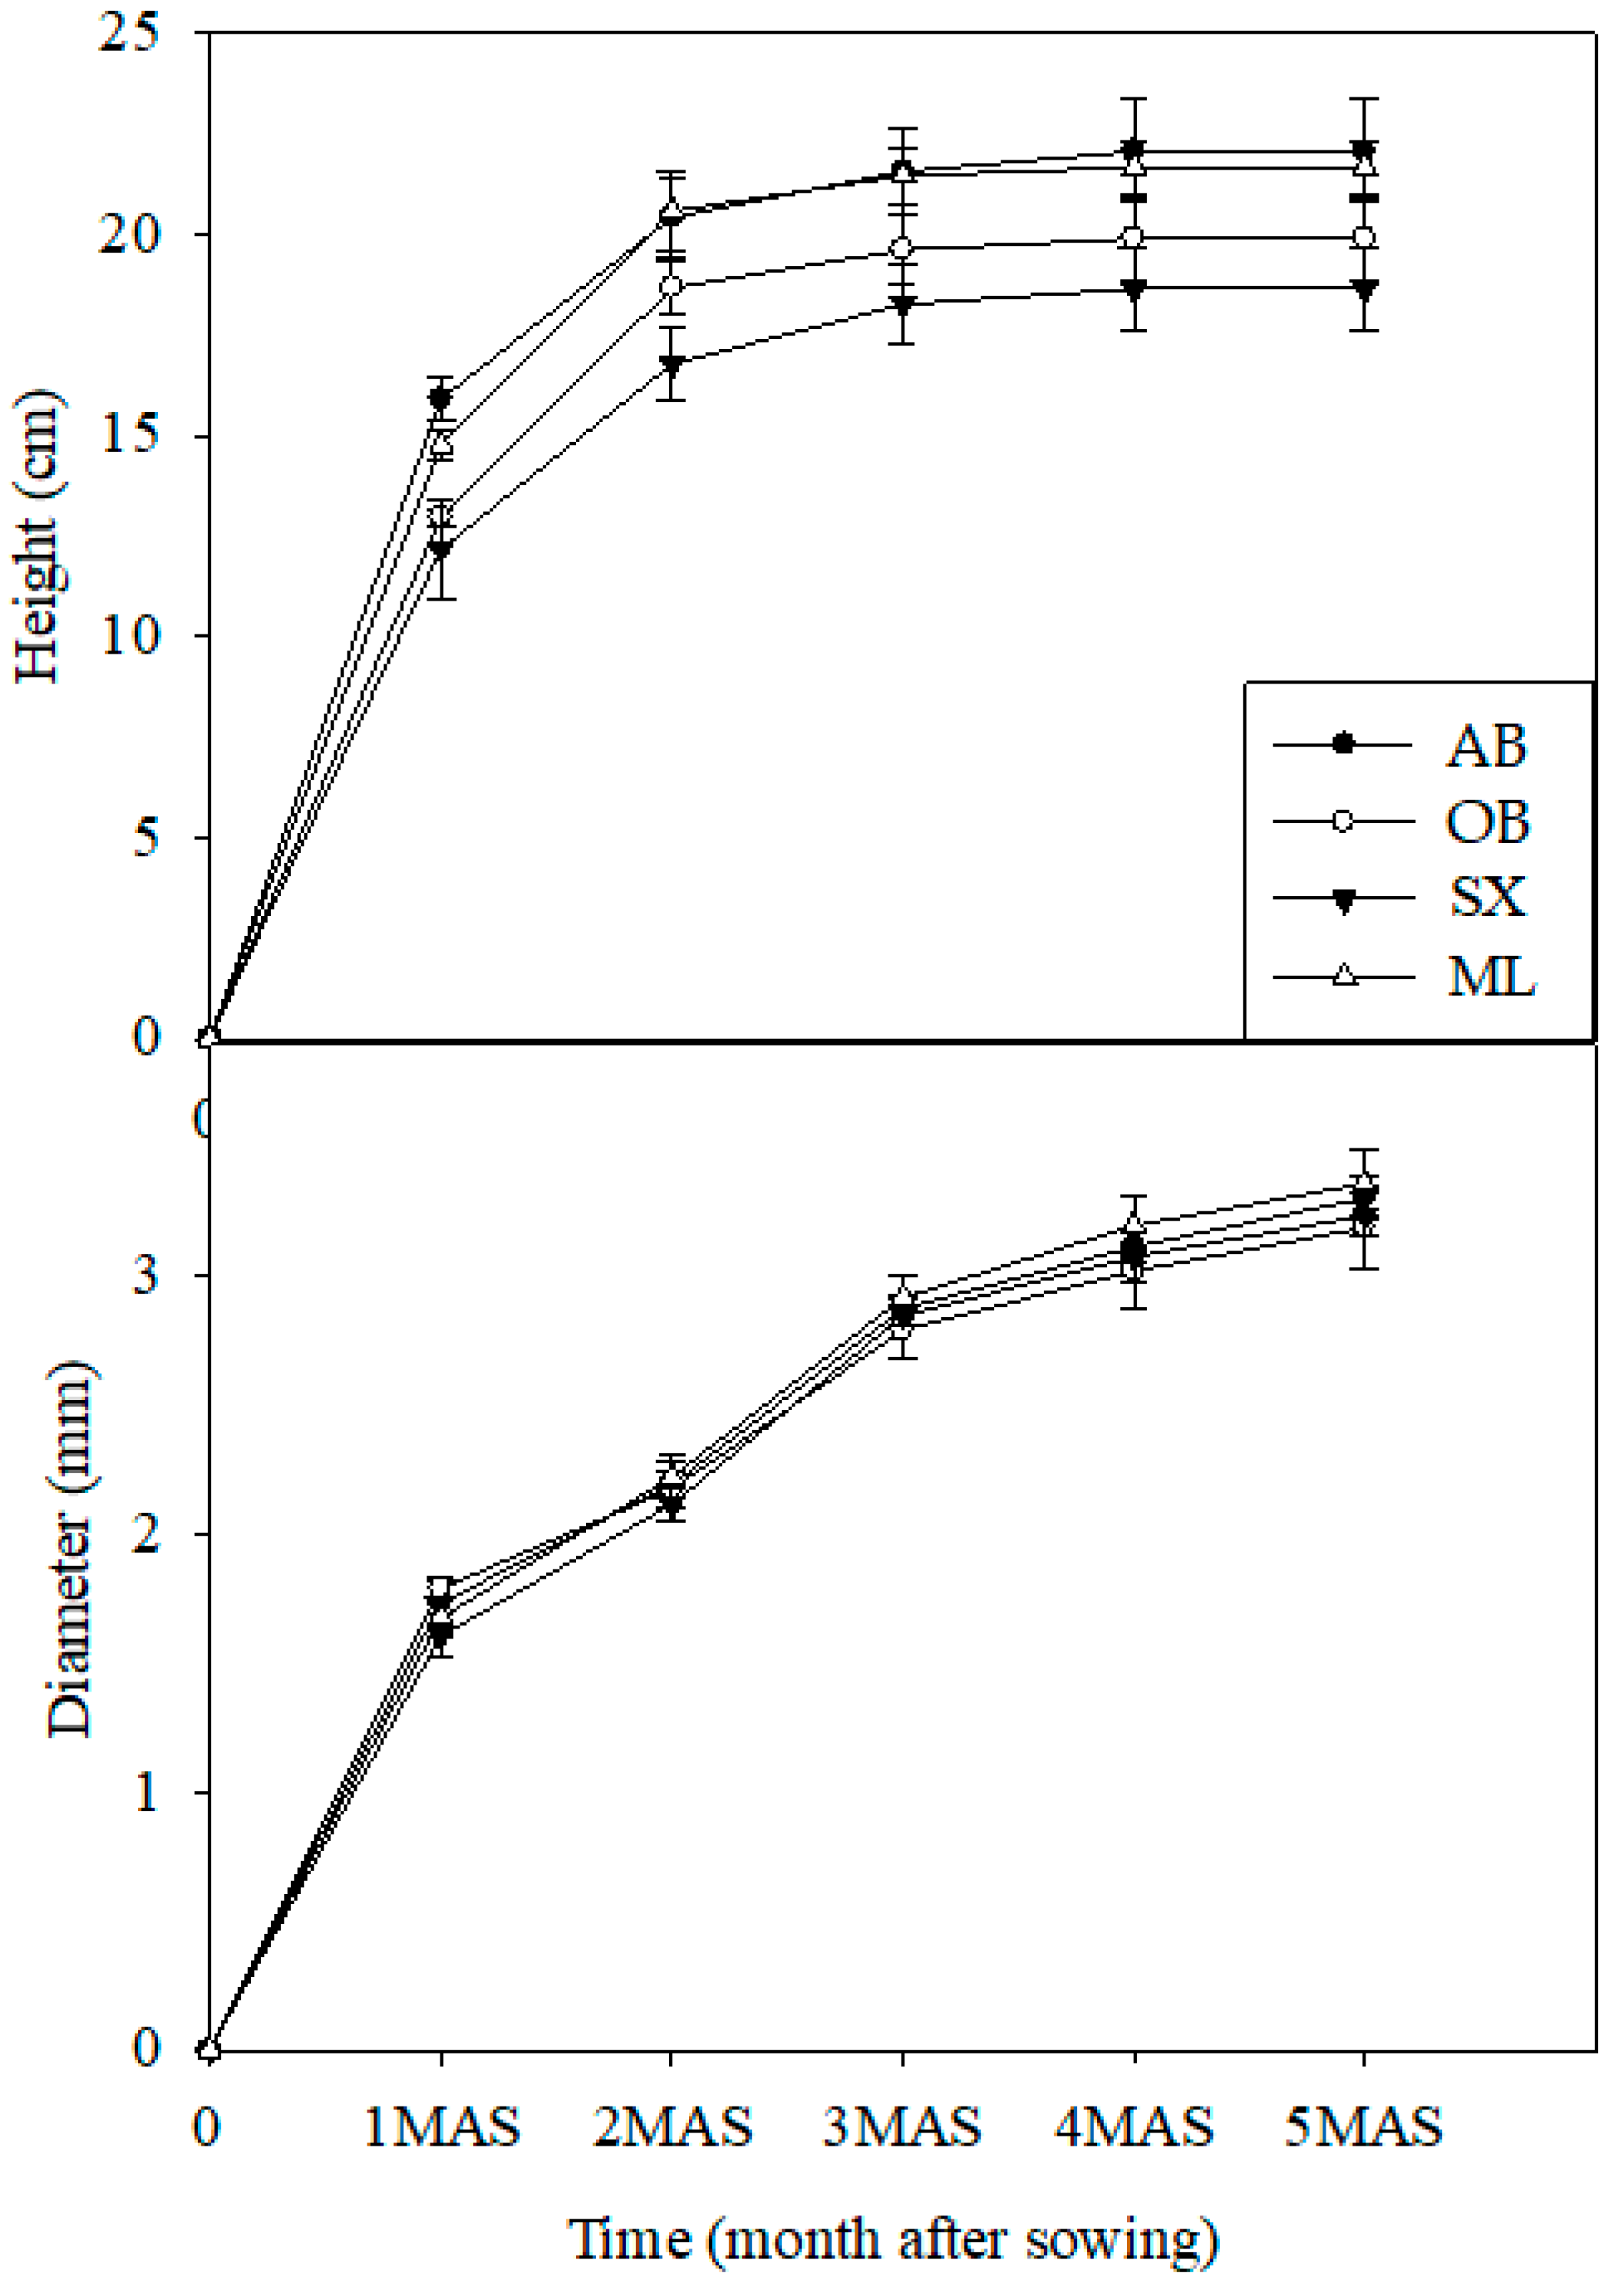
Eight seedlings were selected randomly from each replicate, resulting in a total of 32 seedlings per provenance. Thirty days after sowing, seedling height (H) and diameter (D) at ground level were recorded on selected seedlings every 30 days until growth cessation (150 days after sowing) [19,20]. In late October, a final destructive sampling was performed. The eight seedlings (per replicate) were excavated and washed gently until free of growing medium and separated into stems and roots. Each plant tissue type was oven-dried at 70 °C for 48 h and then weighed using precision weighing balance to determine dry mass. Total biomass (TB) was calculated as the sum of root and stem dry mass (SB).
Prior to measuring the root dry mass (RB), the roots were scanned on a professional scanner (Epson Expression 1680 Pro, Seiko Epson Corporation, Nagano, Japan) and then analyzed by an image analysis system (WinRHIZO, Regent Instruments Inc., Quebec City, QC, Canada) to determine root length, surface area, and volume (RL, RA, and RB).

2.4. Statistical Analysis

All results were reported as the mean ± standard error (SE). Statistical analysis was performed using SPSS 24.0 (Chicago, IL, USA). The explore function was used to examine data for normality and homogeneity prior to analysis. Analysis of variance (ANOVA) was conducted to test the effects of provenance on the measured parameters. When the ANOVA analysis found significant differences among provenances, Duncan’s test was conducted to detect differences among provenance means (α = 0.05). The Pearson’s correlation coefficient was applied to assess correlations among the different seed and seedling traits. The Vp, representing total phenotypic variance in the provenances, consists of the Vg (genotypic variance) and Ve (environmental variance). The broad sense heritability (H2) and coefficient of variance (CV) were calculated by the following equations [21,22,23]:
  H 2 = V g V p  
  σ 2 g = V P σ 2 e B
CV =   S X ¯  
where Vg and Vp are the estimates of the genetic (σ2g) and residual (σ2e) variances derived from the expected mean squares of the variance analysis, B is the number of replicates, S is the standard deviation, and X ¯ is the mean of the sample data.
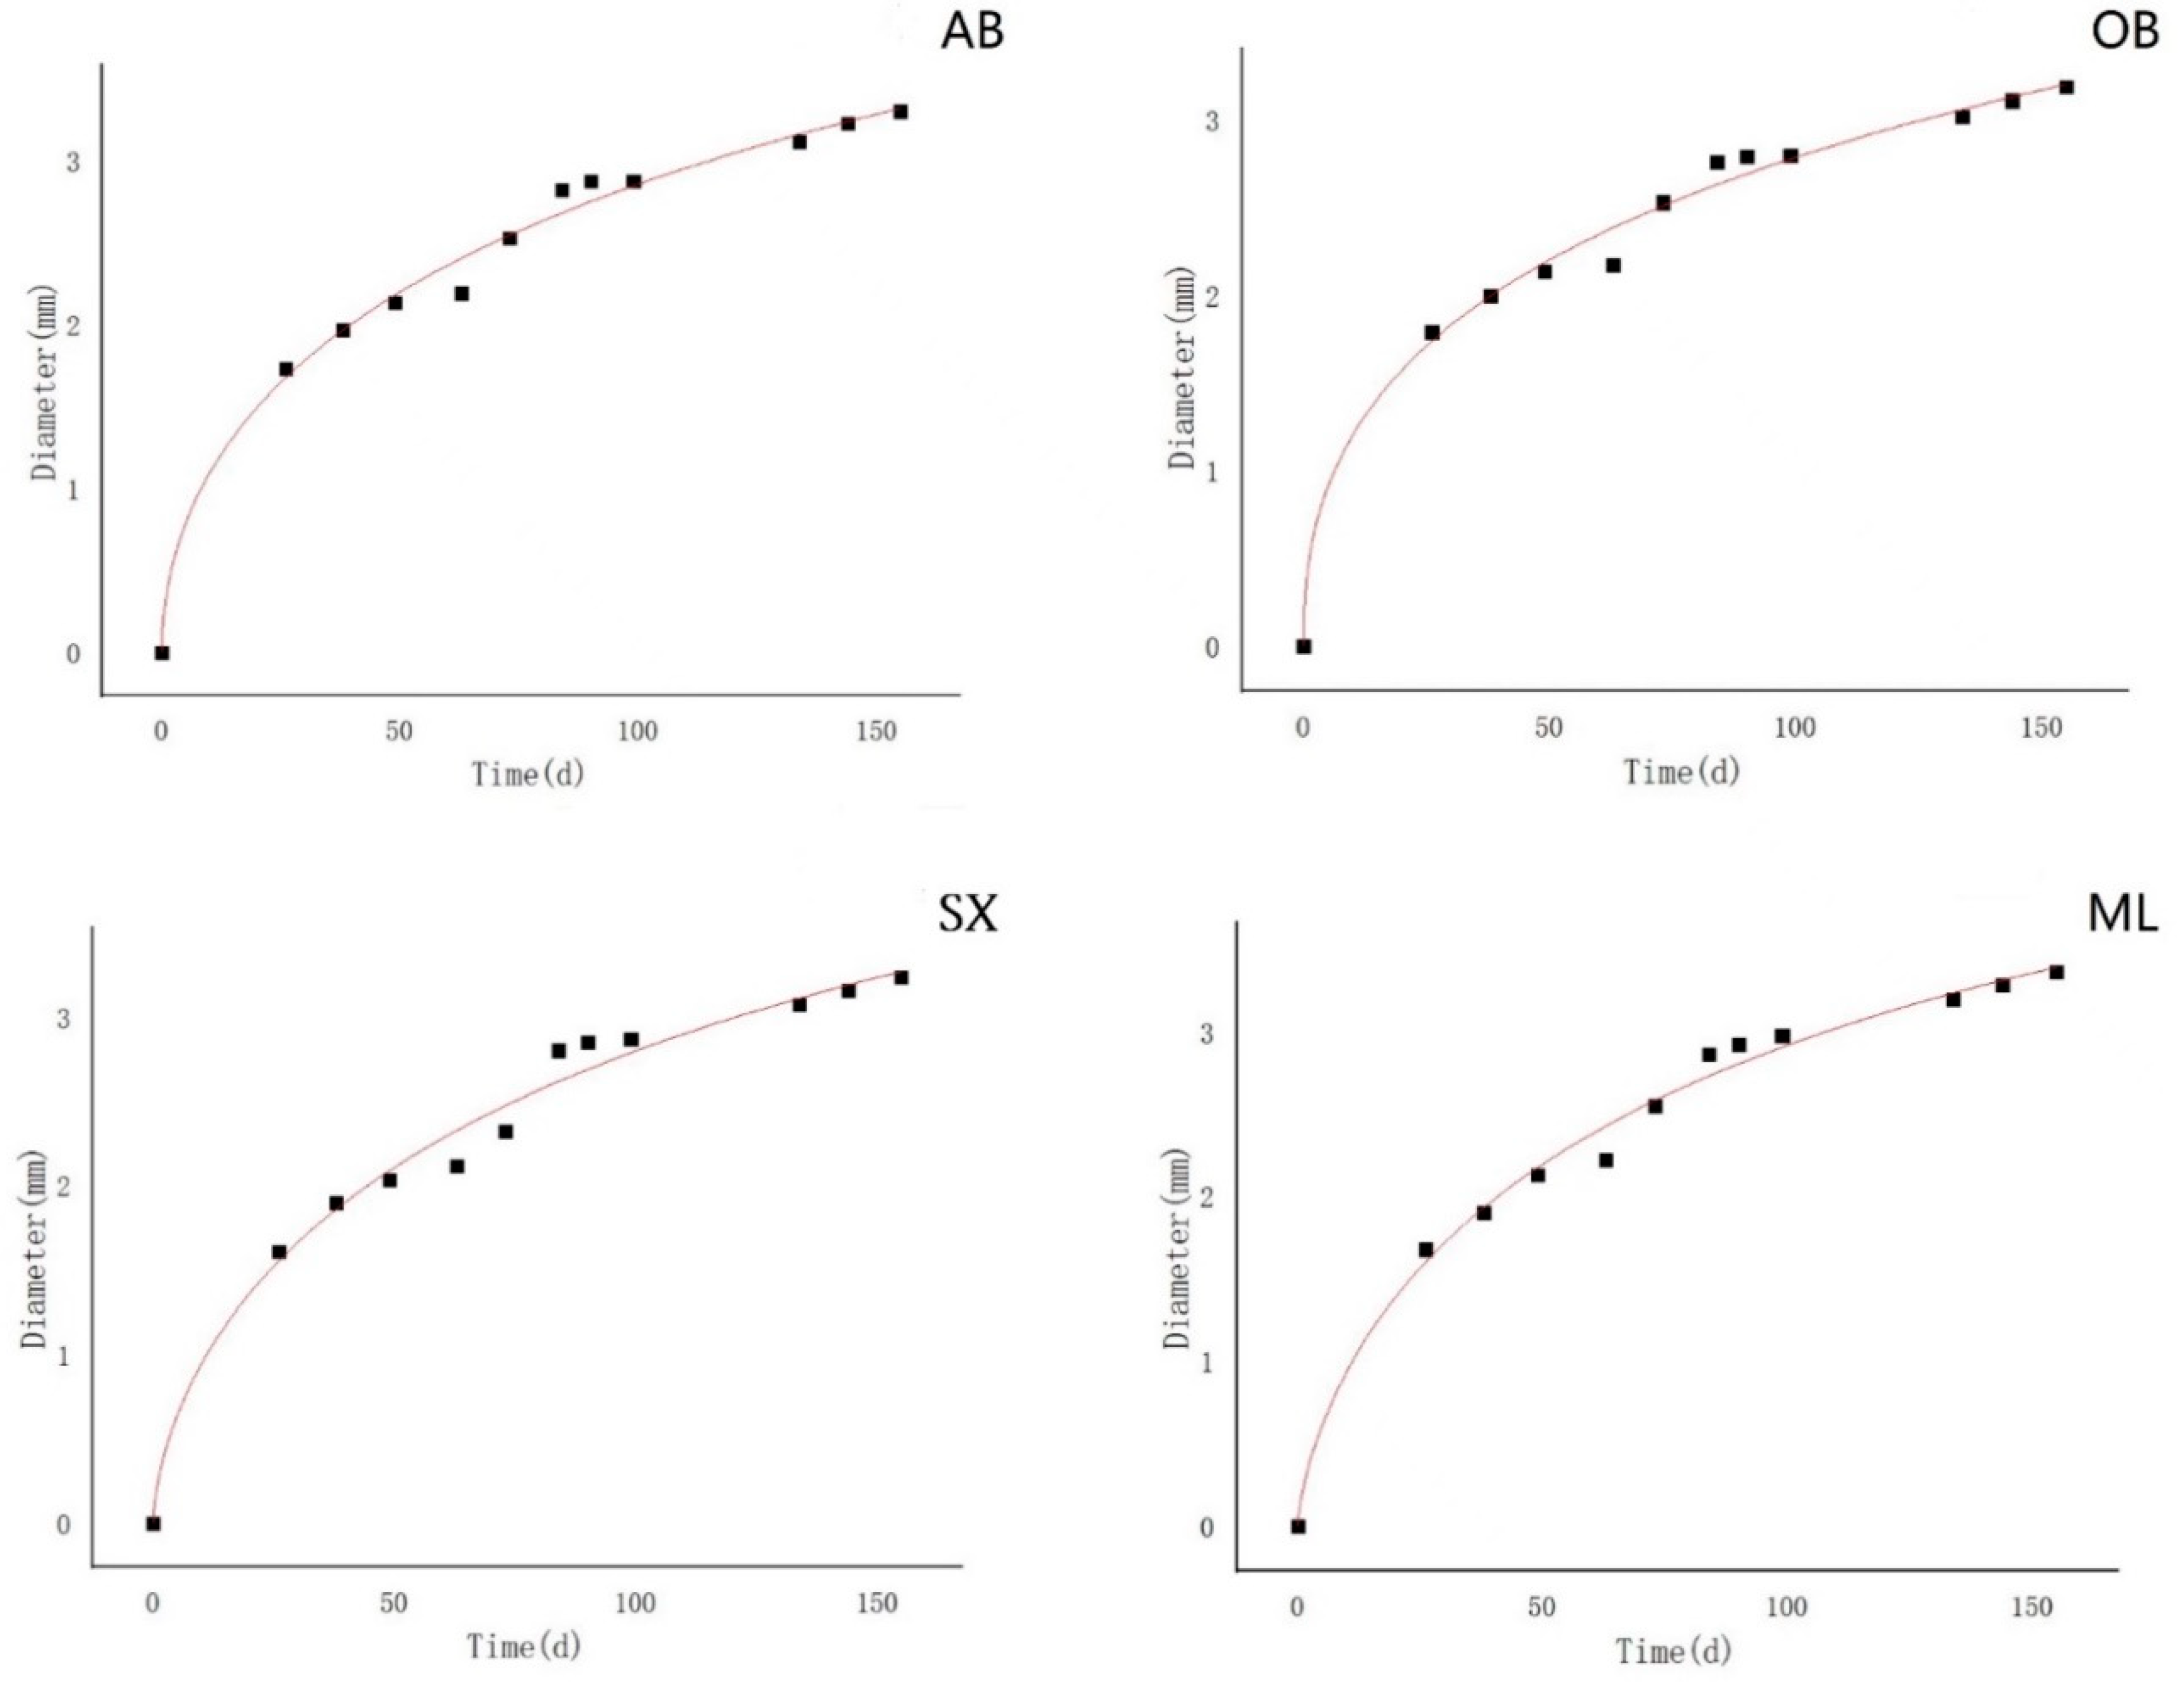
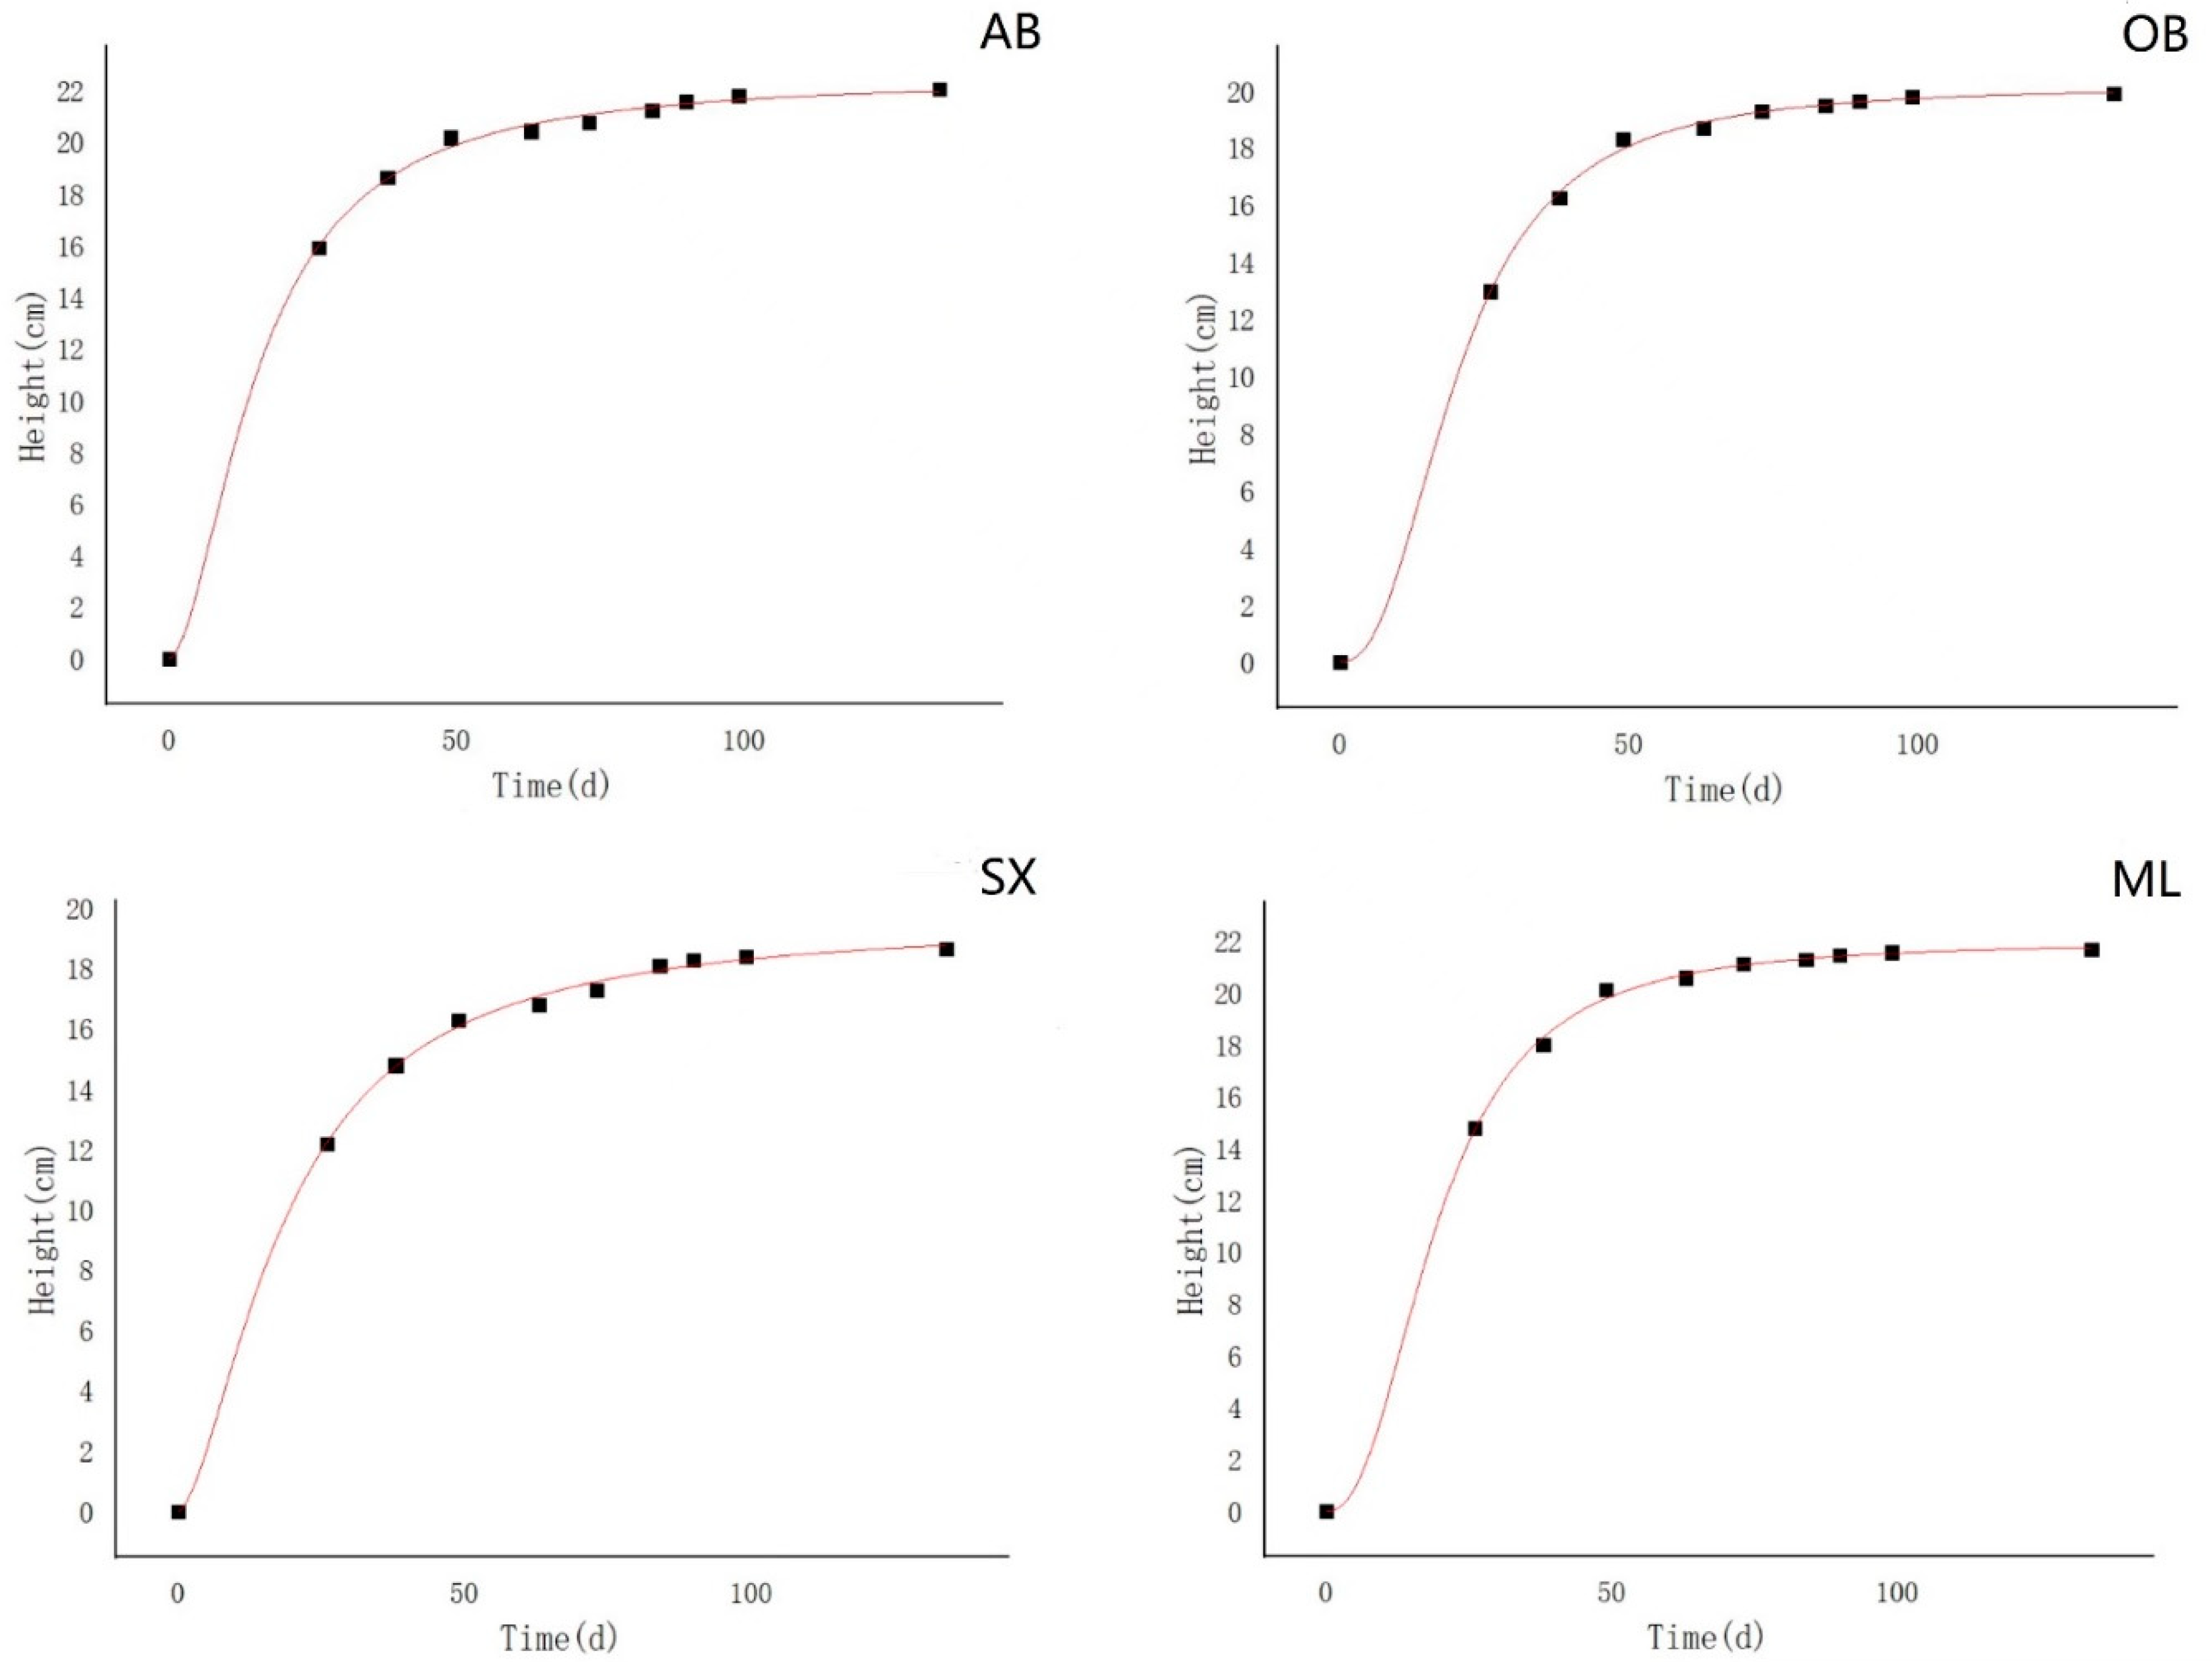
The logistic curve was used to fit the annual growth of the seedling height and ground diameter [24]. The result was calculated by the following equation:
y = k 1 + ae bt ,  
where y is the growth of the seedlings, t is the growth time (calculated from the sowing day, with the sowing day considered as 0), a and b are the undetermined coefficients, and k is the upper limit value of growth theoretical limitation.

3. Results

3.1. Seed Morphology and Chemical Component Concentrations

Significant differences among the provenances were detected for all the seed morphometric characters, indicating a genetic variability among the provenances (Table 2) and the specfic results of variance analysis are given in Tables S1–S8. Overall, the seeds from the OB provenance were the largest, measured in terms of seed length, seed width, seed dry weight, and 1000-seed weight. All the provenances differed significantly (p < 0.001) from each other for the 1000SW. SW varied more across provenances than the seed length and width. The H2 values varied from 0.608 (SDW) to 0.939 (1000SW). The coefficient of variation ranged between 3.78% and 9.16% (Table 3).
The results in Table 4 show that there was no significant difference among the provenances in seed crude protein concentrations and seed soluble sugar concentrations. These traits also had lower H2 value estimates, ranging between 0.188 and 0.228. SSSC, displayed the maximum environmental, genotypic, and phenotypic variances, and the highest variability (Table 3). The environmental effects on the SCPC and SSSC were remarkably higher than the genotypic effects, as shown by the low H2 values. The provenance was found to significantly affect the seed oil concentration (SOC) (Table 4). Variation in the SOC was low in terms of phenotypic, genotypic and environmental variances (Table 3).
The most dominant minerals in the seeds were N, K, Mg, P, and Ca, while other minerals (Fe, Zn, Cu, and Mn) were present at much lower levels (Table 5). The provenance only significantly affected Mg and Cu concentrations. Seeds from OB had the lowest Mg concentration, while seeds from the ML provenance showed the highest Mg concentration. The Cu concentration in seeds from the AB and OB provenances was significantly higher than those from SX and ML provenances (Table 5).

3.2. Seedling Morphology and Biomass

The broad-sense heritability was relatively higher in the seedling diameter (0.712) and root biomass (0.845), while the minimum H2 value was recorded for the seedling height (0.017). According to the coefficient of variation values, the root length, stem biomass, and root area had strong variability (Table 6).
Seedlings grew rapidly during the first two months after sowing (Figure 2). Differences in seedling height among the provenances could be seen one month after sowing, and these differences remained fairly stable throughout the growing season. Seeds from provenances AB and ML produced the tallest seedlings, and the seedlings produced by those from OB and SX were the shortest (Figure 2). Seedling ground diameter increased rapidly during the first three months and increased at a lower rate during 3–5 MAS. Five months after sowing, the height–diameter ratio (H/D) was higher in the seedlings from the ML than in the SX provenance. However, the seedlings from the ML provenance were significantly lower than those from the SX and AB provenances in terms of the root–stem biomass ratio (R/S) (Figure 3). Seedling height was determined primarily by the environment and was virtually unaffected by the genotype or provenance (Table 6). Conversely, 71% of the variation in the seedling diameter could be caused by the provenance.
The logistic growth curves of the seedlings from the four provenances are fitted in Figure 4 (diameter) and Figure 5 (height). All of the diameter growth curves indicated the ‘fast–slow’ trend, while height growth curves of OB and ML showed a ‘slightly slow–fast–slow’ trend in the four provenances. The estimated parameters are given in Table 7 and Table 8. The average determination coefficient of the ground diameter (0.923) and height (0.986) indicated the feasibility of the fitting equations. Variance component analysis of the estimated parameters are given in Tables S5 and S6.
At the end of the first growing season, the biomass of the SX seedlings was 51% larger than the mean from the other provenances for the root biomass, and 45% larger for the total biomass (Table 9 and Figure 3). The highest value of CV was recorded in the stem biomass (41.13%), followed by the root biomass (23.64%).
The phenotypic, genotypic, and environmental variances of the total biomass (0.458, 0.360, and 0.098, respectively) were higher than those observed for either the root or stem biomass. Both root biomass and total biomass exhibited high H2 values (Table 6).

3.3. Seedling Root Architecture

There was a general trend for the seedlings from provenance ML to have the highest total root length, area, and volume, and those from OB exhibited the lowest levels for these parameters (Table 10). However, the provenances had no significant effects on the total root length, area, or volume. The root composition of the seedlings from AB differed from that of the seedlings from the other provenances in a significantly lower ratio of smaller roots and a significantly higher ratio of intermediate-sized roots. For all provenances, roots with a diameter < 2 mm averagely contributed to a greater proportion (89.23%) of the total root length, and roots with a diameter between 2 and 5 mm ranked the second (8.37%). As might be expected, the root area had a similar trend.
A considerable amount of variability was observed between the provenances for the root architecture, as evidenced by the CV value. The CV values for the root length, area, and volume were found to be 13.56%, 61.39%, and 66.53%, respectively. Moreover, fairly low H2 values of the root length, area, and volume indicated that the root architecture was mainly affected by the environment.

3.4. Correlation Analysis for Seed and Seedling Traits

Correlation analysis demonstrated relationships among seed traits (Table 11), and relevant observation numbers are given in Tables S10–S12. Seed dry weight, 1000SW, SL, and SW showed significant positive correlations with each other. SOC was negatively correlated with seed length and width, and a similar result was found in the seed Mg concentration. SSSC was negatively correlated with Cu and Zn concentrations. Among seed mineral concentrations, significant positive correlations were found between K and P, Ca and N, Zn and Fe, Fe and Cu, and Zn and Cu. Negative correlations were found between N and P, P and Ca, K and Ca, and Zn and Mg.
At the provenance level, seedling morphological traits (height and diameter) and biomass (RB, SB, and TB), RL, RA, and RV were found to have strong positive relationships (Table 12). RL was positively associated with TB and H/D. Seedling height exhibited significant correlations with all other parameters. As might be expected, diameter was positively correlated with biomass, but negatively with H/D. The result at the individual level corresponded with the provenance level, and related correlation coefficients are given in Table S9.
The correlations between seed and seedling traits (Table 13) revealed that 1000SW and SW showed significantly positive relationships with the diameter, but negative relationships with the RB, TB, and H/D. The SSSC exhibited positive correlations with the RL, RA, and SB, but negative correlation with the R/S. Seed Mg, Cu, Zn, and Fe concentrations were significantly correlated with the RL, SB, and H/D.

3.5. Correlations between Geographical Factors, Climatic Factors, and Seed/Seedling Traits

With regard to the relationship between the geographical and climatic factors of the provenances and the parameters studied, the SW, SDW, and 1000SW showed significant negative correlations with the mean temperature in January and the mean annual rainfall (Table 14). Of the seed chemical component concentrations, the SSSC was significantly negatively correlated with the longitude and positively correlated with the altitude, while opposite correlations with longitude and altitude were found in the Cu, Zn, and Fe concentrations. Both the RB and TB showed significantly positive correlations with the temperature, rainfall, and frost-free period, while the SB showed a significantly positive correlation with the altitude.

4. Discussion

The distribution of X. sorbifolium over a wide geographical and climatic range is expected to be reflected in the genetic constitution of its populations. The source of the variation in seed traits has been previously documented in X. sorbifolium in different provenances [25,26,27]. However, most of the reports neglected the relationship between the seed and the seedling traits. In the present study, a considerable variation in the seed and seedling traits was observed among the provenances. The variation suggested the combined effects of the genotype and the environment, such as geographical and climatic factors.
Seed morphological traits showed significant correlations among themselves (Table 11), revealing that these traits are independent and genetically controlled. Similar findings were also reported for Pinus wallichiana [12], Acacia catechu Willd. [28], and Tectona grandis L.f. [29]. In addition, this was also supported by the result of the variability analysis. Most of the seed morphological traits were controlled strongly by genotypic factors, while environmental factors played a minor role in shaping these characters (Table 3), which was in accordance with the trend of the H2 values. The SW, SDW, and 1000SW were significantly negatively correlated with the mean annual rainfall (Table 14), indicating that X. sorbifolium is sensitive to waterlogging. Similar results were also found in Haloxylon ammodendron [30]. Both the RB and TB had stronger positive relationships with the mean temperature in January rather than in July. Wulff (1995) also suggested that low temperature played a more important role in increasing the seed mass during seed development and maturation [31,32]. Among the provenances, seeds from OB showed the maximum seed length and width (Table 2). According to the previous reports [33,34], this could be attributed to the extremely harsh climate and the long periods of moisture stress that OB experienced. Thus, its seeds needed to store more nutrition for the seedlings to survive after germination.
Among seed chemical components (SCPC, SSSC, and SOC), the H2 values ranged from 0.188 to 0.345, indicating that these parameters were prone to be influenced by the environment (Table 3). The SOC was negatively correlated with the seed length, width, and weight (Table 11), which implied small seeds contain more oil than big ones. A similar result was found in Jatropha curcas [35]. The positive relationship of the SSSC and the altitude could be attributed to the fact that important environmental conditions and rainfall change rapidly with elevation [36], and sunlight intensity increases with altitude, which is helpful for the accumulation of soluble sugar. It is hypothesized that X. sorbifolium growing at higher altitude level contains more soluble sugar in the seeds. However, further research is needed to elucidate the effect of altitude on this species. The SSSC was significantly negatively correlated with the longitude. This may be because rainfall increases with longitude, and more rainfall and less sunlight lead to low seed soluble sugar concentrations. According to the mineral concentrations, N, P, K, Ca, and Mg were the predominant elements in the seeds, and concentrations of Zn, Fe, and Cu were highly and positively correlated (Table 11), which were presumably due in part to the charge neutralization produced by the phytate polyanion. This anion is responsible for the bulk of P content in seeds. The positive relationship between Zn and Fe concentrations may result from the fact that Zn and Fe mobilization, uptake, distribution, and accumulation in the plant are controlled by the same genetic and molecular mechanisms [37].
Seedlings of different provenances, when grown under identical environment conditions, often display different patterns of growth [38,39,40]. Provenance variation in the seedling diameter at the nursery stage has been observed for Dalbergia sissoo Roxb. after 6 months [41] and for Tectona grandis after 8 months [29]. In our study, there was no variation in the seedling diameter throughout the first growing season. Though the seedling height varied significantly at the early stage of growth (1 month and 2 months), the difference disappeared after 3 months. These findings suggest that the expression of genetic potential for seedling growth is species-specific. Meanwhile, the logistic growth model is usually S-shaped, and it includes the emergence stage, seedling stage, rapid growth stage, and late growth stage. In the present study, the seedling diameter and height entered the rapid growth stage quickly probably because the seeds were germinated in advance and the seedlings grew in a greenhouse with ideal temperature and moisture conditions.
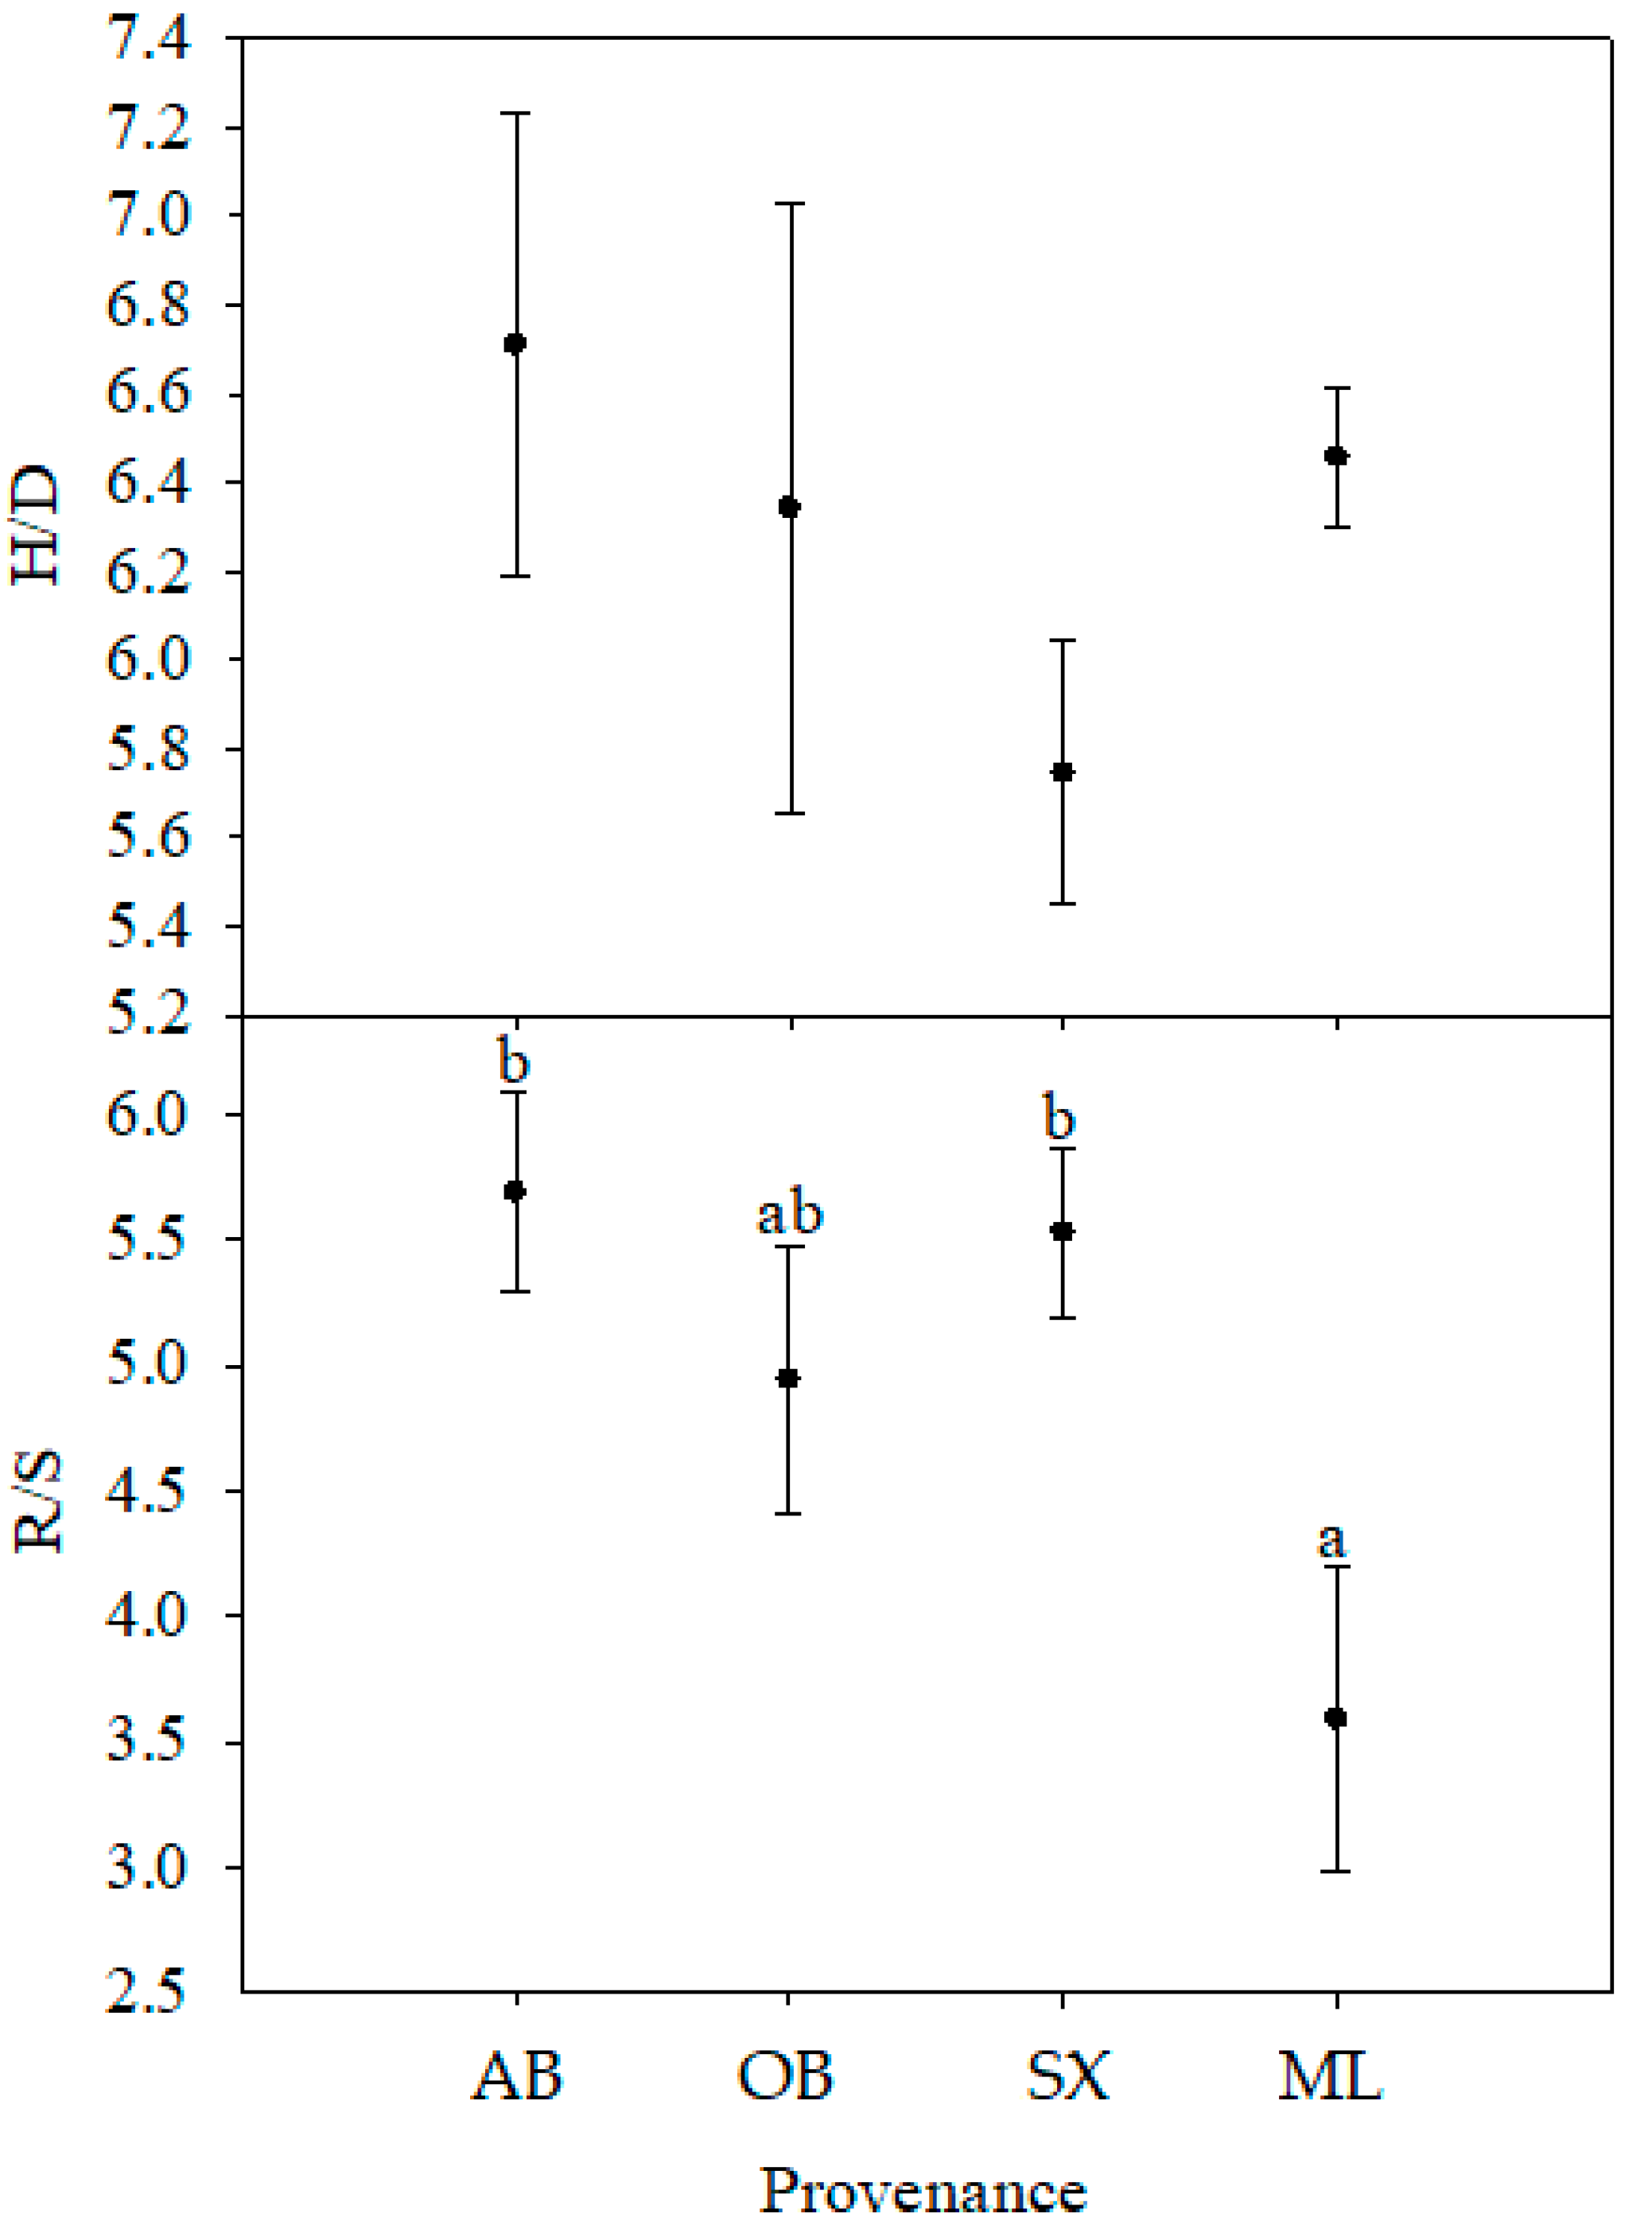
Identifying the association between the seed traits and seedling quality parameters would allow us to manipulate the breeding process by selecting seeds. Positive correlations of diameter with the SL, SW, and 1000SW depicted that the provenance which yielded big seeds tended to show greater seedling diameter as compared to the provenance with small seeds (Table 13). A similar relationship has been obtained in many species [12,42]. To a certain extent, the larger seeds are known to have greater cotyledons with more mobilizable carbohydrate reserves and nutrients [43]; therefore, large seeds could provide an advantage for early seedling establishment. The SSSC showed significantly positive correlations with the RL and RA, and SB, indicating that soluble sugar could provide a nutrition supply for seedling root and stem growth. The advantages provided by the large seeds were also reflected in the seedling traits. In this study, the seedlings developed from large seeds showed a greater survival ratio because of the more water and nutrients absorbed by the larger root diameter and volume. Therefore, among all the seedling traits, the root diameter is considered to be the most effective factor for predicting the future growth state [19].
Heritability provides an index of the relative roles of heredity and environment in the expression of various traits [44,45]. In our study, the SL, SW, SDW, 1000SW, D, and RB had relatively strong heritability (Table 3 and Table 6). Therefore, these traits could be improved through clonal selection. On the other hand, these traits are still weakly correlated with environmental and geographic factors. Therefore, future research directions should be: first, carry out further molecular studies to verify genotypic and environmental effects; second, test field growth performance of all provenances more fully in subsequent years across a much broader range of environmental conditions; third, select and analyze additional provenances to get more precise correlation with geographic data.

5. Conclusions

The present study indicated that seed- and seedling-related traits varied considerably among the provenances of X. sorbifolium. Seeds from the OB provenance had the largest size and the lowest SOC and Mg concentrations. The ML provenance demonstrated the maximum values of oil, soluble sugar, P, K, and Mg concentrations, diameter, root length, area, and volume, and comparatively higher values of seed size parameters and biomass. The H2 was high in seed and seedling morphological parameters (seed length, width, weight, seedling diameter, and root biomass). These parameters were also weakly correlated with environmental factors. Seed length, width, and weight were positively correlated with each other. Seed length and width showed negative correlation with the SOC, which meant smaller seeds contain more oil. Additionally, the SSSC was negatively correlated with the longitude and positively correlated with the altitude, indicating that seeds collected from a higher altitude may contain more soluble sugar. Among the four provenances, the ML provenance was recommended as an ideal material for the further improvement program according to the assessment of seed and seedling traits.

Supplementary Materials

The following supporting information can be downloaded at: https://0-www-mdpi-com.brum.beds.ac.uk/article/10.3390/f13060959/s1, Table S1: Variance analysis of seed morphological parameters among four X. sorbifolium. provenances; Table S2: Variance analysis in concentrations (%) of seed crude protein, soluble sugar and oil among four X. sorbifolium provenances; Table S3: Variance analysis of seed mineral contents among four X. sorbifolium provenances (mg/kg; dry weight); Table S4: Variance analysis of height–diameter ratio (H/D) and root–stem biomass ratio (R/S); Table S5: Variance analysis of logistic curve fitting of seedling diameter of four provenances of X. sorbifolium; Table S6: Variance analysis of logistic curve fitting of seedling height of four provenances of X. sorbifolium; Table S7: Variance analysis of seedlings root biomass, stem biomass, and total biomass of four provenances of X. sorbifolium; Table S8: Variance analysis of root length, area and volume ratio of different root diameter class (<2, 2–5, >5 mm) to total root of four provenances of X. sorbifolium seedlings; Table S9: Correlation coefficients among seedling traits of X. sorbifolium individuals; Table S10: The observation numbers of seed and seedling traits of X. sorbifolium (5 replicates); Table S11: The observation numbers of seed and seedling traits of X. sorbifolium (4 replicates); Table S12: The observation numbers of seed oil concentration of X. sorbifolium (9 replicates);

Author Contributions

Conceptualization, Y.A.; Formal analysis, K.W.; Funding acquisition, X.L. and Y.A.; Investigation, Z.Z. and L.O.; Methodology, P.M.H.; Software, K.W.; Visualization, Y.C.; Writing—original draft, Y.C., X.L. and F.Z.; Writing—review and editing, Y.C. All authors have read and agreed to the published version of the manuscript.

Funding

This work was funded by the National Natural Science Foundation of China (no. 32071738) and Fundamental Research Funds for the Central Universities (2021ZY09).

Institutional Review Board Statement

Not applicable.

Informed Consent Statement

Not applicable.

Acknowledgments

We thank the reviewers and editors for the thoughtful comments and suggestions on the manuscript. We would like to thank the laboratory teachers for giving us experimental help.

Conflicts of Interest

The authors declare that they have no conflict of interest.

References

  1. Guo, H.H.; Wang, T.T.; Li, Q.Q.; Zhao, N.; Zhang, Y.; Di, L.; Hu, Q.; Li, F.L. Two novel diacylglycerol acyltransferase genes from Xanthoceras sorbifolia are responsible for its seed oil content. Gene 2013, 527, 266–274. [Google Scholar] [CrossRef] [PubMed]
  2. Lee, H.; Yi, J.; An, C.; Kim, M.; Lee, J. Component characteristics of Xanthoceras sorbifolium seeds for bioenergy plant utilization. J. For. Environ. Sci. 2015, 31, 272–279. [Google Scholar] [CrossRef] [Green Version]
  3. Shen, Z.; Zhang, K.; Ao, Y.; Ma, L.Y.; Duan, J. Evaluation of biodiesel from Xanthoceras sorbifolia Bunge seed kernel oil from 13 areas in China. J. For. Res. 2019, 30, 869–877. [Google Scholar] [CrossRef]
  4. Yu, H.; Fan, S.; Bi, Q.; Wang, S.; Hu, X.; Chen, M.; Wang, L. Seed morphology, oil content and fatty acid composition variability assessment in yellow horn (Xanthoceras sorbifolium Bunge) germplasm for optimum biodiesel production. Ind. Crops Prod. 2017, 97, 425–430. [Google Scholar] [CrossRef]
  5. Fu, Y.J.; Zu, Y.G.; Wang, L.L.; Zhang, N.J.; Liu, W.; Li, S.M.; Zhang, S. Determination of fatty acid methyl esters in biodiesel produced from yellow horn oil by LC. Chromatographia 2008, 67, 9–14. [Google Scholar] [CrossRef]
  6. Yao, Z.Y.; Qi, J.H.; Yin, L.M. Biodiesel production from Xanthoceras sorbifolia in China: Opportunities and challenges. Renew. Sustain. Energy Rev. 2013, 24, 57–65. [Google Scholar] [CrossRef]
  7. Zhang, D.Y.; Yao, X.H.; Luo, M.; Zhao, C.J.; Fu, Y.J. Optimization of negative pressure cavitation-microwave assisted extraction of yellow horn seed oil and its application on the biodiesel production. Fuel 2016, 166, 67–72. [Google Scholar] [CrossRef]
  8. Zhu, F.; Ao, Y.; Hirst, P.M.; Niu, Y.; Luo, F.; Jiang, Y.G.; Liu, S.X.; Zheng, Y.Q.; Wang, X.; Zhang, N. Suitable pollen source for the improvement of fruit and seed traits in Xanthoceras sorbifolium. Ind. Crops Prod. 2022, 82, 114858. [Google Scholar] [CrossRef]
  9. Zhang, Y.; Ao, Y.; Liu, J.F.; Zhao, L.L.; Zhang, Y.M. Response of phenophase of Xanthoceras sorbifolium to environmental factors. J. Nanjing For. Univ. 2019, 43, 30–36. (In Chinese) [Google Scholar] [CrossRef]
  10. Kundu, S.K.; Tigerstedt, P.M.A. Variation in net photosynthesis, stomatal characteristics, leaf area and whole plant phytomass production among ten provenances of neem (Azadirachta indica). Tree Physiol. 1999, 19, 47–52. [Google Scholar] [CrossRef] [Green Version]
  11. Mukherjee, S. Studies on Provenance Variation in Cone, Seed and Seedling Characteristics of Pinus roxburghii Sarg. Ph.D. Thesis, Forest Research Institute, Deemed University, Dehra Dun, India, 2005. [Google Scholar]
  12. Kirti, R.; Bakshi, M. Provenance variation in cone, seed and seedling characteristics in natural populations of Pinus wallichiana A.B. Jacks (Blue Pine) in India. Ann. For. Res. 2011, 54, 39–55. [Google Scholar] [CrossRef]
  13. Ao, Y.; Wang, Y.; Chen, L.; Wang, T.; Yu, H.; Zhang, Z.X. Identification and comparative profiling of microRNAs in wild-type Xanthoceras sorbifolia and its double flower mutant. Gene Genom. 2012, 34, 561–568. [Google Scholar] [CrossRef]
  14. Soon, Y.; Kalra, Y. A comparison of plant tissue digestion methods for nitrogen and phosphorus analyses. Cana. J. Soil Sci. 1995, 75, 243–245. [Google Scholar] [CrossRef]
  15. Page, A.L. Methods of Soil Analysis, 2nd ed.; American Association of Agronomy: New York, NY, USA, 1982. [Google Scholar]
  16. Li, H.; Sun, Q.; Zhao, S.; Zhang, W. Principles and Techniques of Plant Physiological Biochemical Experiment; Higher Education: Beijing, China, 2000. (In Chinese) [Google Scholar]
  17. Ge, Y.; Cao, J.Q.; Si, X.Y.; Hu, F.C.; Li, Z.; Zang, X.P.; Ma, W.H. Identification and Quantitation of Soluble Sugar Components of Avocado Fruit by High Performance Liquid Chromatography. Chin. J. Trop. Agric. 2017, 37, 89–94. [Google Scholar] [CrossRef]
  18. William, H. Official Methods of Analysis of AOAC International; AOAC International: Rockville, MD, USA, 2005. [Google Scholar]
  19. Tsakaldimi, M.; Ganatsas, P.; Jacobs, D.F. Prediction of planted seedling survival of five Mediterranean species based on initial seedling morphology. New For. 2013, 44, 327–339. [Google Scholar] [CrossRef]
  20. Tsakaldimi, M. Kenaf (Hibiscus cannabinus L.) core and rice hulls as components of container media for growing Pinus halepensis M. seedlings. Bioresour. Technol. 2006, 97, 1631–1639. [Google Scholar] [CrossRef]
  21. Lacape, J.M.; Llewellyn, D.; Jacobs, J.; Arioli, T.; Becker, D.; Calhoun, S.; Al-Ghazi, Y.; Liu, S.; Palaï, O.; Georges, S.; et al. Meta-analysis of cotton fiber quality QTLs across diverse environments in a Gossypium hirsutum × G. barbadense RIL population. BMC Plant Biol. 2010, 10, 132. [Google Scholar] [CrossRef] [Green Version]
  22. An, S.Q. Principles and Techniques of Forest Breeding, 3rd ed.; Inner Mongolia People’s Publishing House: Huhhot, China, 1996; pp. 50–67, 225–232. [Google Scholar]
  23. Zhu, Z.T. Fundamentals of Forest Genetics, 3rd ed.; China Forestry Publishing House: Beijing, China, 1990; pp. 163–190. [Google Scholar]
  24. Ji, K.T.; Lu, J.G.; Guo, C.C. Annual growth of one year old Sinocalycanthus chinensis seedling. J. Northwest AF Univ. Nat. Sci. Ed. 2015, 43, 165–170. (In Chinese) [Google Scholar]
  25. Chai, C.S.; Lu, J.; Cai, G.J.; Wang, S.Y.; Qi, J.L.; Wang, Z.T.; Xue, R. Fruit phenotypic diversity and variation of Xanthoceras sorbifolia artifical population. For. Res. 2013, 26, 181–191. (In Chinese) [Google Scholar] [CrossRef]
  26. Mu, H.X.; Hou, X.C.; Liu, Q.Z. Study on the phenotype diversity of woody energy plant Xanthoceras sorbifolia. For. Res. 2007, 20, 350–355. (In Chinese) [Google Scholar] [CrossRef]
  27. Hou, Y.K.; Huang, L.; Gao, W.; Yang, C.W. Study on phenotypic character variation of fruits and seeds of Xanthoceras sorbifolia from different provenances. J. Cent. South Univ. For. Technol. 2013, 33, 20–24. (In Chinese) [Google Scholar] [CrossRef]
  28. Kumar, R.; Nautiyal, S.; Kumar, P.; Bahuguna, A. Seed source variation in Khair (Acacia catechu Willd.). Indian For. 2004, 130, 530–536. [Google Scholar]
  29. Jayasankar, S.; Babu, L.C.; Sudhakara, K.; Unnithan, V.K.G. Provenance variation in seed and germination characteristics of teak (Tectona grandis L.F.). Seed Sci. Technol. 1999, 27, 131–139. [Google Scholar]
  30. Liu, J.L.; Wang, Y.G.; Yang, X.H.; Wang, B.F. Genetic variation in seed and seedling traits of six Haloxylon ammodendron shrub provenances in desert areas of China. Agrofor. Syst. 2011, 81, 135–146. [Google Scholar] [CrossRef]
  31. Wulff, R.D. Environmental maternal effects on seed quality and germination. In Seed Development and Germination; Kigel, J., Galili, G., Eds.; Marcel Dekker Inc.: New York, NY, USA, 1995; pp. 491–505. [Google Scholar]
  32. Ma, L.P.; Wang, L.H.; Yin, L.M.; Li, B.; Chen, W. Biology and phenology of Xanthoceras sorbifolia in Wudan area. Chin. J. Appl. Ecol. 2008, 19, 2583–2587. [Google Scholar]
  33. Katsvanga, C.A.T.; Jimu, L.; Gwenzi, D.; Muhoni, L.; Masuka, P.; Moyo, M. Characterisation of community identified Uapaca kirkiana phenotypes for domestication. J. Sustain. Dev. Afr. 2007, 9, 356–360. [Google Scholar]
  34. Munthali, C.R.Y. Seed and Seedling Variation of Pterocarpus angolensis DC from Selected Natural Populations of Malawi. Ph.D. Thesis, University of Stellenbosch, Stellenbosch, South Africa, 1999. [Google Scholar]
  35. Kaushik, N.; Kumar, K.; Kumar, S.; Kaushik, N.; Roy, S. Genetic variability and divergence studies in seed traits and oil content of Jatropha (Jatropha curcas L.) accessions. Biomass Bioenerg. 2007, 31, 497–502. [Google Scholar] [CrossRef]
  36. Bennington, C.C.; McGraw, J.B. Natural selection and ecotypic differentiation in impatiens pallida. Ecol. Monogr. 1995, 65, 303. [Google Scholar] [CrossRef]
  37. Clemens, S.; Palmgren, M.G.; Krämer, U. A long way ahead: Understanding and engineering plant metal accumulation. Trends Plant Sci. 2002, 7, 309–315. [Google Scholar] [CrossRef]
  38. Fernández-López, J.; Pereira-Lorenzo, S. Genetic control of growth in Juglans regia seedlings from open families of different provenances. Acta Hortic. 1997, 442, 69–75. [Google Scholar] [CrossRef]
  39. Klavina, D.; Muižnieks, I.; Baumanis, I.; Jansons, J.; Gaitnieks, T.; Menkis, A. Survival, growth and mycorrhization of containerised Pinus sylvestris and Picea abies seedlings of different provenances outplanted in a forest clear-cut. Proc. Latv. Acad. Sci. 2017, 71, 293–297. [Google Scholar] [CrossRef] [Green Version]
  40. Yin, C.Y.; Pang, X.Y.; Peuke, A.D.; Wang, X.; Chen, K.; Gong, R.G. Growth and photosynthetic responses in Jatropha curcas L. seedlings of different provenances to watering regimes. Photosynthetica 2016, 54, 1367–1373. [Google Scholar] [CrossRef] [Green Version]
  41. Sagta, H.C.; Nautiyal, S. Growth performance and genetic divergence of various provenances of Dalbergia sissoo Roxb. at nursery stage. Silvae Genet. 2001, 50, 93–99. [Google Scholar] [CrossRef]
  42. Bjornstad, A.; Kwapata, M.B.; Mwase, W.F.; Ntupanyama, Y.M.; Bokosi, J.M. Phenotypic variation in fruit, seed and seedling traits of nine Uapaca kirkiana provenances found in Malawi. J. S. Afr. For. 2006, 208, 15–21. [Google Scholar] [CrossRef]
  43. Hewitt, N. Seed size and shade-tolerance: A comparative analysis of North American temperate trees. Oecologia 1998, 114, 432–440. [Google Scholar] [CrossRef] [PubMed]
  44. Gapare, W.J.; Barnes, R.D.; Gwaze, D.P.; Nyoka, B.I. Genetic improvement of Eucalyptus grandis using breeding seedling orchards and multiple population breeding strategy in Zimbabwe. J. S. Afr. For. Assoc. 2003, 197, 13–19. [Google Scholar] [CrossRef]
  45. Luechanimitchit, P.; Luangviriyasaeng, V.; Laosakul, S.; Pinyopusarerk, K.; Bush, D. Genetic parameter estimates for growth, stem-form and branching traits of Casuarina junghuhniana clones grown in Thailand. For. Ecol. Manag. 2017, 404, 251–257. [Google Scholar] [CrossRef]
Figure 1. Map of China showing locations of four sampled X. sorbifolium populations. The line represents the limit of X. sorbifolium distribution.
Forests 13 00959 g001
Figure 2. Monthly seedling growth in height and diameter of four provenances of X. sorbifolium. AB—Ar Horqin Banner; OB—Ongniud Banner; SX—Shanxian; ML—Mulei. Bars marked with different letters differ significantly according to Duncan’s test α = 0.05.
Forests 13 00959 g002
Figure 3. Effects of provenance on height–diameter ratio (H/D) and root–stem biomass ratio (R/S) in X. sorbifolium (mean ± SE). AB—Ar Horqin Banner; OB—Ongniud Banner; SX—Shanxian; ML—Mulei. Bars marked with different letters differ significantly according to Duncan’s test α = 0.05.
Forests 13 00959 g003
Figure 4. Logistic fitting curves of seedling diameter of X. sorbifolium from different provenances. AB—Ar Horqin Banner; OB—Ongniud Banner; SX—Shanxian; ML—Mulei.
Forests 13 00959 g004
Figure 5. Logistic fitting curves of seedling height of X. sorbifolium from different provenances. AB—Ar Horqin Banner; OB—Ongniud Banner; SX—Shanxian; ML—Mulei.
Forests 13 00959 g005
Table 1. Geographical location and climatic factors of four X. sorbifolium provenances.
ProvenanceLongitude Latitude Altitude (m)Mean Annual Temperature (°C)Mean Temperature in Jan. (°C)Mean Temperature in Jul. (°C)Mean Annual Rainfall (mm)Frost-Free Period (d)
AB120° 01′ E43°21′ N5505.5−9.524.7340125
OB119°02′ E42°56′ N6398.8−7.426.7320130
SX111°37′ E34°24′ N76015.93.528.0650219
ML92°16′ E43°14′ N10846.7−15.624.5294139
AB—Ar Horqin Banner; OB—Ongniud Banner; SX—Shanxian; ML—Mulei. Climatic resource: https://www.ventusky.com (accessed on 9 October 2020).
Table 2. Variation in seed morphological parameters among four X. sorbifolium provenances.
ProvenanceSL (mm)SW (mm)SDW (g)1000SW (g)
AB13.43 ± 0.10 a12.24 ± 0.12 b0.71 ± 0.02 a803.87 ± 5.33 b
OB14.21 ± 0.11 b12.92 ± 0.03 c0.80 ± 0.01 b952.92 ± 8.13 d
SX13.16 ± 0.13 a11.87 ± 0.11 a0.70 ± 0.02 a755.26 ± 9.76 a
ML13.10 ± 0.12 a12.43 ± 0.08 b0.79 ± 0.01 b850.81 ± 10.15 c
CV (%)3.793.487.119.16
p value<0.001<0.001<0.001<0.001
AB—Ar Horqin Banner; OB—Ongniud Banner; SX—Shanxian; ML—Mulei; CV—coefficient of variation; SL—seed length; SW—seed width; SDW—seed dry weight; 1000SW—1000-seed weight. Mean ± SE marked with different letters in a column differ significantly according to Duncan’s test α = 0.05.
Table 3. Variances and broad-sense heritability of seed parameters in X. sorbifolium.
ParameterVeVgVpCV (%)H2
SL0.0570.2470.3043.780.813
SW0.0450.1810.2263.480.801
SDW0.0010.0020.0037.150.608
1000SW454.9427026.1277481.0699.160.939
SCPC21.6635.02426.68715.020.188
SSSC69.45220.50289.95470.380.228
SOC2.4621.2973.7592.840.345
SL—seed length; SW—seed width; SDW—seed dry weight; 1000 SW—1000-seed weight; SCPC—seed crude protein concentration; SSSC—seed soluble sugar concentration; SOC—seed oil concentration; Ve—environmental variance; Vg—genotypic variance; Vp—phenotypic variance; CV—coefficient of variation; H2—broad-sense heritability.
Table 4. Variation in concentrations (%) of seed crude protein, soluble sugar, and oil among four X. sorbifolium provenances.
ProvenanceSCPC (%)SSSC (%)SOC (%)
AB34.22 ± 1.178.85 ± 4.9962.14 ± 0.65 b
OB36.82 ± 2.098.36 ± 3.2859.92 ± 0.26 a
SX35.79 ± 0.7411.02 ± 2.4462.76 ± 0.19 b
ML34.36 ± 1.1121.29 ± 2.6063.18 ± 0.44 b
CV (%)7.8070.392.84
p value0.4690.063<0.001
AB—Ar Horqin Banner; OB—Ongniud Banner; SX—Shanxian; ML—Mulei; CV—coefficient of variation; SCPC—seed crude protein concentration; SSSC—seed soluble sugar concentration; SOC—seed oil concentration. Mean ± SE marked with different letters in a column differ significantly according to Duncan’s test α = 0.05.
Table 5. Variation in seed mineral concentrations among four X. sorbifolium provenances (mg/kg; dry weight).
ProvenanceNPKCaMg Cu ZnFeMn
AB22,326 ± 0.0761992 ± 0.0208448 ± 0.0071792 ± 0.0052202 ± 0.003 b8.339 ± 0.367 b20.906 ± 0.50498.890 ± 7.5443.295 ± 0.309
OB23,640 ± 0.1071760 ± 0.0178452 ± 0.0021816 ± 0.0042117 ± 0.001 a8.412 ± 0.735 b22.480 ± 0.1234100.050 ± 6.0493.386 ± 0.472
SX24,296 ± 0.1261562 ± 0.0108422 ± 0.0051841 ± 0.0032194 ± 0.002 b7.265 ± 0.128 ab21.201 ± 0.70889.712 ± 3.9003.957 ± 0.471
ML21,671 ± 0.1262234 ± 0.0398502 ± 0.0061627 ± 0.0112205 ± 0.002 b6.410 ± 0.523 a18.553 ± 1.14285.456 ± 1.6893.568 ± 0.106
CV (%)9.7926.781.238.332.3516.1010.7712.1720.11
p value0.3600.2810.7760.1530.0250.0400.0730.2000.613
AB—Ar Horqin Banner; OB—Ongniud Banner; SX—Shanxian; ML—Mulei; CV—coefficient of variation. Mean ± SE marked with different letters in a column differ significantly according to Duncan’s test α = 0.05.
Table 6. Variances and broad-sense heritability of seedling parameters in X. sorbifolium.
ParametersVeVgVpCV (%)H2
H5.5000.0945.59411.070.017
D0.0590.1460.20515.780.712
RB0.0530.2890.34223.640.845
SB0.0380.0130.05141.130.248
TB0.0980.3600.45822.750.787
RL17,894.7307912.08725,806.81061.820.307
RA581.626373.758955.38554.930.391
RV2.7090.3493.05850.350.114
H—height; D—diameter; RB—root biomass; SB—stem biomass; TB—total biomass; RL—root length; RA—root area; RV—root volume. Ve—environmental variance; Vg—genotypic variance; Vp—phenotypic variance; CV—coefficient of variation; H2—broad-sense heritability.
Table 7. Estimated parameters of logistic curve of seedling ground diameter of X. sorbifolium from different provenances.
ProvenancekabR2F
AB3.1374.3930.0450.920318.190 **
OB2.9864.3610.0500.911298.540 **
SX3.1234.5360.0420.925323.370 **
ML3.2314.6890.0440.935372.080 **
AB—Ar Horqin Banner; OB—Ongniud Banner; SX—Shanxian; ML—Mulei; k—growth limitation; a, b—undetermined coefficients; R2—determination coefficient. ** Correlation is significant at the 0.01 level.
Table 8. Estimated parameters of logistic curve of seedling height of X. sorbifolium from different provenances.
ProvenancekabR2F
AB21.06122.1820.1570.9861552.000 **
OB19.32816.5800.1290.9891830.480 **
SX17.74013.8390.1230.978936.940 **
ML21.10117.6410.1370.9891883.750 **
AB—Ar Horqin Banner; OB—Ongniud Banner; SX—Shanxian; ML—Mulei; k—growth limitation; a, b—undetermined coefficients; R2—determination coefficient. ** Correlation is significant at the 0.01 level.
Table 9. Seedling root biomass, stem biomass, and total biomass of four provenances of X. sorbifolium.
ProvenanceRoot Biomass (g)Stem Biomass (g)Total Biomass (g)
AB2.080 ± 0.124 a 0.367 ± 0.009 2.447 ± 0.121 a
OB2.128 ± 0.201 a0.439 ± 0.048 2.567 ± 0.232 a
SX3.231 ± 0.161 b 0.586 ± 0.019 3.817 ± 0.161 b
ML2.199 ± 0.146 a 0.698 ± 0.182 2.897 ± 0.278 a
CV (%)23.6441.1322.75
p value0.0010.1130.002
AB—Ar Horqin Banner; OB—Ongniud Banner; SX—Shanxian; ML—Mulei; CV—coefficient of variation. Mean ± SE marked with different letters in a column differ significantly according to Duncan’s test α = 0.05.
Table 10. Root length, area, and volume ratio of different root diameter class (<2, 2–5, >5 mm) to total root of four provenances of X. sorbifolium seedlings.
ProvenanceRatio of Different Root Diameter Class to Total Root Length (%)Total Root Length (cm)
Diameter < 2 mm2 mm ≤ Diameter < 5 mmDiameter ≥ 5 mm
AB82.78 ± 3.44 a15.19 ± 3.24 b2.03 ± 0.83233.995 ± 63.535
OB90.36 ± 1.92 b6.54 ± 2.20 a3.11 ± 1.68150.917 ± 36.129
SX91.53 ± 0.89 b6.09 ± 1.05 a2.38 ± 0.99258.698 ± 22.300
ML92.26 ± 2.56 b5.64 ± 2.78 a2.10 ± 1.48422.449 ± 114.584
CV (%)7.0177.37111.9313.56
p value0.0460.0420.9310.114
ProvenanceRatio of Different Root Diameter Class to Total Root Area (%)Total Root Area (cm2)
Diameter < 2 mm2 mm ≤ Diameter < 5 mmDiameter ≥ 5 mm
AB46.87 ± 6.89 41.50 ± 7.50 11.64 ± 4.97 74.920 ± 21.196
OB57.62 ± 8.89 22.63 ± 8.7319.76 ± 10.81 43.437 ± 13.619
SX52.41 ± 5.94 28.53 ± 6.64 19.06 ± 7.92 58.895 ± 7.090
ML59.04 ± 10.77 23.87 ± 10.28 17.09 ± 11.78 93.464 ± 24.687
CV (%)32.9764.76114.2161.39
p value0.7270.3960.9230.273
ProvenanceRatio of Different Root Diameter Class to Total Root Volume (%)Total Root Volume (cm3)
Diameter < 2 mm2 mm ≤ Diameter < 5 mmDiameter ≥ 5 mm
AB21.22 ± 6.17 52.22 ± 9.94 26.56 ± 11.86 4.964 ± 1.628
OB31.15 ± 13.50 33.01 ± 13.75 35.84 ± 19.41 3.556 ± 1.537
SX17.77 ± 7.60 42.40 ± 12.92 39.83 ± 14.70 4.007 ± 1.045
ML29.06 ± 11.90 38.09 ± 15.45 32.85 ± 17.80 5.172 ± 1.297
CV (%)87.7667.5199.5666.53
p value0.7660.7660.9480.822
AB—Ar Horqin Banner; OB—Ongniud Banner; SX—Shanxian; ML—Mulei; CV—coefficient of variation. Mean ± SE marked with different letters in a column differ significantly according to Duncan’s test α = 0.05.
Table 11. Correlation coefficients among seed traits of four provenances of X. sorbifolium.
1000SWSLSWSSSCSCPCSOCNPKCaMgCuZnFeMn
SDW0.789 **0.554 *0.844 **0.0650.257−0.461 *−0.2510.2560.170−0.338−0.304−0.0790.0970.0240.0130
1000SW 0.785 **0.929 **−0.0150.308−0.664 **−0.0250.0860.063−0.062−0.542 *0.2070.2190.245−0.190
SL 0.747 **−0.3600.392−0.852 **0.108−0.143−0.1360.242−0.526 *0.4010.473*0.388−0.148
SW −0.1480.298−0.645 **−0.1990.2620.187−0.219−0.458 *0.2830.2570.238−0.126
SSSC −0.1100.3980.0010.0810.197−0.2660.322−0.516 *−0.541 *−0.452−0.049
SCPC −0.4150.077−0.398−0.0080.313−0.459 *0.0650.2650.079−0.010
SOC −0.2510.2650.184−0.2810.528 *−0.296−0.465 *−0.2060.306
N −0.533 *−0.1270.602 **−0.012−0.1790.031−0.143−0.212
P 0.573 **−0.744 **0.245−0.006−0.242−0.075−0.073
K −0.629 **0.1410.071−0.035−0.293−0.012
Ca −0.0980.1280.2070.3850.095
Mg −0.431−0.571 **−0.3770.223
Cu 0.781 **0.772 **0.271
Zn 0.587 **0.351
Fe 0.377
SDW—seed dry weight; 1000SW—1000-seed weight; SL—seed length; SW—seed width; SSSC—seed soluble sugar concentration; SCPC—seed crude protein concentration; SOC—seed oil concentration. * Correlation is significant at the 0.05 level. ** Correlation is significant at the 0.01 level.
Table 12. Correlation coefficients among seedling traits of X. sorbifolium from four provenances.
RARVHDRBSBTBR/SH/D
RL0.896 **0.543 *0.367−0.3590.2170.0700.570 **0.2110.521 *
RA 0.813 **0.290−0.2770.2270.0800.3940.2500.407
RV 0.156−0.0790.2740.0510.2360.3220.176
H 0.379 **0.292 **0.539 **0.389 **−0.274 **0.746 **
D 0.391 **0.397 **0.442 **−0.042−0.274 **
RB 0.364 **0.974 **0.360 **0.030
SB 0.564 **−0.305 **0.265 **
TB 0.246 **0.090 *
R/S −0.250 **
RL—root length; RA—root area; RV—root volume; H—height; D—diameter; RB—root biomass; SB—stem biomass; TB—total biomass; R/S—root–stem biomass ratio; H/D—height–diameter ratio. * Correlation is significant at the 0.05 level. ** Correlation is significant at the 0.01 level.
Table 13. Correlation coefficients between seed and seedling traits of four provenances of X. sorbifolium.
RLRARVHDRBSBTBR/SH/D
SDW0.2130.1390.010−0.0940.420−0.3210.222−0.212−0.430−0.298
1000SW−0.142−0.135−0.121−0.4150.659 **−0.559 *−0.069−0.504 *−0.273−0.687 **
SL−0.231−0.105−0.008−0.3260.598 *−0.306−0.170−0.3160.048−0.564 *
SW−0.160−0.117−0.104−0.3960.647 **−0.554 *−0.265−0.560 *−0.107−0.672 **
SSSC0.620 **0.515 *0.420−0.011−0.2770.0220.617 *0.209−0.528 *0.228
SCPC−0.0310.1260.360−0.0120.598 *0.017−0.052−0.002−0.018−0.386
SOC0.1670.0180.0230.317−0.550 *0.2810.2720.326−0.1760.565 *
N−0.071−0.203−0.376−0.0500.0550.3130.1690.3220.247−0.103
P0.044−0.053−0.1310.073−0.104−0.327−0.200−0.344−0.1900.129
K−0.033−0.108−0.1440.018−0.120−0.166−0.193−0.203−0.0980.094
Ca−0.206−0.111−0.0270.0600.2720.2050.0550.1940.209−0.162
Mg0.459 *0.3860.1360.250−0.687 **0.1120.4090.223−0.0970.707 **
Cu−0.633 **−0.470 *−0.233−0.3220.354−0.254−0.740 **−0.4460.456−0.518 *
Zn−0.497 *−0.425−0.298−0.1890.3690.061−0.567 *−0.1220.398−0.481 *
Fe−0.434−0.359−0.219−0.2100.367−0.255−0.378−0.3370.247−0.455 *
Mn0.008−0.061−0.0620.084−0.0800.2370.0940.2340.0060.095
SDW—seed dry weight; 1000SW—1000-seed weight; SL—seed length; SW—seed width; SSSC—seed soluble sugar concentration; SCPC—seed crude protein concentration; SOC—seed oil concentration; RL—root length; RA—root area; RV—root volume; H—height; D—diameter; RB—root biomass; SB—stem biomass; TB—total biomass; R/S—root–stem biomass ratio; H/D—height–diameter ratio. * Correlation is significant at the 0.05 level. ** Correlation is significant at the 0.01 level.
Table 14. Correlation coefficients between geographical factors, climatic factors, and seed/seedling parameters of four provenances of X. sorbifolium.
LongitudeLatitudeAltitudeMean Annual TemperatureMean Temperature in Jan.Mean Temperature in Jul.Mean Annual RainfallFrost-Free Period
SL0.534 *0.280−0.494 *−0.162−0.0210.174−0.331−0.408
SW0.0710.619 **−0.053−0.480 *−0.493 *−0.224−0.691 **−0.667 **
SDW−0.3070.463 *0.332−0.327−0.496 *−0.212−0.551 *−0.441
1000SW0.0750.583 **−0.042−0.419−0.452 *−0.137−0.672 **−0.638 **
SSSC−0.619 **0.1240.604 **−0.121−0.342−0.296−0.145−0.010
SCPC0.2130.000−0.1700.0860.1010.250−0.049−0.062
SOC−0.608 **0.1420.595 **−0.126−0.348−0.283−0.170−0.034
N0.253−0.379−0.2080.4060.4400.4670.3600.325
P−0.3100.4140.267−0.429−0.489−0.491−0.403−0.351
K−0.2240.2090.211−0.196−0.267−0.225−0.220−0.170
Ca0.518 *−0.323−0.4900.3180.4820.4340.3370.228
Mg−0.331−0.0910.277−0.032−0.073−0.2850.1570.183
Cu0.664 **0.124−0.666 **−0.1220.1390.105−0.097−0.247
Zn0.582 *−0.167−0.544 *0.2070.3780.4140.1580.049
Fe0.504 *0.165−0.508 *−0.1570.0440.032−0.148−0.260
Mn−0.118−0.3330.1420.3310.2530.2500.3210.354
RL−0.543 *0.0890.521 *−0.108−0.288−0.288−0.0940.016
RA−0.3710.2230.327−0.270−0.350−0.411−0.199−0.142
RV−0.2080.2480.177−0.266−0.304−0.321−0.236−0.204
H−0.239−0.3050.2420.2660.1740.1090.3140.359
D0.3460.183−0.289−0.0420.0010.249−0.259−0.283
RB−0.023−0.854 **0.0790.828 **0.747 **0.684 **0.846 **0.863 **
SB−0.573 *−0.1530.592 *0.178−0.0720.0070.1110.252
TB−0.205−0.778 **0.2580.764 **0.615 *0.586 *0.758 **0.818 **
R/S0.628 **−0.305−0.627 **0.2410.4920.3270.3620.205
H/D−0.414−0.3080.3770.1870.090−0.1160.3630.414
SL—seed length; SW—seed width; SDW—seed dry weight; 1000SW—1000-seed weight; SSSC—seed soluble sugar concentration; SCPC—seed crude protein concentration; SOC—seed oil concentration; RL—root length; RA—root area; RV—root volume; H—height; D—diameter; RB—root biomass; SB—stem biomass; TB—total biomass; R/S—root–stem biomass ratio; H/D—height–diameter ratio. * Correlation is significant at the 0.05 level. ** Correlation is significant at the 0.01 level.
Publisher’s Note: MDPI stays neutral with regard to jurisdictional claims in published maps and institutional affiliations.

