
Psychophysiological Impacts of Traffic Sounds in Urban Green Spaces

School of Architecture and Design, Beijing Jiaotong University, Beijing 100044, China
*
Author to whom correspondence should be addressed.
Forests 2022, 13(6), 960; https://0-doi-org.brum.beds.ac.uk/10.3390/f13060960
Submission received: 15 May 2022
/
Revised: 15 June 2022
/
Accepted: 16 June 2022
/
Published: 19 June 2022
(This article belongs to the Special Issue Soundscape in Urban Forests)
Abstract
:The goal of this study is to investigate the psychophysiological effects of traffic sounds in urban green spaces. In a laboratory experiment, psychological and physiological responses to four traffic sounds were measured, including road, conventional train, high-speed train, and tram. The findings demonstrated that traffic sounds had significant detrimental psychological and physiological effects. In terms of psychological responses, the peak sound level outperformed the equivalent sound level in determining the psychological impact of traffic sounds. The physiological effects of traffic sounds were shown to be significantly influenced by sound type and sound level. The physiological response to the high-speed train sound differed significantly from the other three traffic sounds. The physiological effects of road traffic sounds were found to be unrelated to the sound level. On the contrary, as for the railway sounds, the change in sound level was observed to have a significant impact on the participants’ physiological indicators.
1. Introduction
Urban green spaces provide flora and fauna for cities [1,2], offering important spaces for relaxation, recreation, social interaction, and sports [3,4]. There is accumulating research indicating that the acoustic environment plays a key role as a component of a positive visitor experience in urban green areas [5,6,7]. The concept of soundscape, defined by the International Organization for Standardization as the “acoustic environment as perceived or experienced and/or understood by a person or people, in context”, has been widely used to investigate the interaction between the acoustic environment and people in urban green spaces [8,9].
The sound source has been proven to be the dominant factor that decides how people understand and respond to the soundscape [10,11,12]. Numerous studies have been carried out to investigate how individual sound sources affect the perception of green space soundscapes. In field measurement and a questionnaire survey, Bani and Paulo found that traffic sound was the most influential sound source in urban parks [13]. Similar results were also reported in Europe, where traffic sound was identified as the dominant component of the green space soundscape [14,15,16]. Compared with other sound sources, traffic sounds were found to be the least preferred but to have a dominant position in terms of perceived occurrences or loudness [16]. The annoyance caused by traffic sounds further led to a strong impact on the perception of the overall environment, which increased with the sound level [17]. To achieve a good soundscape quality in green spaces, a limit of 50 dBA was suggested by Nilsson et al. [5]. In addition to the perceived environmental quality, increasing evidence has proven that traffic sounds could also have significant negative effects on recreational activities, restorativeness, and stress recovery [18]. By combining the sound level and the visual contextual features, the TRPT (Tranquility Rating Prediction Tool) was suggested to be efficient in predicting the relaxation effect of urban green spaces [19].
Besides perceptual attributes, exposure to traffic noise has been linked to an increased risk of negative health outcomes [20,21,22,23,24,25]. Various physiological indicators have been proposed to measure the physiological effects of traffic sounds. Through laboratory experiments, Reinhard et al. revealed that road traffic noise led to higher heart rate (HR) compared to neutral phases [26]. Meanwhile, Basner et al. found this phenomenon was similar for air, road, and rail traffic sounds and that the increase in traffic sound level could cause significant increases in electroencephalographic (EEG) and heart rate (HR) indicators in indoor soundscapes [27]. Through a field survey, Lee et al. further revealed the positive correlation between blood pressure (BP) and traffic noise exposure [28]. Besides, Li et al. found that traffic sound exposure was related to many physiological indicators, including HR, R-wave amplitude, respiration rate (RR), and skin conductance level (SCL) [29].
In the field of urban soundscape research, physiological responses have drawn increasing attention recently in investigating the potential effect of traffic sounds on the overall soundscape [30]. By comparing the physiological effects of various sound elements, Hume and Ahtamad found significant correlations between physiological indicators and perceptual attributes [31]. A more pleasant sound source led to a lower HR and a higher RR, and the traffic sound clip was voted to be the most unpleasant sound. Using functional magnetic resonance imaging, Irwin et al. identified that an unpleasant sound engaged an additional neural circuit including the right amygdala [32]. Besides, the road traffic noise was found to have a significant negative effect on the SCL recovery when compared with the natural sound [33]. Meanwhile, a significant interaction effect of traffic sounds and bird sounds on the SCL in a mixed soundscape was found by Suko et al. [34]. The presence of traffic sounds in a natural soundscape was found to be associated with an increase in SCL. In addition, significant audio–visual interactions of traffic sounds in urban soundscapes were found by Li et al. [35], which indicated that the physiological effects of traffic sound varied in different urban contexts. Focusing on the urban green space soundscape, Matilda et al. found that sound stimuli had a strong impact on physiological responses, including cortisol, sympathetic T-wave amplitude, HR, and HRV [36]. Focusing on children, Shu et al. found that noises produced less physiological restorativeness (EDA) compared with natural sounds [37]. In an in-site experiment, Li et al. also found that sound type had a significant effect on physiological responses in mountainous urban parks. A less remarkable restorative EEG rhythm was found at the traffic-sound-dominant site than at the birdsong-dominant site [38].
Collectively, the negative psychophysiological effects of traffic sound on urban green space soundscapes were outlined by the above studies. However, a simultaneous investigation of the sound type and the sound level was not detailed, to the authors’ knowledge. Furthermore, most existing literature focused on road traffic sounds, with little attention paid to rail traffic sounds. However, rail traffic sound is the second most dominant traffic noise, which was found to be significantly different from road traffic sound in not only the physical characteristics but also in the impact on people [39,40].
Therefore, the aim of this study was to reveal the psychophysiological impacts of road traffic and rail traffic sounds on the urban green space soundscape via laboratory experiments, addressing the following questions:
- (a)
- Are there differences between different traffic sounds in the psychophysiological impact on the green space soundscape?
- (b)
- What is the relationship between the sound level and the psychophysiological responses? Does it vary in different traffic groups?
- (c)
- Are there correlations between psychological responses and physiological responses when exposed to traffic sounds?
To answer such questions, four traffic sound sources (road, conventional train, high-speed train, and tram) at three different sound levels (45, 55, and 65 dBA) were used as experiment stimuli in this study. Specifically, there were two sessions for each acoustic stimulus. First, EDA and HR were measured to investigate the physiological impact of traffic sounds. Second, four perceptual attributes were measured to assess the psychological response to each sound stimulus.
2. Methodology
2.1. Participants
Thirty subjects participated in the experiment, including 15 males and 15 females. All subjects were university students (ages from 18 to 24, mean age = 20.3). The participants were recruited via social media and snowball sampling in Beijing Jiaotong University, and they voluntarily participated in the experiment. All of the participants reported normal hearing and corrected vision. None of them were taking prescription medication. All of the participants were informed about the aim and protocol of the experiment.
2.2. Experiment Stimuli
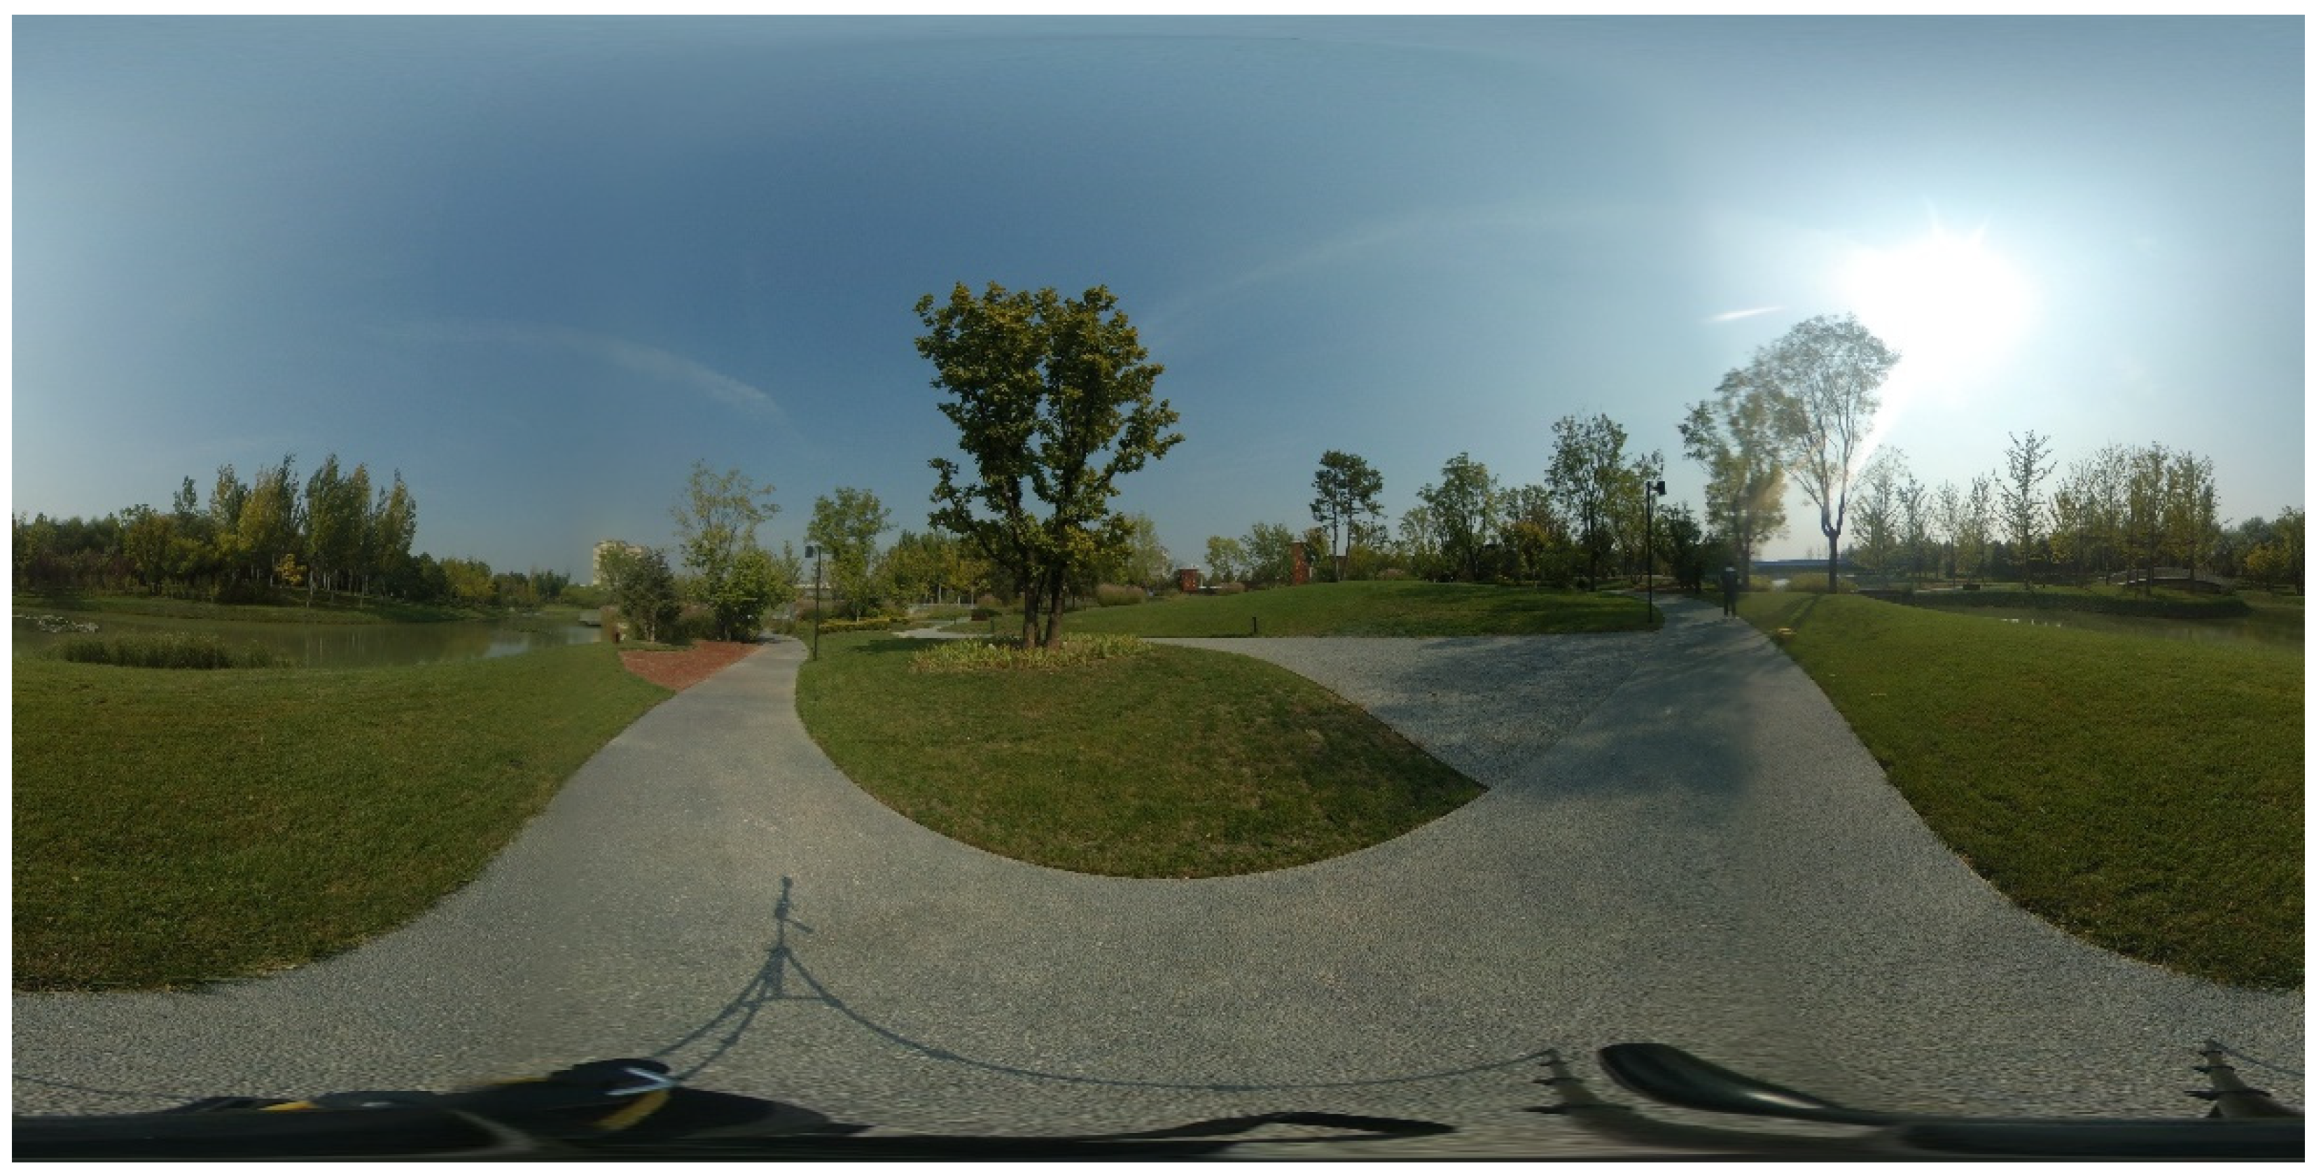
The experiment was carried out in an experiment chamber with a controlled physical environment (temperature = 21–23 °C; background sound level < 25 dBA). Virtual reality (VR) equipment was used to present a complete and realistic visual environment of an urban green space. As shown in Figure 1, an omnidirectional image was captured in a real-world urban park and displayed on a head-mounted display system (HTC VIVE Pro EYE; Resolution: ; Refresh rate: 90 Hz).
Four traffic sounds were considered in this study, including road traffic, conventional train, high-speed train, and tram. The four traffic sounds were selected for the following reasons: (1) they are very common urban traffic sounds that are frequently considered in relevant studies [41,42,43,44], and (2) they have been reported to have different influences on subjective evaluation and may have potential differences in psychophysiological effects [28].
Field recordings were collected to extract the experiment stimuli in Beijing, China. The traffic sounds were recorded in a single channel by a sound meter (6228+, Aihua, Hangzhou, China) together with the measurement. To avoid the influences of surrounding environmental sounds, all recording sites were selected in quiet areas (background sound level < 45 dBA). Figure 2 shows the site and implementation of sound recording collection. For each site, recordings were conducted in positions close to the traffic lines (5 to 15 m). The sound meter was placed 1.25 m above the ground and at least 5 m away from the surrounding building facade. The sound recording for each site was conducted on two days (from 8 a.m. to 8 p.m.), including a weekday and a weekend in November 2021. All sound recordings were then manually rechecked to find a clear traffic sound clip to make the experiment stimuli.
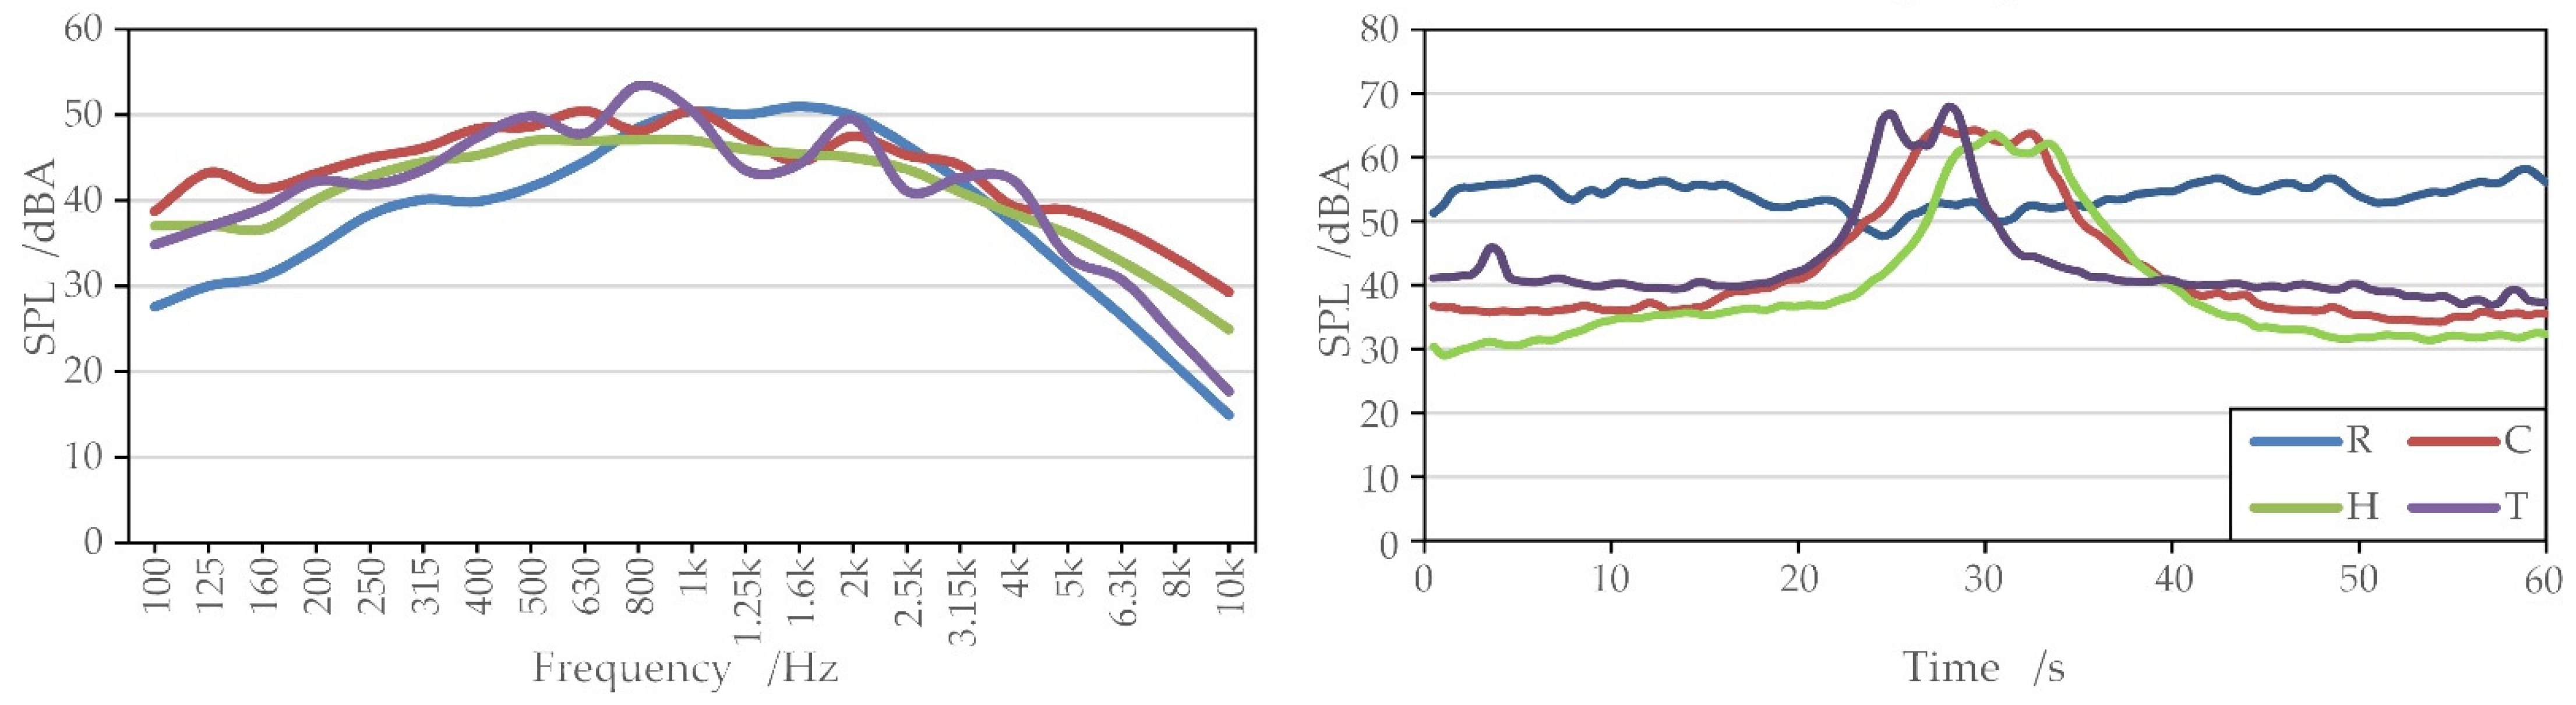
As shown in Figure 3, there were noticeable differences in temporal characteristics between traffic sounds, though the spectral characteristics were rather similar. The road traffic sounds were mainly continuous and steady, while the railway sounds were intermittent and fluctuating. Because of the limitations of physiological measurement, a two-minute stimulus was needed for each traffic sound group. For road traffic sound, a continuous field recording collected near a city highway was used. For each rail traffic sound, a one-minute clip that contained one train passing by was extracted and then repeated to produce the two-minute experimental stimuli.
The sound stimuli were reproduced in the laboratory through the combination of a computer, a power amplifier, and a reference class headphone (Sennheiser 650HD, Sennheiser, Germany). The single-channel signals were first copied to produce the dual-channel stimuli. A sound level normalization was then conducted to produce the formal experiment stimuli. Four traffic sound clips were normalized to three sound levels, including 45, 55, and 65 dBA (LAeq, 2 min). To calibrate the sound levels, a sound level meter (6228+, Aihua, Hangzhou, China) was placed 1 cm away from the headphone, which was in position on a participant’s ear during the experiment. Then, the sound level calibration was conducted for each channel separately by the Cooledit software (Version 2.0, Syntrillium Software Corporation, Phoenix, AZ, USA).
In addition to traffic sounds, a two-minute silence clip was also used in the experiment as the control stimulus to conduct the baseline measurement. Altogether, there were 13 sound stimuli in the experiment.
2.3. Measures
In this study, two of the most widely used physiological parameters were used: electrodermal activity (EDA) and heart rate (HR), which have been proven to be effective in evaluating the physiological impact of acoustic stimuli [30,37,45,46]. To achieve the simultaneous measurement, the finger electrode method and the photoplethysmography method were used for EDA and HR measurement, respectively. During the experiment, two electrodes (HKR-11, range: 100 to 2500 kΩ; accuracy: 2.5 kΩ; sample frequency: 50 Hz) were attached to the subject’s index and middle fingers of the non-dominant hand to record EDA signals. A photoplethysmography (PPG) sensor (HKG-07, measuring range: 30 to 250 bpm; accuracy: 1 bpm; sample frequency: 16 Hz) was attached to the ring finger to measure the HR index [45]. It is suggested that data processing is necessary because the physiological parameters strongly depend on personal characteristics and exposure time [37,46]. The original physiological data were first divided into 20 s segments in this study to reveal the temporal variations. Then, the mean value of each 20 s segment under traffic sounds was compared with the baseline level (2 min silence) to remove the effect of individual differences. Therefore, the change percentages of the physiological parameters were used in further analyses [37,46].
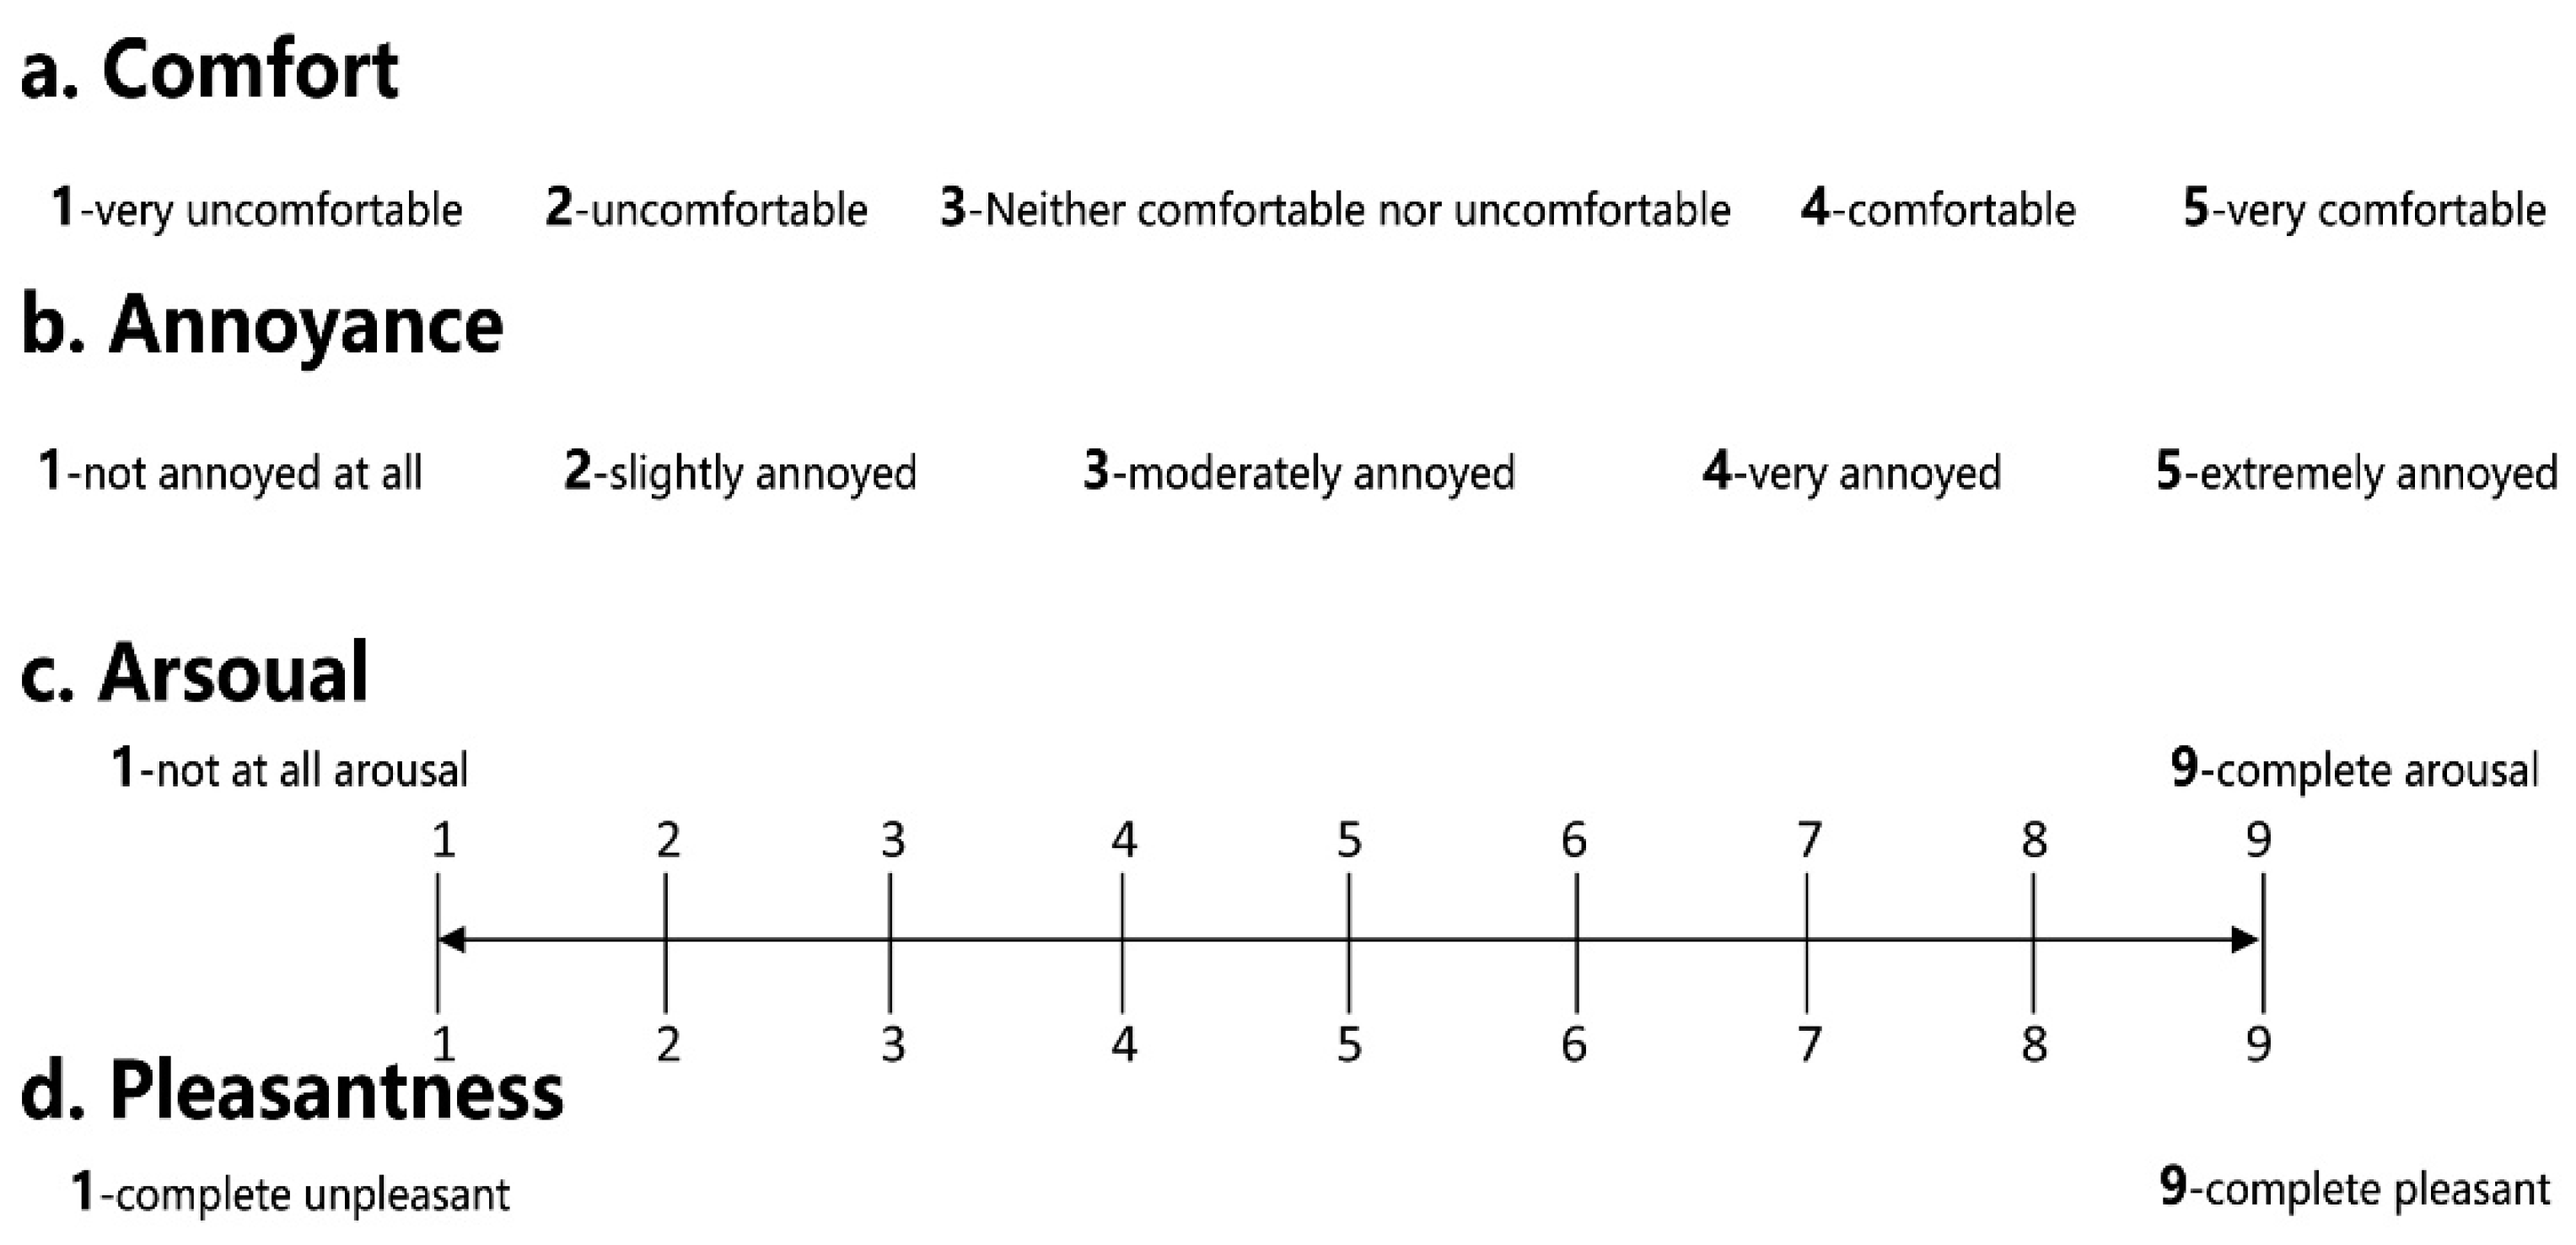
A questionnaire was presented in the VR scene after each sound stimulus for the perceptual evaluation of the green space soundscape, as shown in Figure A1 (Appendix A). Four perceptual attributes, including annoyance, comfort, arousal, and pleasantness, were used to measure the psychological responses to traffic sounds in a green space soundscape. Noise annoyance and acoustic comfort are the most widely used perceptual attributes in relevant research for evaluating the impact of traffic sounds and the soundscape quality, respectively. A five-point verbal scale was used with the verbal marks: (1) “not annoyed at all/very uncomfortable”; (2) “slightly annoyed/uncomfortable”; (3) “moderately annoyed/neither comfortable nor comfortable”; (4) “very annoyed/comfortable”; and (5) “extremely annoyed/very comfortable” [10,47]. In addition, the Self-Assessment Manikin (SAM) was also used to assess the evoked state associated with experiencing sound stimuli [48,49]. As suggested by Hume [31], a 9-point numerical scale was used in this study for the SAM measurement with descriptions from (1) no arousal at all /completely unpleasant to (9) complete arousal/completely pleasant.
2.4. Experimental Procedure
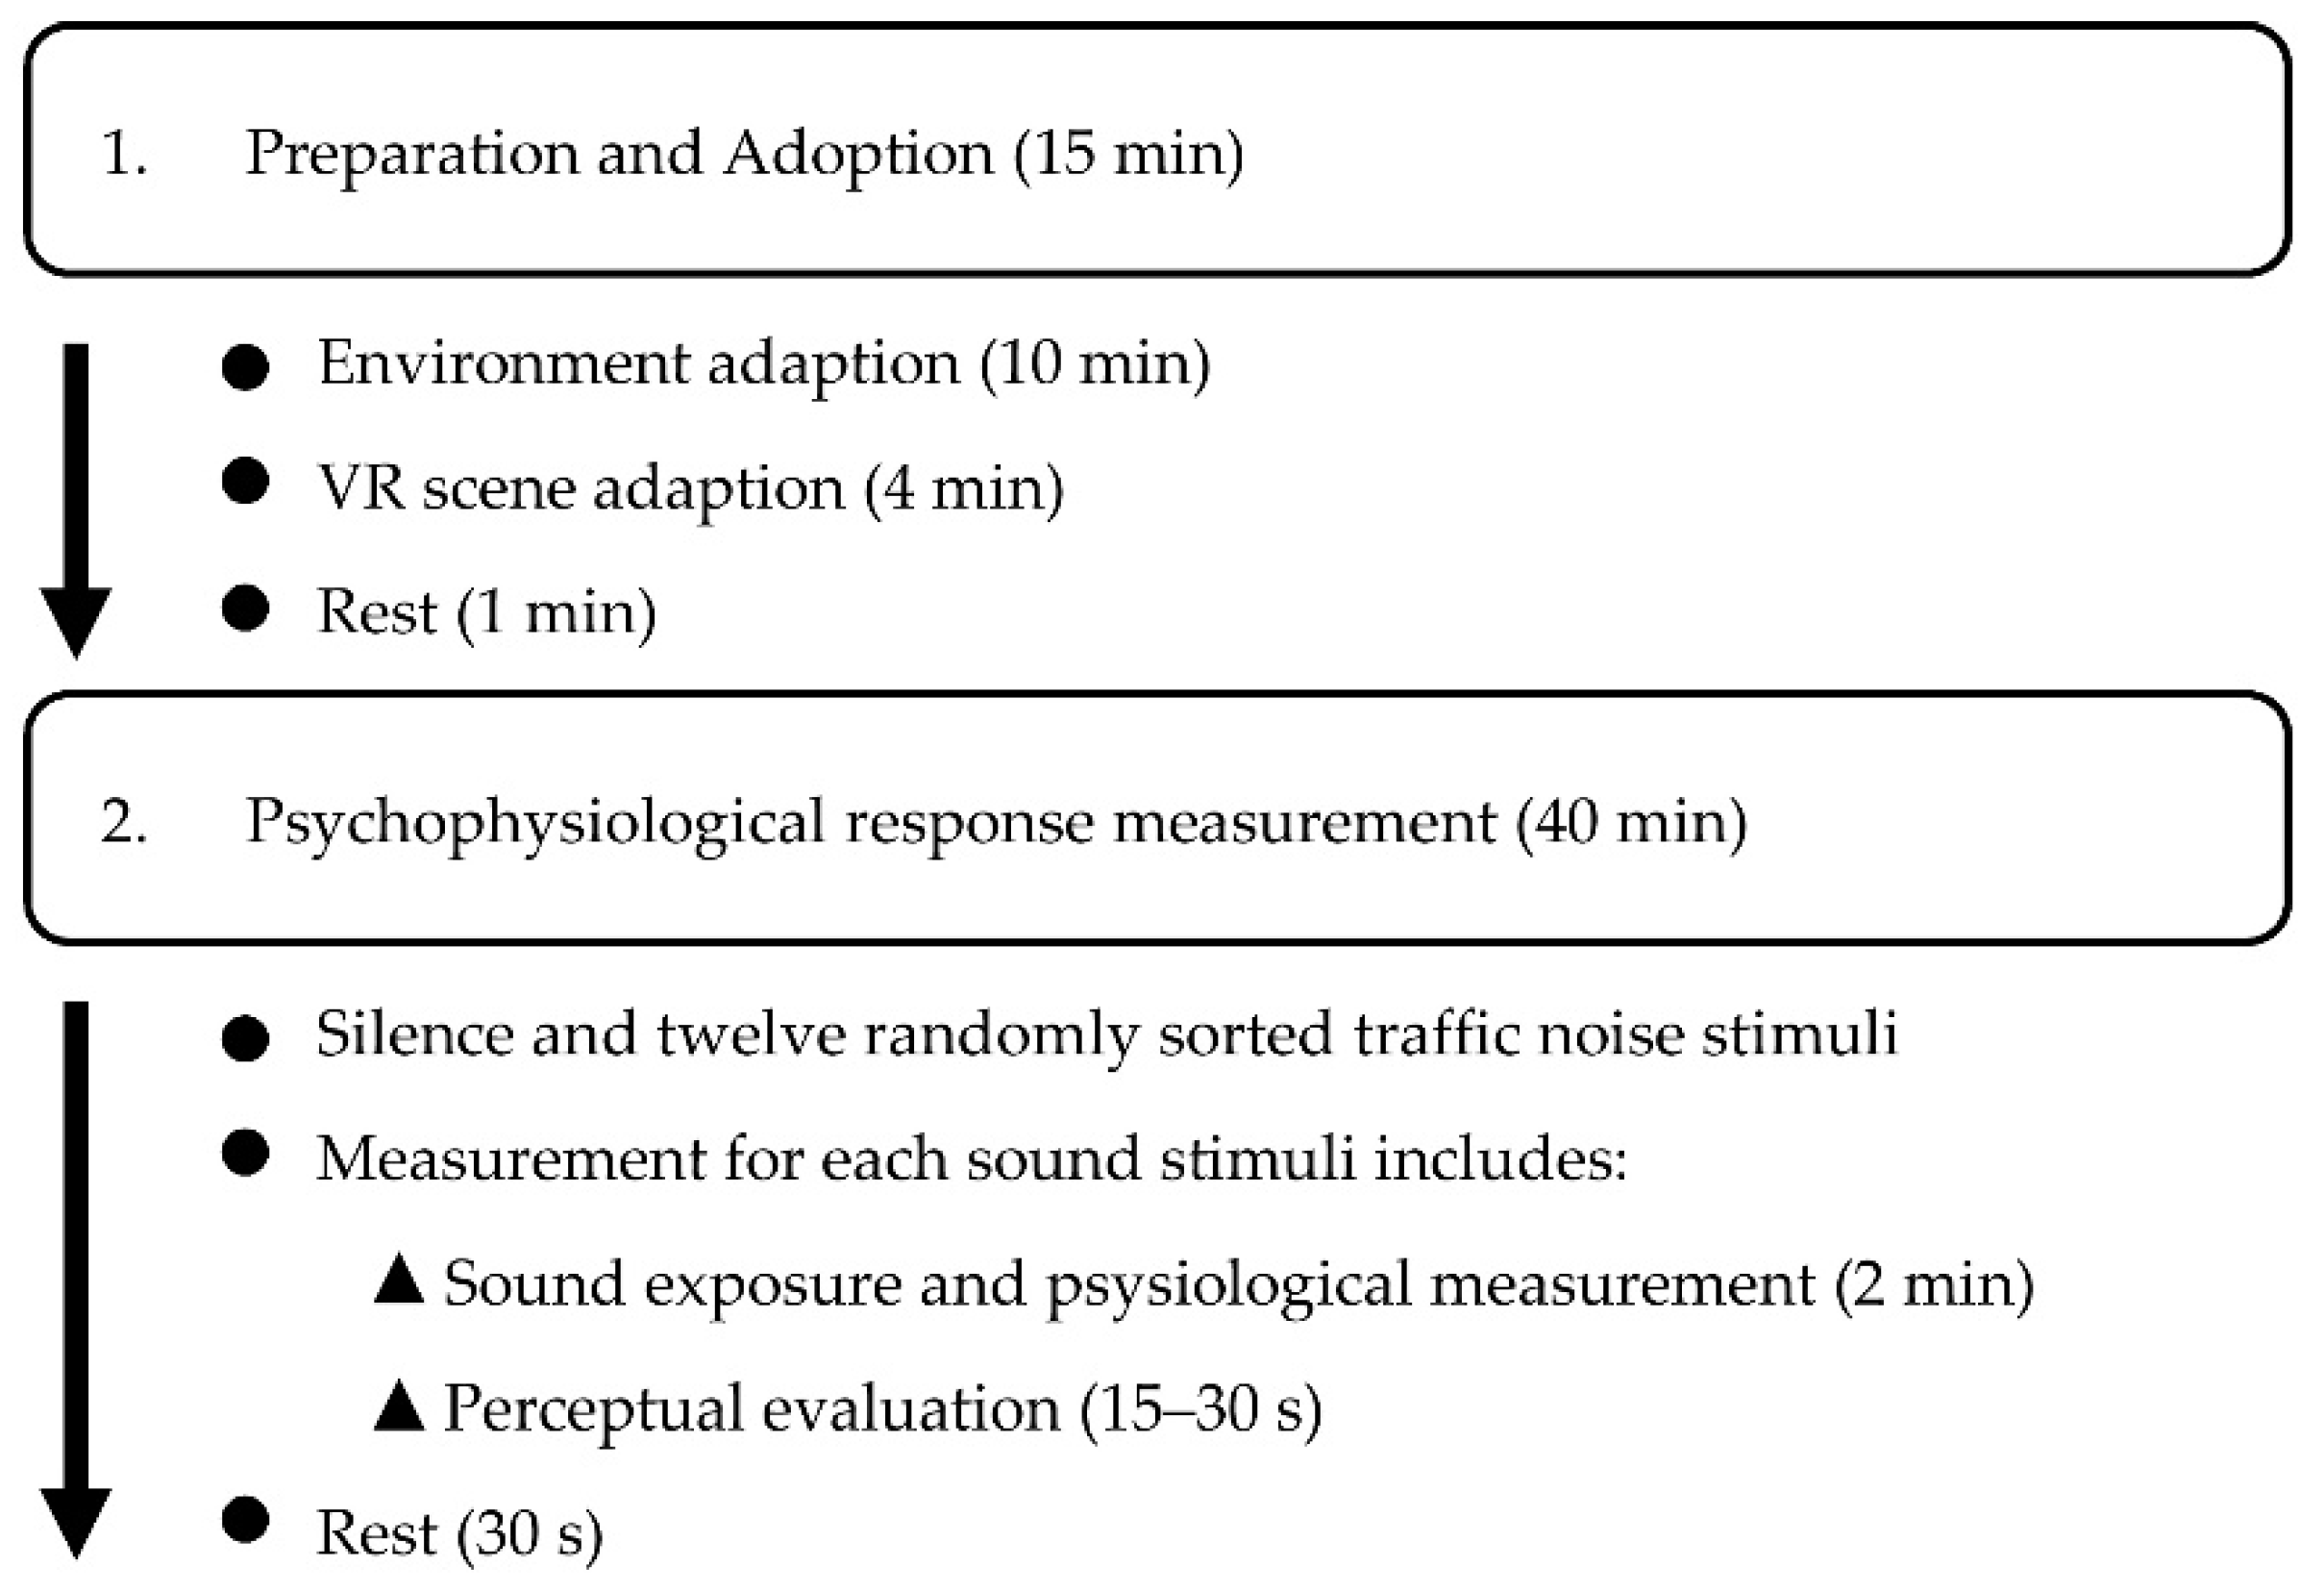
As shown in Figure 4, the experiment was generally divided into two sessions: (1) an adaptation session and (2) a measurement session. In the first 10 min, the participants came into the laboratory to adapt to the experiment environment while the informed consent was read and signed. Then, the VR equipment was put on to adapt to the VR scene for 4 min. During this adaptation session, the physiological sensors were attached, and a practice session for psychological and physiological measurement was conducted. Then, the participants were asked to rest for 1 min with their eyes closed to remove the impact caused by the practice session.
In the measurement session, a silent clip was first used to conduct the baseline measurement. Then, 12 traffic sound stimuli were presented in a random order for each participant. For each experimental stimulus, there were three periods: (1) a 2 min continuous measurement of EDA and HR during the exposure to traffic sound; (2) psychological measurement with the questionnaire, which lasted approximately 30 s; and (3) a 1 min rest to remove the effect of the former stimulus. The total time for the formal experiment was approximately 45 min.
2.5. Data Analysis
In this study, all statistical analyses were conducted using the SPSS 20.0 software. The multivariate analysis of variance (MANOVA) was first used to identify the influential factors for psychophysiological responses, with the independent variables being sound level, sound type, gender, and exposure time. In addition, the interaction effect of sound type and sound level was also included in the MANOVA analysis. Before the MANOVA analysis, the normality assumptions of the measured responses for each level of the independent variables were examined with the Kolmogorov–Smirnov test. Some of the dataset violated the normality assumption (acoustic comfort and noise annoyance). However, it was suggested that an ANOVA analysis could still yield robust and valid results with non-normally distributed data [50]. The homogeneity of variance was verified with Levene’s test (acoustic comfort: p = 0.0.564; annoyance: p = 0.958; arousal: p = 0.925; pleasantness: p = 0.0.337; EDA: p = 0.952; HR: p = 0.287). A pairwise comparison was also applied to show where the differences lay. The least significant difference test (LSD) and the Mann–Whitney U test were applied for variance homogeneity and heterogeneity cases, respectively. Finally, a Spearman correlation analysis was applied to investigate the relationship between the physiological responses and psychological responses. In all analyses, a p-value less than 0.05 was used as the criterion to determine significant differences.
3. Result
3.1. Effect of Traffic Sounds on Psychological Responses
The MANOVA analysis was applied to investigate the effects of the experimental factors on the subjects’ psychological responses, including acoustic comfort, annoyance, arousal, and pleasantness. Four factors were used in the ANOVA analysis, including gender, sound type, sound level, and the interaction of sound type and sound level. As discussed in Section 2, there were significant temporal differences between the traffic sound stimuli. Therefore, two different sound level indicators, the equivalent sound level (LAeq) and the peak level (LAfmax), were used in two independent ANOVA analyses, as shown in Table 1. The results show that gender only showed significant effects on arousal and pleasantness evaluations. Acoustic factors, including sound type and sound level, showed significant effects on all four evaluation dimensions. Using LAeq as the sound level index (configuration 1), both the sound type and the sound level showed significant influences on participants’ psychological responses. However, when replacing LAeq with LAfmax (configuration 2), only the sound level showed a significant influence on psychological responses. In both ANOVA analyses, no significant interaction effects of sound type and sound level were found.
As shown in Figure 5, the sound type also had a significant influence on the subjects’ psychological evaluation. Compared with the baseline condition (silence), all four traffic sounds showed strong negative psychological impacts (lower comfort, higher annoyance, higher arousal, and lower pleasantness). By a further pairwise comparison, the psychological impact of tram sound was found to be significantly stronger than that of the other three traffic sounds. A rank could be assigned based on the negative effects, such as: tram > high-speed train > conventional train > road, which is contrary to the duration order shown in Figure 3.
This result explains the difference between the two ANOVA analyses with different sound level indicators, in which the peak sound level showed superior performance compared to the equivalent level in explaining the psychological impacts of different traffic sounds on people. In this experiment, the major difference between the four traffic sounds was temporal duration (road > conventional > high-speed > tram). As discussed in Section 2, this led to the difference in the peak sound level when the equivalent level was equalized. Therefore, the peak sound level described not only the overall sound level but also the temporal characteristics, which led to superior performance in explaining the psychological responses of the participants.
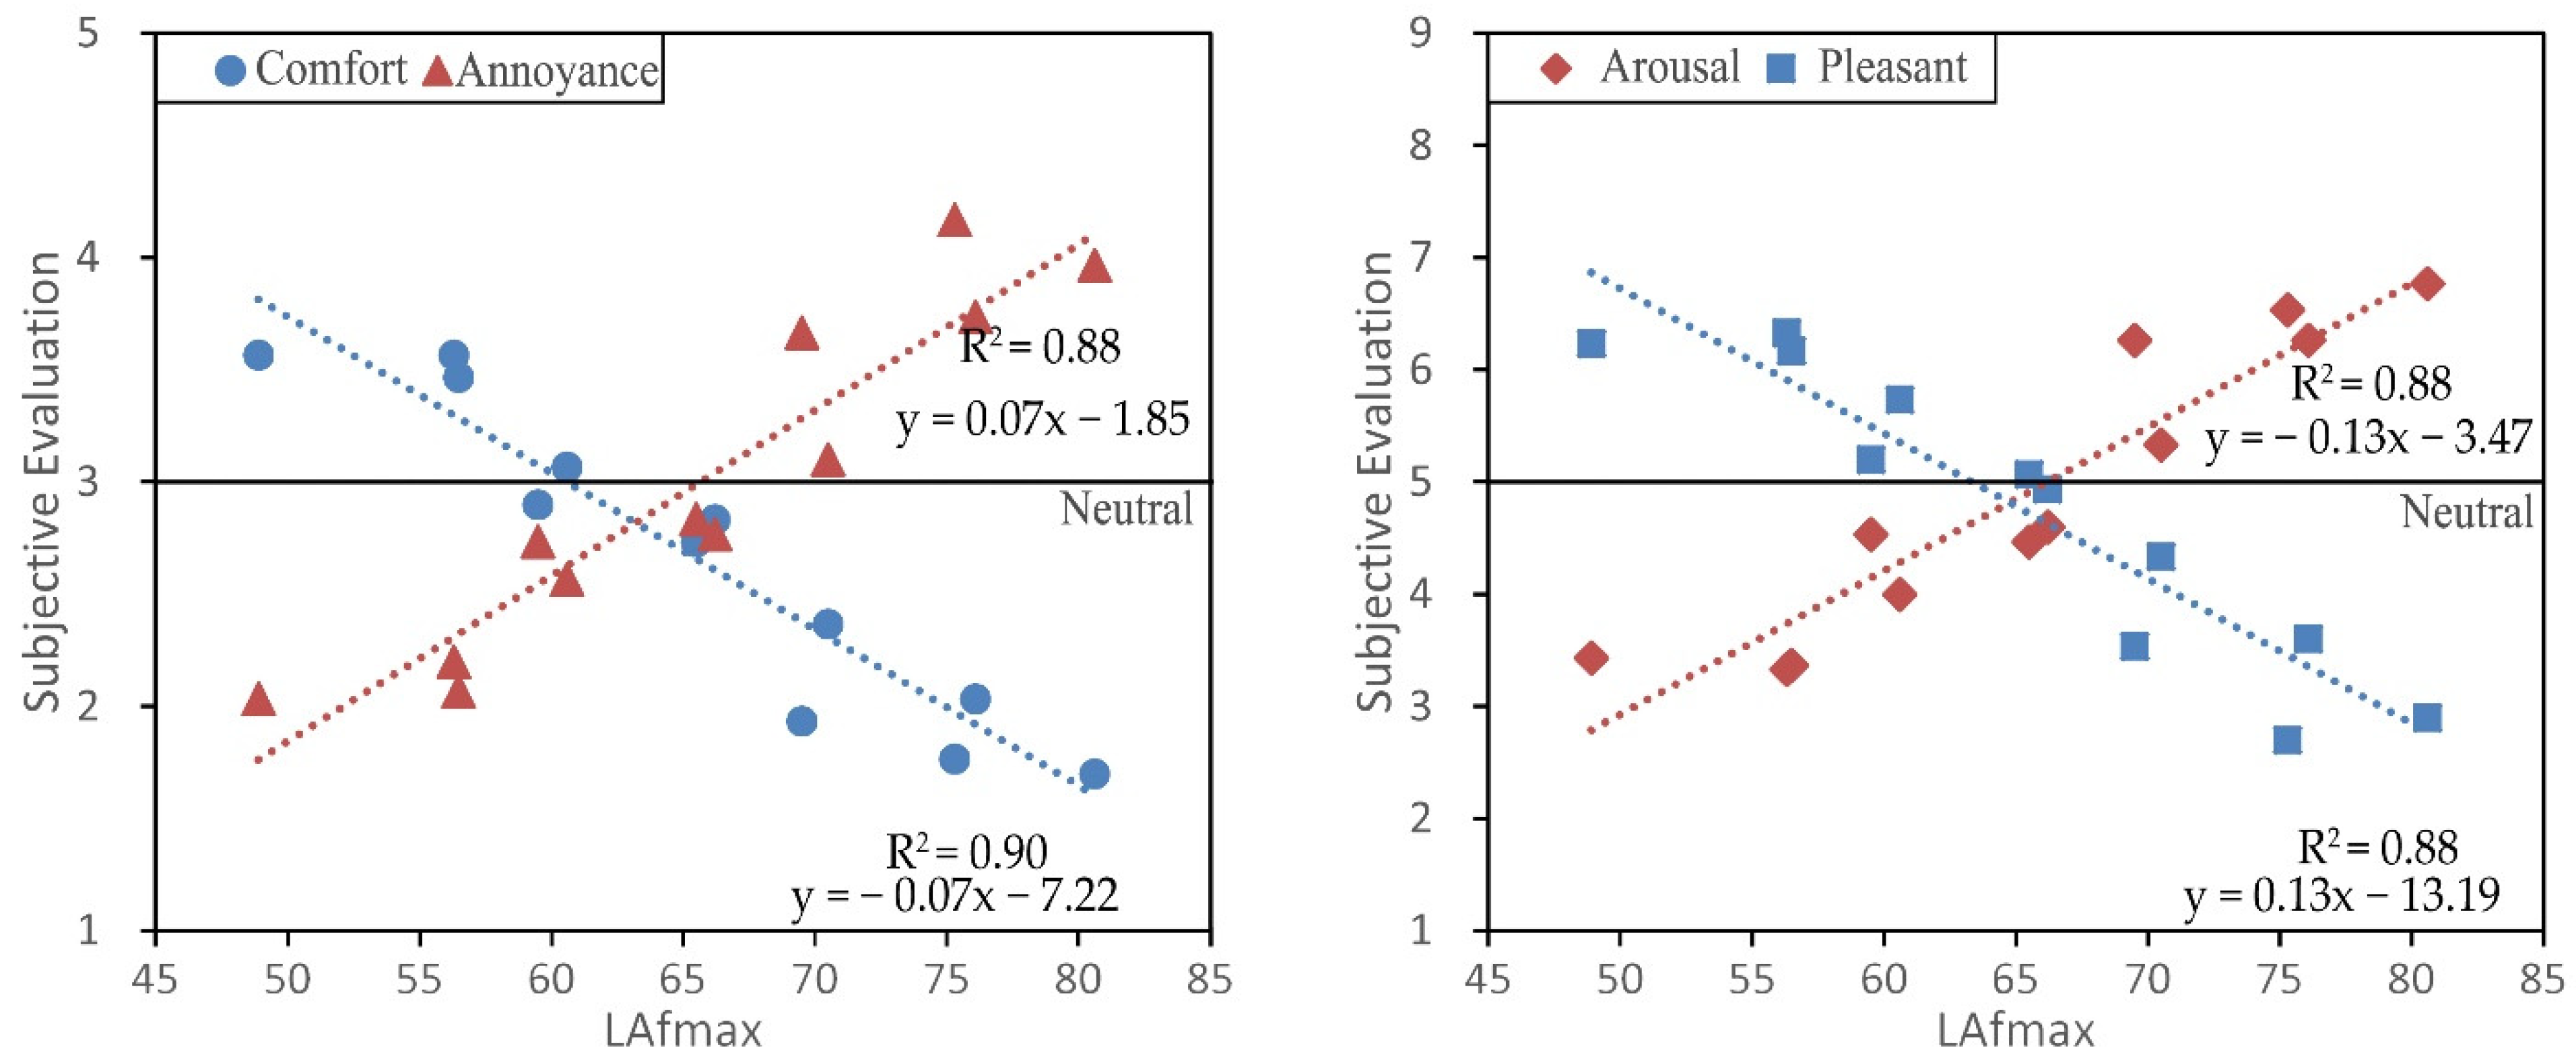
As shown in Figure 6, strong linear correlations were found between the psychological responses and LAfmax (R2 = 0.88–0.9). The negative effects of traffic sounds continued to increase with the increase in LAfmax. According to the regression equation, a 5 dB increase in LAfmax led to changes of 0.35, 0.35, 0.65, and 0.65 for comfort, annoyance, arousal, and pleasantness evaluation, respectively. Meanwhile, the sound levels for achieving neutral evaluations in each psychological dimension were different. By the regression equation, the upper limit of LAfmax for avoiding negative evaluations could be recognized as 60, 69, 65, and 63 dB for comfort, annoyance, arousal, and pleasantness evaluation, respectively. These results show that people have a greater tolerance for traffic noise annoyance than the other three evaluation dimensions. Therefore, relatively weak traffic sounds could have significant negative effects on the psychological state (arousal and pleasantness) and the overall soundscape quality (comfort), although they were perceived as “not annoying”. These results indicate the insufficiency of the questionnaire survey with annoyance as the only evaluation dimension to evaluate the impact of traffic sounds.
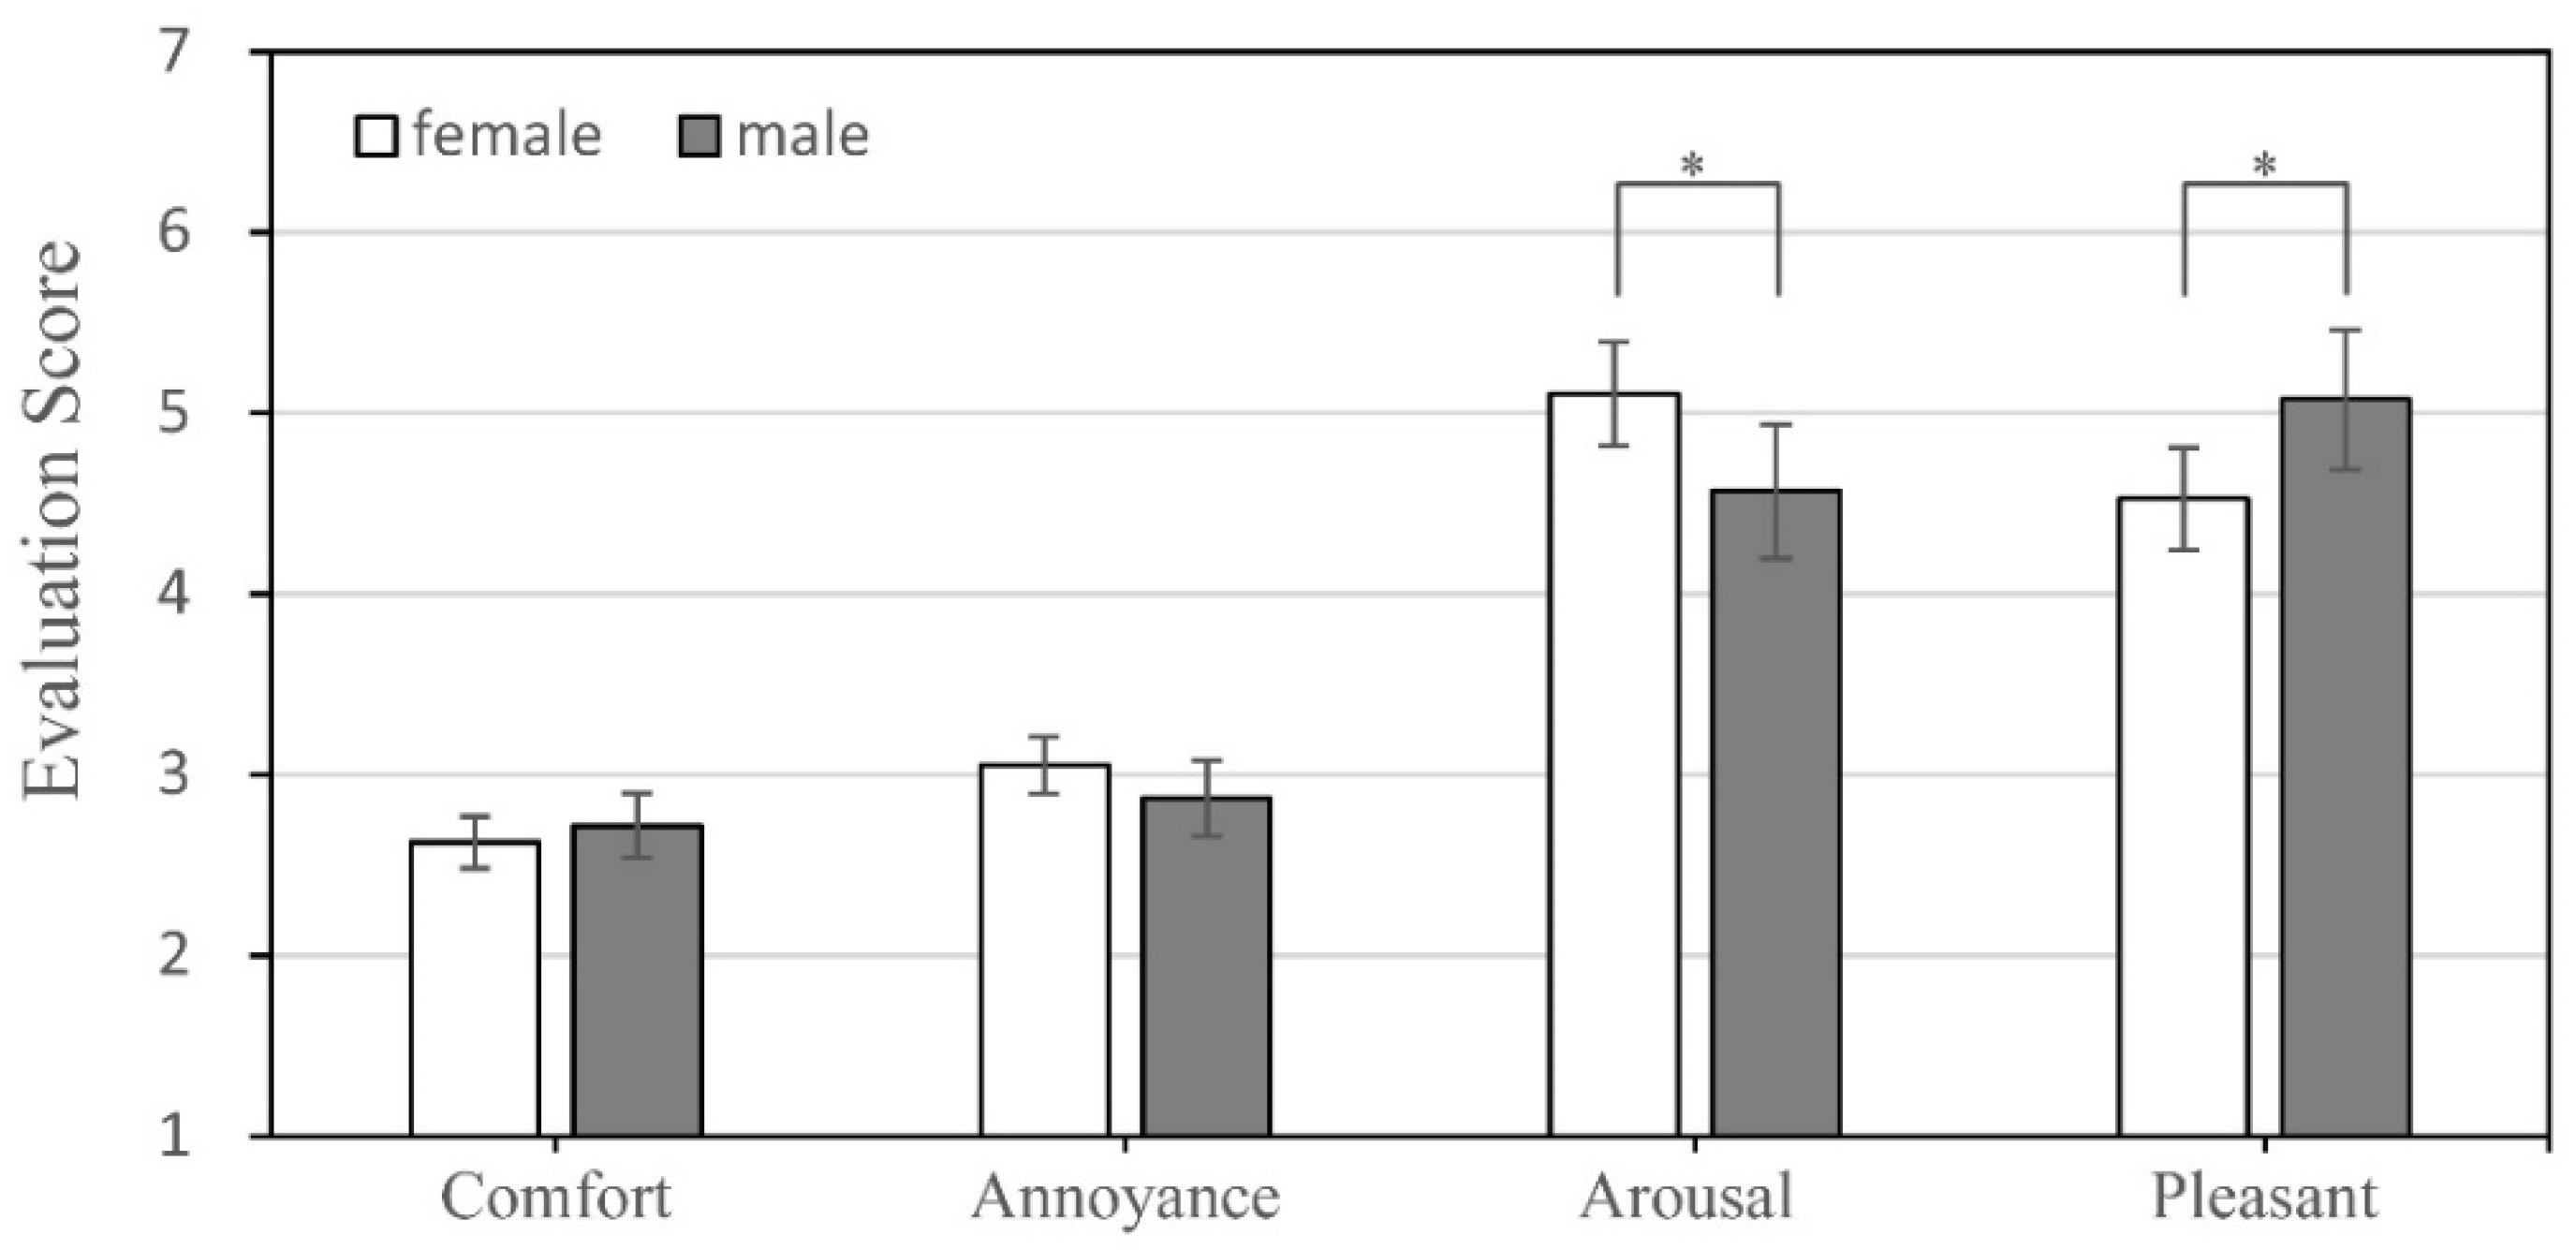
Besides acoustical factors, significant main effects of gender on psychological state were also found, including arousal and pleasantness. As shown in Figure 7, under the impact of traffic sounds, the evaluations of female participants were significantly more negative than those of male participants, with higher arousal evaluations and lower pleasantness evaluations. This result shows that being exposed to traffic sounds has a stronger psychological impact on females than on males in urban green spaces.
3.2. Effect of Traffic Sounds on Physiological Responses
Table 2 shows the results of the MANOVA analysis for physiological responses (EDA and HR). It revealed that both the acoustic factors and the non-acoustic factors had significant effects on the physiological impact of traffic sounds. The main effect of gender was found to be significant on both EDA and HR. Besides, a significant main effect of the exposure time on HR was also found. As for the acoustic factors, the main effects of sound type and sound level were found to be significant on EDA and HR, respectively. In addition, the interaction between the sound type and sound level was observed to be influential on EDA.
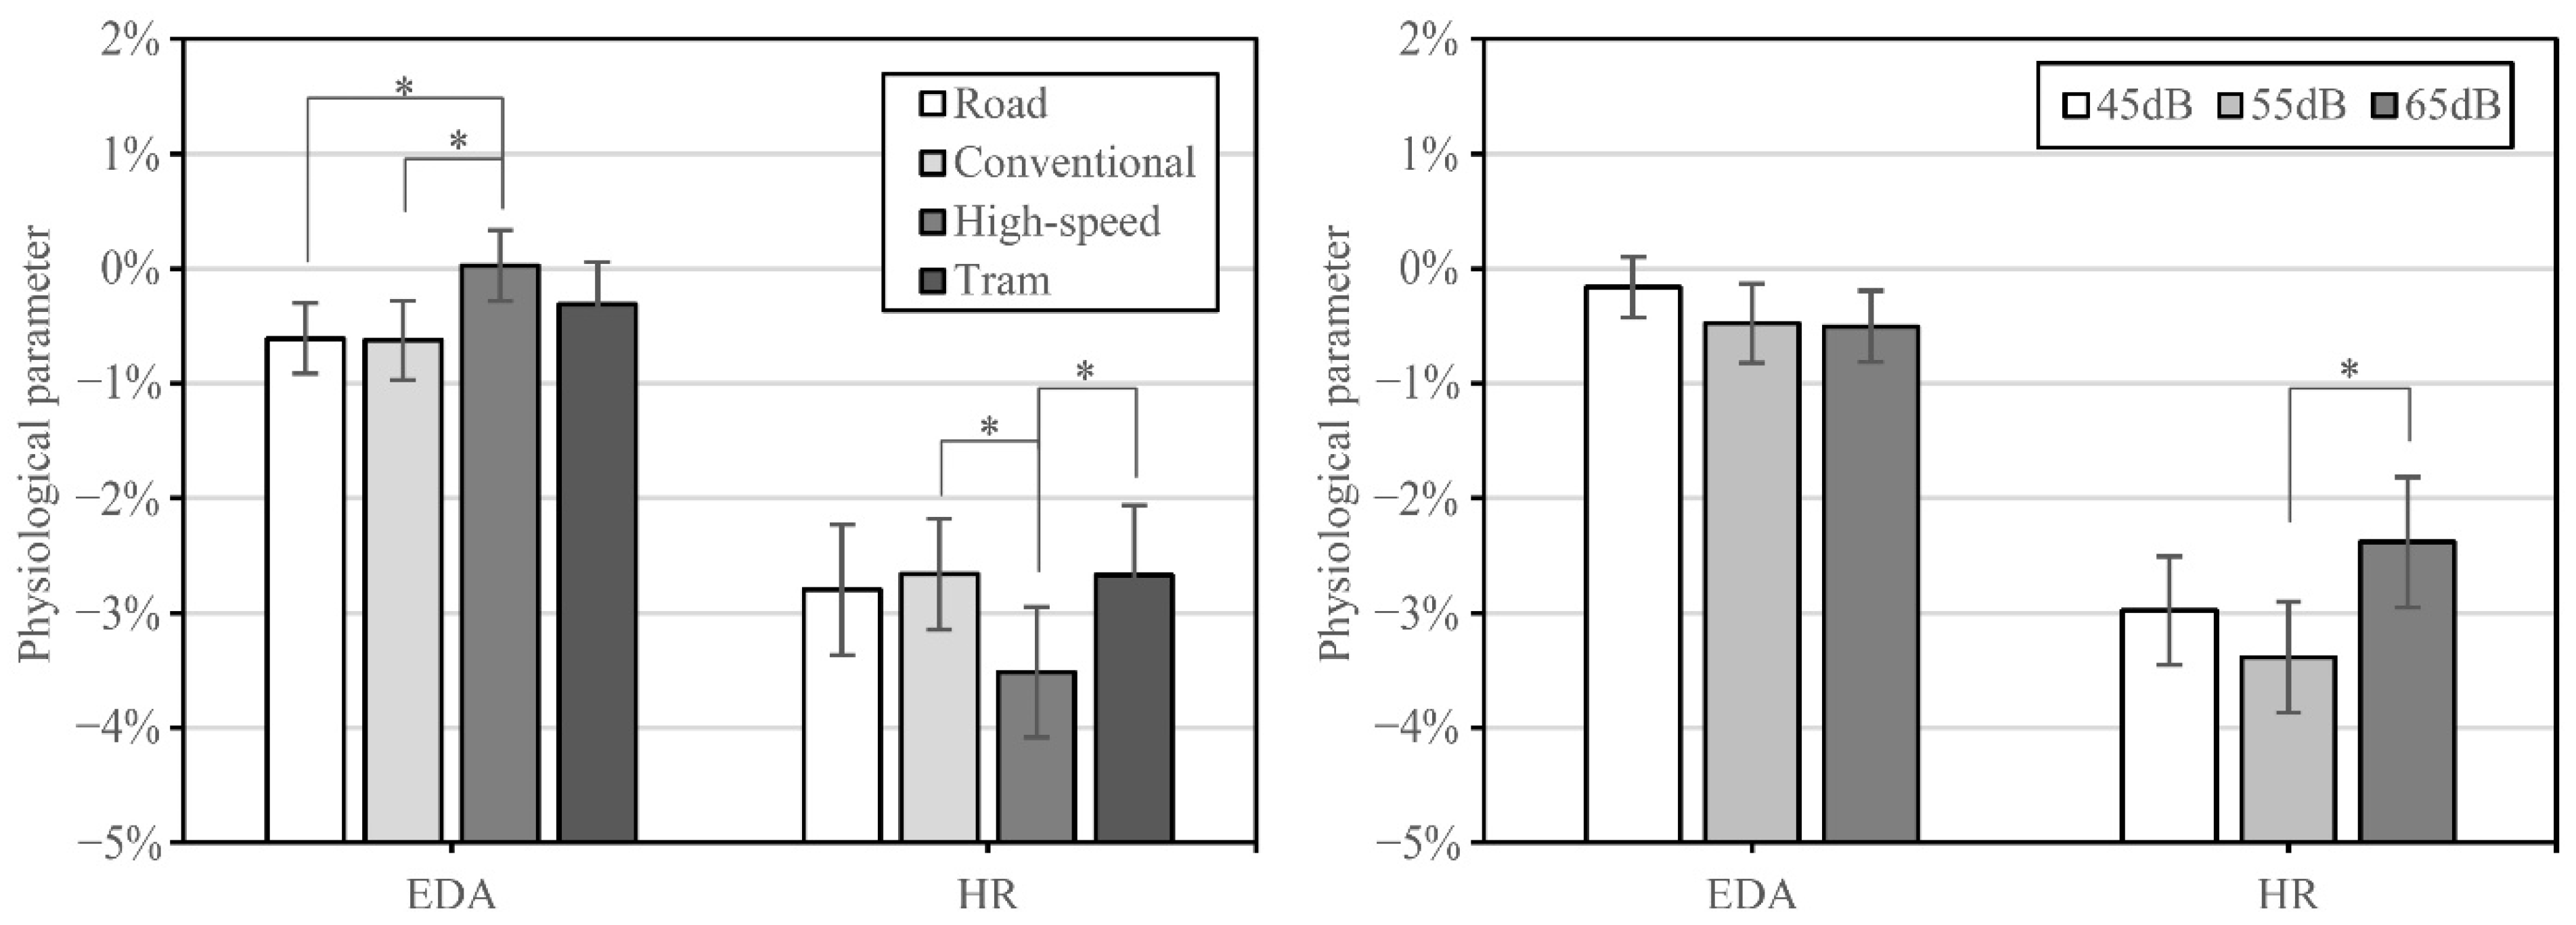
Figure 8 shows the effects of the sound type and sound level on the physiological responses. By further pairwise comparisons, five significant differences were identified. For the sound type, all four significant differences were between the high-speed train sound and the other traffic sounds, including: (1) the EDA under the high-speed train sound was significantly higher than those under the road traffic sound (p = 0.010) and conventional train sound (p = 0.008) and (2) the HR under the high-speed train sound was significantly lower than those under the conventional train sound (p = 0.035) and tram sound (p = 0.038). These results indicate that the physiological impact of the high-speed train sound was significantly different from other traffic sounds. As for the sound level, only one pairwise comparison was found to be significant. A significant increase in HR was found when the sound level increased from 55 dB to 65 dB. This result indicates that the main effect of SPL on the physiological responses was relatively limited, especially when the sound level was low (45 to 55 dB).
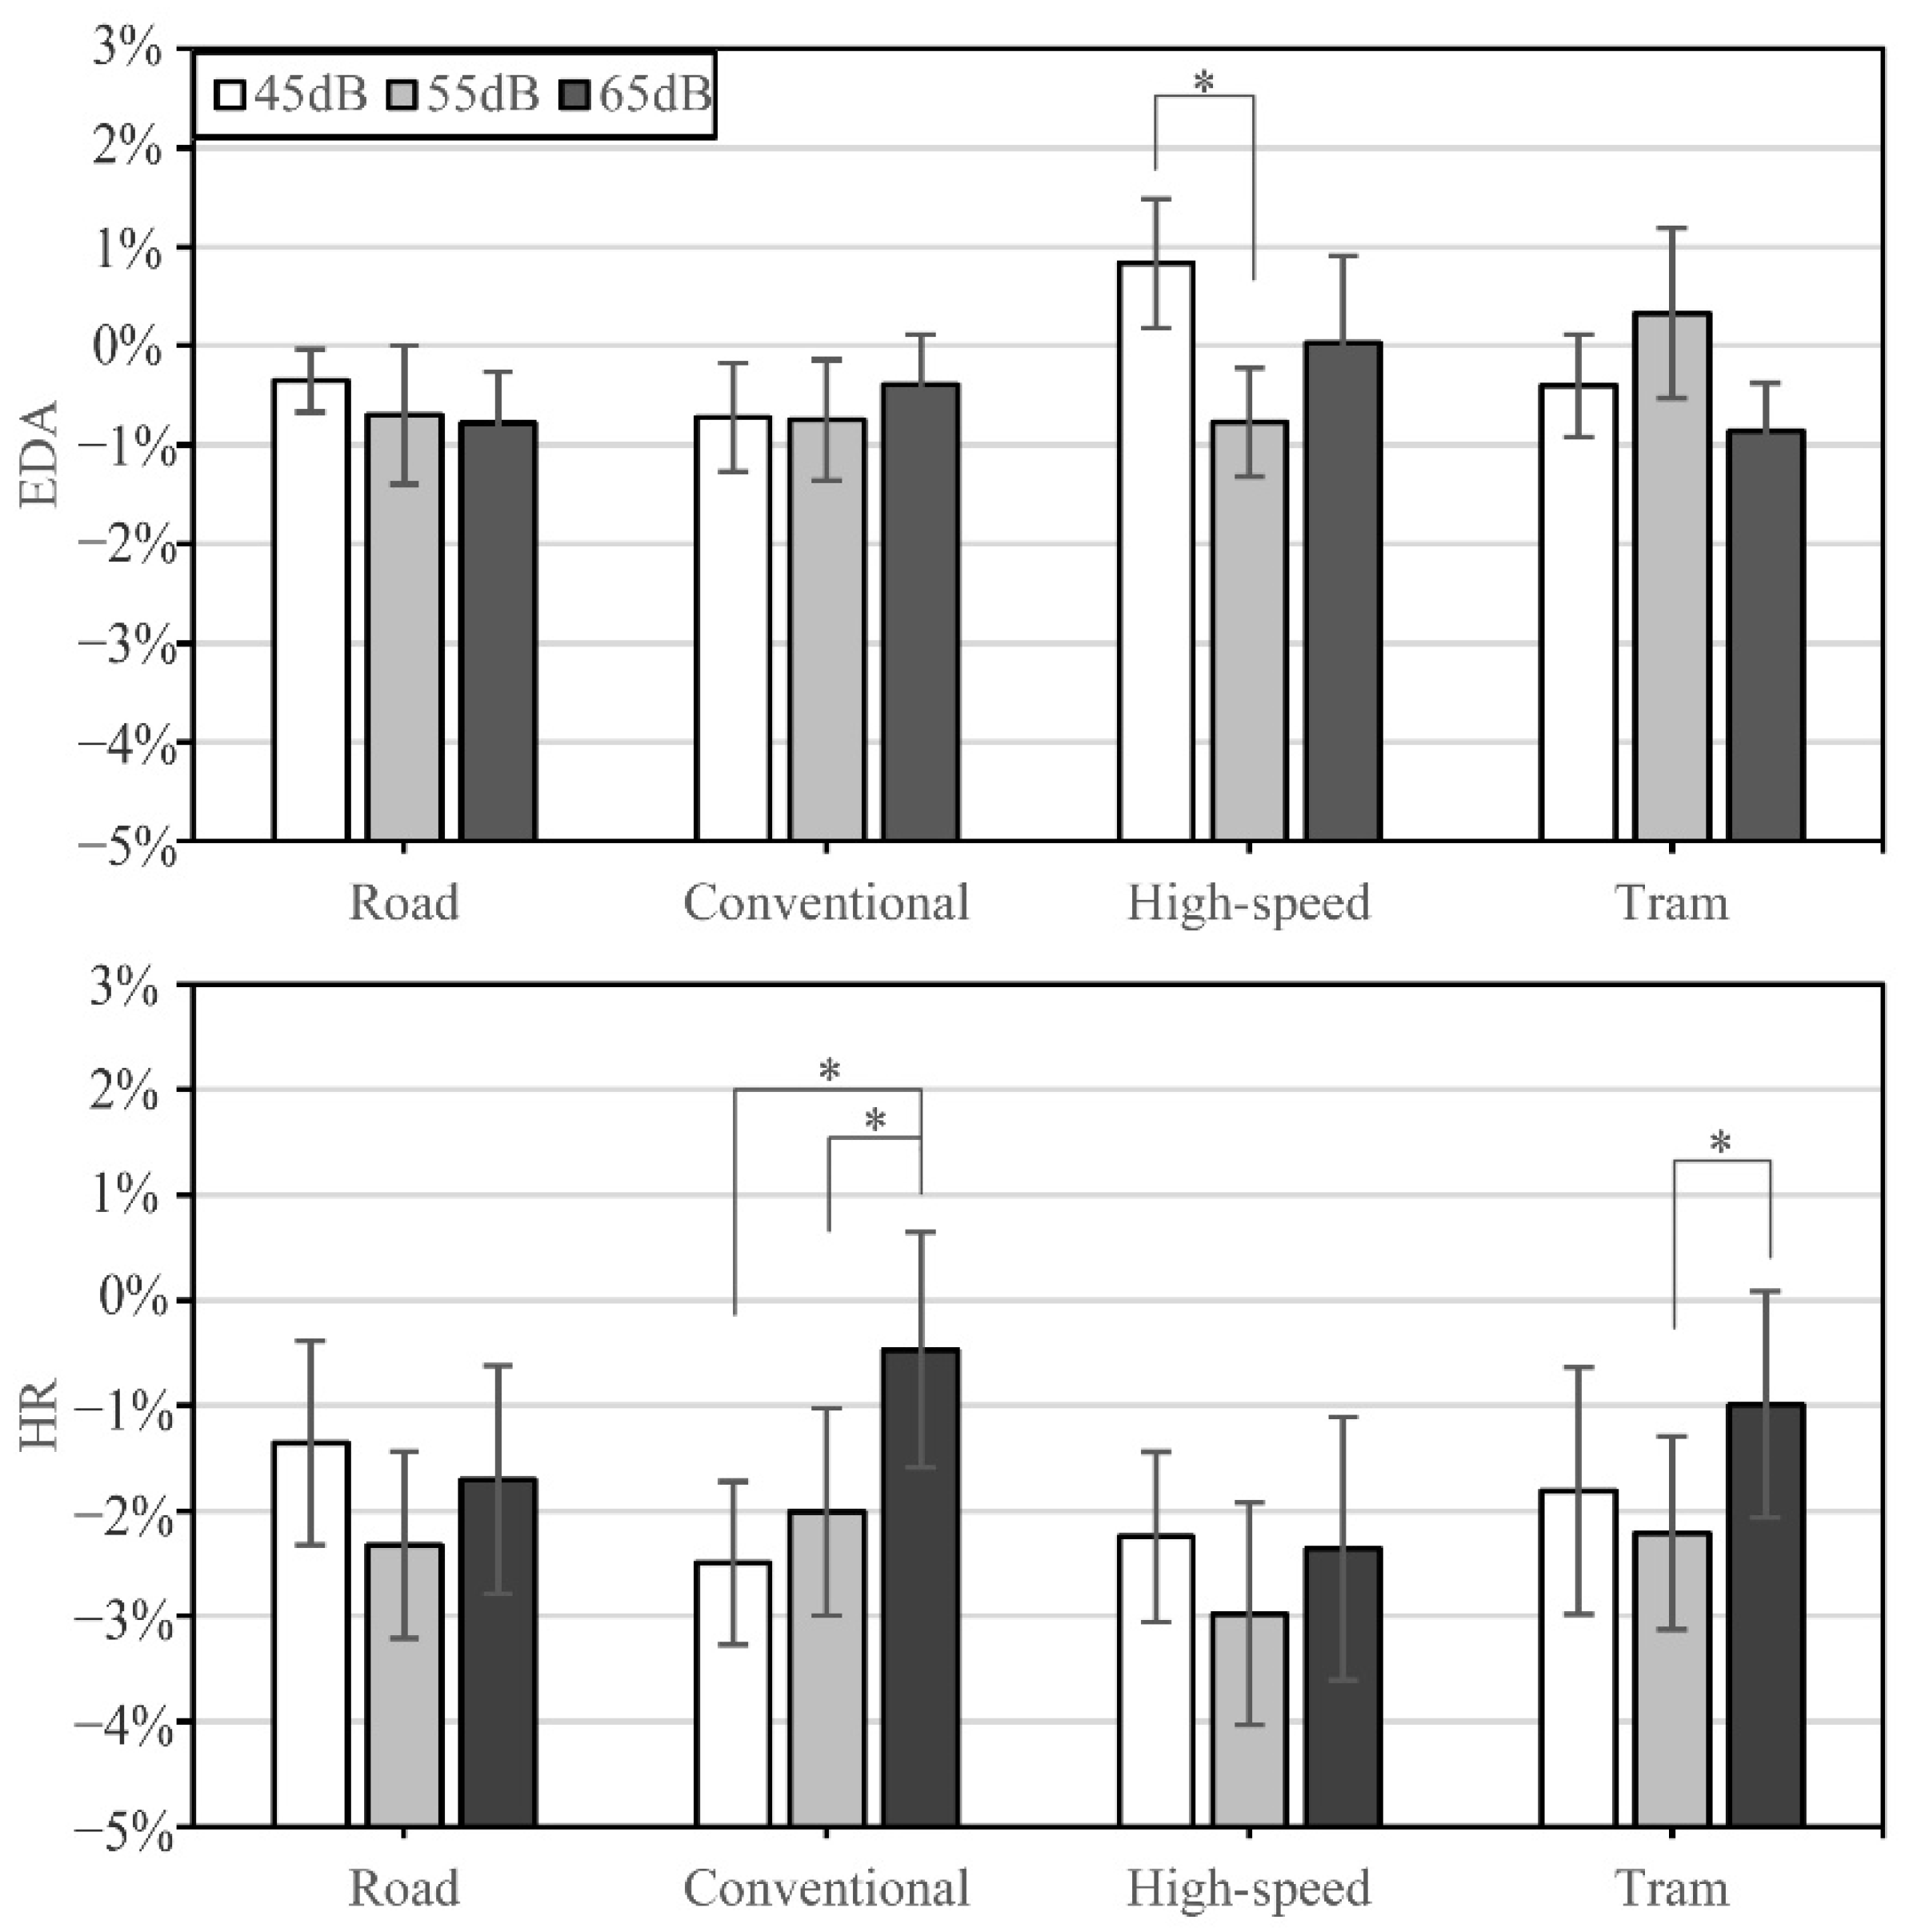
An explanation for this phenomenon is that the relationship between the SPL and physiological responses varied in different sound groups, as indicated by the significant interaction effect between SPL and sound type in Table 2. Further pairwise comparisons were carried out to investigate how physiological responses varied with the increase in sound level in each sound group. As shown in Figure 9, the results varied wildly in different traffic groups. As for the road traffic sound, the change in SPL from 45 dB to 65 dB could hardly affect the participant’s physiological responses, including EDA and HR, while significant changes in physiological responses were found with the increase in SPL in the railway sound groups. As for the high-speed train sound, when the sound level increased from 45 dB to 65 dB, a significant decrease in EDA was found ( = −3.397, p = 0.001). For the conventional train sound and tram sound, the increase in sound level led to significant increases in HR: (1) when the conventional train sound increased from 45 to 65 dB ( = 2.155, p = 0.031) and 55 to 65 dB ( = 2.035, p = 0.042) and (2) when the tram sound increased from 55 to 65 dB ( = 2.313, p = 0.021). This result indicated that the effect of sound level on the physiological responses depended on the sound type. As for the steady road traffic sound, the decrease in sound level was insufficient to reduce the physiological impact on participants. On the contrary, the control of sound levels is still an effective treatment for controlling the impact of intermittent railway sounds.
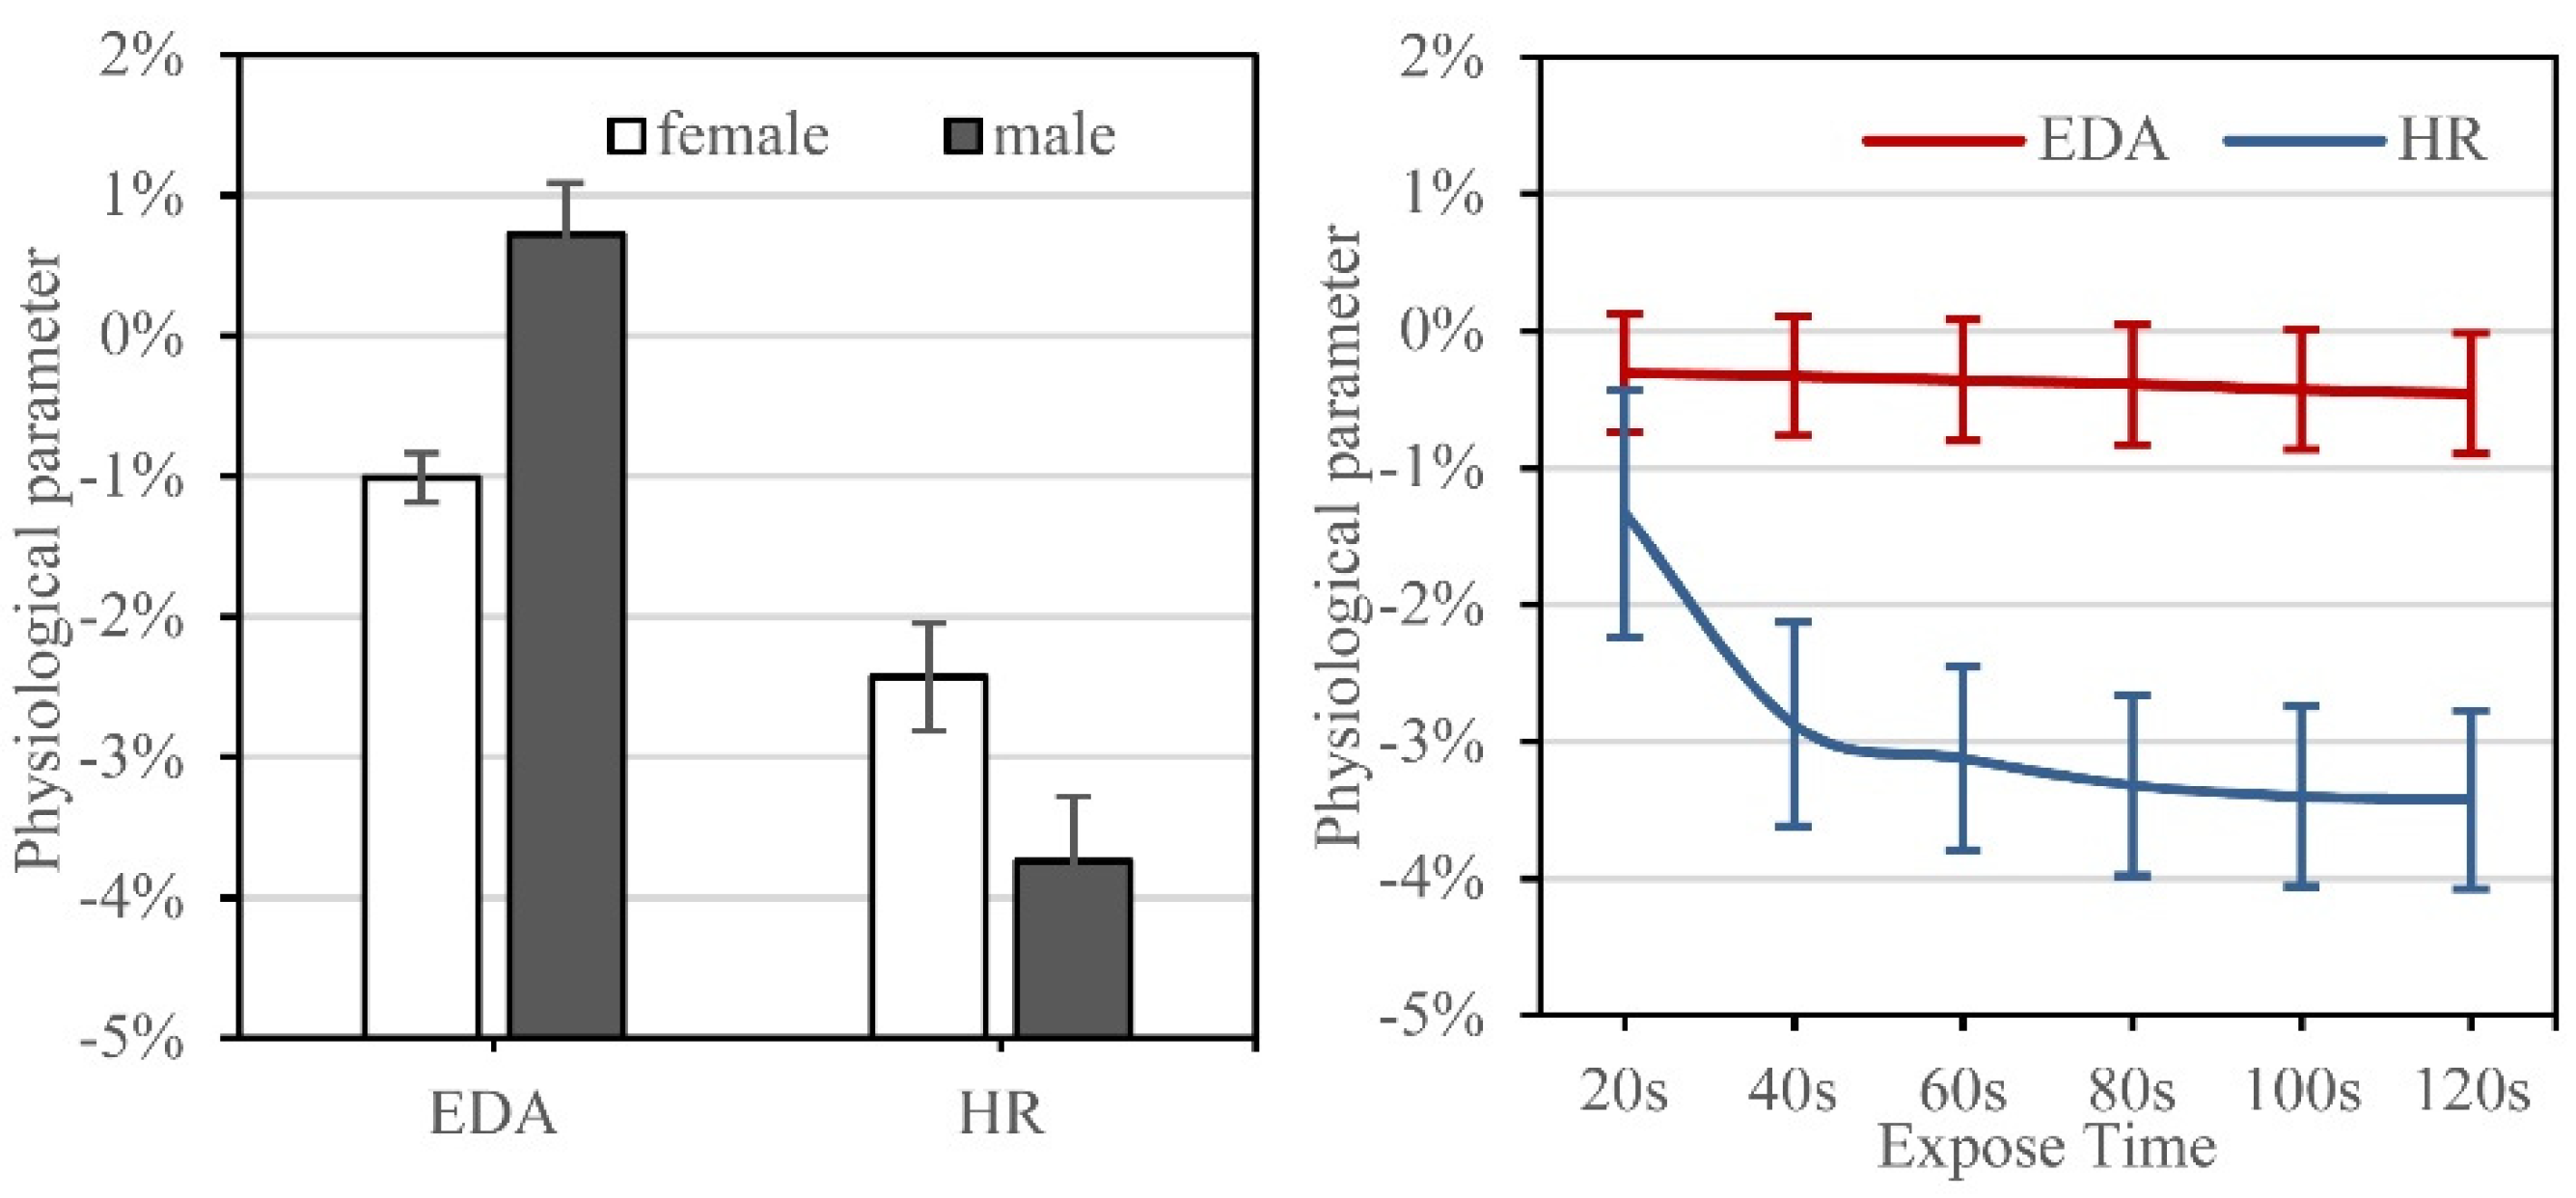
Besides acoustic factors, non-acoustic factors (gender and exposure time) were also found to be influential on physiological responses, as shown in Figure 10. According to the effect factor, gender was found to be more influential on EDA and HR than the acoustic factors. When exposed to traffic sounds, the EDA and HR of males were significantly higher (F = 92.27, p = 0.000) and lower (F = 18.77, p = 0.000), respectively. Meanwhile, HR was also significantly affected by the exposure time (F = 4.92, p = 0.000). With the increase in exposure time, the HR of participants decreased rapidly in the first 60 s and gradually stabilized after 60 s. This result reveals that there was a strong adoption effect on HR when exposed to traffic sounds.
3.3. Relationship between Psychological and Physiological Responses
A Spearman correlation analysis was applied to reveal the relationship between the psychological responses and physiological responses, as shown in Table 3. Strong correlations were found between the psychological responses (). The EDA parameters were discovered to be independent of the HR parameters (). Only one weak correlation was found between the physiological responses and psychological responses: that between HR and annoyance (). It indicates that more annoying traffic sounds lead to a higher HR level when exposed to traffic sounds. These results revealed that the physiological responses and psychological responses were relatively independent from each other when exposed to traffic sounds. Therefore, it might be insufficient to assess the physiological impact of traffic sounds with the psychological evaluations of the sound environment through self-reported surveys. The measurement of physiological responses might be necessary to have a comprehensive investigation of the impact of traffic sounds on the urban environment.
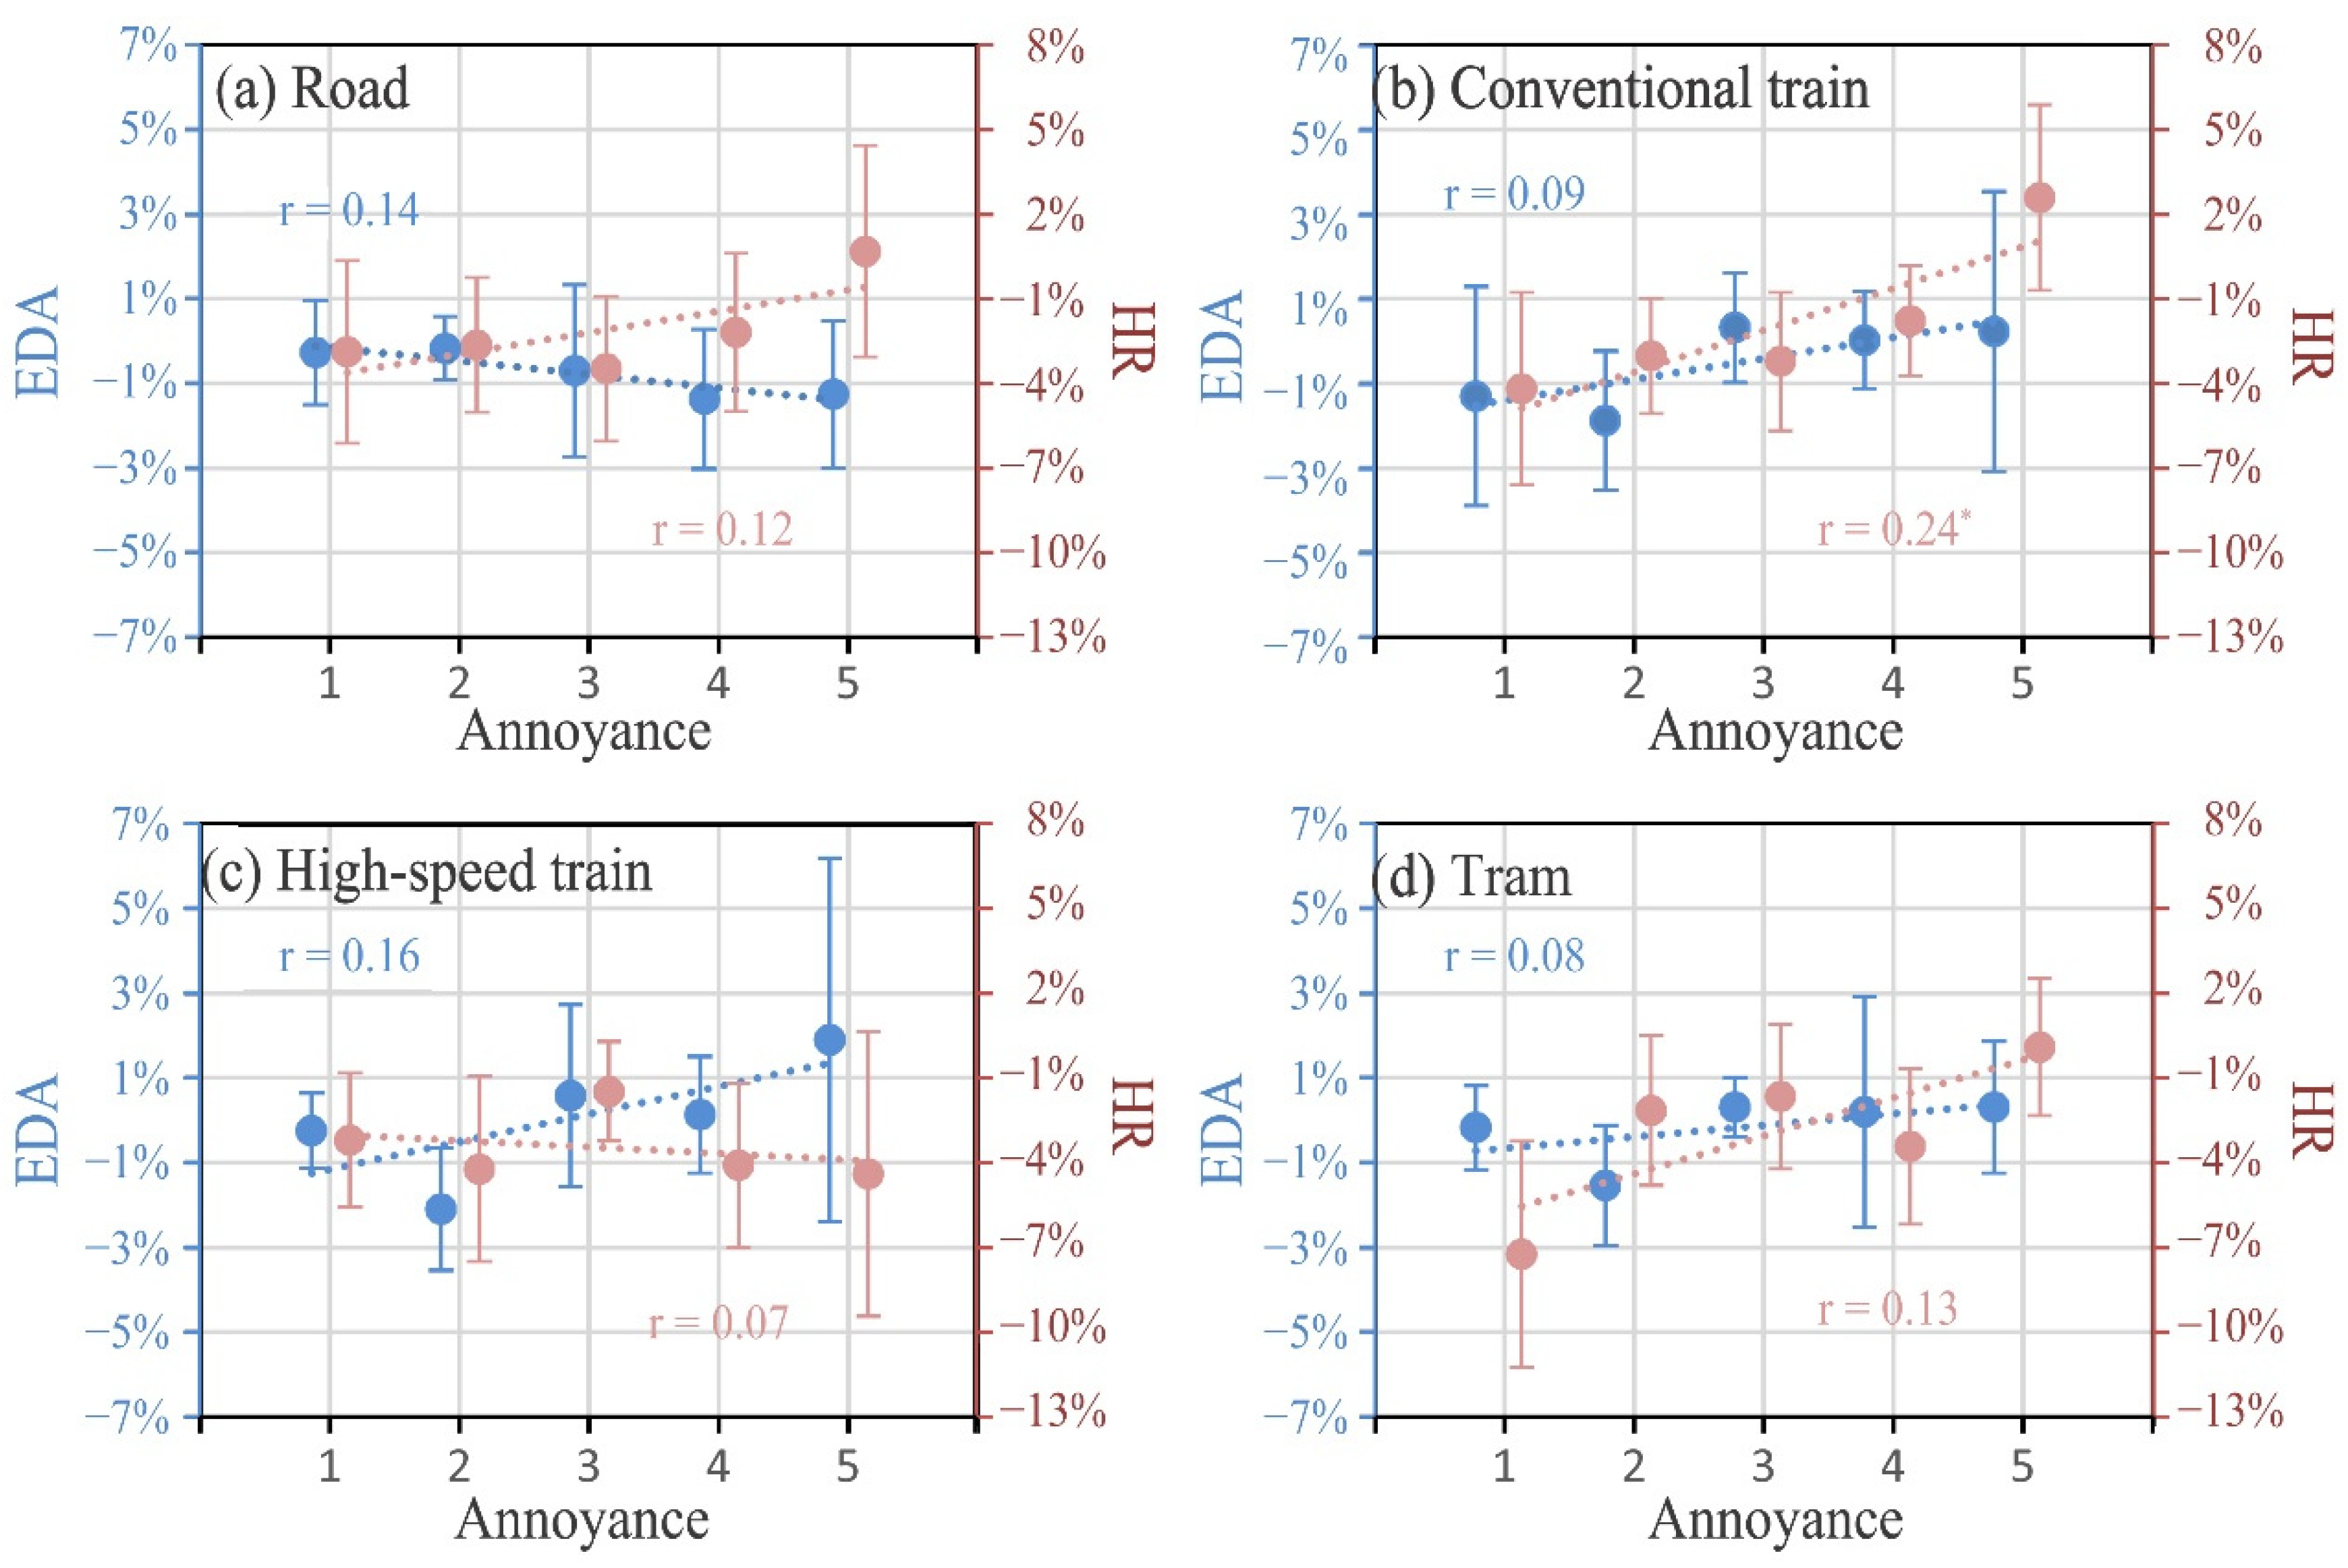
Figure 11 shows the relationship between noise annoyance and physiological responses in each traffic group. In all four groups, EDA was independent of the noise annoyance, while in the conventional train group, a significant positive correlation was identified. In the road traffic and tram groups, the correlation coefficient between HR and annoyance was also positive. However, in the high-speed train group, a weak negative correlation between HR and annoyance was found, which was different from the other three traffic sounds. This result agreed with the result in Figure 8 that the psychophysiological impact of the high-speed train sound was significantly different from the other traffic sounds.
4. Discussion
The findings of this study show that traffic noise has a significant negative impact on the urban green space soundscape, both psychologically and physiologically. Both sound level and traffic type have significant effects on these impacts. However, there were only very weak correlations between the physiological responses and the psychological responses. Therefore, the widely used self-reported questionnaire survey focusing on traffic noise annoyance and soundscape quality might be insufficient for evaluating the physiological impact of traffic sounds. In addition, the common noise level control treatment might be inefficient in controlling the physiological impact of traffic sounds.
As expected, the psychological responses in green space were found to be dominated by the traffic sound magnitude, which agreed with the results of long-term field surveys [51,52]. In addition, the results in this study show that not only the overall energy magnitude but also the temporal variation characteristics are important in determining the psychological impacts. The peak sound level, LAfmax, shows superior performance to the equivalent level. These results reveal that more steady traffic sounds lead to less impact on the green space soundscape when the overall sound energy is controlled. As a result, limiting the carrying capacity and speed of the vehicle may result in a reduction in traffic noise impact, even as the number of vehicles increases.
However, the results of the physiological responses indicated that the decrease in traffic sound level might be inefficient in controlling the physiological impacts because they were strongly affected by the traffic type. First, the impact of the high-speed train sound was found to be significantly different from other traffic sounds. Meanwhile, the relationships between the traffic sound level and physiological parameters varied in four traffic groups. Therefore, the common noise barrier might be effective for railway sounds but ineffective for road traffic sounds. To improve the green space soundscape quality, new strategies should be specially designed according to the traffic type. It was suggested that in the mixed soundscape, the presence of natural sounds, i.e., birds singing and water sounds, had a positive physiological effect in a soundscape exposed to road traffic sound [34]. As a result, the physiological masking effect of pleasant natural sounds could be a potential solution for reducing the impact of traffic noise when noise control treatments are not efficient.
Some limitations of this study should also be noted. First, silence was chosen as the baseline condition, and only traffic sounds were used as the experimental stimuli in this study. However, there are inevitably other sound sources in actual urban green space soundscapes. As suggested by Suko et al., there are significant interactions between different sound sources in mixed soundscapes [34]. Therefore, in a green space soundscape with multiple sound sources, especially when the traffic sounds are relatively weak, the effect of traffic sounds might be different. Future studies need to be conducted to investigate the effects of mixed sounds in such soundscapes. Second, a static picture without traffic vehicles was used in the VR system to establish the visual environment in this study. As suggested by Li et al., there are significant interactions between visual and acoustic information on the psychophysiological response to a soundscape [35]. Therefore, the visual information of the transportation system might also have a potential influence on how people respond to the traffic noises in green space soundscapes. In general, this paper presents the results of an empirical study in which the effect of the two most fundamental factors of traffic sounds were considered: sound type and sound level. However, because of the complexity of the actual urban soundscape, experiments with more factors, including acoustic factors and non-acoustic factors, are needed to have a comprehensive investigation of the psychophysiological effects of traffic sounds in urban green space soundscapes.
5. Conclusions
A laboratory experiment on the psychophysiological impact of traffic sounds on an urban green space soundscape was conducted in this study. The following results were obtained:
In a green space soundscape, significant psychophysiological impacts of traffic sound were observed in the experiment. However, the psychological responses to traffic sounds were found to be independent from the physiological responses. Only one weak correlation between HR and annoyance was found to be significant in the experiment. Higher HR levels were observed when exposed to more annoying traffic sounds.
Strong negative effects of traffic sounds on the psychological assessment of the green space soundscape were identified, which were determined by both the sound type and the sound level. The peak sound level was found to be superior to the equivalent level in describing the psychological impacts of the various traffic sounds.
The physiological effects of the traffic sounds were also discovered to be determined by sound type and sound level. As for the sound type, the physiological response to the high-speed train sound was significantly different from the other three traffic sounds. Exposure to the high-speed train sound led to lower EDA (compared with conventional train and tram sound) and higher HR (compared with road and tram sound). The relationship between the sound level and physiological parameters also depended on the sound type. The physiological impacts of road traffic sound were found to be irrelevant to the sound level. On the contrary, the change in sound level was found to be influential on the participants’ physiological parameters in the railway sound group.
The findings in this study highlight that not only the sound level but also the sound type determine the psychophysiological impact of traffic sounds in urban green spaces. Especially for the physiological effects, controlling the sound level does not necessarily lead to an improvement in the environmental quality. Therefore, common noise treatments, such as noise barriers, might be less efficient at masking traffic sounds. Soundscape treatments, such as introducing natural sounds, for instance, might be more effective in masking the negative effect of traffic sounds. To offer more efficient and practical methodologies for architects, planners, and city managers, we will focus on the performance of applying soundscape treatments in reducing the impact of traffic sounds in future studies.
Author Contributions
Conceptualization, B.Y.; methodology, B.Y., J.B. and L.W.; formal analysis, B.Y. and Y.C.; investigation, J.B. and L.W.; data curation, B.Y.; writing—original draft preparation, B.Y.; writing—review and editing, B.Y.; supervision, B.Y.; project administration: B.Y.; funding acquisition, B.Y. All authors have read and agreed to the published version of the manuscript.
Funding
This research was funded by the National Natural Science Foundation of China (Project No. 51808030 and No. 52078026).
Acknowledgments
The authors wish to thank Wei Wu, and Junjie Li for their help with the VR software.
Conflicts of Interest
The authors declare no conflict of interest.
Appendix A
Questionnaire for psychological evaluation:
Introduction:
“Begin by listening through the 12 traffic sounds presented in the headphone, and build your opinion about their character. Thereafter you measure the traffic sounds with the aid of four attribute scales that appears in front of you. The traffic sounds must be measured one at a time on all the attribute scales and in the order presented from up to down.
Your task is to judge to what extent the attributes listed in the protocol are applicable to the traffic sounds in the current environment.”
Figure A1.
Questionnaire used in the experiment.

References
- De Ridder, K.; Adamec, V.; Bañuelos, A.; Bruse, M.; Bürger, M.; Damsgaard, O.; Dufek, J.; Hirsch, J.; Lefebre, F.; Pérez-Lacorzana, J.M.; et al. An integrated methodology to assess the benefits of urban green space. Sci. Total Environ. 2004, 334–335, 489–497. [Google Scholar] [CrossRef] [PubMed]
- Mörtberg, U.; Wallentinus, H.G. Red-listed forest bird species in an urban environment—Assessment of green space corridors. Landsc. Urban Plan. 2000, 50, 215–226. [Google Scholar] [CrossRef]
- Hillsdon, M.; Panter, J.; Foster, C.; Jones, A. The relationship between access and quality of urban green space with population physical activity. Public Health 2006, 120, 1127–1132. [Google Scholar] [CrossRef] [PubMed]
- Jiang, B.; Larsen, L.; Deal, B.; Sullivan, W.C. A dose-response curve describing the relationship between tree cover density and landscape preference. Landsc. Urban Plan. 2015, 139, 16–25. [Google Scholar] [CrossRef]
- Nilsson, M.E.; Berglund, B. Soundscape quality in suburban green areas and city parks. Acta Acust. United Acust. 2006, 92, 903–911. [Google Scholar]
- Liu, J.; Kang, J.; Behm, H.; Luo, T. Landscape and Urban Planning Effects of landscape on soundscape perception: Soundwalks in city parks. Landsc. Urban Plan. 2014, 123, 30–40. [Google Scholar] [CrossRef] [Green Version]
- Liu, J.; Kang, J. Soundscape design in city parks: Exploring the relationships between soundscape composition parameters and physical and psychoacoustic parameters. J. Environ. Eng. Landsc. Manag. 2015, 23, 102–112. [Google Scholar] [CrossRef] [Green Version]
- Lionello, M.; Aletta, F.; Kang, J. A systematic review of prediction models for the experience of urban soundscapes. Appl. Acoust. 2020, 170, 107479. [Google Scholar] [CrossRef]
- Hong, J.Y.; Jeon, J.Y. Influence of urban contexts on soundscape perceptions: A structural equation modeling approach. Landsc. Urban Plan. 2015, 141, 78–87. [Google Scholar] [CrossRef]
- Yang, W.; Kang, J. Acoustic comfort evaluation in urban open public spaces. Appl. Acoust. 2005, 66, 211–229. [Google Scholar] [CrossRef]
- Botteldooren, D.; De Coensel, B.; De Muer, T. The temporal structure of urban soundscapes. J. Sound Vib. 2006, 292, 105–123. [Google Scholar] [CrossRef] [Green Version]
- Kogan, P.; Gale, T.; Arenas, J.P.; Arias, C. Development and application of practical criteria for the recognition of potential Health Restoration Soundscapes (HeReS) in urban greenspaces. Sci. Total Environ. 2021, 793, 148541. [Google Scholar] [CrossRef] [PubMed]
- Szeremeta, B.; Zannin, P.H.T. Analysis and evaluation of soundscapes in public parks through interviews and measurement of noise. Sci. Total Environ. 2009, 407, 6143–6149. [Google Scholar] [CrossRef] [PubMed]
- Margaritis, E.; Kang, J.; Filipan, K.; Botteldooren, D. The influence of vegetation and surrounding traffic noise parameters on the sound environment of urban parks. Appl. Geogr. 2018, 94, 199–212. [Google Scholar] [CrossRef] [Green Version]
- Brambilla, G.; Gallo, V.; Zambon, G. The Soundscape Quality in Some Urban Parks in Milan, Italy. Int. J. Environ. Res. Public Health 2013, 10, 2348–2369. [Google Scholar] [CrossRef] [PubMed] [Green Version]
- Liu, J.; Wang, Y.; Zimmer, C.; Kang, J.; Yu, T. Factors associated with soundscape experiences in urban green spaces: A case study in Rostock, Germany. Urban For. Urban Green. 2019, 37, 135–146. [Google Scholar] [CrossRef]
- Benfield, J.A.; Bell, P.A.; Troup, L.J.; Soderstrom, N.C. Aesthetic and affective effects of vocal and traffic noise on natural landscape assessment. J. Environ. Psychol. 2010, 30, 103–111. [Google Scholar] [CrossRef]
- Evensen, K.H.; Raanaas, R.K.; Fyhri, A. Soundscape and perceived suitability for recreation in an urban designated quiet zone. Urban For. Urban Green. 2016, 20, 243–248. [Google Scholar] [CrossRef]
- Watts, G.; Miah, A.; Pheasant, R. Tranquillity and soundscapes in urban green spaces- predicted and actual assessments from a questionnaire survey. Environ. Plan. B Plan. Des. 2013, 40, 170–181. [Google Scholar] [CrossRef]
- Jarosińska, D.; Héroux, M.È.; Wilkhu, P.; Creswick, J.; Verbeek, J.; Wothge, J.; Paunović, E. Development of the WHO environmental noise guidelines for the european region: An introduction. Int. J. Environ. Res. Public Health 2018, 15, 813. [Google Scholar] [CrossRef] [Green Version]
- Muzet, A. Environmental noise, sleep and health. Sleep Med. Rev. 2007, 11, 135–142. [Google Scholar] [CrossRef] [PubMed]
- Ndrepepa, A.; Twardella, D. Relationship between noise annoyance from road traffic noise and cardiovascular diseases: A meta-analysis. Noise Health 2011, 13, 251. [Google Scholar] [PubMed]
- Bhatia, P.; Muhar, I. Noise sensitivity and mental efficiency. Psychol. Int. J. Psychol. Orient 1988, 31, 163–169. [Google Scholar]
- Vera, M.N.; Vila, J.; Godoy, J.F. Physiological and subjective effects of traffic noise: The role of negative self-statements. Int. J. Psychophysiol. 1992, 12, 267–279. [Google Scholar] [CrossRef]
- Clark, C.R.; Turpin, G.; Jenkins, L.M.; Tarnopolsky, A. Sensitivity to noise on a community sample: II. Measurement of psychophysiological indices. Psychol. Med. 1985, 15, 255–263. [Google Scholar] [CrossRef]
- Raggam, R.B.; Cik, M.; Höldrich, R.R.; Fallast, K.; Gallasch, E.; Fend, M.; Lackner, A.; Marth, E. Personal noise ranking of road traffic: Subjective estimation versus physiological parameters under laboratory conditions. Int. J. Hyg. Environ. Health 2007, 210, 97–105. [Google Scholar] [CrossRef]
- Basner, M.; Samel, A.; Elmenhorst, E.M.; Maab, H.; Müller, U.; Quehl, J.; Vejvoda, M. Single and combined effects of air, road and rail traffic noise on sleep. In Proceedings of the 35th International Congress and Exposition on Noise Control Engineering (INTER-NOISE 2006), Honolulu, HI, USA, 3–6 December 2006; Volume 7, pp. 4629–4637. [Google Scholar]
- Lee, P.J.; Park, S.H.; Jeong, J.H.; Choung, T.; Kim, K.Y. Association between transportation noise and blood pressure in adults living in multi-storey residential buildings. Environ. Int. 2019, 132, 105101. [Google Scholar] [CrossRef] [PubMed]
- Li, Z.; Kang, J.; Ba, M. Influence of distance from traffic sounds on physiological indicators and subjective evaluation. Transp. Res. Part D Transp. Environ. 2020, 87, 102538. [Google Scholar] [CrossRef]
- Erfanian, M.; Mitchell, A.J.; Kang, J.; Aletta, F. The psychophysiological implications of soundscape: A systematic review of empirical literature and a research agenda. Int. J. Environ. Res. Public Health 2019, 16, 3533. [Google Scholar] [CrossRef] [Green Version]
- Hume, K.; Ahtamad, M. Physiological responses to and subjective estimates of soundscape elements. Appl. Acoust. 2013, 74, 275–281. [Google Scholar] [CrossRef]
- Irwin, A.; Hall, D.A.; Peters, A.; Plack, C.J. Listening to urban soundscapes: Physiological validity of perceptual dimensions. Psychophysiology 2011, 48, 258–268. [Google Scholar] [CrossRef]
- Alvarsson, J.J.; Wiens, S.; Nilsson, M.E. Stress recovery during exposure to nature sound and environmental noise. Int. J. Environ. Res. Public Health 2010, 7, 1036–1046. [Google Scholar] [CrossRef]
- Suko, Y.; Saito, K.; Takayama, N.; Sakuma, T.; Warisawa, S. Effect of faint road traffic noise mixed in birdsong on the perceived restorativeness and listeners’ physiological response: An exploratory study. Int. J. Environ. Res. Public Health 2019, 16, 4985. [Google Scholar] [CrossRef] [PubMed] [Green Version]
- Li, Z.; Ba, M.; Kang, J. Physiological indicators and subjective restorativeness with audio-visual interactions in urban soundscapes. Sustain. Cities Soc. 2021, 75, 103360. [Google Scholar] [CrossRef]
- Annerstedt, M.; Jönsson, P.; Wallergård, M.; Johansson, G.; Karlson, B.; Grahn, P.; Hansen, Å.M.; Währborg, P. Inducing physiological stress recovery with sounds of nature in a virtual reality forest—Results from a pilot study. Physiol. Behav. 2013, 118, 240–250. [Google Scholar] [CrossRef]
- Shu, S.; Ma, H. Restorative effects of urban park soundscapes on children’s psychophysiological stress. Appl. Acoust. 2020, 164, 107293. [Google Scholar] [CrossRef]
- Li, H.; Xie, H.; Woodward, G. Soundscape components, perceptions, and EEG reactions in typical mountainous urban parks. Urban For. Urban Green. 2021, 64, 127269. [Google Scholar] [CrossRef]
- Hygge, S. Classroom experiments on the effects of different noise sources and sound levels on long-term recall and recognition in children. Appl. Cogn. Psychol. 2003, 17, 895–914. [Google Scholar] [CrossRef]
- Brown, A.L.; van Kamp, I. WHO environmental noise guidelines for the European region: A systematic review of transport noise interventions and their impacts on health. Int. J. Environ. Res. Public Health 2017, 14, 873. [Google Scholar] [CrossRef] [PubMed] [Green Version]
- Yano, T.; Sato, T.; Björkman, M.; Rylander, R. Comparison of community response to road traffic noise in Japan and Sweden—Part II: Path analysis. J. Sound Vib. 2002, 250, 169–174. [Google Scholar] [CrossRef]
- Tetsuya, H.; Yano, T.; Murakami, Y. Annoyance due to railway noise before and after the opening of the Kyushu Shinkansen Line. Appl. Acoust. 2017, 115, 173–180. [Google Scholar] [CrossRef]
- Kuwano, S.; Namba, S.; Okamoto, T. Psychological evaluation of sound environment in a compartment of a high-speed train. J. Sound Vib. 2004, 277, 491–500. [Google Scholar] [CrossRef]
- Trollé, A.; Marquis-Favre, C.; Klein, A. Short-term annoyance due to tramway noise: Determination of an acoustical indicator of annoyance via multilevel regression analysis. Acta Acust. United Acust. 2014, 100, 34–45. [Google Scholar] [CrossRef]
- Lee, Y.; Nelson, E.C.; Flynn, M.J.; Jackman, J.S. Exploring soundscaping options for the cognitive environment in an open-plan office. Build. Acoust. 2020, 27, 185–202. [Google Scholar] [CrossRef]
- Park, S.H.; Lee, P.J.; Jeong, J.H. Effects of noise sensitivity on psychophysiological responses to building noise. Build. Environ. 2018, 136, 302–311. [Google Scholar] [CrossRef]
- Brink, M.; Schreckenberg, D.; Vienneau, D.; Cajochen, C.; Wunderli, J.M.; Probst-Hensch, N.; Röösli, M. Effects of scale, question location, order of response alternatives, and season on self-reported noise annoyance using icben scales: A field experiment. Int. J. Environ. Res. Public Health 2016, 13, 1163. [Google Scholar] [CrossRef] [PubMed] [Green Version]
- McManis, M.H.; Bradley, M.M.; Berg, W.K.; Cuthbert, B.N.; Lang, P.J. Emotional reactions in children: Verbal, physiological, and behavioral responses to affective pictures. Psychophysiology 2001, 38, 222–231. [Google Scholar] [CrossRef] [PubMed]
- Bradley, M.M.; Lang, P.J. Measuring emotion: The self-assessment manikin and the semantic differential. J. Behav. Ther. Exp. Psychiatry 1994, 25, 49–59. [Google Scholar] [CrossRef]
- Schmider, E.; Ziegler, M.; Danay, E.; Beyer, L.; Bühner, M. Is It Really Robust?: Reinvestigating the robustness of ANOVA against violations of the normal distribution assumption. Methodology 2010, 6, 147–151. [Google Scholar] [CrossRef]
- Morihara, T.; Sato, T.; Yano, T. Comparison of dose-response relationships between railway and road traffic noises: The moderating effect of distance. J. Sound Vib. 2004, 277, 559–565. [Google Scholar] [CrossRef]
- Fidell, S.; Mestre, V.; Schomer, P.; Berry, B.; Gjestland, T.; Vallet, M.; Reid, T. A first-principles model for estimating the prevalence of annoyance with aircraft noise exposure. J. Acoust. Soc. Am. 2011, 130, 791–806. [Google Scholar] [CrossRef] [PubMed] [Green Version]
Figure 1.
The panoramic view of an urban green space.

Figure 2.
Site and implementation of field recording.

Figure 3.
Spectral and temporal characteristics of four traffic noises, including road traffic (R), conventional train (C), high-speed train (H), and tram (T).
Figure 3.
Spectral and temporal characteristics of four traffic noises, including road traffic (R), conventional train (C), high-speed train (H), and tram (T).

Figure 4.
Schematic diagram of the experiment process.

Figure 5.
Effect of sound type on psychological attributes. The vertical bars represent 95% confidence intervals. * represents significant differences in pair-wise comparison (LSD) at 0.05 level.
Figure 5.
Effect of sound type on psychological attributes. The vertical bars represent 95% confidence intervals. * represents significant differences in pair-wise comparison (LSD) at 0.05 level.

Figure 6.
Effect of maximum sound level on psychological responses.

Figure 7.
Effect of gender on psychological attributes. The vertical bars represent 95% confidence intervals. * represents significant differences in pair-wise comparison (LSD) at 0.05 level.
Figure 7.
Effect of gender on psychological attributes. The vertical bars represent 95% confidence intervals. * represents significant differences in pair-wise comparison (LSD) at 0.05 level.

Figure 8.
Main effect of noise type and noise level on physiological responses. * represents significant differences in LSD pairwise comparison at the 0.05 level.
Figure 8.
Main effect of noise type and noise level on physiological responses. * represents significant differences in LSD pairwise comparison at the 0.05 level.

Figure 9.
Interaction effect of sound level and sound type on EDA and HR. The vertical bars represent 95% confidence intervals. * represents significant differences in the Mann–Whitney U test at the 0.05 level.
Figure 9.
Interaction effect of sound level and sound type on EDA and HR. The vertical bars represent 95% confidence intervals. * represents significant differences in the Mann–Whitney U test at the 0.05 level.

Figure 10.
Effects of gender and exposure time on physiological responses to traffic sounds. The vertical bars represent 95% confidence intervals.
Figure 10.
Effects of gender and exposure time on physiological responses to traffic sounds. The vertical bars represent 95% confidence intervals.

Figure 11.
Relationship between psychological response (annoyance) and physiological responses in four traffic sound groups: (a) road traffic; (b) conventional train; (c) High-speed train; (d) tram. * represents significant correlation at 0.05 level.
Figure 11.
Relationship between psychological response (annoyance) and physiological responses in four traffic sound groups: (a) road traffic; (b) conventional train; (c) High-speed train; (d) tram. * represents significant correlation at 0.05 level.


Table 1.
Results of multivariate test of psychological evaluations of traffic sounds. * and ** represent significant differences at 0.05 and 0.01 levels, respectively. Sig. and are the significance coefficient and effect size factor, respectively.
Table 1.
Results of multivariate test of psychological evaluations of traffic sounds. * and ** represent significant differences at 0.05 and 0.01 levels, respectively. Sig. and are the significance coefficient and effect size factor, respectively.
| Model | Factor | Comfort | Annoyance | Arousal | Pleasantness | ||||
|---|---|---|---|---|---|---|---|---|---|
| Sig. | Sig. | Sig. | Sig. | ||||||
| Model 1: using equivalent sound level | Gender | 0.321 | 0.00 | 0.09 | 0.01 | 0.006 ** | 0.02 | 0.006 ** | 0.02 |
| Noise type | 0.002 ** | 0.04 | 0.038 * | 0.02 | 0.050 * | 0.02 | 0.047 * | 0.02 | |
| LAeq | 0.000 ** | 0.37 | 0.000 ** | 0.34 | 0.000 ** | 0.32 | 0.000 ** | 0.31 | |
| Noise type * LAeq | 0.938 | 0.01 | 0.585 | 0.01 | 0.983 | 0.00 | 0.74 | 0.01 | |
| Model 2: using peak sound level | Gender | 0.319 | 0.00 | 0.089 | 0.01 | 0.006 ** | 0.02 | 0.006 ** | 0.02 |
| Noise type | 0.579 | 0.01 | 0.118 | 0.02 | 0.562 | 0.01 | 0.296 | 0.01 | |
| LAFmax | 0.000 ** | 0.37 | 0.000 ** | 0.34 | 0.000 ** | 0.32 | 0.000 ** | 0.31 | |
| Noise type * LAFmax | 0.584 | 0.01 | 0.111 | 0.02 | 0.767 | 0.00 | 0.379 | 0.01 | |
Table 2.
MANOVA analysis of physiological responses to traffic sounds. * and ** represent significant differences at 0.05 and 0.01 level, respectively.
Table 2.
MANOVA analysis of physiological responses to traffic sounds. * and ** represent significant differences at 0.05 and 0.01 level, respectively.
| Factor | EDA | HR | ||||
|---|---|---|---|---|---|---|
| F | Sig. | F | Sig. | |||
| Gender | 92.27 | 0.000 ** | 0.041 | 18.77 | 0.000 ** | 0.009 |
| Time | 0.07 | 0.996 | 0.000 | 4.92 | 0.000 ** | 0.011 |
| Noise Type | 3.11 | 0.025 * | 0.004 | 2.02 | 0.109 | 0.003 |
| SPL | 1.56 | 0.209 | 0.001 | 3.98 | 0.019 * | 0.004 |
| Noise Type * SPL | 3.52 | 0.002 ** | 0.010 | 1.17 | 0.321 | 0.003 |
Table 3.
Correlation analysis between psychological and physiological responses. ** represent significant difference at 0.01 level.
Table 3.
Correlation analysis between psychological and physiological responses. ** represent significant difference at 0.01 level.
| Spearman | Perceptual | Physiological | |||||
|---|---|---|---|---|---|---|---|
| Comfort | Annoyance | Arousal | Pleasantness | EDA2min | HR2min | ||
| Perceptual | Comfort | 1 | |||||
| Annoyance | −0.837 ** | 1 | |||||
| Arousal | −0.858 ** | 0.863 ** | 1 | ||||
| Pleasantness | 0.866 ** | −0.853 ** | −0.939 ** | 1 | |||
| Physiological | EDA2min | 0.034 | 0.049 | 0.037 | −0.005 | 1 | |
| HR2min | 0.101 | 0.107* | 0.082 | 0.088 | −0.057 | 1 | |
Publisher’s Note: MDPI stays neutral with regard to jurisdictional claims in published maps and institutional affiliations. |
© 2022 by the authors. Licensee MDPI, Basel, Switzerland. This article is an open access article distributed under the terms and conditions of the Creative Commons Attribution (CC BY) license (https://creativecommons.org/licenses/by/4.0/).
Share and Cite
MDPI and ACS Style
Yu, B.; Bai, J.; Wen, L.; Chai, Y. Psychophysiological Impacts of Traffic Sounds in Urban Green Spaces. Forests 2022, 13, 960. https://0-doi-org.brum.beds.ac.uk/10.3390/f13060960
AMA Style
Yu B, Bai J, Wen L, Chai Y. Psychophysiological Impacts of Traffic Sounds in Urban Green Spaces. Forests. 2022; 13(6):960. https://0-doi-org.brum.beds.ac.uk/10.3390/f13060960
Chicago/Turabian StyleYu, Boya, Jie Bai, Linjie Wen, and Yuying Chai. 2022. "Psychophysiological Impacts of Traffic Sounds in Urban Green Spaces" Forests 13, no. 6: 960. https://0-doi-org.brum.beds.ac.uk/10.3390/f13060960
Note that from the first issue of 2016, this journal uses article numbers instead of page numbers. See further details here.