Article

Conifer Recruitment in Trembling Aspen (Populus Tremuloides Michx.) Stands along an East-West Gradient in the Boreal Mixedwoods of Canada

1
Centre d'Étude de la Forêt, Département des sciences biologiques, Université du Québec à Montréal, CP. 8888, succ. Centre-Ville, Montréal, QC H3C 3P8, Canada
2
NSERC/UQAT/UQAM Industrial Chair in Sustainable Forest Management, Université du Québec en Abitibi-Témiscamingue, 445 boul. de l'Université, Rouyn-Noranda, QC J9X 5E4, Canada
*
Author to whom correspondence should be addressed.
Forests 2014, 5(11), 2905-2928; https://0-doi-org.brum.beds.ac.uk/10.3390/f5112905
Submission received: 7 August 2014 / Revised: 29 October 2014 / Accepted: 3 November 2014 / Published: 24 November 2014

Abstract

:
Ongoing climate change is likely to result in shifts in successional dynamics in boreal mixedwood stands. Using data from provincial forest inventory databases, we examined the occurrence and abundance of the regeneration of various coniferous species (white spruce, black spruce and balsam fir) along an east-west Canadian gradient in aspen-dominated stands. The interpretation of the results was based on environmental conditions, including climate, natural fire regime and human impacts. We found that conifer regeneration was present in aspen stands along the entire gradient, despite differences in climatic conditions and fire regimes between the west (warmer and drier, with large recurrent fires) and east (more humid with relatively long fire cycles). However, abundance and distribution varied from one conifer species to the next. The abundance of white spruce decreased towards the eastern end of the longitudinal gradient, while balsam fir and black spruce abundance decreased towards the west. Although abundance decreased, balsam fir and black spruce regeneration was still present in western Canada. This study shows that it is difficult to interpret the effects of climate change on conifer recruitment without accounting for the superimposed effects of human activities.

1. Introduction

Trembling aspen (Populus tremuloides Michx.) is one of the few North American tree species that has a transcontinental distribution and is found over a wide range of site conditions [1]. In boreal mixedwood stands, aspen usually establishes immediately after a severe fire event. Over time, successional changes shift stand composition from aspen dominated to mixed species and, finally, to stands dominated by conifers [2,3,4,5,6]. Different trajectories of canopy species replacement are possible during stand development [7,8], depending on the on-site climatic and edaphic conditions, the disturbance regime, regeneration potential, biotic interactions and the life histories of the species that are present [3,9].
Boreal forest ecosystems are largely controlled by natural disturbance events, especially fire [10]. The fire regime, which is influenced by regional climate [11], can significantly affect the processes of species regeneration [6] and the long-term development of forest stands [12]. Forest regeneration that is present in the understory can indicate the potential successional pathway that forest stand composition could take during its evolution [13]. In the case of aspen, its composition could be maintained as pure- and hardwood-dominated stands or a transition may occur that leads to conifer-dominated stands, depending on the local environmental conditions (climate, disturbance regime and soil). Studies indicate that large and severe fires play an important role in creating stands, with little regeneration attributable to late-successional species [14,15]. Indeed, the recurrence of large and severe fires can regularly restart forest succession, favoring the establishment of shade-intolerant species, thereby limiting the establishment and development of late-successional species. These latter species require the presence of residual seed trees preserved in unburnt areas in order to successfully reinvade a burn site [3,5,14,16,17,18]; they also generally take longer to recolonize a site following fire [19].
In the boreal forest, the nature and distribution of tree regeneration that is present at a given location is the result of climatic and physiographic conditions [20] and the fire regime associated with this region [21]. Ongoing climate change is expected to lead to changes in the frequency and severity of fires [22,23,24], both at local and regional scales. This could change the current nature of the successional dynamics of boreal forest ecosystems [25] and the relative importance of different temporal patterns across regions [26]. Knowledge of the regeneration dynamics of species along a wide gradient of environmental conditions would be essential for a better understanding of vegetation response in a constantly changing environment. Furthermore, an analysis of the distribution of vegetation that is dominated by the same canopy species at different locations across a wide and continuous forest ecosystem could help resolve the potential contrasts in the understory composition between regions, by identifying the different factors that control the variation that is observed within a region [27].
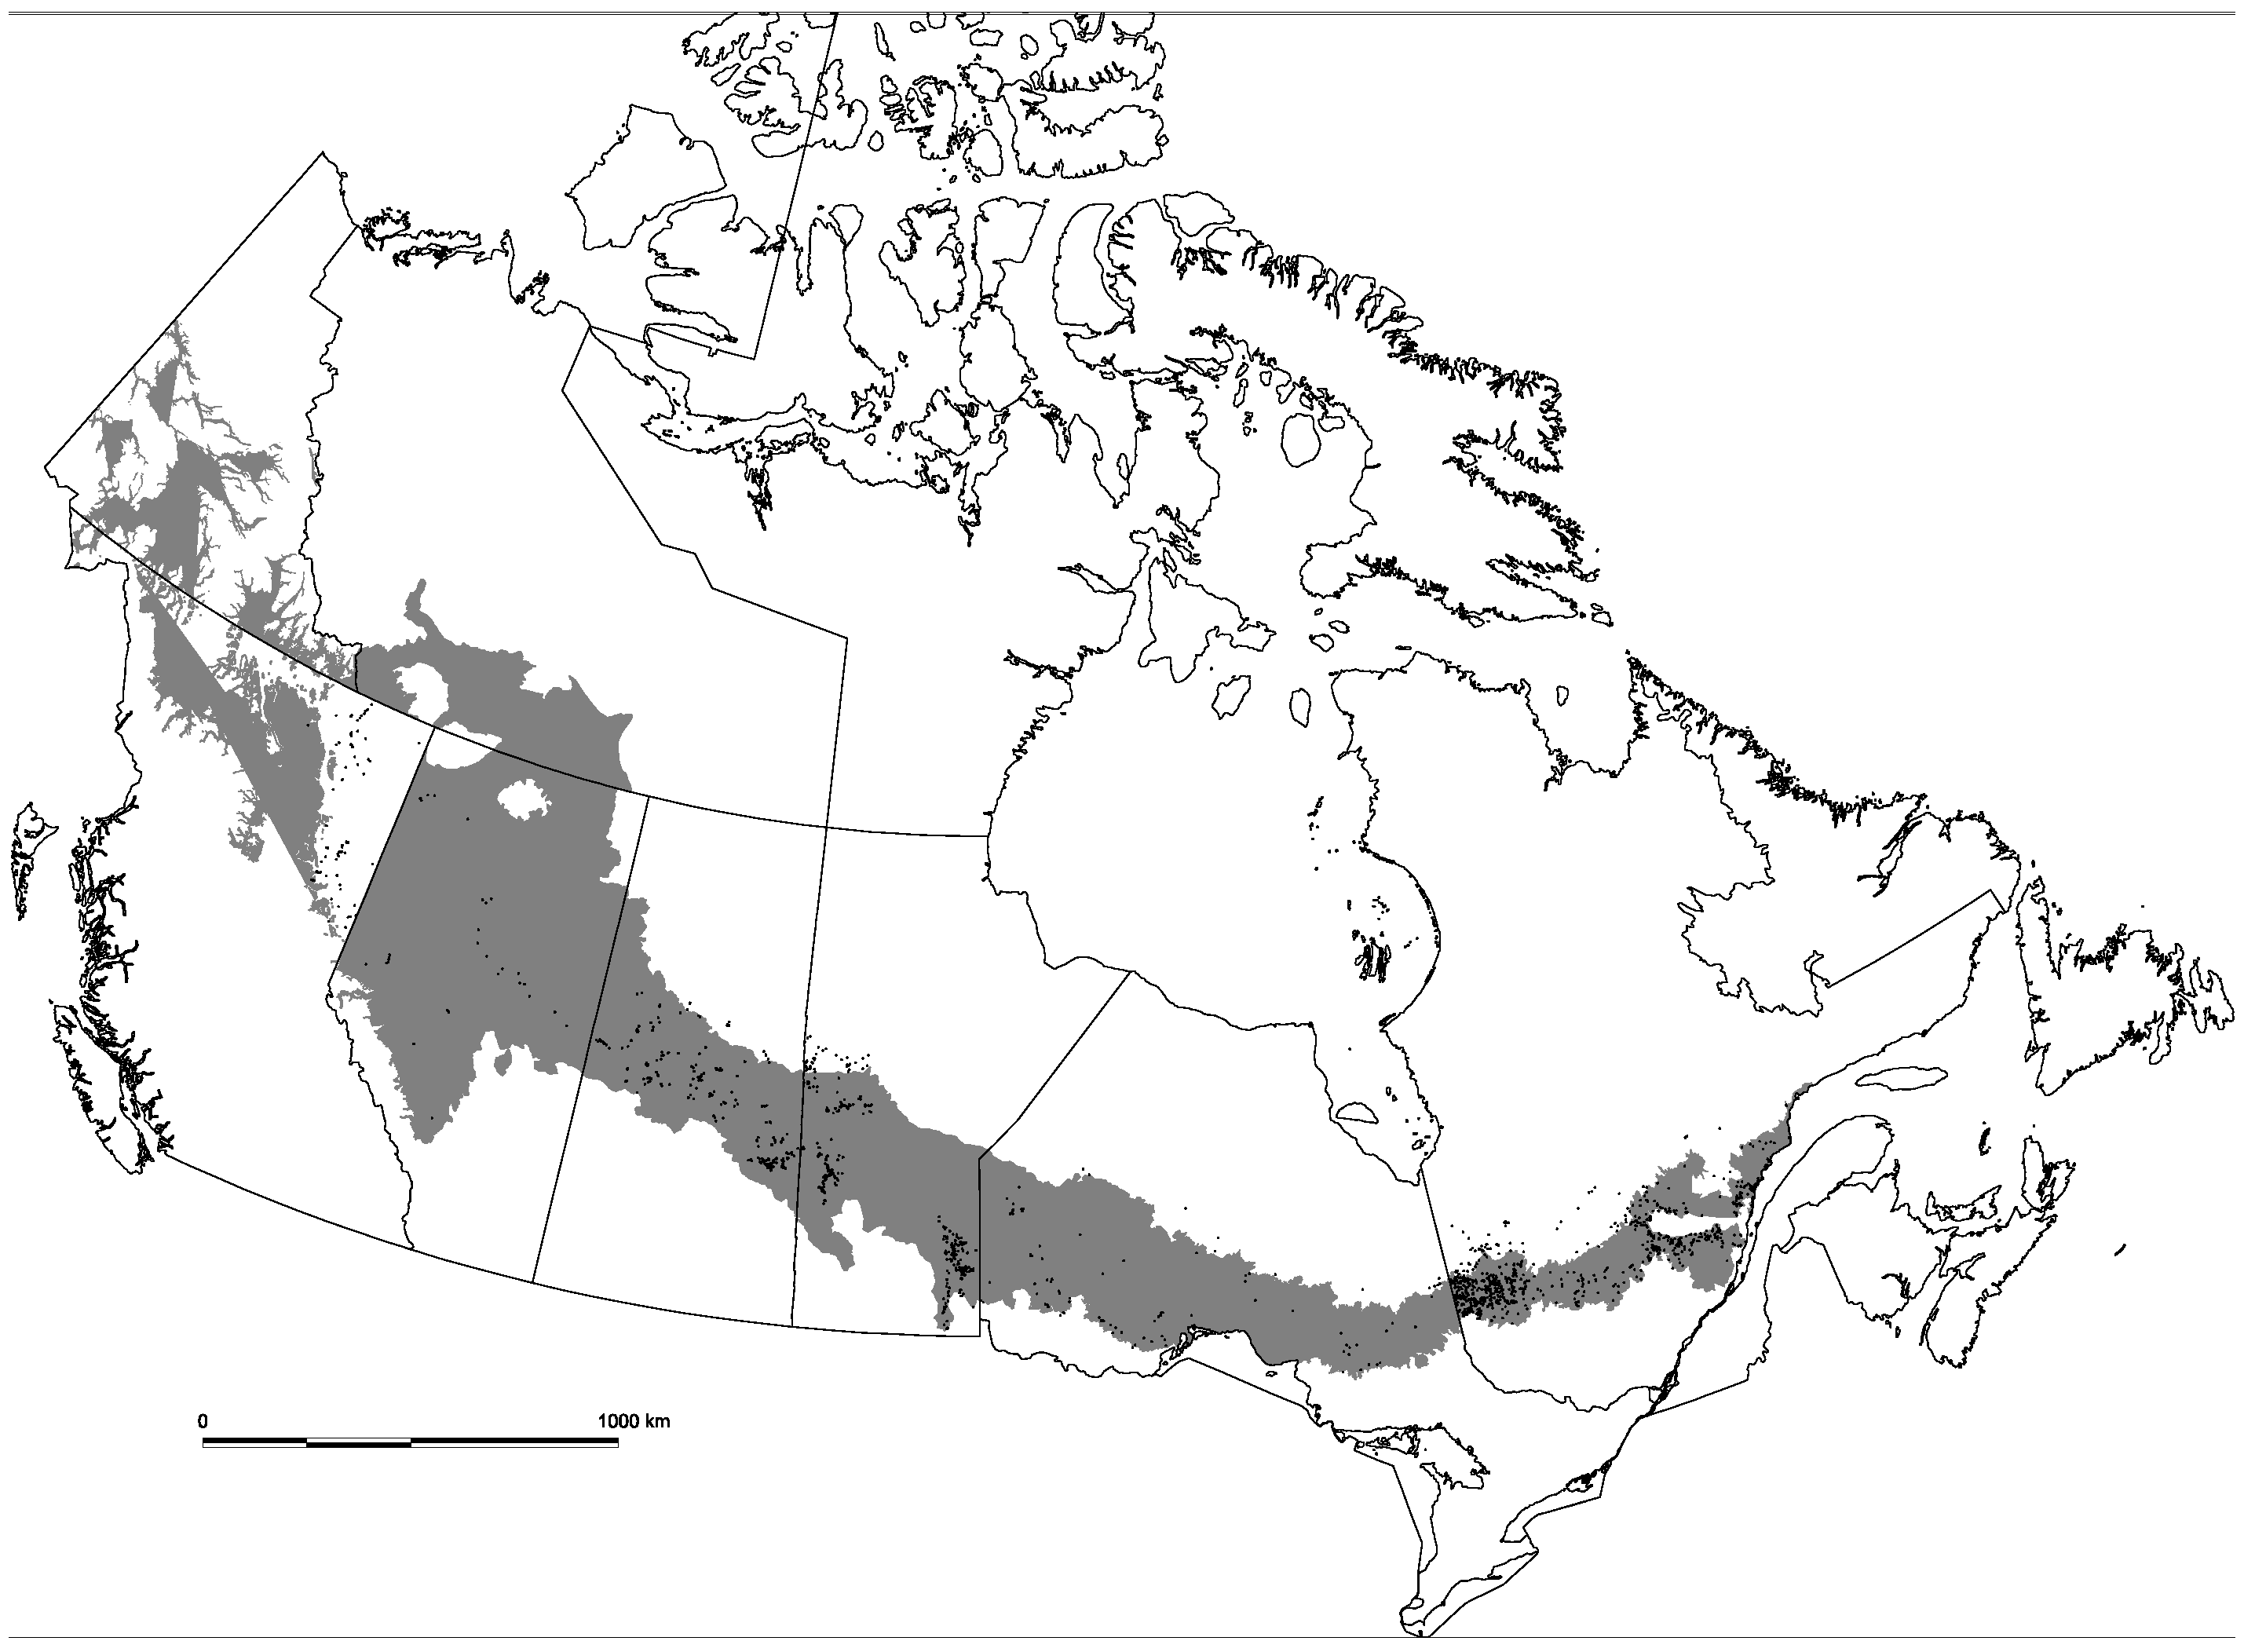
This study analyses the abundance and occurrence of recruitment of three shade-tolerant conifer species in aspen-dominated stands that are distributed along a broad gradient of climate and fire regimes across Canada. The pan-Canadian scale of this study represents a unique situation in North America. Various studies on the analysis of forest regeneration in the boreal forest are generally restricted to local or regional scales (e.g., [28,29,30,31,32]).
The abundance and occurrence of coniferous regeneration should reflect the influence of environmental factors on the distribution of coniferous regeneration within aspen stands. Three conifer species are examined: white spruce or Ws (Picea glauca (Moench) Voss); black spruce or Bs (Picea mariana (Mill.) BSP); and balsam fir or Bf (Abies balsamea (L.) Mill.). These late-successional species are commonly found in association with aspen in boreal mixedwood stands [6,14,20,33]. We only target aspen stands along the study gradient, thus controlling for the effect of forest cover. This approach allows us to observe how variability in environmental conditions affected the recruitment of shade-tolerant conifers in this stand type.
Longitudinally from east to west, the precipitation regime exhibits the most prominent change across the North American boreal forest, subsequently affecting fire regime [33]. Large regional variation in climatic factors and the risk of fire exist among and within the Canadian provinces [10,34]. The contrast in precipitation and temperature and their effects on the fire regime within eastern and western Canada are likely to have an effect on the dynamics of conifer regeneration between these two regions.
Depending upon these regional differences, we hypothesize that coniferous regeneration will be more abundant in aspen stands located in the eastern boreal forest due to higher precipitation and, by extension, the longer fire cycle that dominates this part of the transect; conversely, aspen stands in the west, which experience lower precipitation and more frequent and large fires, should exhibit lower coniferous regeneration [35,36].

2. Material and Methods

2.1. Study Area and Sample Plot Data

We limited stand selection to only those that were dominated by aspen and located in the boreal mixedwood ecological region of Canada (Figure 1). This ecosystem is influenced by a strong east-west gradient in climate, soil conditions and disturbance regimes [26].
Generally, fire frequency in the Canadian boreal forest increases from east to west [33], with variations in fire size, frequency and intensity across the country. The eastern part of Canada is characterized by a humid climate and by less frequent, smaller fires of variable severity [37,38,39]. In contrast, the western part is subject to warmer and drier air masses [40] and is characterized by relatively large, more frequent and severe fires [41]. Hart and Chen [33] argued that there is an increase in precipitation, from about 300 to 500 mm per year in the western boreal forest to about 800–1000 mm in the eastern boreal forest, resulting in an increase in the average fire return interval from 75 years in the former to 150 years or more in the latter.
Figure 1. Map of the study area, along an east-west transect in Canada. The light grey area represents the “boreal mixedwood” ecoregion of Canada (Source: [42]). Black spots represent our study sites.
Forests 05 02905 g001
Because the delineation of the boreal mixedwood forest varies according to the authors, we extend its area by including an external buffer of 100 km on each side of the boundary (represented by the dark grey area in Figure 1). Thus, aspen stands that were located within the buffers were also included in the analysis.
The study was performed using decennial forest inventory databases available in the different provinces of Canada.
Data selection was carried out in several steps: (1) we selected forest stands from provincial forest inventory datasets that were dominated by aspen, i.e., at least 75% of the basal area (m2/ha) of live and merchantable trees (dbh ≥ 9 cm) located in all permanent sample plots (PSPs) and temporary sample plots (TSPs) were aspen; in the case of PSPs, one set of decadal inventory measures (the more recent one available) was retained in the selection of forest stands; (2) selected stands had to have a density equivalent to at least 400 merchantable stems per hectare, for all species combined, so as to exclude stands that would be potentially too young; (3) of the preselected stands, we retained only those that were located within the study area using ArcGIS 9. A total of 2636 stands dominated by aspen were selected for analysis (Table 1).
Table 1. Summary of trembling aspen study stands (by Canadian province) with longitudinal and latitudinal ranges and average site characteristics.
Provinces aNo. of Stands bLongitude (W)Latitude (N)T Mean (°C) cTotal Precipitation (mm) cRelative Humidity (%) cDrought Index (mm) cFire Cycle (years) c
BC100120°04′–125°06′55°11′–59°88′0.8 (−1.3–2.9)504 (449–573)57 (53.6–60)97 (57.2–136.2)387.4 (326.8–397.9)
AB44111°01′–119°43′51°86′–58°58′1.8 (−0.7–2.8)490 (415–560)54.4 (49.2–59.8)100.4 (69.7–126.7)332.7 (93–672.9)
SK470101°75′–109°80′52°33′–55°72′0.9 (−0.3–1.4)461 (399–536)55.2 (50.8–60.4)107.7 (81–132.8)301.9 (50.9–1,225.6)
MB57495°27′–101°92′49°15′–55°36′1.5 (−1.3–3.2)532 (445–657)57.3 (52.7–62.6)95.3 (72–129.9)325.7 (56.2–1,225.6)
ON15579°85′–95°1′47°5′–52°58′1.6 (−0.4–2.7)736 (610–881)56.8 (52.5–61)51.1 (27.1–72.7)748.3 (83.9–1,440.2)
QC129366°98′–79°51′47°54′–50°36′1.4 (−0.7–3.7)931 (841–1256)55.8 (50.7–67.8)28 (10.4–64.5)1360.5 (625.7–3,706.6)
Total or ranges263666°98′–125°06′47°5′–59°88′−1.3–3.7399–125649.2–67.810.4–136.250.9–3706.6
a BC (British Columbia), AB (Alberta), SK (Saskatchewan), MB (Manitoba), ON (Ontario) and QC (Quebec); b The total number of aspen stands selected by province in Canada; c Values in parentheses are ranges.

2.2. Estimating Abundance and Occurrence of Regeneration

Analysis of coniferous regeneration refers exclusively to sapling recruitment data (i.e., 9 cm ≥ dbh ≥ 1 cm) of the three conifer species examined (Ws, Bs and Bf). Furthermore, the abundance of coniferous regeneration within a given stand is calculated as the total number of saplings of each conifer species present in the stand. As the surveyed areas included in the study differ in size among the Canadian provinces, estimates of abundance are standardized across the gradient and expressed as the number of saplings per hectare. For a given aspen stand, the abundance of coniferous regeneration was first calculated by species (Bs, Ws and Bf) and then for all three species combined (coniferous regeneration (Conif)).
Conifer occurrence was determined by the presence/absence of the three species. To circumvent bias arising from variability encountered among provinces in terms of their surveyed areas, a detection threshold for the “presence” of a coniferous species (Ws, Bs and Bf) in a stand was set at 250 individuals (saplings) per hectare. This corresponds to a minimum threshold of detectability of one sapling in 40 m2, which is the size of the smallest sampling area of saplings that was common to all provinces of the transect (i.e., one sapling in 40 m2 equals 250 saplings in 1 hectare).

2.3. Predictive Variables

Thirteen potential predictor variables (k = 13) were selected a priori to model the distribution of the abundance and occurrence of coniferous regeneration in aspen stands distributed across the pan-Canadian study area. Predictors were considered because of their known or suspected effects on the recruitment dynamics of coniferous species in the boreal forest; these are summarized in Table 2. The aridity or drought index (DI) and degree-days above 5 °C (DD) were used to characterize the climatic conditions of selected sites. For each climatic variable, a 30-year average was generated in BioSIM 9 [43] using Environment Canada data from 1981 to 2010 [44]. While DD takes into account temperature [45], DI is a weather index that incorporates precipitation, temperature, period of sun and soil conditions, which expresses the intensity of drought [46]. Fire cycle (FC) data was considered in the modelling exercise as a natural disturbance event characterizing the fire regime. FC data was extracted from a map that defines areas with a homogeneous fire regime [34]. We did not consider insect outbreaks as potential explanatory variables, as the work of compiling and harmonizing insect outbreak data on a pan-Canadian scale was still ongoing at the time of our study.
Like stand-replacing fires, human activities naturally promote the establishment of shade-intolerant deciduous stands [47]. Distance to the nearest main road (DistRoad) and agricultural area (DistAgri), as well as total road length per square kilometer within a radius of 15 and 25 km around the stand (DensRoad15Km and DensRoad25Km) was estimated and considered as proxies to control for the human effect on the natural environment. Anthropogenic disturbances change the landscape dynamics, acting at different scales of natural disturbances [47] particularly through fire occurrence (increased ignition sources). We know that changes in fire regimes as an interaction with forest harvesting have a direct impact on the composition and structure of forests [5,25].
Table 2. Types and description of predictive variables used in the models.
Variable (Abbreviation)TypeDescriptionData Source
Climatic
Drought index (DI)Continuous (Class)Annual mean aridity (1981–2010) (mm)Environment Canada
Degree-days (DD)Continuous (Class)Annual mean degree-day over 5 °C (1981–2010) (°C day)Environment Canada
Fire regime
Fire cycle (FC)Continuous (Class)Year interval from cyclic return fire (years)Boulanger et al., 2012
Physical environment
Distance to the nearest great river, lake or bay (DistWater) ++Continuous (Class)Distance to the nearest significant watercourse (km)Natural resources of Canada, GeoBase
Hydrography (PctHydro)Continuous (Class)Percentage of area occupied by water in a radius of 20 km around the stand (%)Natural resources of Canada, GeoBase
Physiographic regions (RegiPhysio)CharacterThree major regions of the physical geography of the Canadian landscape: Canadian Shield, Interior Plains and western CordilleraAtlas of Canada
Anthropogenic
Distance to the nearest main road (DistRoad)Continuous (Class)Distance to the nearest carriage road (km)Natural resources of Canada, GeoBase
Distance to agricultural area (DistAgri)Continuous (Class)Distance to the nearest farmland (km)Natural resources of Canada, GeoBase
Road density (DensRoad)Continuous (Class)Total length of roads (km)/km2 area, in a radius of 15 and 25 km around the standNatural resources of Canada, GeoBase
Spatial
Longitude (Long)ContinuousGeographic coordinatesDatabase forest inventory
Latitude (Lat)ContinuousGeographic coordinatesDatabase forest inventory
Elevation (Elev)ContinuousGeographic coordinatesDatabase forest inventory
++ The size of the watercourse considered in the analysis ranged from 5 to 35,000 km2 (an average of about 340 km2).
Distance to the nearest major river, lake or bay (DistWater) and the percentage of hydrography (PctHydro) within a radius of 15 km, as well as physiographic regions of Canada (RegiPhysio) were added as variables describing the physical environment of the stands. Abundant hydrography can affect local climatic conditions of surrounding areas, while a major river can act as a natural barrier against forest fires (firestop).
Climatic factors change with increasing latitude and longitude in the boreal forests of North America [33]; therefore, spatial variables, such as longitude (Long), latitude (Lat) and elevation (Elev), were included in the analysis as indirect factors that should be expressed by measured climatic variables. Data on anthropogenic variables and those describing the physical environment were mainly sourced from the GeoBase of Natural Resources Canada (http://www.geogratis.ca/goegratis/DownloadDirectory?lang=fr).

2.4. Data Analysis and Model Selection

A descriptive analysis of the abundance and frequency of occurrence for each coniferous species was carried out to illustrate their relative distribution along the longitudinal gradient. Plots were grouped by longitude in order to determine the average abundance for each longitude, while the frequencies of occurrence were estimated across a province. We then applied a linear regression (linear trend-line) on abundance data to observe trends in the distribution of coniferous species across the gradient. A similar descriptive analysis was performed on the continuous predictive variables to illustrate the variability of their distribution along the longitudinal gradient.
Multiple regression models were developed to predict the abundance of conifer regeneration using R freeware [48]. In the case of occurrence, the model was calibrated using binary logistic regression. Model selection was conducted stepwise: we began by first verifying which variable was most significantly (p < 0.05) related to the response variable using univariate regression models. From the most significant variable identified, we added other variables one by one to test if, combined or not, the constructed models can explain the conifer recruitments across Canada. To avoid model over-fitting, a covariate was only retained in the model if it was significant (p < 0.05) in the model; and additionally contributed significantly in improving the model, with an approach based on Akaike’s information criterion (AIC). The least probable assumptions (i.e., models that had at least one non-significant variable of interest at p < 0.05) were abandoned. The AIC has been used as a measure of the strength of evidence for each considered model in the analysis [49]. This procedure allowed preselecting a list of candidate models. Thereafter, we did a multimodel inference to compare candidate models and identify the “best” model that would best approximate reality given our dataset, calculating the delta AIC (ΔAIC) and Akaike weights (Wi), two measures that are associated with AIC [49].
The proportion of total variance that was explained by each predictor in the best predictive model was extracted, taking into account the effect of other variables. This part expresses the proportion of variability that is provided by the variable of interest in the model; determined from the calculation of log-likelihoods [50], as follows:
V a r i a n c e   o f   a   v a r i a b l e = 1 R 2
or,
R 2 = log L i k 3 log L i k 1 log L i k 2 log L i k 1
where, R2 is the (pseudo) coefficient of determination; logLik1 is the log-likelihood of the null model; logLik2 is the log-likelihood of the best model; and logLik3 is the log-likelihood of the best model, from which we removed the variable of interest.

3. Results

3.1. Abundance and Occurrence of Conifer Recruitment

We observed variation in species abundance along the longitudinal gradient (Figure 2). There was no significant east-west gradient when considering the overall abundance of coniferous regeneration (all three species combined: Conif) in the aspen forests of Quebec and Ontario (QC and ON) compared to Alberta and British Columbia (AB and BC) (Figure 2a, R2 = 0.1). By considering the species separately, linear regression indicates that Bf regeneration was more abundant in aspen forests that were located in eastern Canada and decreased towards the west (Figure 2b, R2 = 0.5). The same trend was observed for Bs regeneration (Figure 2c, R2 = 0.3), although in lower proportions relative to Bf regeneration. In contrast, the abundance of Ws regeneration was significantly higher in the western aspen forests (Figure 2d, R2 = 0.4) and decreased towards eastern aspen forests.
The density of Bf recruitment was highest in aspen forests of QC and ON, whereas Ws was significantly higher in BC and AB. Indeed, Ws dominated the coniferous regeneration that was observed in western aspen forests. Total coniferous regeneration (Conif) was lower in the central portion of the gradient, between longitudes 95° W and 110° W, which corresponds to the range of Manitoba (MB) and Saskatchewan (SK), compared to the other provinces.
With respect to overall occurrence (Conif), coniferous regeneration was present in aspen forests along the study gradient (Figure 3). The relative frequencies of occurrence did not vary significantly between aspen forests in the east (QC, 32%; ON, 19%) and those in the west (BC, 33%; AB, 21%). Like the overall density, the central part of the longitudinal gradient recorded the lowest occurrence of overall coniferous regeneration (MB, 4%; SK, 5%).
In terms of species (Figure 3), Ws and Bs regeneration were present everywhere along the east-west gradient, while Bf regeneration was only observed in aspen forests that were located from SK eastwards. There was no Bf regeneration in aspen forests that we examined in AB and BC. However, forest inventory data from BC showed the presence of subalpine fir (Abies lasiocarpa (Hooker) Nuttall) regeneration in the understory of aspen forests. In addition, the frequency of Ws occurrence decreased moving towards eastern aspen forests, while that of Bs and Bf exhibited a decreasing trend towards western aspen forests. Thus, there is consistency in the patterns between density distribution (Figure 2) and the relative frequency of occurrence (Figure 3) of the examined coniferous regeneration.
Figure 2. Density distribution of coniferous regeneration (Conif), along the east-west gradient in Canada. Bf, balsam fir; Bs, black spruce; Ws, white spruce.
Forests 05 02905 g002
Longitudinal coordinates of each stand were rounded up to the immediately above whole value (i.e., longitude = 2 × ROUNDED (true longitude/2; 0)) to simplify the presentation of results, given the large number of observations (n = 2636). Point clouds represent the averages of abundance per hectare for the three species combined (a) Conif: squares; balsam fir (b) Bf: triangles; black spruce (c) Bs: circles; and white spruce (d) Ws: diamonds. In each graph, the trend of variation in abundance along the longitudinal axis is represented by a linear regression (red line).

3.2. Variability in Environmental Conditions along the Study Gradient

Analysis of climatic data shows that total annual precipitation significantly increased towards the east (Appendix—Figure A1a, R2 = 0.84), in contrast to the drought index or aridity (Appendix—Figure A1b, R2 = 0.65), which increases in the westward direction. We also observed that fire cycle (Appendix—Figure A1c, R2 = 0.39) was generally longer in the east and shorter in the west. Aspen stands in the study area were randomly located relative to the pattern of annual average temperature across the longitudinal gradient (Appendix—Figure A1d, R2 = 0.13). The stands also were randomly distributed relative to the density of roads around the aspen stands and with the distance to agricultural areas.
However, western aspen forests were located further north in the boreal forest compared to eastern aspen forests (Figure 1). We observed a trend where, with an increase in latitude, the distance to agricultural areas also increased, whereas road density decreased.
Figure 3. Frequency of occurrence (%) of aspen stands with conifer regeneration.
Forests 05 02905 g003
Note: Frequency of occurrence is the ratio of the number of aspen stands with at least one sapling of a coniferous species over the total number of aspen stands examined in a province (in percent). In the graph above, the histograms are the frequencies for all three species combined ( Forests 05 02905 i001), white spruce ( Forests 05 02905 i002), black spruce ( Forests 05 02905 i003) and balsam fir ( Forests 05 02905 i004) respectively.

3.3. Selection of Predictive Models and Individual Effect of Variables

From the list of models that were tested (Table 3), Model 1 combined climate (DI), human disturbance (DensRoad25Km), and latitudinal gradient (Lat) and was the most significant for describing the distribution of the overall abundance of coniferous regeneration (Conif). Model 2, in comparison, had only climate (DI and DD) and human disturbance (DensRoad25Km). Model 1 represents about a 61% (Wi: 0.61) chance of being the best model, with 29% for Model 2 (Wi: 0.29). Other models had ΔAIC > 2, indicating that they are unlikely the best fit for the data. The multiple regression procedure displayed the effect of each variable that was included in the best model (Table 4). Overall, abundance increases with latitude and decreased with an increase in the drought index and human impact (road density). The t-test statistics and associated p-values indicated that each retained predictor variable significantly improved the model (all p < 0.05).
When coniferous species were separately considered, these same variables (climate, anthropogenic and latitudinal effect) explained the abundance of white spruce (Model 1, Ws) and black spruce regeneration (Model 1, Bs). In contrast, the spatial pattern in the abundance of balsam fir regeneration was mainly explained by climate (DI) (Model 1, Bf). The model that included only the drought index had an almost 100% (Wi: 0.99) probability of being the best explanatory model for Bf, with a ΔAIC of zero.
DI had a significant negative effect on the abundance of Bs and Bf regenerations. The abundance of regeneration for both coniferous species decreased with an increase in the degree of site drought. In the case of Bs, DI was not the only major explanatory factor. Road density (DensRoad25Km) had a significant negative effect on the abundance of Bs regeneration and also a positive co-variation in abundance with latitude. The abundance of Ws regeneration significantly co-varied with latitude (Lat), but there was also a significant negative effect of annual degree-day sums (DD) and road density (DensRoad25Km).
The best predictive models that were based on occurrence (Appendix—Table A1) were less parsimonious than those of abundance (Table 3). This difference resulted from the model selection approach that was used for each ecological measurement, i.e., multiple linear regression for abundance (a continuous quantitative variable) and logistic regression for occurrence (a binary variable). However, it appears that all variables in the best predictive models of abundance (Table 3) are included in those of occurrence (Appendix—Table A1) for each coniferous species. Particularly, with the best predictive model, which considered all three species (Conif), the road density (DensRoad25Km) in the abundance model was replaced by the distance to agricultural area (DistAgri) in the occurrence model.
For predictive variables that had been selected a priori (in Table 2) and that do not appear in the selected models (Table 3 and Appendix—Table A1), they either did not have a significant effect on the response variable or their effect is masked (i.e., already explained) by the variables that were already in the model. This is the case of the “fire” variable (FC), which was not selected in any of the predictive models, yet its impact on the occurrence and abundance of coniferous regeneration is quite obvious.
Table 3. Description and best models of abundance, based on Akaike’s information criterion (AIC).
ResponseCandidate ModelsModel IDLLAICΔAICWi
ConifDI + DensRoad25Km + Latmod1−22,15844,3250.00.61
DI + DensRoad25Km + DD mod2−22,15844,3271.50.29
DI + DensRoad25Kmmod3−22,16044,3293.50.11
DImod4−22,16944,34419.20.00
RegiPhysio + DensRoad25Km + FC + DistAgri mod5−22,17544,36439.10.00
FC + DensRoad25Km + Latmod6−22,18644,38156.10.00
DD + DensRoad25Km + FC + Elevmod7−22,18544,38256.40.00
DD + DensRoad25Km + FCmod8−22,19244,39368.00.00
WsDD + DensRoad25Km + Latmod1−17,92235,8550.00.88
DD + DensRoad25Km + Longmod2−17,92535,8604.50.09
DI + DistRoad + Latmod3−17,92735,8626.80.03
DD + DensRoad25Kmmod4−17,93035,86913.90.00
DD + Long + Latmod5−17,93235,87318.10.00
DI + DistRoad + Longmod6−17,93235,87519.60.00
DD + Longmod7−17,93735,88327.90.00
DI + Longmod8−17,93735,88328.00.00
BsDI + DensRoad25Km + Latmod1−19,06538,1400.00.39
DI + DensRoad25Km + Longmod2−19,06638,1410.80.26
DI + FC + DensRoad25Kmmod3−19,06638,1411.10.23
DI + DensRoad25Kmmod4−19,06738,1422.30.12
DImod5−19,08138,16928.40.00
DD + FC + DensRoad25Km + Elevmod6−19,08138,17433.60.00
DD + FC + DensRoad25Kmmod7−19,08438,17837.80.00
FC + DensRoad25Kmmod8−19,08738,18140.70.00
BfDImod1−21,87443,7540.00.99
RegiPhysio + FC + DistWater mod2−21,88043,77319.00.00
FC + DD + RegiPhysiomod3−21,88143,77419.80.00
FC + RegiPhysio mod4−21,88443,77824.10.00
FC + DistWater mod5−21,89843,80551.00.00
FC + DDmod6−21,89943,80752.70.00
FCmod7−21,90143,80854.30.00
Note: LL is the log-likelihood value of the model; AIC is the Akaike information criterion value; ΔAIC is the delta AIC, a measure of each model relative to the best model; and wi is the Akaike weights, representing the ratio of the ΔAIC of a given model relative to the whole set of R candidate models; Conif, Ws, Bs and Bf refer to the conifer recruitment into aspen stands across Canada, respectively, for all three conifer species combined, white spruce, black spruce and balsam fir; models are ranked based on their AIC scores, where the smallest AIC represents the best model (in bold).
Table 4. Summary of the multiple regression (variables significant at p < 0.05).
ResponseParametersEstimateLower 95% CIUpper 95% CISEt-ValuePr (>|t|)
ConifDI−131.8−165.3−98.317.1−7.720.00
DensRoad25Km−123.4−187.4−59.432.6−3.780.00
Lat33.45.461.414.32.340.02
WsDD−24.9−35.5−14.25.4−4.570.00
DensRoad25Km−31.5−44.4−18.76.6−4.800.00
Lat6.33.29.51.63.990.00
BsDI−29.9−40.3−19.65.3−5.660.00
DensRoad25Km−49.6−69.4−29.810.1−4.910.00
Lat9.20.517.84.42.080.03
BfDI−77.2−93.7−60.78.4−9.190.00
Note: Based on the t-test, the table shows the significance for each variable included in the best model individually (Table 3); SE, standard error; CI, confidence interval.

3.4. Variance Explained by Each Predictor Variable in the Best Model

In Table 5, the overall abundance model (Conif) indicates that DI explains almost 46% of the variability in the spatial pattern of the abundance distribution of coniferous regeneration. Road density (DensRoad25Km) contributes 11% of the total explained variance, while latitude (Lat) contributes 4%. Our results, therefore, suggest that the effect of climate is far more important than anthropogenic disturbance effects and spatial effects.
By species, the abundance of Bf regeneration was mostly explained by climate (DI), the single variable that was included in the best model. In contrast, Bs regeneration abundance was explained by climate (DI, 40%) and anthropogenic disturbance effects (DensRoad25Km, 29%), together with spatial effects (Lat, 3%). In the Ws model, anthropogenic disturbance (DensRoad25Km, 29%) explained almost as much of the total variance as did climate (DD, 27%) and spatial effects (Lat, 20%). There is a consistency between the abundance and occurrence.
Table 5. Variance proportion of predictive variables for the abundance.
ModelPredictorsVariance (%)
ConifDI45.8
DensRoad25Km11.1
Lat4.3
WsDensRoad25Km29.4
DD26.6
Lat20.3
BsDI39.8
DensRoad25Km29.3
Lat3.1
BfDI
No data; DI is the only variable in the Bf model for the abundance.

4. Discussion

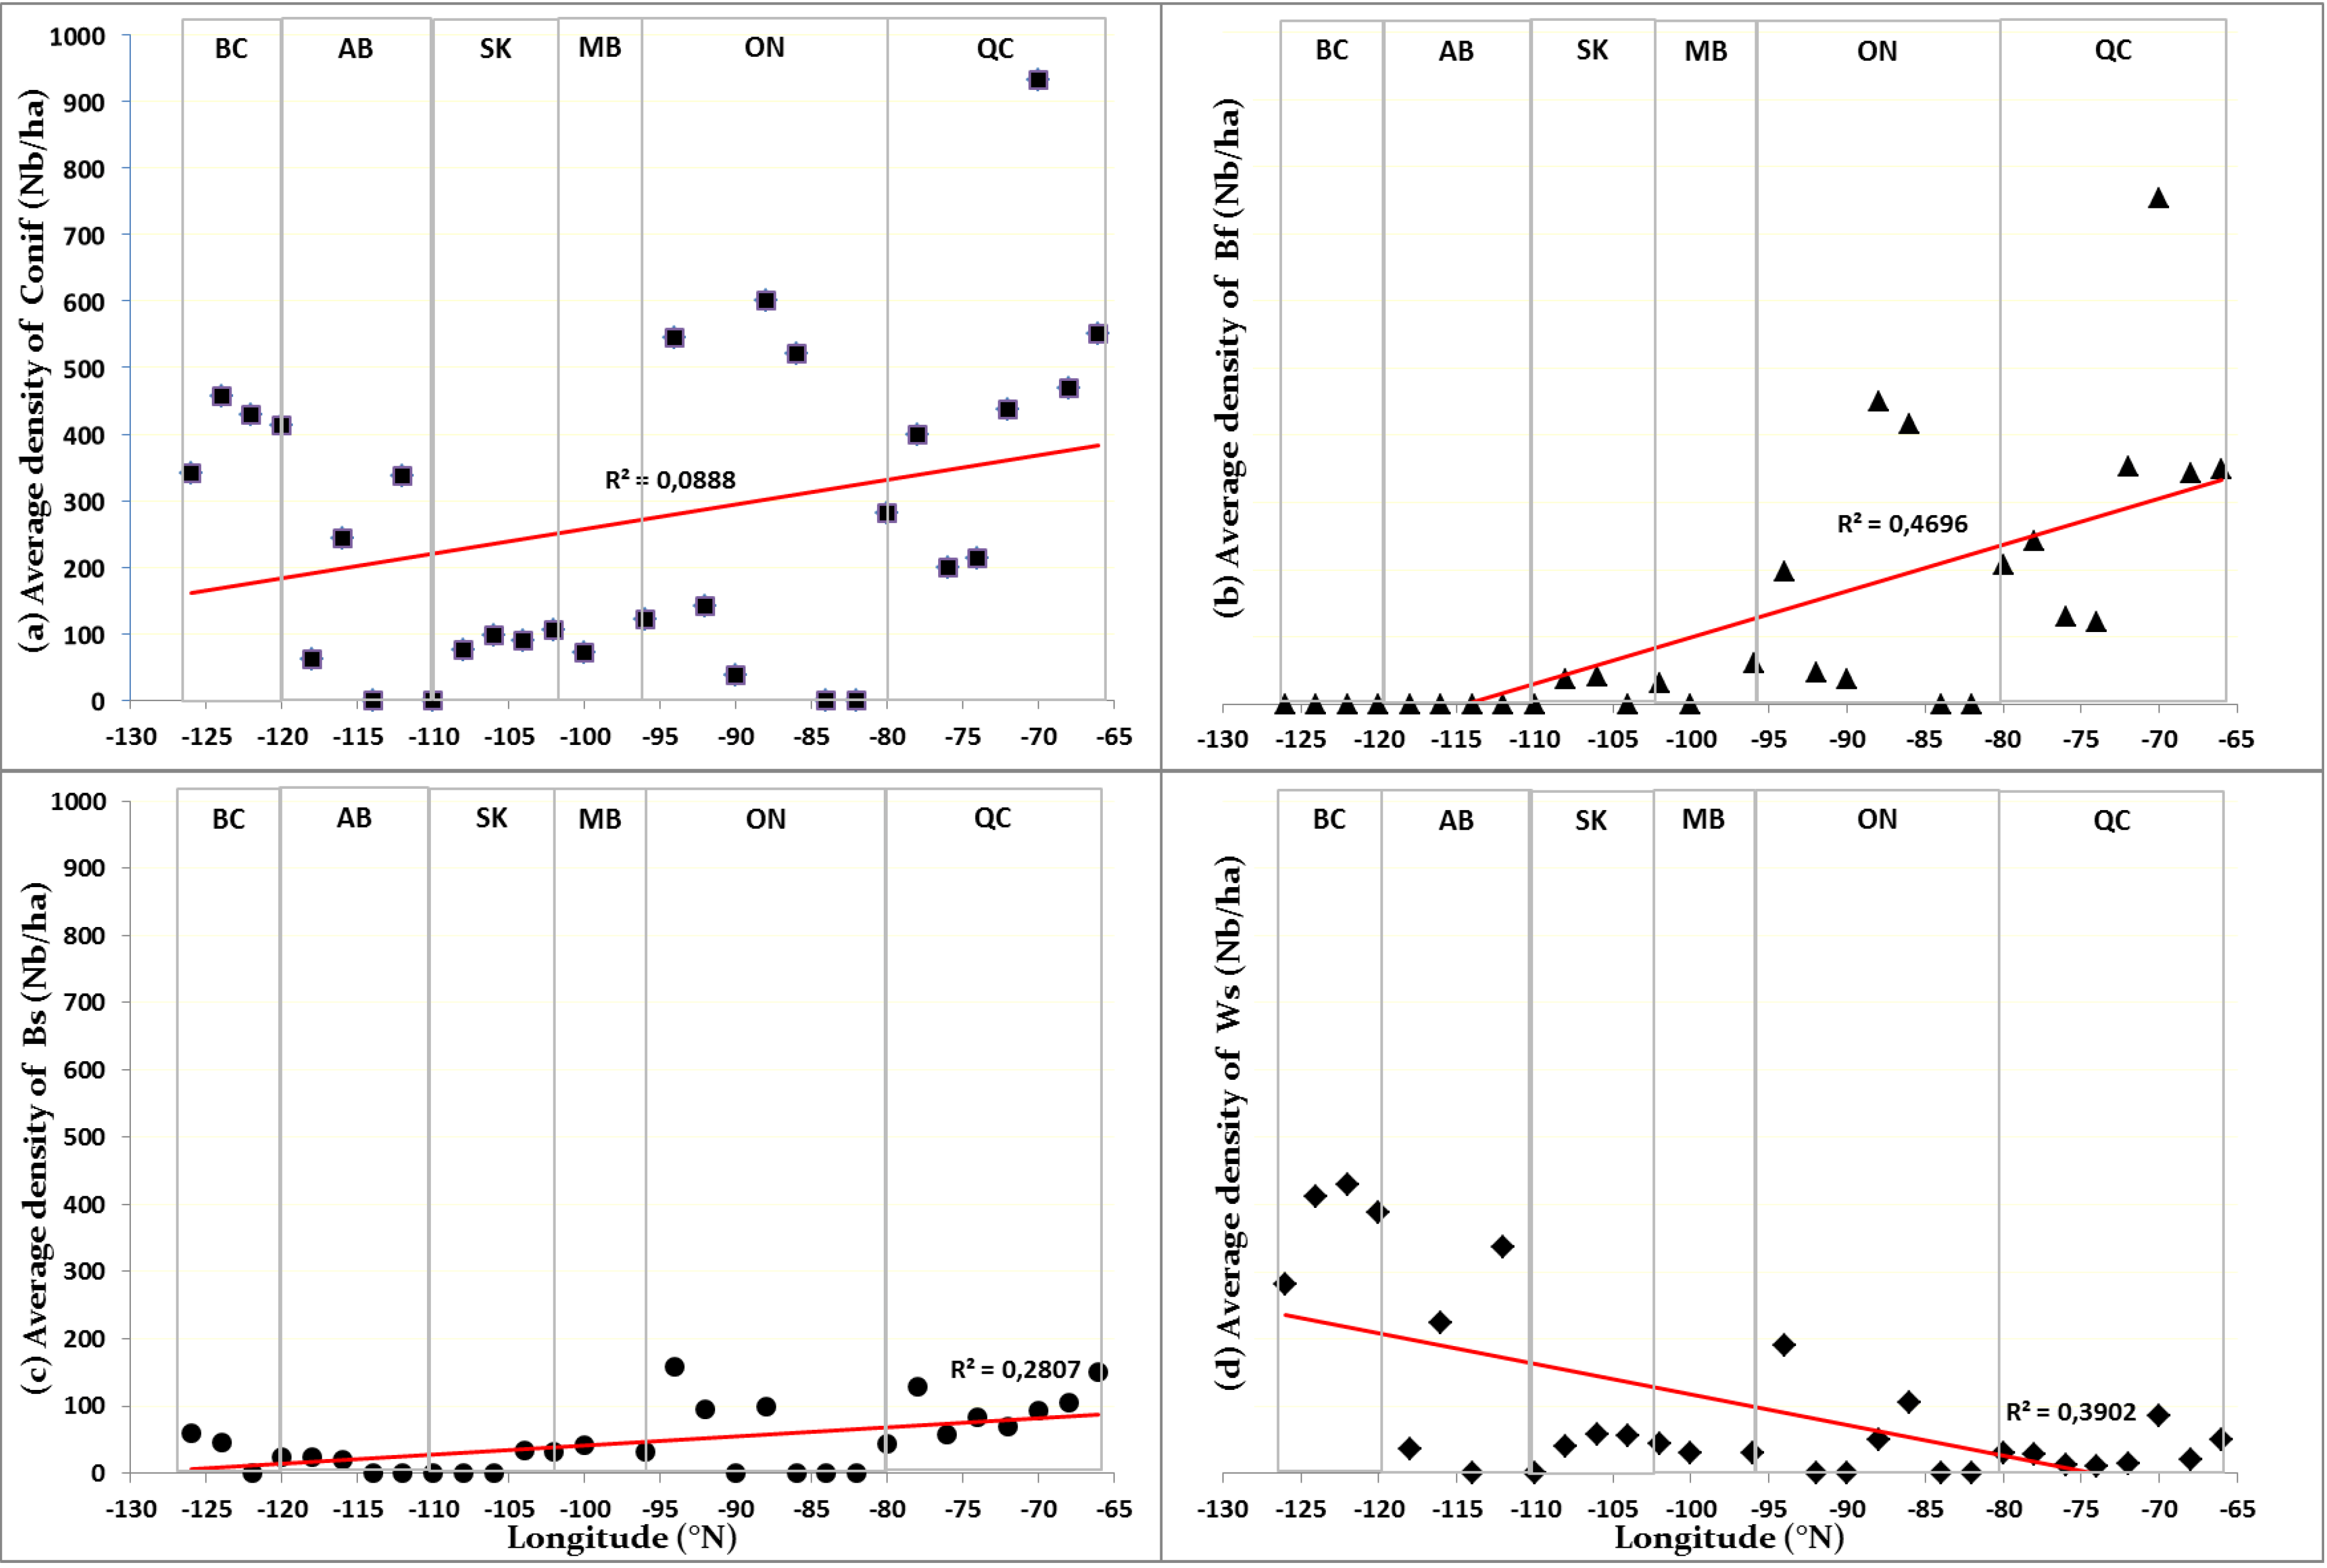
Overall, there were no significant differences in the abundance of conifer recruitment (Figure 2a) and the proportion of aspen forests having coniferous recruitment (
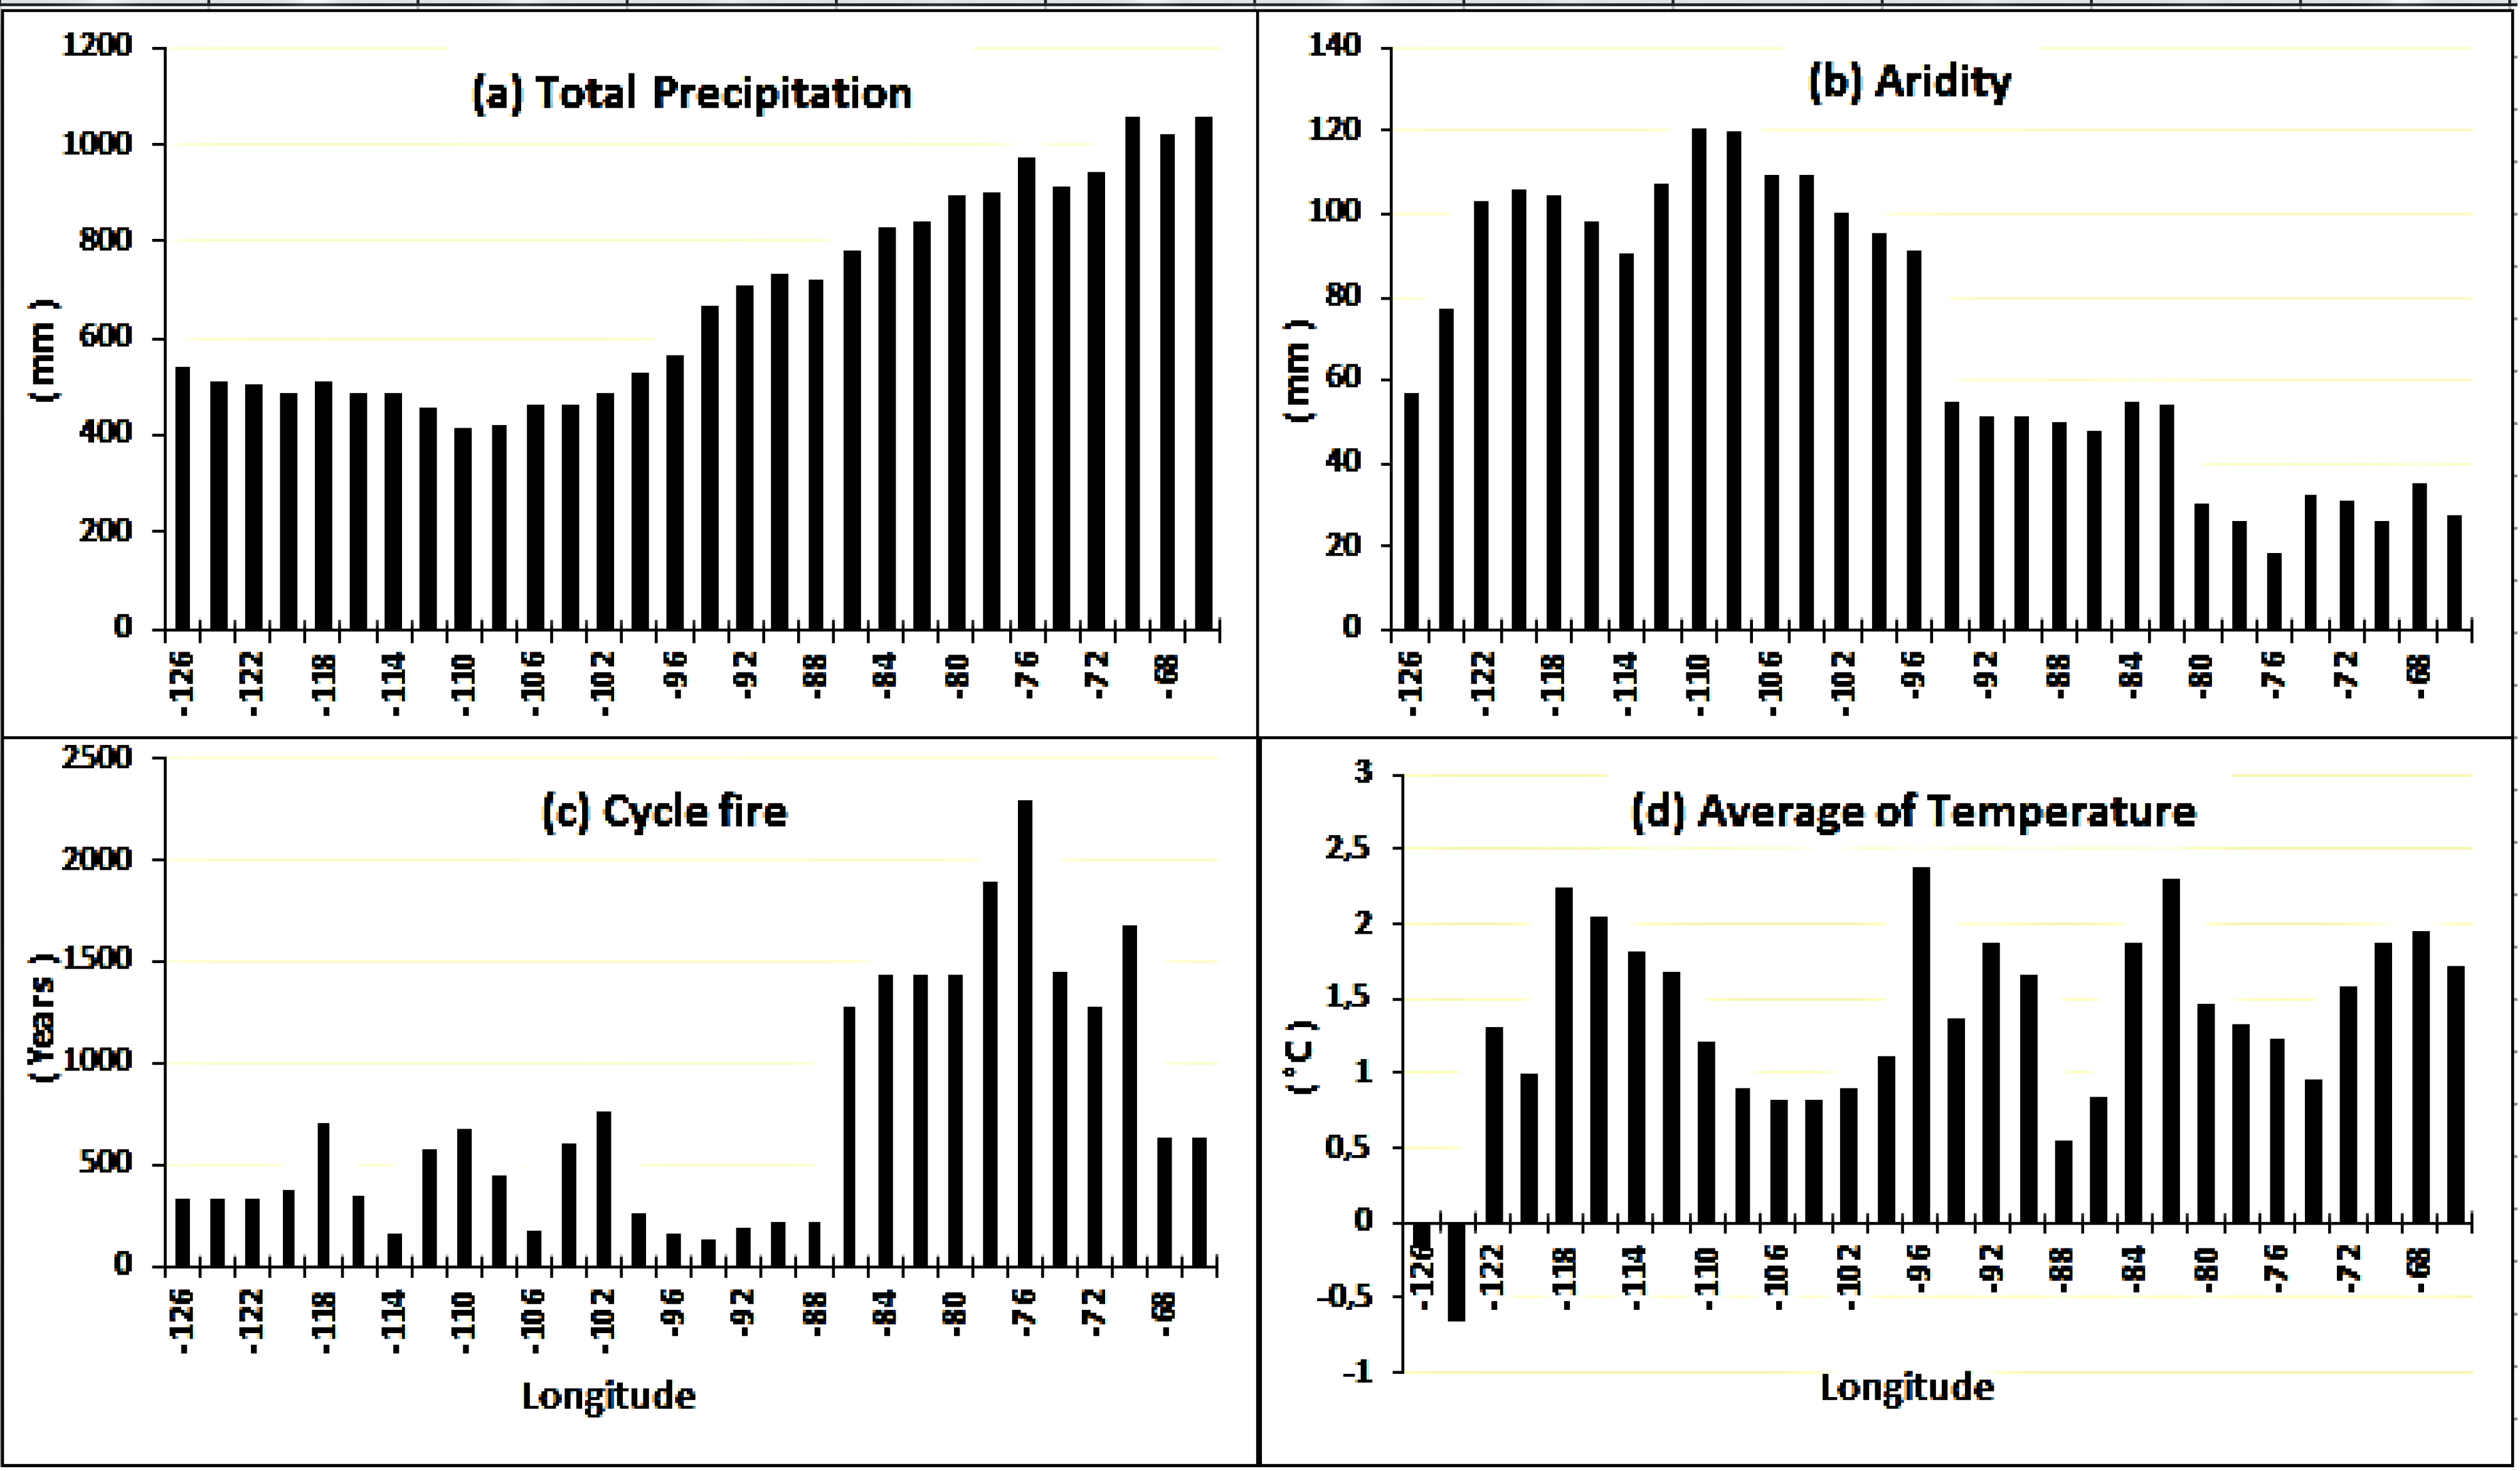
Figure 3) between the eastern and western extremes of the gradient, despite having contrasting fire regimes and climate. The higher total annual precipitation (Appendix – Figure A1a) and the longer fire cycle (Appendix – Figure A1c) in the east should, in principle, promote the aging of forests and an increase in shade-tolerant conifers [51]. Yet, only about a third of aspen stands examined (32%) in QC contained conifer regeneration. This low proportion could be attributed to the intensification of forest management activities that have been undertaken in recent decades. Indeed, logging activity has increased in the southern boreal forest to the extent that it has become a major stand-replacing disturbance [6]. In contrast, conifer recruitment was particularly low in the central part of the gradient (corresponding to MB and SK provinces) probably due to low annual precipitation (Appendix – Figure A1a) and the aridity being higher (Appendix – Figure A1b) in the region. Indeed, this portion of the gradient is usually characterized by a dry continental climate and a relatively short fire cycle (Appendix – Figure A1c). Conifer recruitment is thus affected both by severe drought conditions that reduce the growth and survival of conifer seedlings and by the recurrence of severe fires, which leads to frequent rejuvenation of forest stands and promotes the establishment of pioneer species at the expense of late-successional species [26]. Fire affects both propagule availability and substrate suitability for regeneration, which, in turn, impact regeneration and subsequent stand dynamics [15,18]. Mostly in the north, fire severity strongly affects the availability of regeneration microsites and, thus, has an important controlling influence on the density of initial conifer regeneration [15,26]. Whereas in the south, the pervasive presence of bluejoint grass, Calamagrostis canadensis (Michx.), in the aspen understory could be an additional limiting factor for coniferous regeneration, because of its adverse effects (competition) on the growth and survival of conifer seedlings [52].
The differences in conifer recruitment across Canada were most significant in terms of individual species. Among the major factors that guarantee the presence of a species in a forest landscape are favorable climatic conditions for its reproduction and growth, seed availability, the presence of suitable sites for its establishment and resilience to disturbances [53].
The abundance of Bf regeneration in the eastern portion of the gradient would be associated with a usually long return interval between fires and the maritime climate that characterizes this part of the Canadian boreal forest [11]. Conversely in aspen forests of western Canada, the recruitment of Bf would be limited because of the dry climate for germination and the fire size for seed dispersal. This species is more sensitive to drought than Ws [54] and possesses large seeds compared to other conifer species, thereby limiting its potential for long-distance seed dispersal [19]. Bf regenerates primarily by seed; its reproduction is severely limited by fire, because the presence of residual seed trees is required for site recolonization after disturbance [4,19]. In regions that are affected by large fires in a cyclical manner (the case of the western Canada boreal forest), it is possible that Bf was gradually eliminated from the landscape over time (subsisting only in some small sectors naturally protected against fires), since this species is not fire-adapted. However, its native range extends towards western Canada in scattered stands through north-central Manitoba and Saskatchewan to the Peace River Valley in northwestern Alberta, then south for approximately 640 km (400 mi) to central Alberta and east and south to southern Manitoba [55].
Bs regeneration is still present in western aspen forests despite recurrent and severe fires in this portion of the gradient. This presence is facilitated by its adaptation to fire. It is generally able to re-establish itself quickly and amply after a fire event, as it has semi-serotinous cones that open under the effect of heat [29,51,56]. It is a transcontinental tree species across Canada [55].
The dominance of Ws regeneration in the aspen forests of western Canada seems contrary to the autecology of this coniferous species, given the predominance of short fire cycles (Appendix – Figure A1c) and less favorable climatic conditions (low precipitation annual and drier) in this portion of the gradient. First, the abundance of Ws regeneration in western aspen stands could be explained by the greater availability of seeds of this species in this portion of the gradient. Indeed, Ws is ubiquitous in the forest landscapes of western Canada [57]. It is likely that the existing spatial patterns of the Ws, Bs and Bf regeneration abundance are a legacy of the regions’ post-glacial history of vegetation. The overall distribution of conifer species is likely a consequence (biological legacy) of vegetation responses to environmental changes during the late Quaternary [58]. Interactive maps of plant species distributions during the Holocene have been constructed from pollen diagrams, which reinforce this biogeographic hypothesis [59]. These maps indicate that during deglaciation, Ws began recolonizing the North American continent from the west, while Bf started in the east and Bs moved southward from refugia in the north. These species became adapted to their environmental conditions of the early periods of migration. The distribution of coniferous regeneration that is observed in aspen stands along the longitudinal gradient, therefore, could not be only interpreted as a response to pressure exercised by climate and disturbance regimes, but should actually reflect migration routes by which these species invaded the North American continent during the post-glacial period.
Ws regeneration is everywhere along the longitudinal gradient. The longevity, low mortality rate, periodic dispersion of large seed crops (i.e., masting) and shade-tolerance may explain the persistence of white spruce as a major species of the boreal forest [60]. White spruce regeneration, however, is very variable. Particularly in the west, this species seems to enjoy the absence of Bf and the low presence of Bs to increase in abundance. However, Ws is less dominant in eastern Canada, probably due to competition with Bf. Moreover, Ws is less shade-tolerant than Bf [61].
Regarding the modeling of conifer recruitment across Canada, climate and anthropogenic proxies appear clearly as the determining factors. Despite its ecological impact on the regeneration of late-successional species [62], the fire regime (variable FC) did not appear in almost all of the selected predictive models. This is probably due to the fact that FC is very much correlated with DI (r = 0.68). Across Canada, the risk of forest fires is closely associated with drought severity and fire activity [63,64,65,66]. Therefore, the inclusion of DI in models masks the effect of fire, thereby rendering the variable FC non-significant. Temperature and soil moisture directly influence the success of conifer regeneration. Unfavorable weather conditions (e.g., drought) would compromise the processes of germination and establishment of conifer species [36,54,58]. Hydric stress or excessive temperatures during germination and seedling development can adversely affect their survival and incur significant mortality that is likely to limit or inhibit regeneration. For example, balsam fir seedlings in open spaces can undergo a high mortality rate when surface temperatures exceed 46 °C or when there is a drought or frost [55].
Furthermore, the variable “road density” (DensRoad25Km) mainly (or “distance to agricultural area” (DistAgri)) appears in almost all of the best models, with a negative effect on the abundance and occurrence of conifer recruitments. Increasing this variable suggests an increasing pressure from human activities and their impact on forest ecosystems. The consequences of this anthropization on forest characteristics are reflected in particular by increasing pressure timber harvesting due to population growth and fire occurrence following the introduction of new sources of ignition (risks of human-caused fires). These human actions lead to significant changes in the disturbance regime, with impacts ranging from local to global scales. Because tree species respond in different ways to changes in disturbance regime, alteration in fire regimes will affect forest composition. The cumulative effect of fires and forest harvesting usually favor early-successional species at the expense of late-successional tolerant conifers species. The recurrence of severe fires locally affects the seed bank of shade-tolerant species, which show a low dispersion capacity of seeds and a slow growth rate; unlike the shade-intolerant deciduous, which have traits better adapted to the new frequently disturbed environments [67]. Disturbances (fire and cut) occurring quite closely over time can therefore create local extinguishing pockets of shade-tolerant species, by accentuating the constraint of dispersion. The decrease in coniferous species could be explained partly by the removal in large numbers of seed trees as a result of cuts [68]. However, in a study aimed at describing and understanding the contribution of human activities to the transformations of forest landscapes since the early nineteenth century in the Bas-Saint-Laurent in eastern Quebec [69], researchers observed a dramatic increase in the absolute and relative frequency of deciduous species. This increase was accompanied by a decrease in coniferous trees that dominated pre-industrial forests, such as spruce (Picea spp.) and cedar (Thuja occidentalis L); only balsam fir seems more resistant. Human activities were a major factor in this dominance of deciduous species.
In addition to logging, forest clearing for farmland in the north-east of North America was accompanied by bush fires, which escaped in the surrounding forests. The study findings showed that 90% of the fire surface is less than 2 km from colonization zones. These results imply a strong connectivity between fires and colonization compared to a random distribution of fires, an indication of the importance of anthropogenic fires in landscapes. The current location of aspen stands seems to match the fire occurrence of colonization in this region.

5. Conclusions

Our study shows that coniferous regeneration is present in aspen stands across an east-west transect of Canada, with the exception of stands that are affected by human activities. Conifer regeneration is persistent despite the observed variability in climate and disturbance regimes along this transect. However, the spatial pattern of abundance and the occurrence of conifer regeneration varied differently depending on the species. Within the context of global warming, a future increase in the risk and severity of fires could lead to changes in the current dynamics of conifer species recruitment in these types of stands. An increase in temperature and drought and, consequently, in fire activity would significantly limit the natural regeneration of balsam fir in aspen forests across boreal landscapes. Given that black spruce is particularly well adapted to fire, the distribution of its natural regeneration in boreal mixedwood could be less affected by climate change impacts. White spruce showed a certain degree of plasticity in its response to environmental variation. It grows in widely varied environments, including regions characterized by less favorable climate and soils. Given that silvicultural management could lead to an increase in deciduous cover, the results of this study provide some insights into how boreal forest composition could be affected by future climate change.

Acknowledgments

We are very grateful to the various provincial forest branch managers (Québec, Ontario, Manitoba, Saskatchewan, Alberta and British-Columbia) for making their forest inventory data available to us. We especially would like to thank Yassine Messaoud (former Postdoctoral researcher., Faculty of Forestry and the Forest Environment, Lakehead University) and Dave Gervais (former Professional Chair AFD-UQAM-UQAT) for their support in data acquisition, Remi St-Amant (NRC), who provided us with the climatic data, and the research professionals of the Centre d’Étude de la Forêt (Daniel Lesieur, Mélanie Desrochers and Marc J. Mazerolle for technical assistance; and William F.J. Parsons for the English revision).

Author Contributions

Pierre Nlungu-Kweta-Bisewolo is Ph.D. student researcher, while Yves Bergeron and Alain Leduc are scientific supervisors.

Appendix

Figure A1. Histograms illustrating the variability of environmental conditions (averages of the last three decades) based on the longitudinal gradient for total annual precipitation, drought index (aridity), cycle fire and average annual temperature. The linear regression on each histogram indicates the trend of fluctuations in the distribution of the variable across the study gradient.
Forests 05 02905 g004
Table A1. Description and best models of occurrence based on Akaike’s information criterion (AIC).
ResponseCandidate ModelsModel IDLLAICΔAICWi
ConifDistAgri + DI + Lat + RegiPhysio + Long + Elev + DD + PctHydromod1−1,1112,2400.00.98
DistAgri + DI + Lat + RegiPhysio + Long + Elevmod2−1,1172,2488.30.02
DistAgri + DI + Lat + RegiPhysio + Longmod3−1,1232,25717.20.00
DistAgri + DI + PctHydro + Lat + RegiPhysio + DDmod4−1,1322,27838.10.00
DistAgri + DensRoad25Km + DI + PctHydro + Latmod5−1,1362,28343.20.00
DistAgri + DensRoad25Km + DI + DDmod6−1,1472,30463.90.00
DistAgri + DensRoad25Km + DImod7−1,1572,32181.10.00
DistAgri + RegiPhysio + FC + DensRoad25Kmmod8−1,1982,406165.80.00
WsDensRoad25Km + DI + Lat + Long + Elev + DDmod1−5061,0260.00.88
DensRoad25Km + DI + Lat + Long + Elevmod2−5091,0303.90.12
PctHydro + DensRoad25Km + DI + Lat + Longmod3−5191,04923.10.00
PctHydro + DensRoad25Km + DI + Lat + DistAgrimod4−5191,05124.50.00
PctHydro + DensRoad25Km + DI + Latmod5−5231,05528.70.00
DD + DistAgri + PctHydro + DensRoad25Km + Long + DImod6−5251,06538.50.00
DD + DistAgri + PctHydro + DensRoad25Kmmod7−5341,07952.40.00
DI + DD + FCmod8−5411,09064.00.00
BsDistAgri + DensRoad25Km + DI + Lat + Long + RegiPhysiomod1−5851,1840.00.39
DistAgri + DI + Lat + Long + RegiPhysio + DistRoadmod2−5851,1840.20.35
DistAgri + DensRoad25Km + DI + Lat + Longmod3−5871,1850.90.25
DI + DD + FC + DistAgri + DensRoad25Kmmod4−5911,19510.50.00
DensRoad25Km + DI + Lat + Longmod5−5931,19611.90.00
DistAgri + DensRoad25Km + DI + Lat + Long + RegiPhysiomod6−5931,19712.70.00
DI + DD + FC + DistAgrimod7−5951,20015.80.00
DI + DD + FCmod8−6021,21228.30.00
BfRegiPhysio + PctHydro + DistAgri + DI + Long + FCmod1−7671,5480.00.87
RegiPhysio + PctHydro + DistAgri + DI + Longmod2−7701,5523.80.13
RegiPhysio + DistAgri + DI + Long + FCmod3−7751,56314.70.00
DistAgri + DI + Long + FCmod4−7811,57223.80.00
RegiPhysio + PctHydro + DensRoad15Km + DistAgri + DImod5−7831,578300.00
RegiPhysio + PctHydro + DensRoad15Km + FC + DistAgrimod6−7991,61162.60.00
RegiPhysio + PctHydro + DensRoad15Km + FCmod7−8031,61567.20.00
Note: LL is the log-likelihood value of the model; AIC is the Akaike information criterion value; ΔAIC is the delta AIC, a measure of each model relative to the best model; and wi is the Akaike weights, representing the ratio of the ΔAIC of a given model relative to the whole set of R candidate models. Conif, Ws, Bs and Bf refer to the conifer recruitment into aspen stands across Canada, respectively, for all three conifer species, white spruce, black spruce and balsam fir, Models are ranked based on their AIC scores, where the smallest AIC represents the best model (in bold).

Conflicts of Interest

The authors declare no conflict of interest.

References

  1. Qian, H.; Klinka, K.; Økland, R.H.; Krestov, P.; Kayahara, G.J. Understorey vegetation in boreal Picea Mariana and Populus Tremuloides stands in British Columbia. J. Veg. Sci. 2003, 14, 173–184. [Google Scholar]
  2. Oliver, C.D.; Larson, B.C. Forest Stand Dynamics; John Wiley and Sons, Inc.: New York, NY, USA, 1996. [Google Scholar]
  3. Bergeron, Y. Species and stand dynamics in the mixed woods of Quebec’s southern boreal forest. Ecology 2000, 81, 1500–1516. [Google Scholar] [CrossRef]
  4. Gauthier, S.; Grandpré, L.; Bergeron, Y. Differences in forest composition in two boreal forest ecoregions of Quebec. J. Veg. Sci. 2000, 11, 781–790. [Google Scholar]
  5. Bergeron, Y.; Gauthier, S.; Flannigan, M.; Kafka, V. Fire regimes at the transition between mixedwood and coniferous boreal forest in northwestern Quebec. Ecology 2004, 85, 1916–1932. [Google Scholar] [CrossRef]
  6. Hart, S.A.; Chen, H.Y. Fire, logging, and overstory affect understory abundance, diversity, and composition in boreal forest. Ecol. Monogr. 2008, 78, 123–140. [Google Scholar] [CrossRef]
  7. Chen, H.Y.; Popadiouk, R.V. Dynamics of North American boreal mixedwoods. Environ. Rev. 2002, 10, 137–166. [Google Scholar] [CrossRef]
  8. Bergeron, Y.; Fenton, N. Boreal forests of eastern Canada revisited: Old growth, nonfire disturbances, forest succession, and biodiversity. Botany 2012, 90, 509–523. [Google Scholar] [CrossRef]
  9. Peters, V.S.; Macdonald, S.E.; Dale, M.R.T. Patterns of initial versus delayed regeneration of white spruce in boreal mixedwood succession. Can. J. For. Res. 2006, 36, 1597–1609. [Google Scholar] [CrossRef]
  10. Stocks, B.J.; Mason, J.A.; Todd, J.B.; Bosch, E.M.; Wotton, B.M.; Amiro, B.D.; Flannigan, M.D.; Hirsch, K.G.; Logan, K.A.; Martell, D.L.; et al. Large forest fires in Canada, 1959–1997. J. Geophys. Res. 2002, 107. [Google Scholar] [CrossRef]
  11. Bergeron, Y.; Richard, P.J.H.; Carcaillet, C.; Gauthier, S.; Flannigan, M.; Prairie, Y.T. Variability in fire frequency and forest composition in Canada’s southeastern boreal forest: A challenge for sustainable forest management. Conserv. Ecol. 1998, 2, pp. 1–11. Available online: ://www.consecol.org/vol2/iss2/art6/ (accessed on 17 December 2013).
  12. Taylor, A.R.; Chen, H.Y. Multiple successional pathways of boreal forest stands in central Canada. Ecography 2011, 34, 208–219. [Google Scholar] [CrossRef]
  13. Nilsson, M.-C.; Wardle, D.A. Understory vegetation as a forest ecosystem driver: Evidence from the northern Swedish boreal forest. Front. Ecol. Environ. 2005, 3, 421–428. [Google Scholar] [CrossRef]
  14. Bergeron, Y.; Dubuc, M. Succession in the southern part of the Canadian boreal forest. Vegetatio 1988, 79, 51–63. [Google Scholar] [CrossRef]
  15. Johnstone, J.; Chapin, F.S., III. Fire interval effects on successional trajectory in boreal forests of northwest Canada. Ecosystems 2006, 9, 268–277. [Google Scholar] [CrossRef]
  16. Cumming, S.G.; Schmiegelow, F.K.A.; Burton, P.J. Gap dynamics in boreal aspen stands: Is the forest older than we think? Ecol. Appl. 2000, 10, 744–759. [Google Scholar]
  17. Caners, R.; Kenkel, N. Forest stand structure and dynamics at Riding Mountain National Park, Manitoba, Canada. Community Ecol. 2003, 4, 185–204. [Google Scholar] [CrossRef]
  18. Johnstone, J.F.; Chapin, F.S., III; Foote, J.; Kemmett, S.; Price, K.; Viereck, L. Decadal observations of tree regeneration following fire in boreal forests. Can. J. For. Res. 2004, 34, 267–273. [Google Scholar] [CrossRef]
  19. Galipeau, C.; Kneeshaw, D.D.; Bergeron, Y. White spruce and balsam fir colonization of a site in the southeastern boreal forest as observed 68 years after fire. Can. J. For. Res. 1997, 27, 139–147. [Google Scholar] [CrossRef]
  20. Robitaille, A.; Saucier, J.-P. Paysages Régionaux du Quebec Méridional. In MRN (Ministère des Ressources Naturelles); Gouvernement du Québec, Les publications du Québec: Québec, Canada, 1998; p. 213. [Google Scholar]
  21. Flannigan, M.D.; Bergeron, Y.; Engelmark, O.; Wotton, B.M. Future wildfire in circumboreal forests in relation to global warming. J. Veg. Sci. 1998, 9, 469–476. [Google Scholar] [CrossRef]
  22. Bergeron, Y.; Cyr, D.; Girardin, M.P.; Carcaillet, C. Will climate change drive 21st century burn rates in Canadian boreal forest outside of its natural variability: Collating global climate model experiments with sedimentary charcoal data. Int. J. Wildland Fire 2010, 19, 1127–1139. [Google Scholar] [CrossRef]
  23. Wotton, B.M.; Nock, C.A.; Flannigan, M.D. Forest fire occurrence and climate change in Canada. Int. J. Wildland Fire 2010, 19, 253–271. [Google Scholar] [CrossRef]
  24. Girardin, M.P.; Ali, A.A.; Carcaillet, C.; Gauthier, S.; Hely, C.; LeGoff, H.; Terrier, A.; Bergeron, Y. Fire in managed forests of eastern Canada: Risks and options. For. Ecol. Manage. 2013, 294, 238–249. [Google Scholar] [CrossRef]
  25. Bergeron, Y.; Gauthier, S.; Kafka, V.; Lefort, P.; Lesieur, D. Natural fire frequency for the eastern Canadian boreal forest: Consequences for sustainable forestry. Can. J. For. Res. 2001, 31, 384–391. [Google Scholar] [CrossRef]
  26. Bergeron, Y.; Chen, H.Y.H.; Kenkel, N.C.; Leduc, A.L.; Macdonald, S.E. Boreal mixedwood stand dynamics: Ecological processes underlying multiple pathways. For. Chron. 2014, 90, 202–213. [Google Scholar] [CrossRef]
  27. Reyes, G.P.; Kneeshaw, D.; de Grandpré, L. The relative importance of natural disturbances and local site factors on woody vegetation regeneration diversity across a large, contiguous forest region. Open J. For. 2013, 3, 88–98. [Google Scholar] [CrossRef]
  28. Lieffers, V.J.; Stadt, K.J.; Navratil, S. Age structure and growth of understory white spruce under aspen. Can. J. For. Res. 1996, 26, 1002–1007. [Google Scholar] [CrossRef]
  29. Greene, D.; Zasada, J.C.; Sirois, L.; Kneeshaw, D.; Morin, H.; Charron, I.; Simard, M.-J. A review of the regeneration dynamics of North American boreal forest tree species. Can. J. For. Res. 1999, 29, 824–839. [Google Scholar] [CrossRef]
  30. MacIsaac, D.A.; Comeau, P.G.; Macdonald, S.E. Dynamics of regeneration gaps following harvest of aspen stands. Can. J. For. Res. 2006, 36, 1818–1833. [Google Scholar] [CrossRef]
  31. Lieffers, V.J.; Armstrong, G.W.; Stadt, K.J.; Marenholtz, E.H. Forest regeneration standards: Are they limiting management options for Alberta’s boreal mixedwoods? For. Chron. 2008, 84, 76–82. [Google Scholar] [CrossRef]
  32. Arbour, M.L.; Bergeron, Y. Effect of increased Populus cover on Abies regeneration in the Picea-feathermoss boreal forest. J. Veg. Sci. 2011, 22, 1132–1142. [Google Scholar] [CrossRef]
  33. Hart, S.A.; Chen, H.Y. Understory vegetation dynamics of North American boreal forests. Crit. Rev. Plant Sci. 2006, 25, 381–397. [Google Scholar] [CrossRef]
  34. Boulanger, Y.; Gauthier, S.; Burton, P.J.; Vaillancourt, M.-A. An alternative fire regime zonation for Canada. Int. J. Wildland Fire 2012, 21, 1052–1064. [Google Scholar] [CrossRef]
  35. McIntire, E.J.B.; Duchesneau, R.; Kimmins, J.P. Seed and bud legacies interact with varying fire regimes to drive long-term dynamics of boreal forest communities. Can. J. For. Res. 2005, 35, 2765–2773. [Google Scholar] [CrossRef]
  36. Martin-DeMoor, J.; Lieffers, V.J.; Macdonald, S.E. Natural regeneration of white spruce in aspen-dominated boreal mixedwoods following harvesting. Can. J. For. Res. 2010, 40, 585–594. [Google Scholar] [CrossRef]
  37. Payette, S. Fire as a controlling process in the North American boreal fores. In A Systems Analysis of the Global Boreal Forest; Shugart, H.H., Leemans, R., Bonan, G.B., Eds.; Cambridge University Press: Cambridge, UK, 1992; pp. 144–169. [Google Scholar]
  38. Bergeron, Y.; Flannigan, M.D. Predicting the effects of climate change on fire frequency in the southeastern Canadian boreal forest. Water Air Soil Pollut. 1995, 82, 437–444. [Google Scholar] [CrossRef]
  39. Bergeron, Y.; Leduc, A.; Harvey, B.D.; Gauthier, S. Natural fire regime: A guide for sustainable management of the Canadian boreal forest. Silva Fenn. 2002, 36, 81–95. [Google Scholar] [CrossRef]
  40. Chhin, S.; Hogg, E.; Lieffers, V.J.; Huang, S. Potential effects of climate change on the growth of lodgepole pine across diameter size classes and ecological regions. For. Ecol. Manag. 2008, 256, 1692–1703. [Google Scholar] [CrossRef]
  41. Johnson, E.A.; Miyanishi, K.; Weir, J.M.H. Wildfires in the western Canadian boreal forest: Landscape patterns and ecosystem management. J. Veg. Sci. 1998, 9, 603–610. [Google Scholar] [CrossRef]
  42. Baldwin, K.A.; MacKenzie, W.H.; Pfalz, J.; Meades, W.J.; Meidinger, D.V.; Robitaille, A.; Saucier, J.-P.; Uhlig, P. Level 4 Map, Version 1, Canadian Component of the Circumboreal Vegetation Map (CBVM); Canadian regional team of the Circumboreal Vegetation Map Project. Natural Resources Canada, Canadian Forest Service, Great Lakes Forestry Centre: Sault Ste. Marie, ON, Canada, 2012. [Google Scholar]
  43. Régnière, J.; Saint-Amant, R. BioSIM 9—Manuel de L’utilisateur. Ressources Naturelles Canada, Service Canadien des Forêts, Centre de Foresterie des Laurentide. 2008. Available online: ftp://www.ftp.cfl.scf.rncan.gc.ca/regniere/Data/Weather/ (accessed on 4 February 2012).
  44. Environment Canada. National Climate Data and Information Archive. 2013. Available online: http://climate.weatheroffice.gc.ca/ (accessed on 23 September 2013).
  45. Villeneuve, G.O. Glossaire de Métérologie et de Climatologie, 2nd ed.; Les Presses de l’université Laval: Québec, QC, Canada, 1980; p. 651. [Google Scholar]
  46. Kaennel, M.; Schweingruber, F.H. Multilingual Glossary of Dendrochronology; Birmensdorf, Swiss Federal Institute for Forest, Snow and Landscape Research: Berne, Stuttgart, Vienna, 1995; p. 467. [Google Scholar]
  47. Laquerre, S.; Leduc, A.; Harvey, B.D. Augmentation du couvert en peuplier faux-tremble dans les pessières noires du nord-ouest du Québec après coupe totale. Ecoscience 2009, 16, 483–491. [Google Scholar] [CrossRef]
  48. R-Development-Core-Team. R: A Language and Environment for Statistical Computing; R Foundation for Statistical Computing: Vienna, Austria, 2013. ISBN 3-900051-07-0. Available online: http://www.R-project.org/ (accessed on 15 November 2013).
  49. Mazerolle, M.J. Improving data analysis in herpetology: Using Akaike’s Information Criterion (AIC) to assess the strength of biological hypotheses. Amphib.Reptil. 2006, 27, 169–180. [Google Scholar] [CrossRef]
  50. Burnham, K.P.; Anderson, D.R. Model Selection and Multimodel Inference: A Practical Information-Theoretic Approach, 2nd ed.; Springer-Verlag: New York, NY, USA, 2002; p. 488. [Google Scholar]
  51. Lesieur, D.; Gauthier, S.; Bergeron, Y. Fire frequency and vegetation dynamics for the south-central boreal forest of Quebec, Canada. Can. J. For. Res. 2002, 32, 1996–2009. [Google Scholar] [CrossRef]
  52. Landhäusser, S.M.; Lieffers, V.J. Growth of Populus tremuloides in association with Calamagrostis canadensis. Can. J. For. Res. 1998, 28, 396–401. [Google Scholar] [CrossRef]
  53. Zasada, J.C.; Sharik, T.L.; Nygren, M. The reproductive process in boreal forest trees. In A Systems Analysis of the Global Boreal Forest; Shugart, H.H., Leemans, R., Bonan, G.B., Eds.; Cambridge University Press: Cambridge, UK, 1992; pp. 85–125. [Google Scholar]
  54. Messaoud, Y.; Bergeron, Y.; Asselin, H. Reproductive potential of balsam fir (Abies balsamea), white spruce (Picea glauca), and black spruce (P. mariana) at the ecotone between mixedwood and coniferous forests in the boreal zone of western Quebec. Am. J. Bot. 2007, 94, 746–754. [Google Scholar] [CrossRef] [PubMed]
  55. Frank, R.M. Balsam fir. Silvics of North America; Agriculture Handbook 654. Burns, R.M., Honkala, B.H., Eds.; USDA Forest Service: Washington, DC, USA, 1990; p. 26. Available online: http://na.fs.fed.us/spfo/pubs/silvics_manual/Volume_1/abies/balsamea.htm (accessed on 28 March 2014).
  56. Greene, D.F.; Noel, J.; Bergeron, Y.; Rousseau, M.; Gauthier, S. Recruitment of Picea mariana, Pinus banksiana, and Populus tremuloides across a burn severity gradient following wildfire in the southern boreal forest of Quebec. Can. J. For. Res. 2004, 34, 1845–1857. [Google Scholar] [CrossRef]
  57. Rowe, J.S. Forest regions of Canada; Fisheries and Environment Canada, Canadian Forest Service: Ottawa, ON, Canada, 1972. Available online: http://cfs.nrcan.gc.ca/pubwarehouse/pdfs/24040.pdf (accessed on 11 February 2014).
  58. Williams, J.W.; Shuman, B.N.; Webb, T., III; Bartlein, P.J.; Leduc, P.L. Late-Quaternary vegetation dynamics in North America: Scaling from taxa to biomes. Ecol. Monogr. 2004, 74, 309–334. [Google Scholar] [CrossRef]
  59. National Oceanic Atmospheric Administration. WDC for Paleoclimatology. 2013. Available online: http://www.ncdc.noaa.gov/paleo/pollen/viewer/webviewer.html (accessed on 20 June 2014). [Google Scholar]
  60. Gärtner, S.M.; Lieffers, V.J.; Macdonald, S.E. Ecology and management of natural regeneration of white spruce in the boreal forest. Environ. Rev. 2011, 19, 461–478. [Google Scholar] [CrossRef]
  61. Greene, D.F.; Messier, C.; Asselin, H.; Fortin, M.-J. The effect of light availability and basal area on cone production in Abies balsamea and Picea glauca. Can. J. Bot. 2002, 80, 370–377. [Google Scholar] [CrossRef] [Green Version]
  62. Johnstone, J.F.; Chapin, F.S., III. Effects of soil burn severity on post-fire tree recruitment in boreal forest. Ecosystems 2006, 9, 14–31. [Google Scholar] [CrossRef]
  63. Girardin, M.P.; Tardif, J.C.; Flannigan, M.D.; Wotton, B.M.; Bergeron, Y. Trends and periodicities in the Canadian Drought Code and their relationships with atmospheric circulation for the southern Canadian boreal forest. Can. J. For. Res. 2004, 34, 103–119. [Google Scholar] [CrossRef]
  64. Amiro, B.D.; Logan, K.; Wotton, B.; Flannigan, M.; Todd, J.; Stocks, B.; Martell, D. Fire weather index system components for large fires in the Canadian boreal forest. Int. J. Wildland Fire 2005, 13, 391–400. [Google Scholar] [CrossRef]
  65. Girardin, M.P.; Mudelsee, M. Past and future changes in Canadian boreal wildfire activity. Ecol. Appl. 2008, 18, 391–406. [Google Scholar] [CrossRef]
  66. Girardin, M.P.; Wotton, B.M. Summer moisture and wildfire risks across Canada. J. Appl. Meteo. Climat. 2009, 48, 517–533. [Google Scholar] [CrossRef]
  67. Boucher, Y.; Arseneault, D.; Sirois, L. Logging-induced change (1930–2002) of a preindustrial landscape at the northern range limit of northern hardwoods, eastern Canada. Can. J. For. Res. 2006, 36, 505–517. [Google Scholar] [CrossRef]
  68. Archambault, L.; Morissette, J.; Bernier-Cardou, M. Forest succession over a 20-year period following clearcutting in balsam fir-yellow birch ecosystems of eastern Quebec, Canada. For. Ecol. Manag. 1998, 102, 61–74. [Google Scholar] [CrossRef]
  69. Terrail, R. Influence de la Colonisation sur les Transformations du Paysage Forestier Depuis L’époque Préindustrielle Dans l’Est du Québec (Canada). Ph.D. Thesis, Université du Québec à Rimouski, Rimouski, Juillet, Canada, 2013. [Google Scholar]

