1. Introduction
The vast majority of environmental services are free and can disappear due to poor management and a lack of economic incentive to preserve them. Designing protected areas has been a traditional mechanism worldwide for maintaining many important environmental services for humankind. The traditional paradigm of management in protected areas has been focused on conservation and recreation objectives and carried out by natural scientists or natural resource experts. An emerging paradigm includes social and economic objectives, as well as conservation and recreation [
1].
In addition, the management of natural resources has evolved in such a way that public participation is seen as a basic element of modern conservation strategies in the governance of protected areas and all stakeholder values should be taken into account [
2,
3,
4]. Published studies have involved stakeholders in the use of scenario analysis for ecosystem management [
5,
6], or have focused on social analysis to determine the attitudes and support of stakeholders and local communities [
7,
8,
9]. Many authors advise engaging stakeholders in the decision making process as early as possible, although this may be a challenge due to their needs and priorities [
10]. Others highlight the strengths of multicriteria tools to deal with conflict and complex situations, taking into account stakeholder preferences in allocating limited resources [
11,
12].
Protected area categories, such as national parks, natural monuments or protected landscapes, define legal frameworks but do not provide tools for prioritizing management alternatives which simultaneously consider the value of all Ecosystem Services (ESS). Primary and secondary objectives are defined for each category of protected area without providing tools or guidelines to weight their relevance in a specific context. Hockings
et al. [
13] proposed an interesting framework to assess the management of protected areas based on the following evaluation criteria: context, planning, inputs, processes, outputs and outcomes. Nevertheless, this perspective does not provide tools to manage all ESS, including environmental, provisioning and cultural services. In particular, it is necessary to develop research focused on the non-market benefits of ecosystem services, decision making and public opinion in natural resource management, as shown in previous studies [
14,
15,
16].
More multidisciplinary knowledge is needed to improve the management of ESS and to develop approaches to determine their value to society. Martinez-Harms
et al. [
17], in a recent review on the management of ESS, conclude that ESS literature has been focused on quantifying and mapping their supply, without taking into account the corresponding decision making. The value of ESS is also related to the objectives which guide their management. Therefore, technical and economic concepts and the data used to measure these provide information about the state of the ESS and should be taken into account when assessing ESS together with the preferences of society. For instance, to manage the ESS of a protected area, it is necessary first to know the market and nonmarket services that are provided to society [
16]. Valuation techniques as Cost-Benefit Analysis (CBA) may be used to evaluate and make decisions based on market services [
18], however, this is not the case for non-market ecosystem services. Moreover, the problem becomes more complex when a balance is needed between market and non-market services, as in the case of protected areas. If the territory is both privately and publicly owned, the complexity increases even more.
Which projects are implemented in the next planning period in a scarce resource context? How are available funds distributed to manage a protected area? How can a mechanism for Payment for Ecosystem Services (PES) be established? Approaches which integrate economic, technical and social data in order to achieve an appropriate balance all ESS are needed to answer these questions.
This paper proposes a methodology which integrates Multiple Criteria Decision Analysis (MCDA) with a formalised approach to support Group Decision Making (GDM) to provide support for decision making such as selecting and prioritising projects and to enable classification of the territory in homogeneous areas according to ESS contribution. The approach used here is based on the outranking method Preference Ranking Organisation Methods for Enrichment Evaluations (PROMETHEE) and the Analytic Hierarchy Process (AHP). The strengths of each method have been merged in a process to overcome their individual disadvantages, following the tendency in decision making of hybridizing several techniques when solving complex problems. For example, Macharis
et al. [
19] proposed a method to obtain the weights of criteria that provides synergies between AHP and PROMETHEE, and also pointed out how the former could enhance the latter by structuring the problem and eliciting the weights. Recently, Fontana
et al. [
20] has also used the AHP and PROMETHEE to compare land use alternatives considering ESS as criteria. To date, PROMETHEE has been more used in applied papers on sustainable decision in transport and logistic [
21,
22], environmental management (for example, in ranking and selecting environmental projects), environmental impact assessment, ranking waste management alternatives and air quality/emissions problems (see the surveys by Behzadian
et al. [
23] and Huang
et al. [
24]) than in studies related to natural resource management [
25,
26].
An important requirement is to ascertain the importance all stakeholders, including citizens, attribute to each ecosystem service. This information is essential to implementing a transparent and collaborative procedure in the evaluation of management alternatives and in the overall assessment of ESS. However, the question of how best to obtain information on social preferences is not easy to answer. In particular, the process and method adopted have to be transparent, understandable and equitable in order to effectively facilitate a process of collaborative decision making aimed at achieving consensus. If the inventory of protected areas included information about stakeholders’ preferences, it would represent a step forward for implementing ESS collaborative management and assessing them.
Thus, our hypothesis is that, in order to manage and assess ESS, namely the overall benefits that ecosystems provide to society, it is necessary to adopt a management process which involves all stakeholders and makes use of an appropriate multicriteria evaluation methodology to permit the exploitation of the available data and also to incorporate new sources of information.
The objective of this work is twofold. First, to propose a methodology to implement collaborative and global ecosystem services management which is capable of integrating available data in order to select and rank projects in protected areas. Second, to develop new indicators based on the main functions of ecosystems to classify the territory inside protected areas, in particular according to their contribution to the maintenance services and direct to citizen services. These new indicators, based on a hybrid multiple criteria method, define an innovative approach to assess the ecosystem services supply and provide basic information to establish payments for environmental services and compensation for natural disasters. This methodology exploits all knowledge and data, qualitative and quantitative, to produce results that can be presented visually and which are simple for every stakeholder to understand.
The rest of the article is organized as follows. The next section synthesizes the methodological approach to reach the objectives, followed by the new procedure to manage ESS in protected areas and to classify the territory inside them. The proposed methodology is then illustrated using a case study focused on the natural park network of a Mediterranean region. Finally, the main results as well as a discussion and conclusions are presented.
2. Methodological Approach
Ecosystem services are an important aspect of the territory in general, but especially in protected areas worldwide (agricultural, forest, wetlands or marine areas). The Millennium Ecosystem Assessment (MEA) [
27] defines ecosystem services as the benefits that people obtain from ecosystems indeed, they are aspects of ecosystems used to produce human well-being [
28]. The MEA classifies ESS into four categories: provisioning services (wood, food,
etc.), supporting services (soil formation,
etc.) regulating services (climate regulation, water cycle) and cultural services (aesthetic, recreational,
etc.). In short, the ESS concept integrates all that should be managed in protected areas.
The choice of criteria on which to base decisions is subjective so a first step is to make these and the process by which they are selected and prioritised explicit. This is particularly important for collaborative decision making processes which seek to engage a broad range of stakeholders, hence our proposal to utilise an approach which integrates MCDA within an appropriate and effective group process. MCDA is not only a means to evaluate alternatives, it also provides a robust approach to problem structuring [
29,
30,
31] including the identification and structuring of objectives, as well as the creation of alternatives.
There are many different approaches to eliciting stakeholder views on the importance of criteria and associated challenges in ensuring that questions posed are appropriately interpreted by respondents. A simple approach is to directly assign a grade of importance using a qualitative (e.g., low, medium, high) or quantitative (e.g., 1–5) scale to each ESS. Other methods use comparison against an identified standard (e.g., the most important criterion) or, in order to ensure consistency of judgements, adopt a process of over-specification and reconciliation of judgements, for example AHP or Measuring Attractiveness by a Categorical Based Evaluation Technique (MACBETH) [
29].
AHP is the most widely used MCDA method in natural resource planning, especially when the stakeholders are involved in the process [
16,
32]. We propose AHP as a method to elicit stakeholder views on the importance of ESS in the management of protected areas as we believe this provides a mechanism with good properties to elicit and aggregate preferences. It encourages differentiation between criteria to a greater extent than simple rating methods and highlights inconsistencies in responses. In addition, if we aggregate consistent individual preferences, the geometric mean provides consistent preferences for the group [
33]. This is not true for other methods, such as the arithmetic mean. Finally, AHP is not difficult to understand and is very easy to implement in a spreadsheet or by using professional software, for instance Expert Choice, SuperDecisions or D-Sight. These last strengths increase the possibility that MCDA is implemented in practice [
34], as verified by Segura
et al. [
16].
To manage and assess ESS, we propose a procedure based on PROMETHEE which, in common with AHP and Multi-attribute Value Theory (MAVT), is a method that is primarily used to prioritise or select preferred alternatives. AHP and MAVT are compensatory methods while PROMETHEE is non-compensatory. Working with ESS, the hypothesis of a fixed trade-off rate between each pair of criteria is not realistic. It is not advisable to use a methodology that allows selecting an alternative in which very good ESS were able to compensate some others with unacceptable performances [
19].
PROMETHE, as an outranking method, takes into account the differences in behaviour of the alternatives for each ESS and removes the scale effect when the ESS are measured in different units. This method also provides information about the conflicts between ESS and allows sensitivity analysis to see the impact of the weights on the solution. For practical purposes, the PROMETHEE II has been applied because it provides a complete ranking of alternatives. Thus, all alternatives are comparable. Our proposal does not calculate net flows for each alternative, but for each one of the three main functions of ESS. In this way, we compensate within the provisioning services, as well as within maintenance services and direct to citizens services. Nevertheless, we avoid compensating among the three main categories, because it is not appropriate when dealing with ESS. For example, profits from provisioning services would compensate for neither the lack of water for citizens nor high levels of erosion in Mediterranean areas. This is also the reason why we propose a simple graphical representation of the results, which is more useful than Geometrical Analysis for Interactive Aid (GAIA) plane. Although GAIA plane shows the discriminating power of the criteria, the conflicting aspects and the quality of the alternatives on different criteria which are useful to interpret the results in many decision problems, the solution shown in the GAIA plane compensates all ESS and our problem is more related to balanced solutions among the main groups of ESS.
To sum up, the nature of ESS which claims to balance them for meeting social preferences, together with the main properties of the method, make PROMETHEE one of the most suitable approaches to deal with ESS management and assessment. It can take tangible and intangible services into account, as well as analyse technical, economic and social data. Finally, their preference functions allow different perspectives and realities for ESS to be modelled.
3. A Collaborative Process to Manage and Assess Ecosystem Services
3.1. Decision Makers, Technical Staff and Other Stakeholders
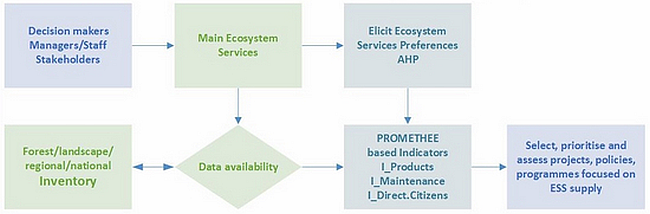
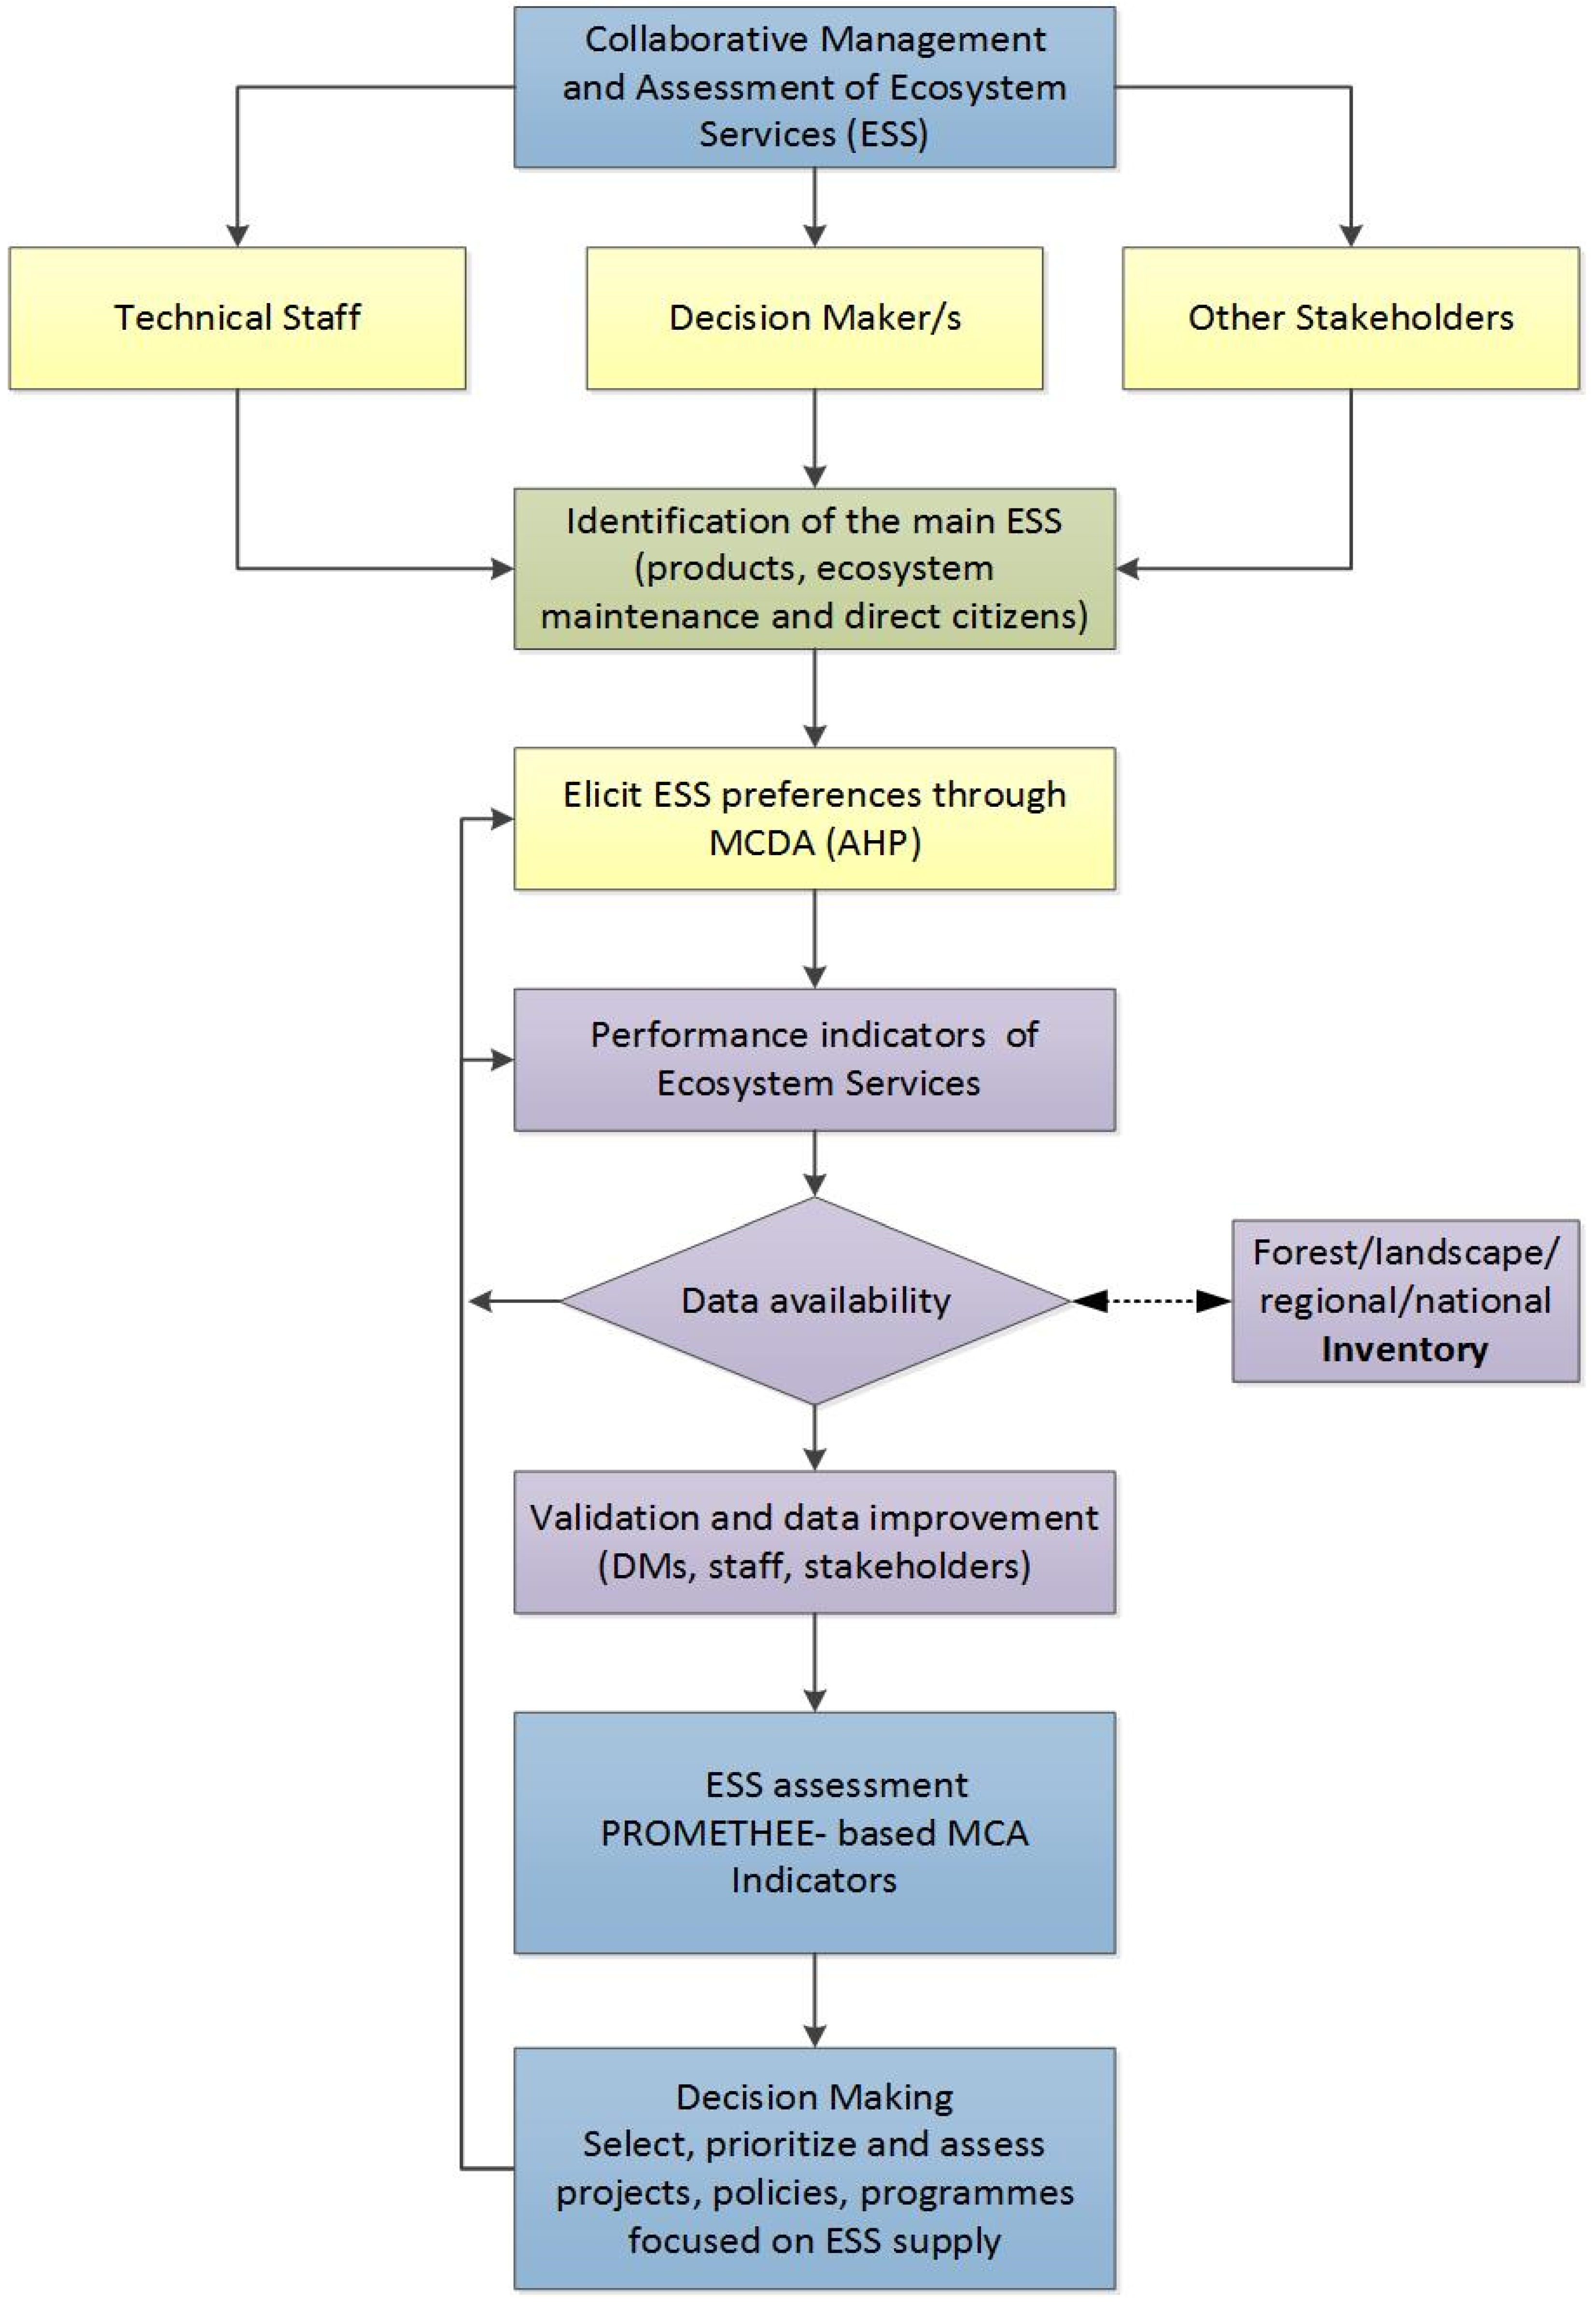
Figure 1 summarizes the methodology developed to deal with the problem about how to manage the territory and to assess all relevant ESS, taking stakeholder preferences into account. The involvement of stakeholders is important for implementing good governance and management, which is characterised by legitimacy as an attribute of quality in protected areas governance [
35] and there is a wide consensus that the preferences of stakeholders should be taken into account in decision making related to the management of natural resources [
11] and ecosystem services [
17].
According to Belton and Stewart [
29], the first step in structuring a problem for multicriteria analysis is to identify relevant stakeholders. Banville
et al. [
36] and Harrison and Qureshi [
37] focus on the inclusion of stakeholders in multiple criteria decision making. The latter also stress the importance of ensuring the representativeness of stakeholders over merely having many stakeholders. To effectively implement collaborative management of ESS, it is necessary to identify and distinguish three stakeholder groups: decision makers, who have the power to select the strategic alternatives; the technical staff who choose the technical solutions to implement selected alternatives; and a broad group of other stakeholders which includes all people with an interest in some aspects of ESS (for example: landowners, companies, municipalities, experts, environmentalists, citizens,
etc.).
Figure 1.
Methodology for implementing collaborative management and assessment ecosystem services.
Figure 1.
Methodology for implementing collaborative management and assessment ecosystem services.
The role of technical staff is essential for the identification of ESS because they know the natural area, its weaknesses and strengths. Nevertheless, all points of view have to be taken into account for the complete identification of ESS and to secure the engagement of decision makers, technical staff and other stakeholders.
The next steps of a multicriteria analysis are the identification of criteria and alternatives for evaluation. The intention is that the views of these three stakeholder groups should inform the design of a hierarchical model which captures all relevant ESS classified by key functions. The hierarchy defines the criteria which provide the basis for the multicriteria evaluation of options. The nature of the options to be considered will depend on the specific context of the analysis; for example, this might be choosing between alternative strategies for conservation or assessing the ESS contribution of different regions or parts of territory.
Similarly, the consideration of key uncertainties is also part of problem structuring [
29] and the nature of the specific decision, in particular its timescale, will also determine whether or not this should be a key consideration in an analysis. Recent publications have explored the integration of MCDA and scenario analysis in water infrastructure planning [
38] and water resource planning [
39].
Following this collaborative process of problem structuring, which has identified all ESS and specified appropriate alternatives for evaluation, the next steps of a multicriteria approach call for the assessment of the performance of alternatives with respect to each ESS and the elicitation of the different stakeholders’ perceived importance of, or preference for, the given ESS.
3.3. Determining New Indicators for Assessing Ecosystem Services
The last step of the methodology consists of applying an outranking-based method as a tool to generate new indicators to assess functions of ESS which are obtained from individual indicators and grouped into a single index [
41].
Table 1 represents the evaluation table for m alternatives which will be assessed by best available indicators of ecosystem. In general, there are n indicators for provisioning services, p for maintenance (supporting and regulating) services and t indicators to measure the direct services to citizens to evaluate all m alternatives. These indicators can be quantitative or qualitative in nature and may be organised by function, for example grouping all provisioning services in one category, another category for maintenance services and a third for direct services to citizens. We are interested in maximizing some of them, such as recreational use, and minimizing others such as soil erosion.
Table 1.
Evaluation table of alternatives based on the ecosystem services.
Table 1.
Evaluation table of alternatives based on the ecosystem services.
| Alternatives/Areas | Evaluation Criteria: Indicators of the Ecosystem Services |
|---|
| Provisioning Services | Maintenance Services | Direct Services to Citizens |
|---|
| Ips1 | Ipsi | Ipsn | Irm1 | Irmj | Irmp | Idc1 | Idck | Idct |
|---|
| A1 | Ips1 (A1) | … | Ipsn (A1) | Irm1 (A1) | … | Irmp (A1) | Idc1(A1) | … | Idct (A1) |
| A2 | Ips1 (A2) | … | Ipsn (A2) | Irm1 (A2) | … | Irmp (A2) | Idc1(A2) | … | Idct (A2) |
| … | … | … | … | … | … | … | … | … | … |
| Ai | Ips1 (Ai) | … | Ipsn (Ai) | Irm1 (Ai) | … | Irmp (Ai) | Idc1 (Ai) | … | Idct (Ai) |
| … | … | … | … | … | … | … | … | … | … |
| Am | Ips1 (Am) | … | Ipsn (Am) | Irm1 (Am) | … | Irmp (Am) | Idc1(Am) | … | Idct (Am) |
The PROMETHEE method requires information on the weights of the relative importance of the indicators, which is w1, w2…wk, normalised to sum to 1. As PROMETHEE does not provide any mechanism to elicit them, we have proposed AHP to elicit individual weights and the geometric mean to determine an aggregate weight for a group of stakeholders. The PROMETHEE process for eliciting preferences with regard to alternatives is also based on pairwise comparisons, but of a different nature to those used in AHP. In this case, comparisons are based on the difference between the evaluations of two alternatives on a particular indicator. The larger the difference between evaluations of the alternatives, the greater is the preference (up to a limit) of the preferred alternative. When the difference is small, it can be considered to be negligible. These preferences are represented by real numbers between 0 and 1 and allow ESS measured in different units to be integrating. A different preference function can be proposed for each indicator. In ESS assessment, some preference functions with one or two parameters specifying an indifference threshold and a strict preference threshold are interesting. The former is the value of the largest deviation on an indicator that is considered to have a negligible impact on preference (
i.e., a relative preference value of 0) when comparing two alternatives. The preference threshold is the smallest value of the deviation between alternatives to be considered as sufficient for a strict preference of one alternative to another (
i.e., a preference value of 1). A detailed explanation of the method and preference functions can be found in Brans and Mareschal [
42].
The usefulness and relevance of this methodology, a novelty for collaborative decision making and assessment ecosystem services, is illustrated in the case study. The proposal is based on PROMETHEE. This method is easy to use and permits the calculation of new indicators to assess ESS. A two dimensional visualisation that represents the three indicators facilitates the evaluation of the projects or programmes in natural parks, by showing the relationship between provisioning, maintenance and cultural services and the assessment of ESS, providing basic indices of their supply. The latter could complement the economic valuation from the viewpoint of ESS demand, such as contingent valuation.
4. Case Study
4.2. Network Survey, Data Analysis and Results
As an exploratory study, a survey was designed and carried out in order to identify the importance of the main ecosystem services provided by the natural park network, taking into account the points of view and preferences of decision makers, technical staff and other stakeholders. The questionnaire is based on a Likert-type scale, one of the most widely used approaches to obtain social preferences as it is easy to understand, and this scale has been used in research in protected areas [
7,
8,
9].
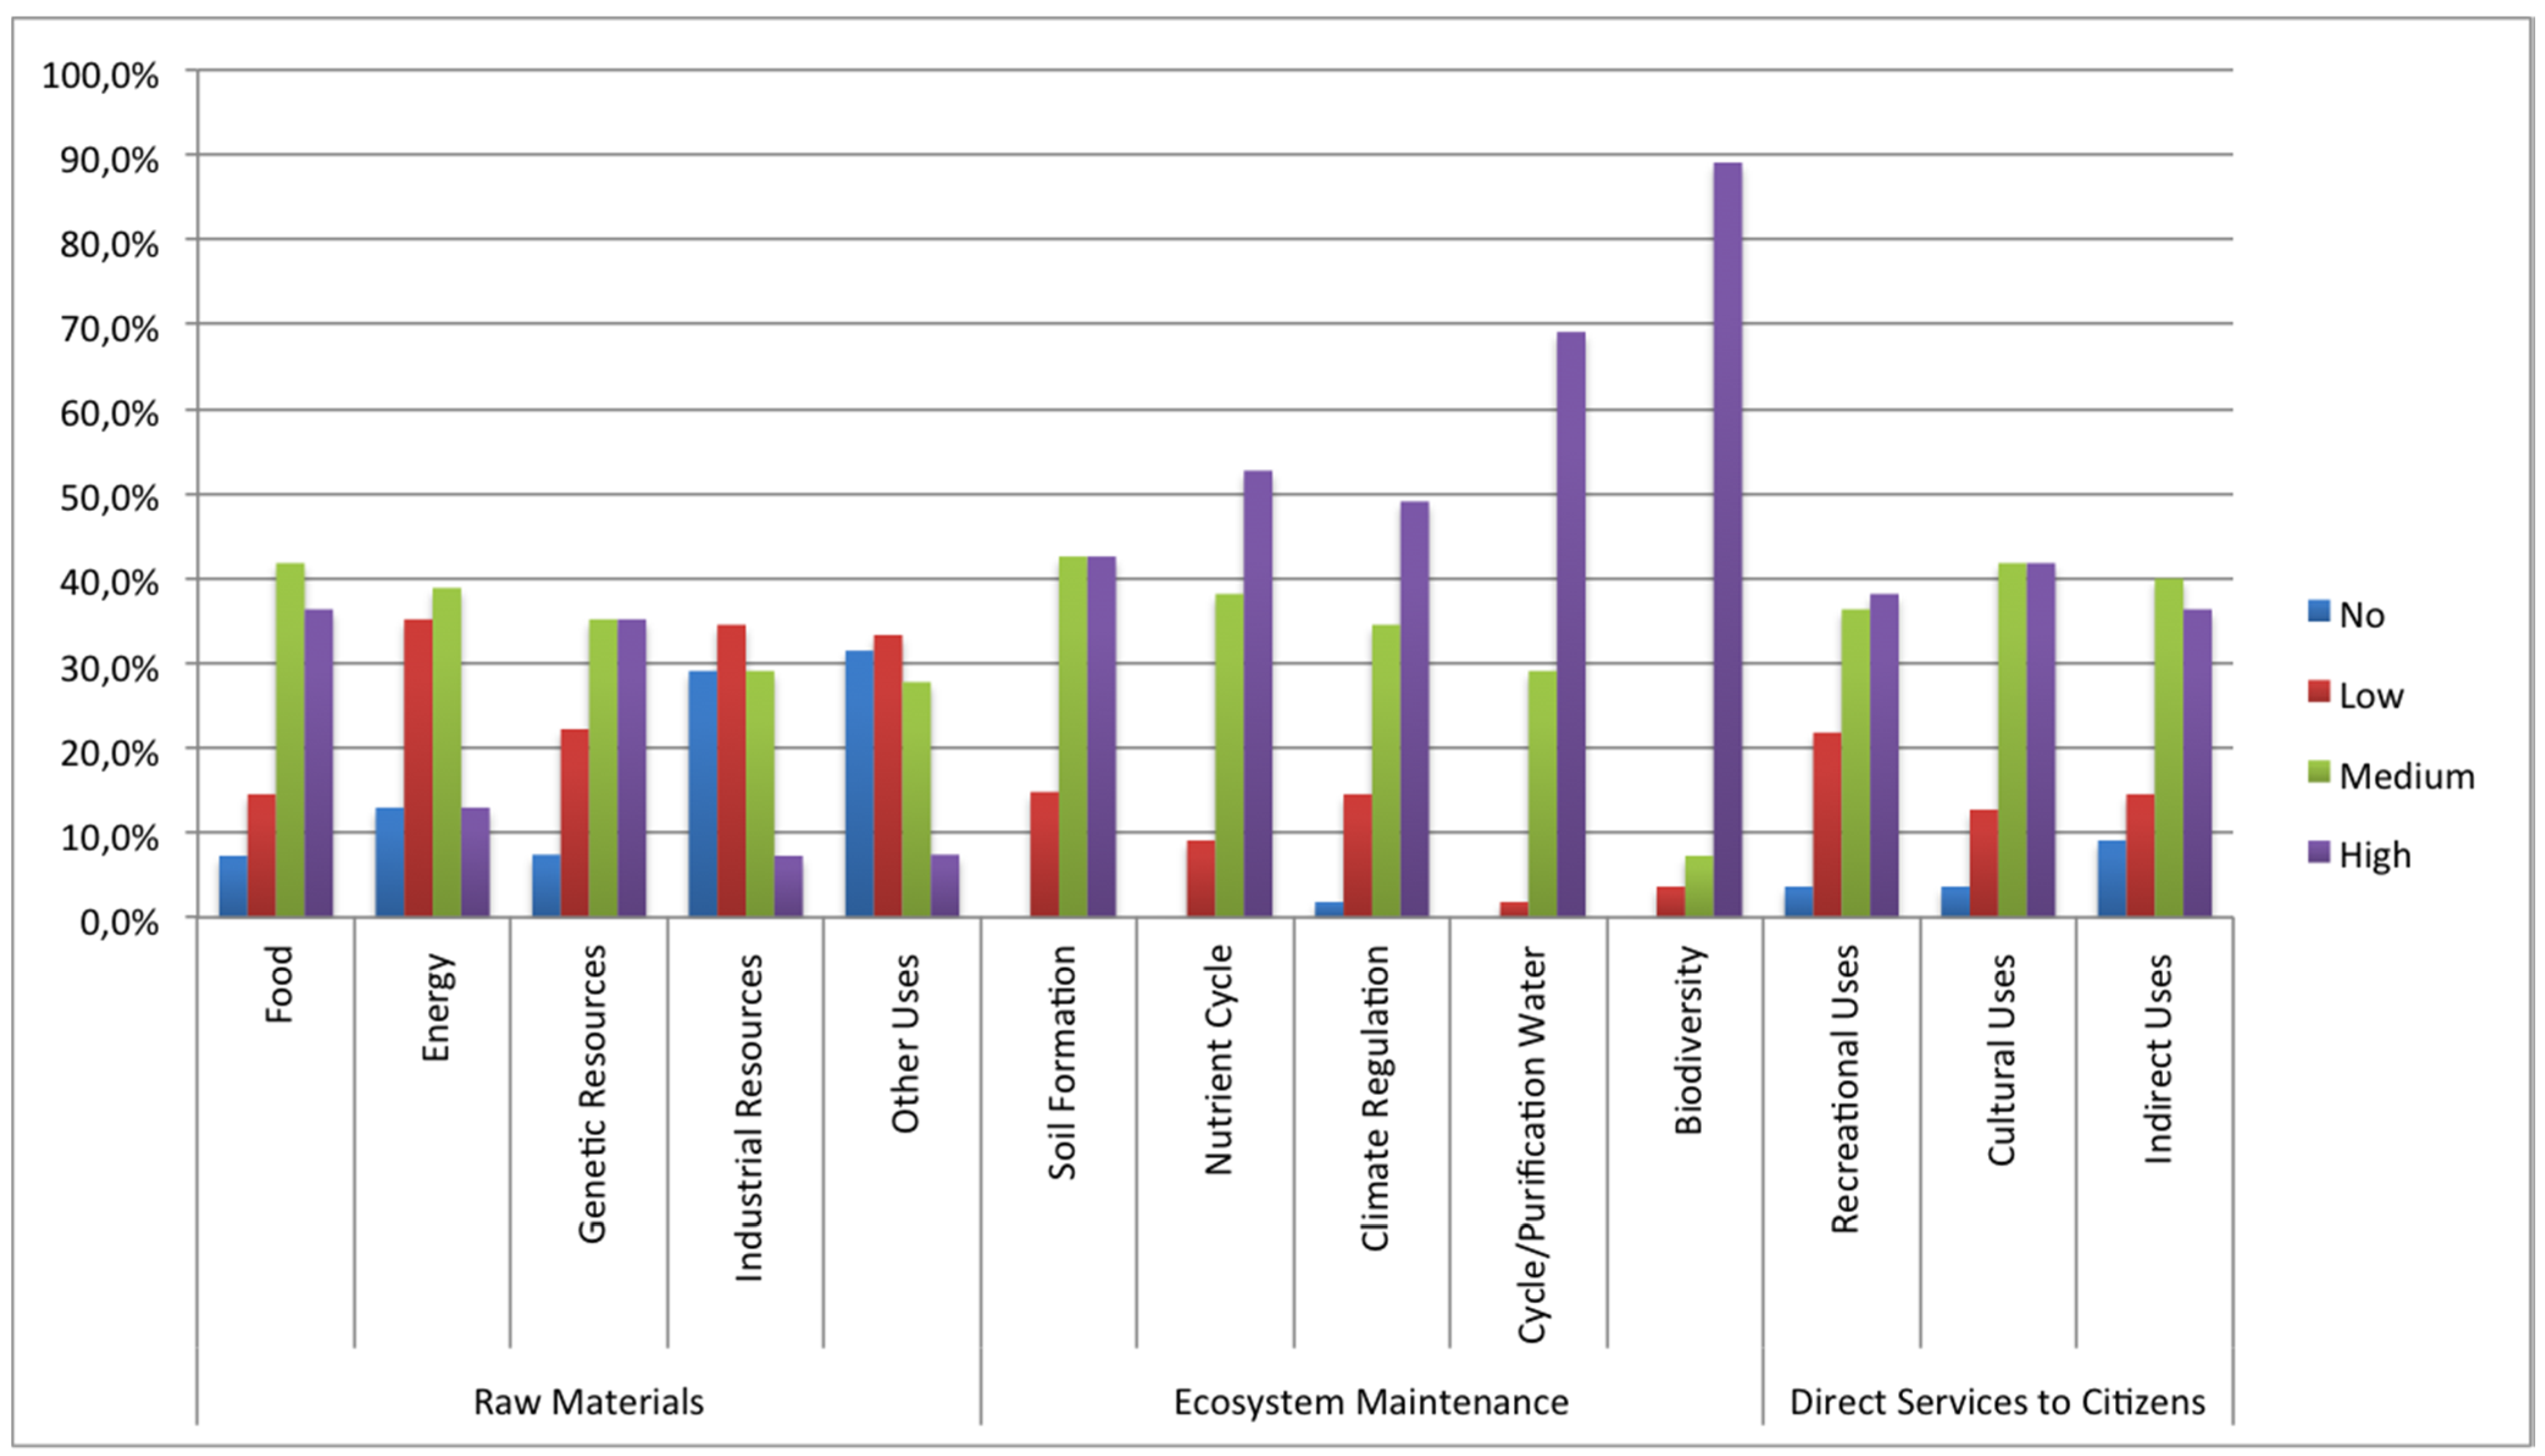
The ESS provided by each natural park are grouped in three categories. The first one includes provisioning services, which are raw materials, such as food, energy (firewood or biomass), genetic resources, industrial resources (timber) and other uses (e.g., pharmaceutical or textile). The second category, ecosystem maintenance, includes both regulating and supporting services. The services which maintain the ecosystem are soil formation, nutrient cycle, climate regulation and cycle/purification water and biodiversity. Finally, the third group includes the direct services to citizens for recreational, cultural and indirect uses, e.g., tranquility or inspiration [
45,
46,
47]. The survey offers four levels to measure the importance of ESS: null, low, medium and high.
A pilot survey was carried out to test a preliminary version of the questionnaire with several experts in protected area management from academia, government agencies and businesses. Firstly, the questionnaire (annex 1) was sent to all natural parks of the Valencian Community, to be answered by the decisions makers, technical staff and other stakeholders (October 2012). Secondly, the particular survey of the Albufera wetland was distributed among citizens using the social networks Facebook, LinkedIn and Twitter (December 2012). Citizens interested in conservation of protected areas are usually not involved in the decision making of natural parks, their involvement being a step forward in the management of protected areas. In both cases, the Survey Monkey platform was used for sending and collecting data.
The total number of questionnaires analysed was 56, 21 of them are from wetlands and 35 from forest parks. All of the directors of the natural parks answered the survey. The highest stakeholder participation appears in Serra d’Espadà and Albufera. In this latter park, 90 citizens also responded to the questionnaire through social networks.
The data processing has been carried out through a descriptive analysis of the percentage of people that gave the highest valuation for each item in the questionnaire. This is a usual method in the assessment of the management of protected areas. A Pearson’s Chi-squared method was used for the significance test to analyse the observed differences in the data. To identify differences between wetlands and forest areas, a Mann-Whitney U test has been used. In the study, we accepted the statistical significance when P-value is less than 0.05. Statistical analyses were undertaken using EXCEL spreadsheet and statistical software SPSS 16.0. We assessed the internal consistency of the survey to determine whether several variables, which were proposed to measure the same general fact, produce similar scores. To that end, we have used Cronbach’s alpha, a statistic calculated from the pairwise correlations between items, and it is known as a measure of internal consistency. If the Cronbach’s alpha is greater than 0.7, which was the case for our survey, it is considered a well-built survey.
Figure 2 shows the results of the ESS importance in the Natural Park Network for decisions makers, technical staff and other stakeholders. Almost all respondents attribute some importance to ecosystem maintenance services, 90% or more to direct services to citizens, and there are fewer people who assign importance to provisioning services. In the latter case, it is interesting to distinguish between wetlands and forest. Goods provided by the ecosystems in forest natural parks in the Valencian Community do not have high importance for the majority of stakeholders. Most of the respondents consider that food, energy, and genetic resources have medium importance. The industrial resources and other uses such as pharmaceuticals and textiles have low–medium importance. Nevertheless, in the Albufera wetland, more than half of the stakeholders consider that food raw materials have high importance, because the rice crop is very relevant in this protected area. Another product also has high importance, as there is an important salt industry in another wetland of the region.
Maintenance ESS have high importance, especially because of biodiversity with 89% of the respondents expressing this opinion. According to the proportion of people, biodiversity is followed by water cycle with 70% while approximately 40%–50% of respondents assigned high importance to climate change regulation, nutrient cycle and soil formation. These numbers are similar for both forests and wetlands.
Figure 2.
Percentage of decision makers, technical staff and other stakeholders by importance degree assigned to ecosystem services in the Natural Park Network.
Figure 2.
Percentage of decision makers, technical staff and other stakeholders by importance degree assigned to ecosystem services in the Natural Park Network.
More differences appear in the analysis of data from direct ecosystem services to citizens. In this case, proportions of stakeholders with medium importance or high importance are approximately 50% for wetlands and less for forests. Recreational uses have significant differences. For more than half of the stakeholders, this service is very important in wetlands, but this percentage drops to 28% in forests. The recreational use is also notable as since there are more people who assign low importance rather than high in the case of forests. That is, there is a consensus in medium–high importance of recreational uses in wetlands, but this is not the case in forest areas, as the opinions have a balanced distribution among low, medium and high relevance.
4.3. Main Ecosystem Services Hierarchy and Preferences Elicitation
The survey results of the previous section show that decision makers, technical staff, other stakeholders and citizens have great difficulty in prioritizing ESS using a grade scale. This is easy to understand, but not useful in the real context of limited resources, as many people assign high importance to the majority of ESS. However, as a result, their opinions are not useful to support management actions because some ESS conflict with others and this method cannot take into account these relationships. To overcome this pitfall, we can think of assigning weights directly, for example between zero and 10, but the aggregation of these data to obtain group preferences also has drawbacks [
48].
The proposed methodology elicits group preferences for ESS using a well-known collaborative multiple criteria technique because the prioritization of ESS is necessary in order to manage natural areas with scarce resources and support decisions. This methodology was applied in the context of the Serra d’Espadà natural park.
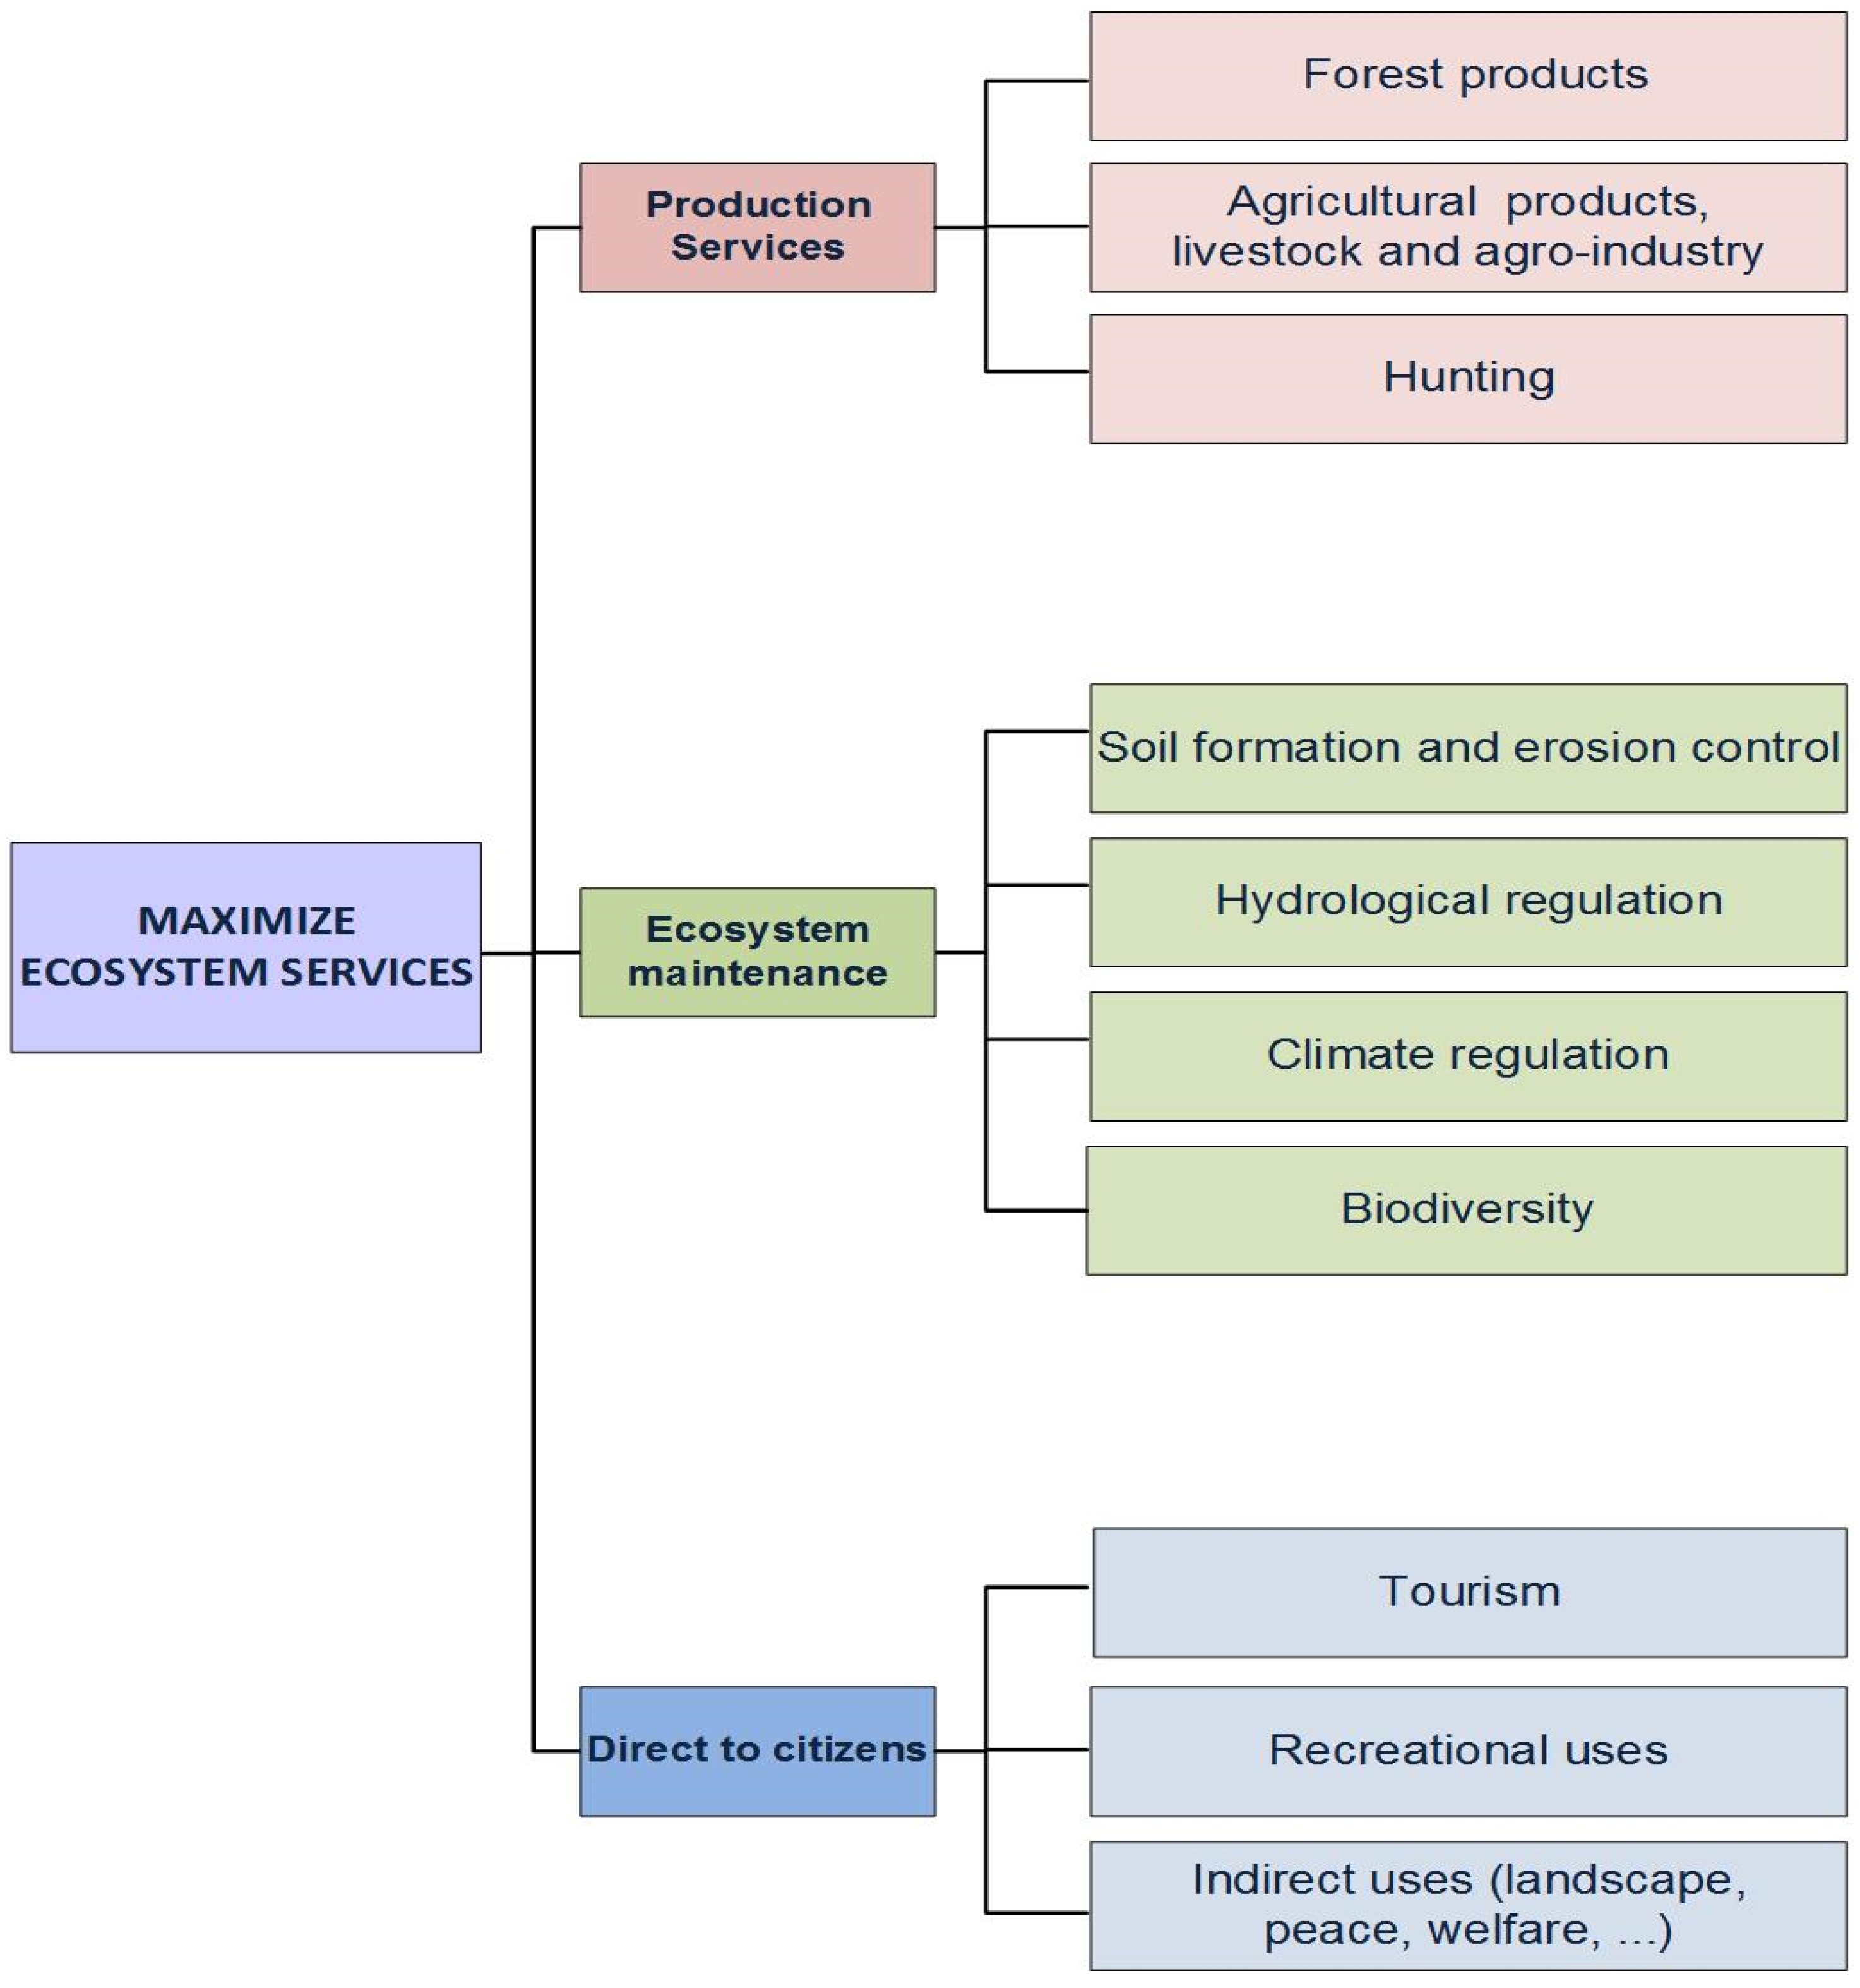
First, we identified the ecosystem services of the protected area and built the ESS hierarchy with collaboration of decision makers and technical staff of Serra d’Espadà as can be seen in
Figure 3 (December 2013). Second, a survey was designed to elicit the preferences of participants using the AHP method [
49]. The survey (annex 2) was implemented in an Excel spreadsheet in order for the respondents to have access to the ESS weights resulting from their individual answers and also to be able to access their inconsistency index. If this index was greater than 0.10, the questionnaire indicated this and allowed the respondents to change their answers. The questionnaire was sent to the director, technical staff and board of stakeholders of the natural park. In some cases, we sent the survey on paper at the request of stakeholders. We received 14 answers, five from decision makers and technical staff, five from forest researchers and four from representatives of local administrations. One of them sent the answers on paper. Eleven percent of pairwise comparison matrices had an index of inconsistency greater than 0.10. These have been eliminated from the analysis.
Figure 3.
Ecosystem services hierarchy of Serra d’Espadà Natural Park.
Figure 3.
Ecosystem services hierarchy of Serra d’Espadà Natural Park.
Table 2 shows the preferences for ESS grouped by functions and stakeholders. These have been calculated with the same weights for all respondents and using the geometric mean [
50]. All stakeholders consider that the maintenance of ESS is the most important function of the natural park. Researchers give more importance to direct services to citizens than production services. However, the weight of production services is higher for decision makers/staff and especially for representatives of local administration.
Table 2.
Preferences for ecosystem services by functions and group of stakeholders in percentage obtained by AHP method.
Table 2.
Preferences for ecosystem services by functions and group of stakeholders in percentage obtained by AHP method.
| Stakeholders | Ecosystem Services Weights in Percentage |
|---|
| Production Services | Ecosystem Maintenance | Direct to Citizens |
|---|
| Decision maker/staff | 27.0 | 54.0 | 19.0 |
| Local administration | 32.1 | 48.1 | 19.8 |
| Researchers | 16.4 | 60.4 | 23.2 |
| Total | 25.4 | 54.3 | 20.3 |
The global preferences for all ESS can be seen in
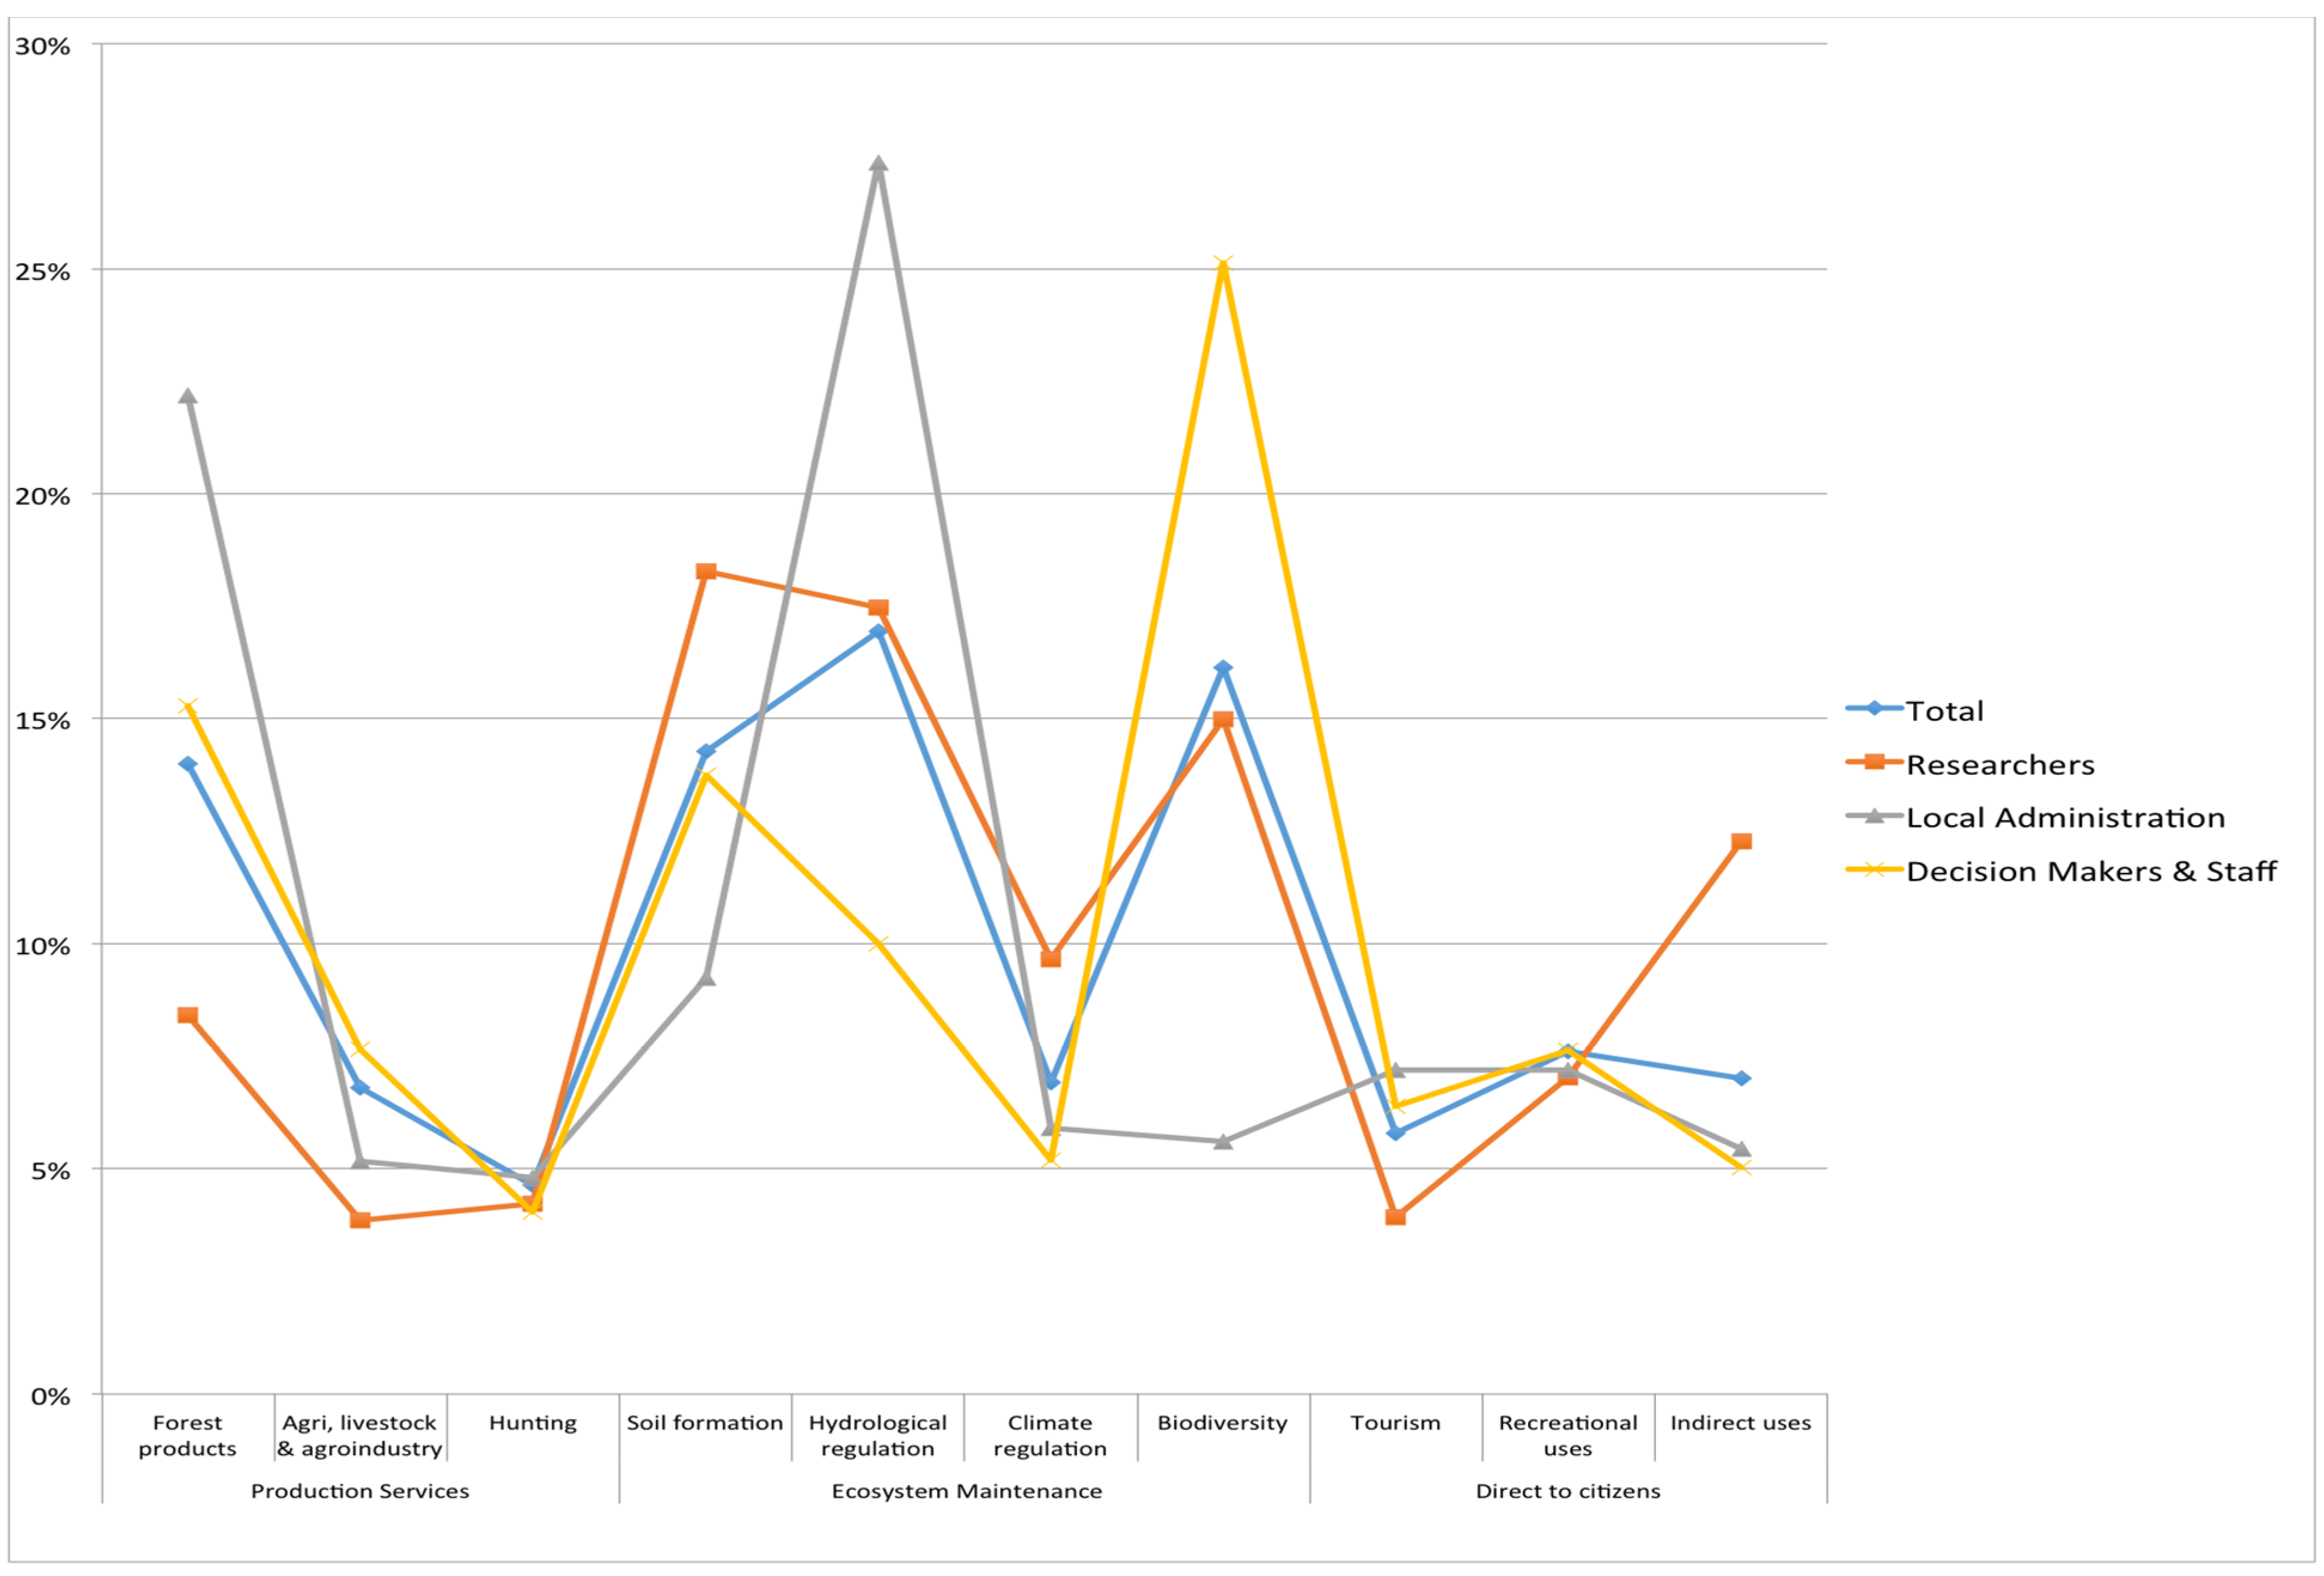
Figure 4. Forest products (cork, timber, biomass, mushrooms…) are the most important provisioning services for all stakeholder groups. Agricultural products, livestock and agro-industry rank second in importance for all groups except for researchers. The latter give a little more importance to hunting.
Figure 4.
Ecosystem services preferences (%) by stakeholder groups in the Serra d’Espadà Natural Park.
Figure 4.
Ecosystem services preferences (%) by stakeholder groups in the Serra d’Espadà Natural Park.
The major differences between the preferences of stakeholders appear in the services of ecosystem maintenance. Forest researchers give more importance to soil formation and hydrological regulation, while biodiversity and climate regulation have less relative importance. Hydrological regulation presents the greatest weight for local administrations for whom all other ecosystem maintenance services are less important, whereas soil formation has higher value. On the other hand, biodiversity is the most important to decision makers/staff, followed by soil formation and hydrological regulation, and for this group climate regulation is the least important service.
In direct services to citizens, decision makers/staff and local administrations give more importance to recreational uses and tourism. In addition, local administrations also assign the same importance to both. The indirect uses are the most important for researchers in comparison with other stakeholders. The weight of recreational uses is similar for all stakeholders, showing a great consensus on this aspect.
4.4. Obtaining New Indicators
Each ESS represented in
Figure 3 has to be measured using one or more indicators, such as economic value of products, hunters, degree of soil erosion, number of flora micro-reserves, number of fauna micro-reserves, number of endangered species, number of paths, number of areas of public use, landscape quality,
etc. [
51]. As an example,
Table 3 represents the evaluation table for five zones of the natural park including one indicator for all ESS of the Serra d’Espadà Natural Park (
Figure 3), except for biodiversity which has two indicators. These two indicators, which measure the biodiversity performance, have the same weight, each one 50%. Although the numbers in
Table 3 are hypothetical, the method based on PROMETHEE has been applied using the ESS weights obtained in the case study (
Table 2). All ESS were maximized, except soil erosion and number of endangered species which were minimized. The example considers two types of PROMETHEE preference functions: usual and linear. The former attributes strict preference to the best zone and it was used for all five indicators of maintenance services. The linear preference function increases with the deviation between evaluations and it was used for all criteria related to provisioning services and direct services to citizens. We also consider several indifference and strict preference thresholds. Their values and criteria weights are shown in
Table 4.
Table 3.
Evaluation table for five zones of the Serra d’Espadà natural park.
Table 3.
Evaluation table for five zones of the Serra d’Espadà natural park.
| | Evaluation Criteria: Indicators of the Ecosystem Services |
|---|
| | Provisioning Services | Maintenance Services | Direct Services to Citizens |
|---|
| | IP11 | IP21 | IP31 | IM11 | IM21 | IM31 | IM41 | IM42 | IDC11 | IDC21 | IDC31 |
|---|
| Zone 1 | 3,000 | 1750 | 200 | 1 | 3 | 4 | 20 | 6 | 3000 | 10 | 4 |
| Zone 2 | 800 | 650 | 700 | 3 | 4 | 5 | 16 | 7 | 20 | 20 | 5 |
| Zone 3 | 150 | 3500 | 50 | 3 | 1 | 3 | 9 | 0 | 100 | 2 | 1 |
| Zone 4 | 10,000 | 4000 | 1100 | 3 | 1 | 3 | 25 | 1 | 6000 | 5 | 3 |
| Zone 5 | 200 | 900 | 700 | 4 | 5 | 5 | 8 | 10 | 0 | 1 | 2 |
Table 4.
Preferences functions and parameters for ESS indicators.
Table 4.
Preferences functions and parameters for ESS indicators.
| ESS | Criteria | Min/Max | Function | Indifference Threshold | Preference Threshold | Weight |
|---|
| Forest Product | IP11 | Maximize | Linear | 200 | 2000 | 14.0% |
| Agri., livestock & Agroindustry | IP21 | Maximize | Linear | 200 | 3000 | 6.8% |
| Hunting | IP31 | Maximize | Linear | 0 | 300 | 4.6% |
| Soil formation | IM11 | Minimize | Usual | | | 14.3% |
| Hydrological regulation | IM21 | Maximize | Usual | | | 16.9% |
| Climate regulation | IM31 | Maximize | Usual | | | 6.9% |
| Biodiversity | IM41 | Minimize | Usual | | | 8.1% |
| IM42 | Maximize | Usual | | | 8.1% |
| Tourism | IDC11 | Maximize | Linear | 50 | 3000 | 5.8% |
| Recreational uses | IDC21 | Maximize | Linear | 0 | 5 | 7.6% |
| Indirect uses | IDC31 | Maximize | Linear | 0 | 5 | 7.0% |
PROMETHEE method requires information within criteria in addition to the information between criteria provided by their weights. The pairwise comparison of alternatives with respect to a criterion is based on a preference function that assigns a number between 0 and 1 to the deviation in the criterion value for the two alternatives. For example, when comparing two alternatives or zones with respect to soil erosion (AIM11), the usual function allocated a strict preference to the best option that means 1 as a value of preference. In this case, it is the option with the lower value because soil erosion should be minimized. Zone 1 is always preferred to any other (
Table 3). Nevertheless, there are criteria, such as the economic value of forest products (AIP11), where the preference increases as the deviation between alternatives increases. In this case, we consider that a deviation up to 200 is negligible (
i.e., equals 0), and then the preference value increases linearly up to 1 as the deviation increases from 200–2000, the preference threshold. For example when we compare zones 3 (A3IP11 = 150) and 5 (A5IP11 = 200), although zone 5 is better, PROMETHEE considers both zones equal as the indifference threshold is 200 for this criterion. In addition, since the preference threshold for the criteria AIP11 is 2000, we assign a value 1 for the best option when comparing zone 1 and zone 4, as well as if the comparison is between zones 3 and 4 (
Table 4). The preference functions allow the aggregation of criteria measured in different units. This is made using the concepts of Aggregated Preference Indices (API) and net flows.
In short, to apply PROMETHEE we need to know the evaluation table, the weights of the criteria and the preference functions. We then calculate the API for each pair of alternatives a and b. The API between a and b, π (a, b), is obtained by summing of all preference values multiplied by the weights of criteria. It expresses the degree to which alternative a is preferred to b and π (b, a), the degree to which b alternative is preferred to a. Finally, positive and negative outranking flows are defined after comparing an alternative with the others (x). The positive outranking flow is calculated by summing all API of an alternative π (a, x) and dividing by the number of alternatives minus one. It expresses to what extent an alternative outranks all the others and thereby the strength of the alternative. The higher the positive outranking flow, the better the alternative. Similarly, the method calculates negative outranking flow as the sum of all π (x, a) and indicates to what extent an alternative is outranked by the others. It is an indicator of weakness and an alternative is better when its negative flow is smaller. These measures are used to define the dominance relations of PROMETHEE I, whereby an alternative is classified as preferred, indifferent or incomparable to another.
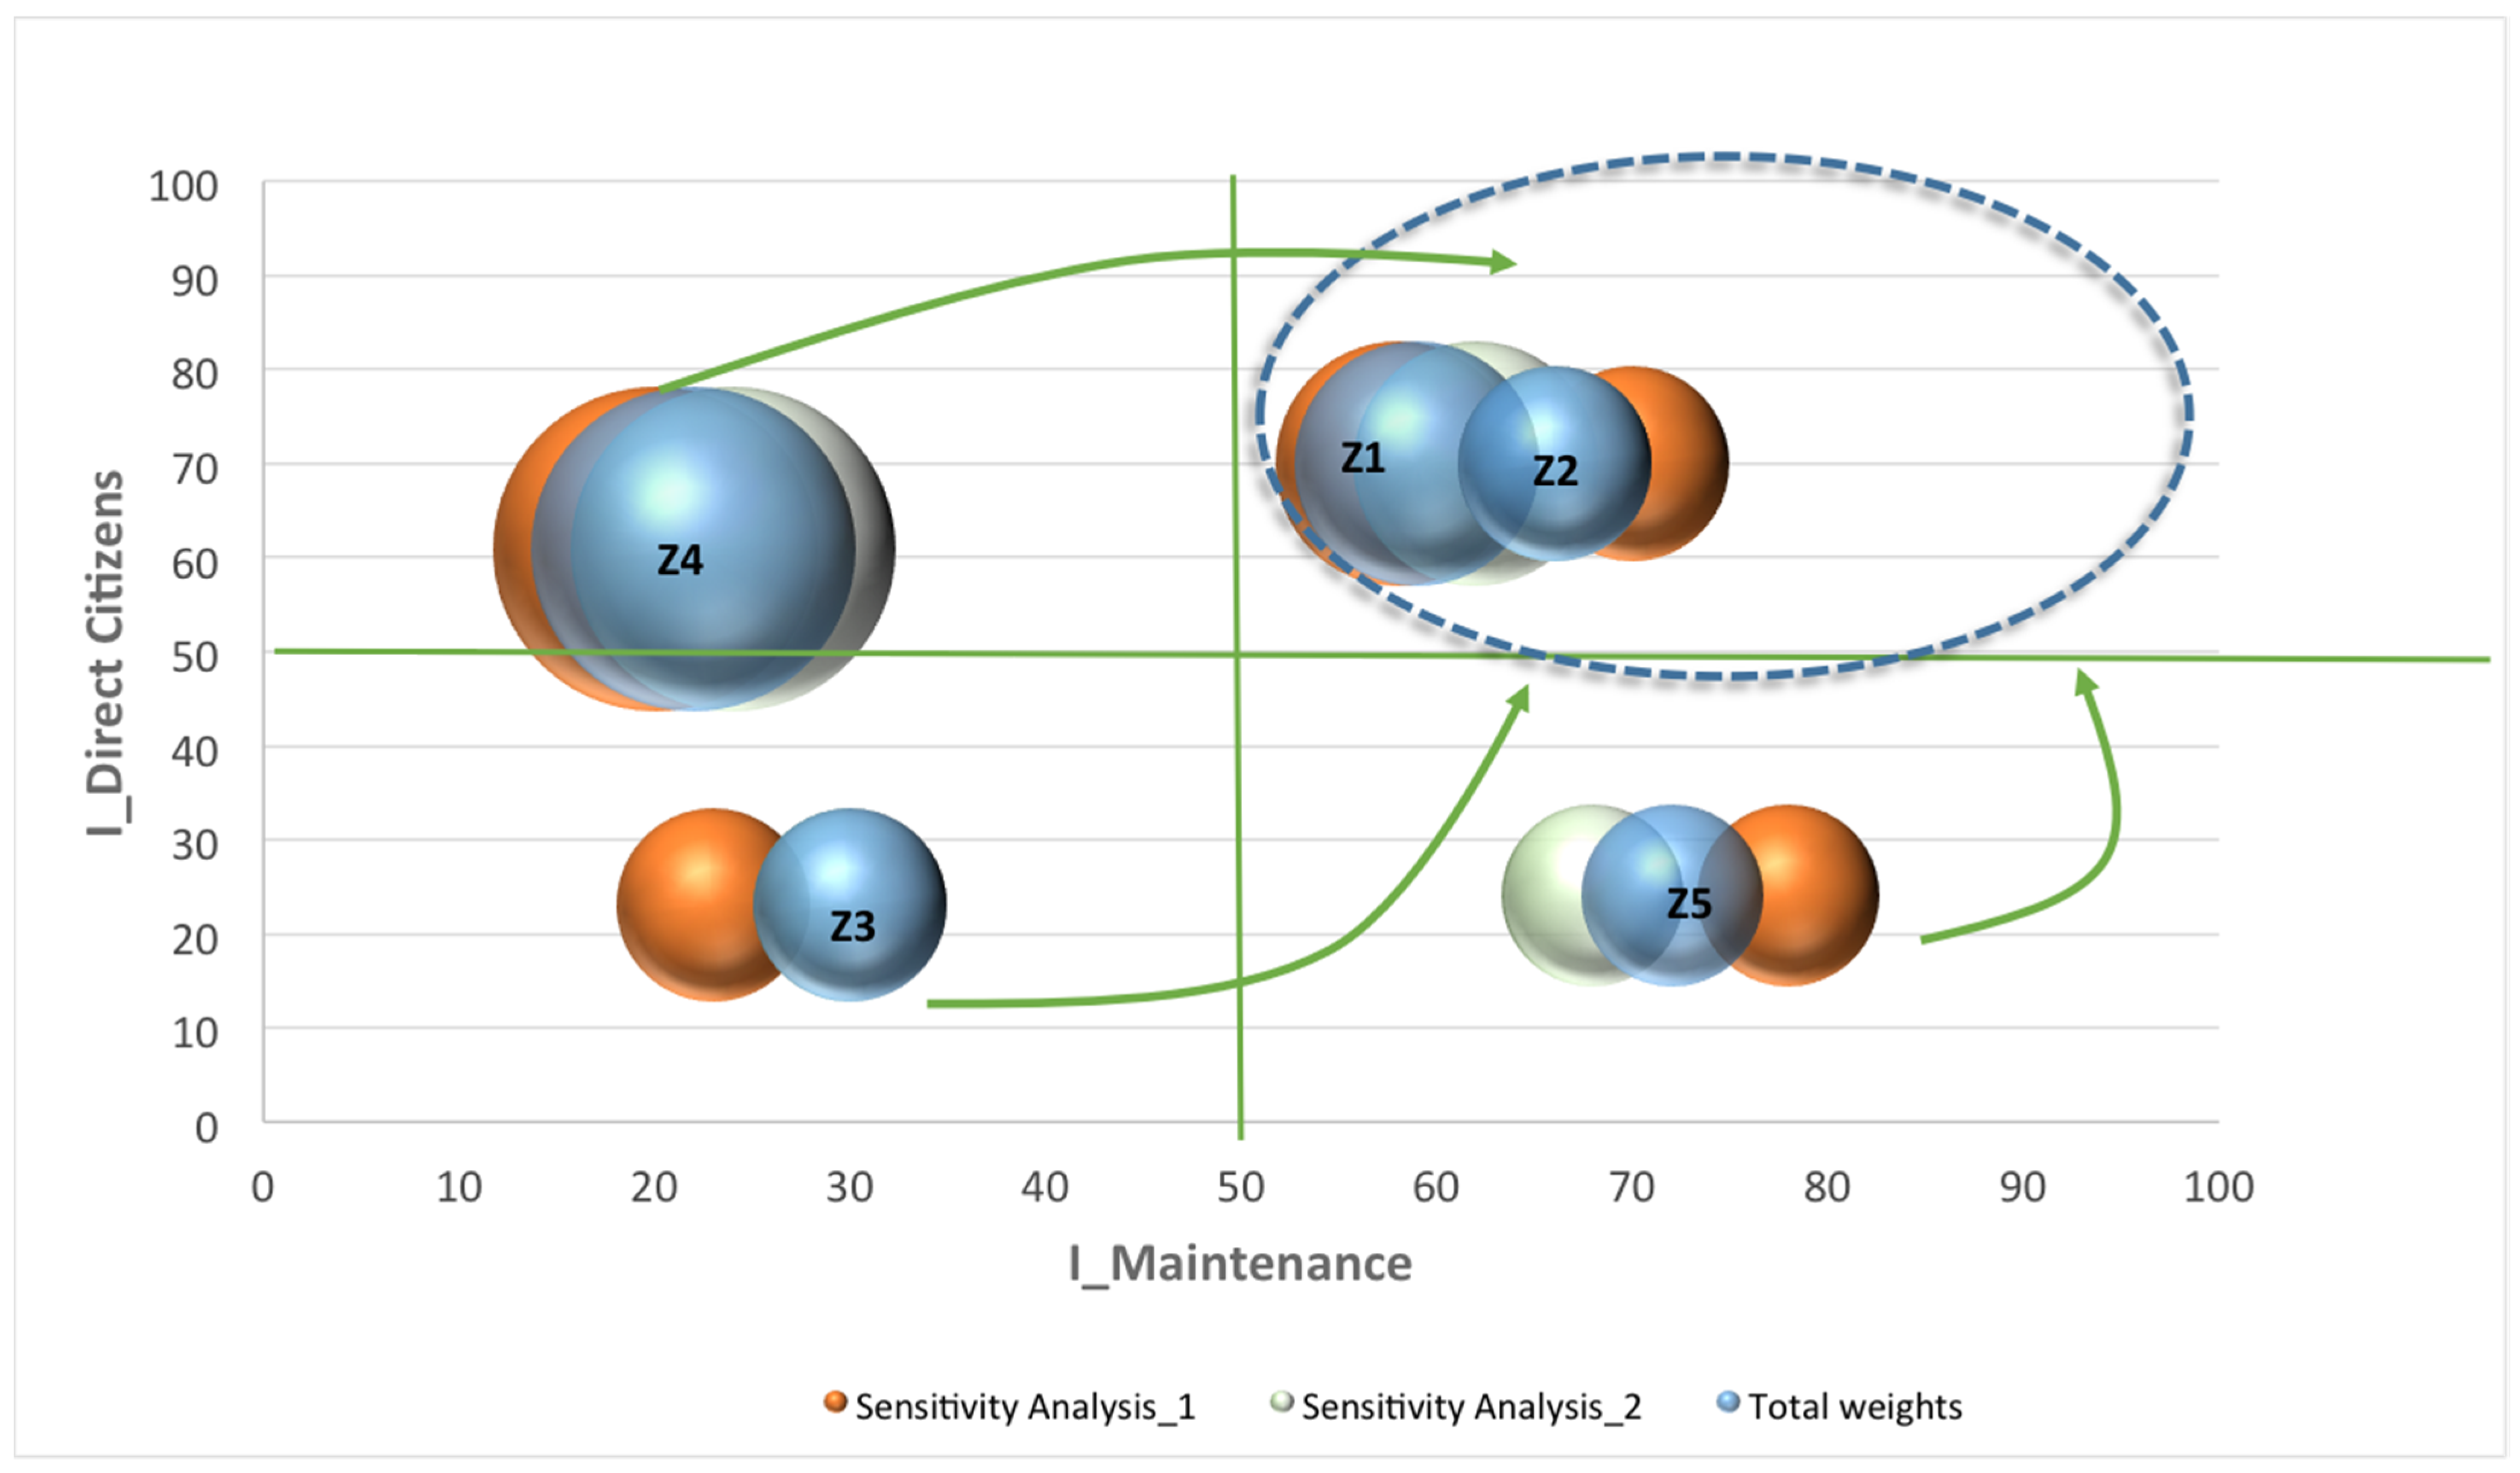
PROMETHEE II defines net flow for an alternative as the balance between positive and negative flows. Applying this method by using D-Sight software the new indicators are obtained and then represented in a bubble chart (
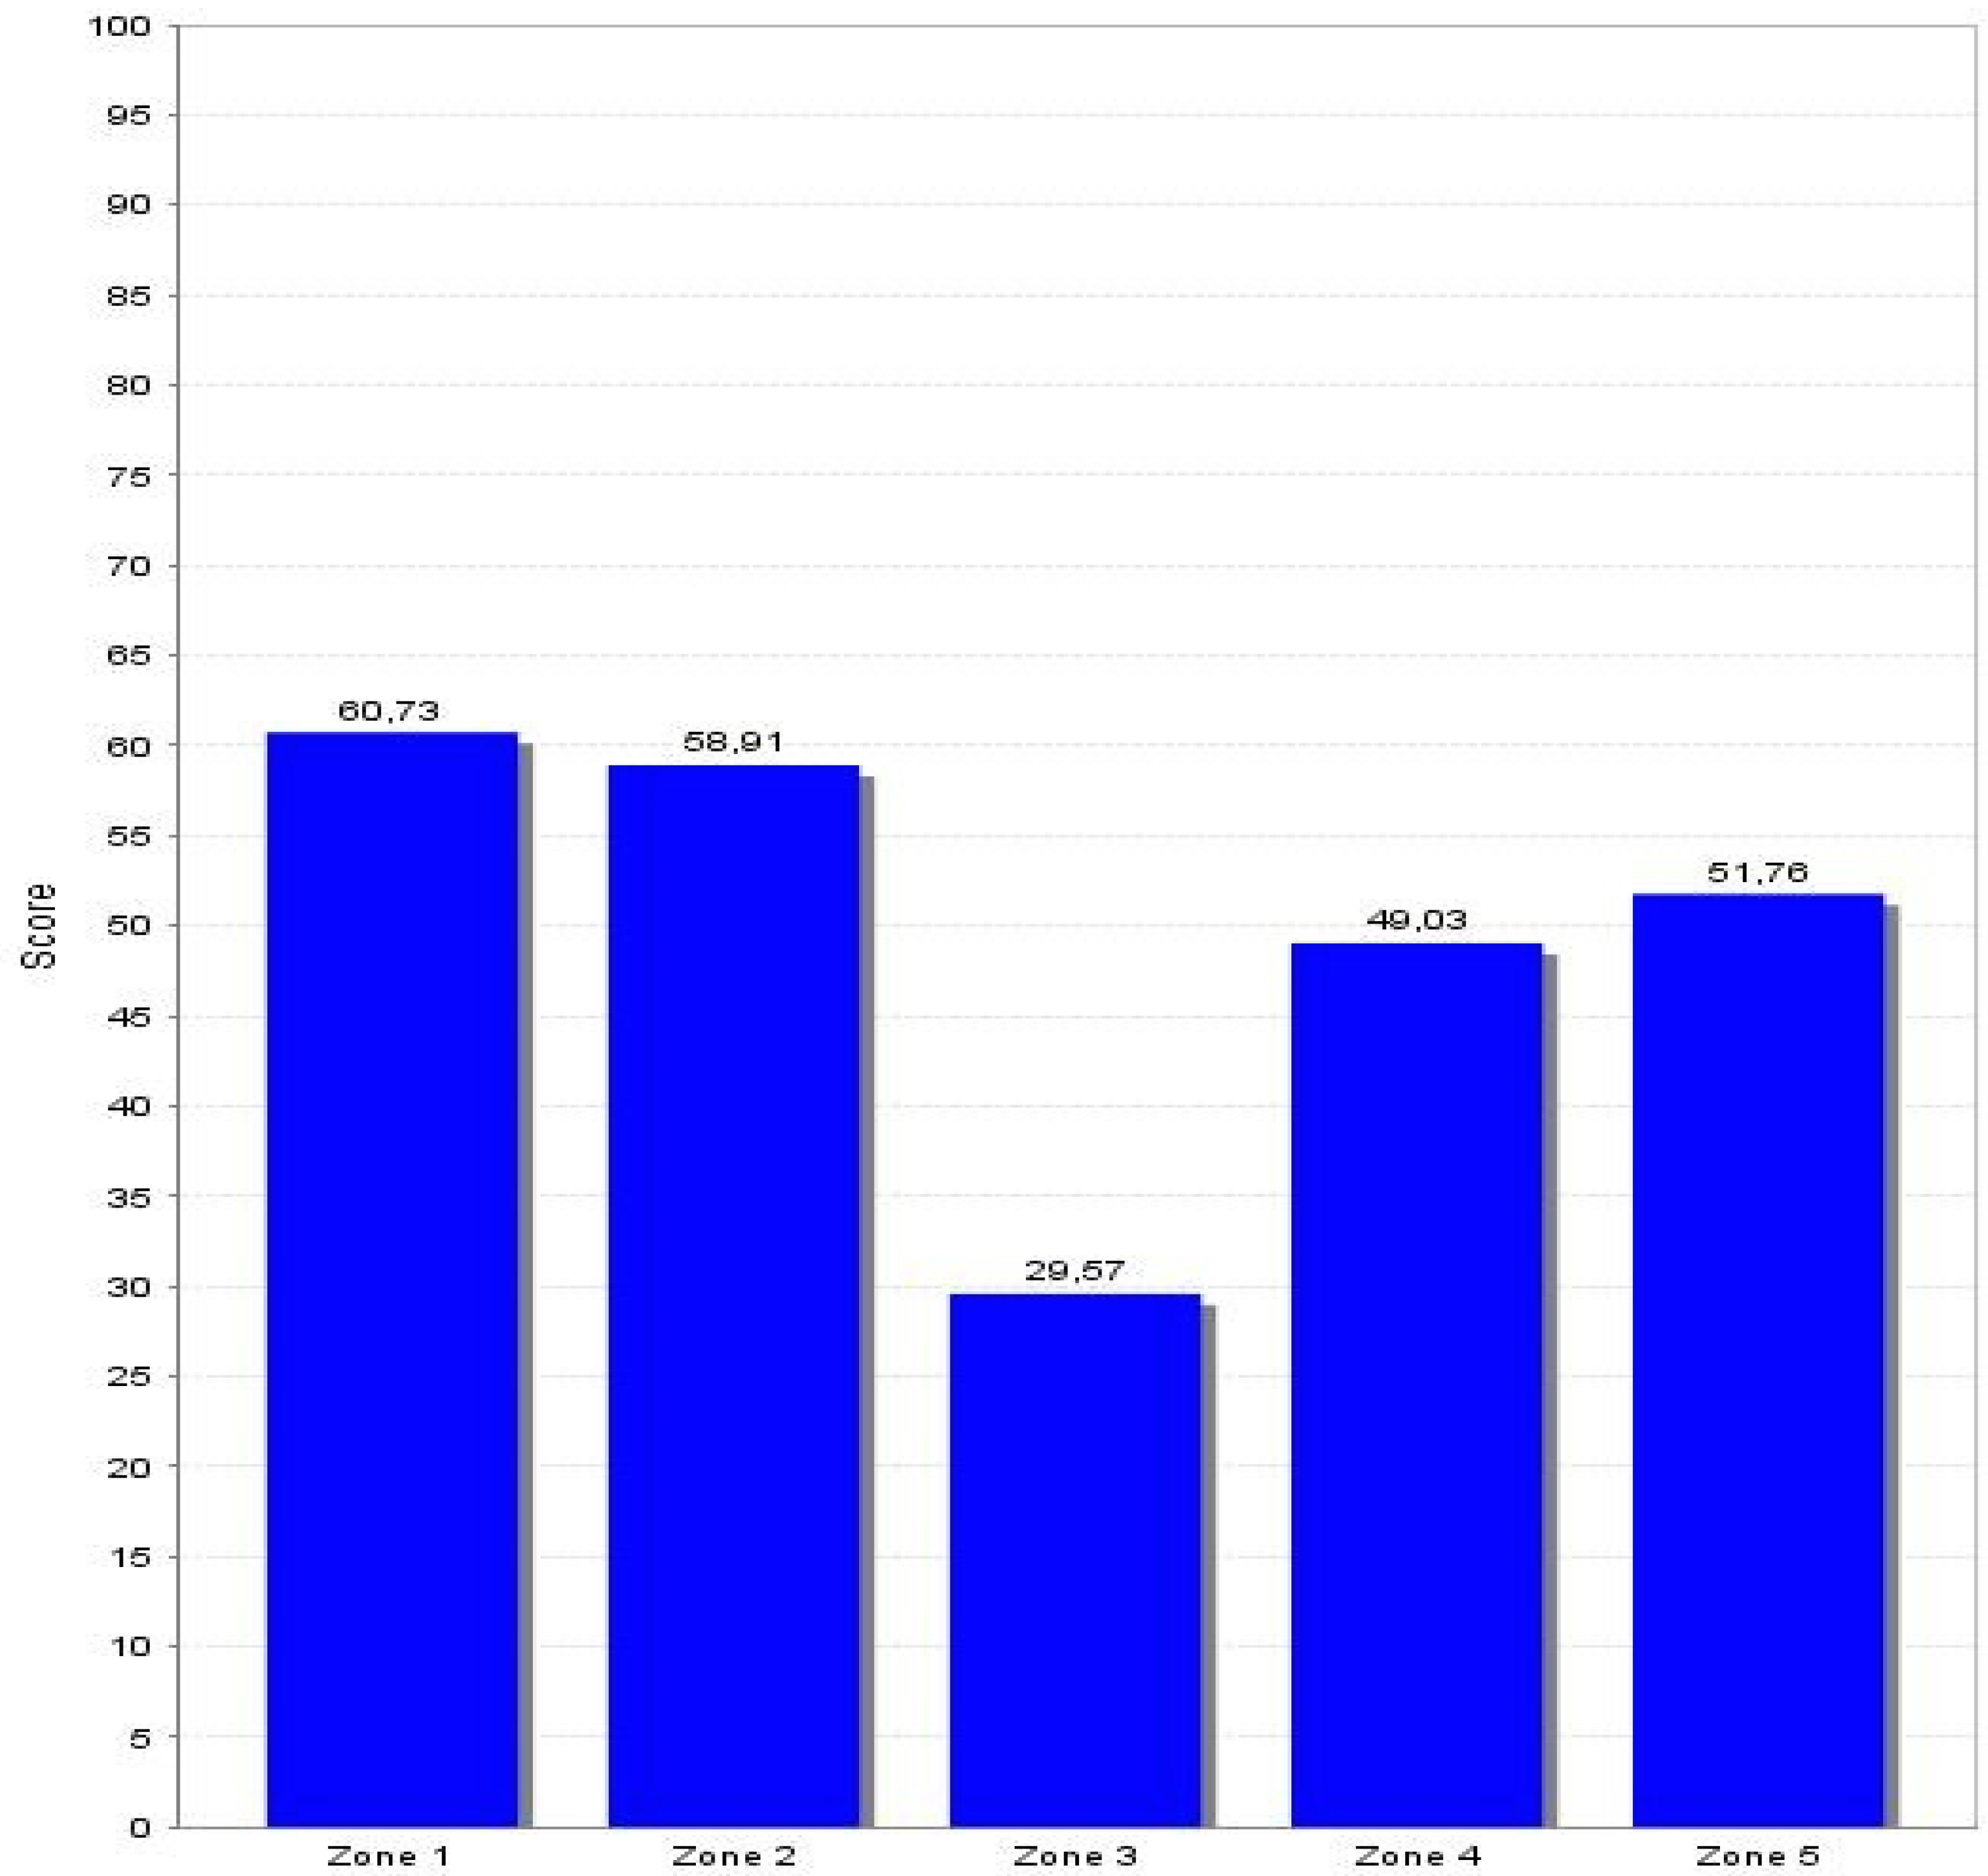
Figure 5). Indicators of maintenance and direct services to citizens define the axes and the relative size of the bubble represents the provisioning indicator. The ideal situation would be if all zones appeared in the area with high values for both indicators and a big bubble. This graphic identifies four areas, the first with high social and environmental values, the second with high environmental value, the third with high social value and the fourth with low social and environmental values. The latter would require a further analysis about, for instance, how to improve the environmental and social performance. This visualisation provides an easy and effective means for decision makers and other stakeholders to understand where and how to focus efforts on new projects to improve the ESS, classified by their nature. This multidimensional representation is more useful than the global index, shown in
Figure 6, which highlights the low performance of zone 3 but with relatively small differences between the other zones. Nevertheless, these differences are important from the point of view of ESS management and assessment, as shown in the blue bubbles from the case study (
Figure 5). In our example, zones 1 and 2 have high performance from social and environmental perspectives, zone 4 has a high social value and also the greatest economic value derived from the products (size of the bubble), while zone 5 has a high environmental value and low provisioning services. Finally, zone 3 will need further analysis to determine the reasons for its low performances and how it can be improved.
Figure 5.
Visual classification of territory (Zones) by main categories of ESS in the Serra d’Espadà Natural Park.
Figure 5.
Visual classification of territory (Zones) by main categories of ESS in the Serra d’Espadà Natural Park.
Figure 6.
Global index by zones in the Serra d’Espadà Natural Park. D-Sight software.
Figure 6.
Global index by zones in the Serra d’Espadà Natural Park. D-Sight software.
We also performed a sensitivity analysis of the weights of maintenance ESS to show the stability in the values of global indicators. The results of the sensitivity analysis determined a wide range of the weights which includes the preference values of the different stakeholders groups. The orange and grey bubbles represent the indicators obtained with extreme values, close to local administration and researchers’ preferences, respectively. Therefore, this visual tool allows stakeholders to see and understand the influence of changing the ESS preferences.
5. Discussion
According to the results of the survey based on a Likert-type scale, the most important ESS is biodiversity in the Natural Park Network of the Valencian Community, in line with international agreements that include it as the main objective of protected areas. This result is also consistent with the regulation of protected areas in the Valencian Community, where the protection categories have been assigned according to their biological resources and values. Ecosystem maintenance is the priority function, being a result consistent with the previous regional studies. Products from forests, mainly timber, have little relevance due to the slow regenerative capacity of the Mediterranean forests [
15].
The responses to the survey indicate that over 40% of respondents (88% in the case of biodiversity), attribute “high importance” to all ecosystem maintenance services and over 80% rate all as medium or high importance. These results are similar for all stakeholder groups and highlight the difficulty in prioritizing ESS directly when decision making has multiple objectives. It was decided to apply AHP in order to focus attention on relative preferences through the use of pairwise comparisons and to achieve greater discrimination. The results of this study confirmed the perceived importance of maintenance services (54.2% of total weight) over provisioning services such as timber, cork, mushrooms, etc. (25.4% weight) and services direct to citizens such as tourism, recreational uses and indirect uses (20.4%). Within maintenance services, biodiversity is important but does not have the highest priority, with hydrological regulation being rated as slightly more important. Hydrological regulation along with biodiversity and soil formation are the most relevant maintenance services. This can be interpreted as follows: the main goal is the sustainable use of resources, through a balance between products, recreation and environmental services, with more emphasis on the latter.
The involvement of stakeholders is a key aspect of the management and assessment of ecosystem services in protected areas. Their collaboration may be difficult due to their lack of experience and/or knowledge about management and decision making techniques. It is important that the adopted methodology is well founded and easy to implement, but also easy for participating stakeholders to understand. This proposed process provides transparency and, through the engagement of relevant stakeholders, ensures legitimacy of the results obtained. Firstly, all stakeholders were involved in defining the relevant ESS. Secondly, their preferences for ESS are elicited using AHP method, and the geometric mean was used to aggregate individual pairwise comparisons. Thus, we use a method to obtain consistent preferences easily, and the stakeholders’ preferences as a group are also consistent [
33], as well as other properties in aggregating the rating of a panel [
48]. In addition, sending the questionnaires as an Excel file and offering the inconsistency index immediately permitted a low value of inconsistent responses in comparison to other studies [
52]. This method can be implemented smoothly in the website of protected areas as a mechanism to update preferences periodically. In this way, the stakeholders can be involved in collaborative management on an ongoing basis by participating in setting the weights they believe should be allocated to each ESS; sensitivity analysis shows the effect on decisions when these weights are changed. The second last step of the methodology, ESS assessment, has been carried out with hypothetical data in the case study. This is due to the lack of available real data.
In the analysis described here, we have used AHP as a method to obtain and aggregate preference (weightings) for ESS. AHP could also be useful to select and prioritise strategic alternatives in the management of ecosystem services, by using pairwise comparison of the performance of alternatives in relation to every ESS. However, empirical studies have shown that only the most expert stakeholders are capable of meeting the consistency requirement of the method when comparing alternatives with respect to technical performances [
15]. Thus, AHP is advisable for selecting and ranking alternatives when there are no data available for the indicators for ESS. Similarly, AHP alone is not a suitable approach to achieve our second objective of classifying zones in protected areas that would not only be able to inform the best actions, but also be a mechanism to zone the territory. A very relevant application of that approach would be the establishment of a system of PES and the distribution of European funds of Natura 2000 Network, the centrepiece of European Union (EU) nature and biodiversity policy, depending on the contribution of areas to ecosystem services.
Our methodology proposed an approach based on PROMETHEE that compares alternatives taking technical data into account, which can be quantitative and qualitative. It is more credible in the specific context than a method based on expert judgements that would not be acceptable by stakeholders who do not have technical knowledge of ESS and may not be able to articulate consistent preferences. It could also have been appropriate to use a value function approach to incorporate technical measurements [
29]. In addition, AHP has some disadvantages, such as 9-point scale, the number of evaluations needed and rank reversal problem, although the latter is also a weakness of PROMETHEE.
Our methodology only compensates ecosystem services inside the same function (provisioning, maintenance and direct to citizens), but not between them. Thus, we apply PROMETHEE to each of these three groups of ESS independently and then display the results as a bubble graph, which illustrates the relative value of maintenance services and direct to citizens services. The majority of these services do not have economic value in the market, but they have a high value for the society. Zones within protected areas can be classified based on the three new indicators. On the one hand, this classification can inform the identification of balanced management alternatives for improving the value of ESS. On the other hand, this approach permits the territory to be zoned, which would be a pillar for assessing ESS globally and useful for establishing payments for non-market ecosystem services among other applications. The bubble graph is a more common representation of data and easy for stakeholders to understand without the need for explanation whereas GAIA is useful for the analyst to understand the “structure” of the data, as can be observed when comparing
Figure 5 and
Figure 7.
Figure 7.
Global Visual Analysis for the Serra d’Espadà Natural Park. D-Sight software.
Figure 7.
Global Visual Analysis for the Serra d’Espadà Natural Park. D-Sight software.
Another important issue is how to involve stakeholders into collaborative management of ESS. The Group Decision Support System (GDSS) PROMETHEE [
53] is an interesting procedure that can be useful for strategic decisions in some contexts when there are not many decision makers or other stakeholders. It would be very difficult to implement this method in ESS management in protected areas due to the high number of people with very different expertise involved, and little time and funds available. Involving stakeholders in order to elicit the weights and look for consensus on indifference and preference thresholds would be more transparent and understandable than a more elaborate method, such as GDSS.
Vacik
et al. [
26] provided an in-depth analysis of 43 collaborative methods to apply in the three phases of the Programme-based Planning Natural Resources (PBPNR). These phases are problem identification, problem modelling and problem solving. It is interesting to note that AHP is included in this study, this technique being one of the best performing for problem solving and for problem identification when it is combined with the Strengths, Weaknesses, Opportunities and Threats (SWOT) method. PROMETHEE was not included in this study, although the authors recognised that it could be improved by additional methods and also highlighted the need to identify techniques that complement each other.
The methodology based on MCDA techniques is a very different approach to the traditional methods of ESS valuation such as benefit transfer or contingent valuation, which is the most widely used method to assess no-market services. Contingent valuation asks people directly how much they would pay to observe the environment and have access to it for recreation, their willingness to pay or their willingness to accept [
54]. Benefit transfer determines economic values by using existing values from studies already completed for another location or issue. There are two ways to transfer the values. The easiest approach is using simple unit transfer. Another way considers function transfer using meta-analysis or benefit transfer. The latter needs an econometric calibration [
55]. Traditional valuation methods approach the ESS from the perspective of demand, which means they do not meet the requirements of some environmental regulations, which consider that the valuation of environmental impact must be made from the viewpoint of the supply. In addition, non-market based ESS such as soil formation and erosion control should be assessed from the supply perspective. If we want to establish a system of PES, in particular for maintenance ESS, it would be better to reward those areas more, which improve this type of ESS most.
The proposed methodology allows the natural areas to be assessed according to their ESS supply. This approach provides outputs that could be the basic inputs for an economic valuation of natural areas, with many potential applications in practice. For example, economic valuation is required for PES systems, for compensation due to the impacts of forest fires and other natural disasters (landslips, floods, etc.), for distribution of public aids such as European Nature Network, and so on.
In summary, the proposed methodology combines two MCDA techniques to generate new indicators on which to base ESS assessment, in particular for intangible and non-market services. In this context, the advantages of each method can strengthen the integrated approach in order to deal with a complex problem. This allows decision makers to expand on the types of problems which can be addressed. For example, this can be used to reach consensus by identifying good options taking into account all ecosystem functions and showing reliable indicators in the inventory of ESS. Finally, it would be easy to implement Decision Support Systems (DSS) for managing and assessing ESS, whose necessity has been pointed out in a recent evaluation of DSS for forest management [
16].
6. Conclusions
In general, many decision makers, technical staff, other stakeholders and citizens consider natural areas as an asset that should be protected, where all environmental services have high importance. This perspective adds complexity to the management of the ESS, since in order to improve one of them it may be that the performance of other services can worsen and/or there can be competition for limited funds. Surveys based on a Likert-type scale are a first approach to knowing the attitudes of stakeholders on some issues and to establishing the decision making framework. However, they do not provide a transparent mechanism to transform opinions into priorities useful for management in a context of scarce resources. As this is the case in all protected areas around the world, it is valuable to explore the use of multiple criteria and group decision tools for ESS management and assessment.
The new methodology is based on the main ESS, grouped by functions (provisioning, maintenance and direct to citizens), considered as the objectives in the management process and it is therefore the basis for assessing them. In addition, it merges two MCDA techniques, incorporating all relevant points of view by involving decisions makers and other stakeholders from the very beginning of the process. This process starts with identifying the relevant ESS followed by an elicitation of stakeholder preferences, which define the weights to apply the PROMETHEE based method. This method allows new indicators for each group of relevant ESS to be obtained, deals with quantitative and qualitative data, enables sensitivity analysis and provides a tool for monitoring, assessing and improving ESS management in protected areas. These indicators can be presented visually as graphs, which are simple for every decision maker, stakeholder and citizen to understand. These advantages have been proposed as relevant criteria for the effective identification, modelling and solving of problems and for when selecting methods for natural resource management [
26].
The availability of reliable data is the main challenge to applying robust decision making techniques in practice. Therefore, it is necessary to design methodologies that take advantage of the best current information and also provide a way to highlight the lack of relevant data, as well as a mechanism to develop and improve their quality and quantity. This is facilitated by the methodology proposed in this paper. In addition, reliable data together with suitable multicriteria tools are necessary to classify and prioritise the alternatives according to a new paradigm of management of protected areas, to help resolve conflicts among stakeholders as well as to establish a basis for new forms of financing, such as payments for environmental services. Thus, this methodology is also useful to evaluate free ecosystem services, by integrating technical data with social values to assess mainly intangible, non-market services and public goods. Future research will seek to validate this approach by applying it to real technical data and different contexts, as well as evaluate other multicriteria and group decision making methods.


