Automatic Segmentation of Mauritia flexuosa in Unmanned Aerial Vehicle (UAV) Imagery Using Deep Learning

 ,
,  ,
,  , , and
Abstract
:1. Introduction
2. Materials and Methods
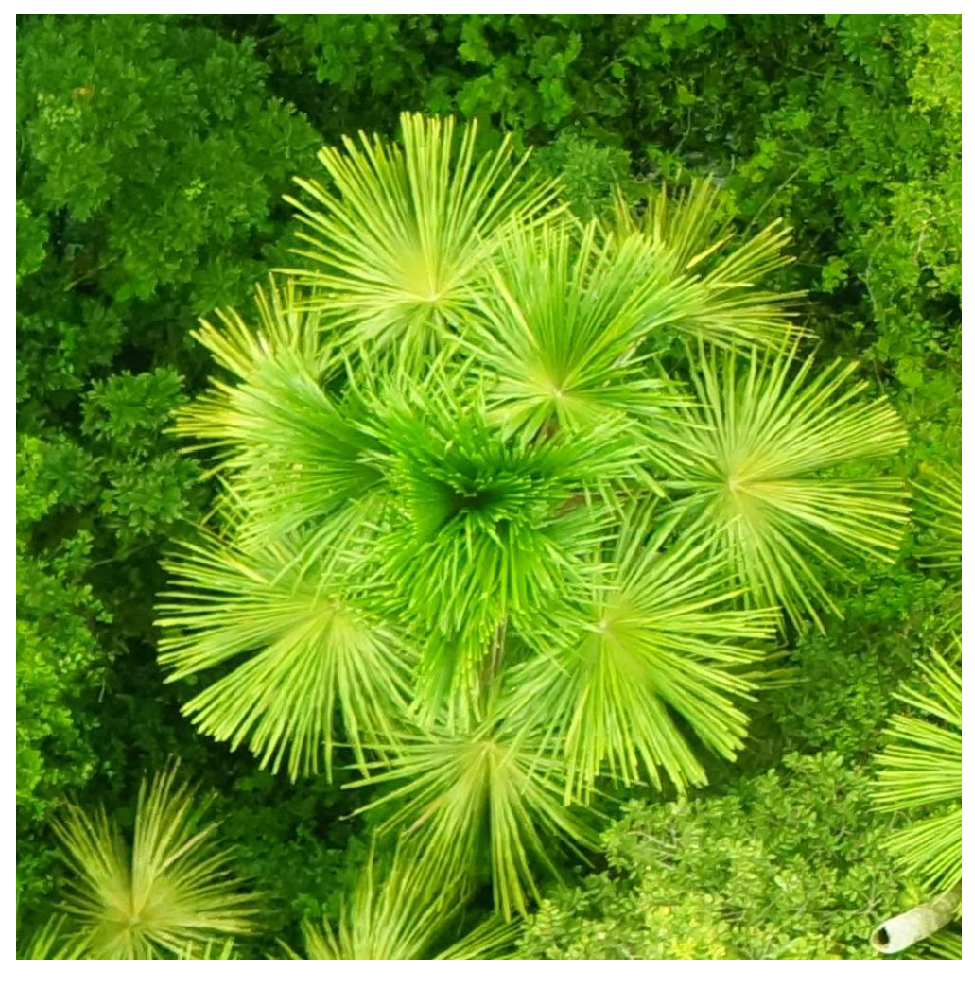
2.1. Mauritia flexuosa
2.2. Image Acquisition
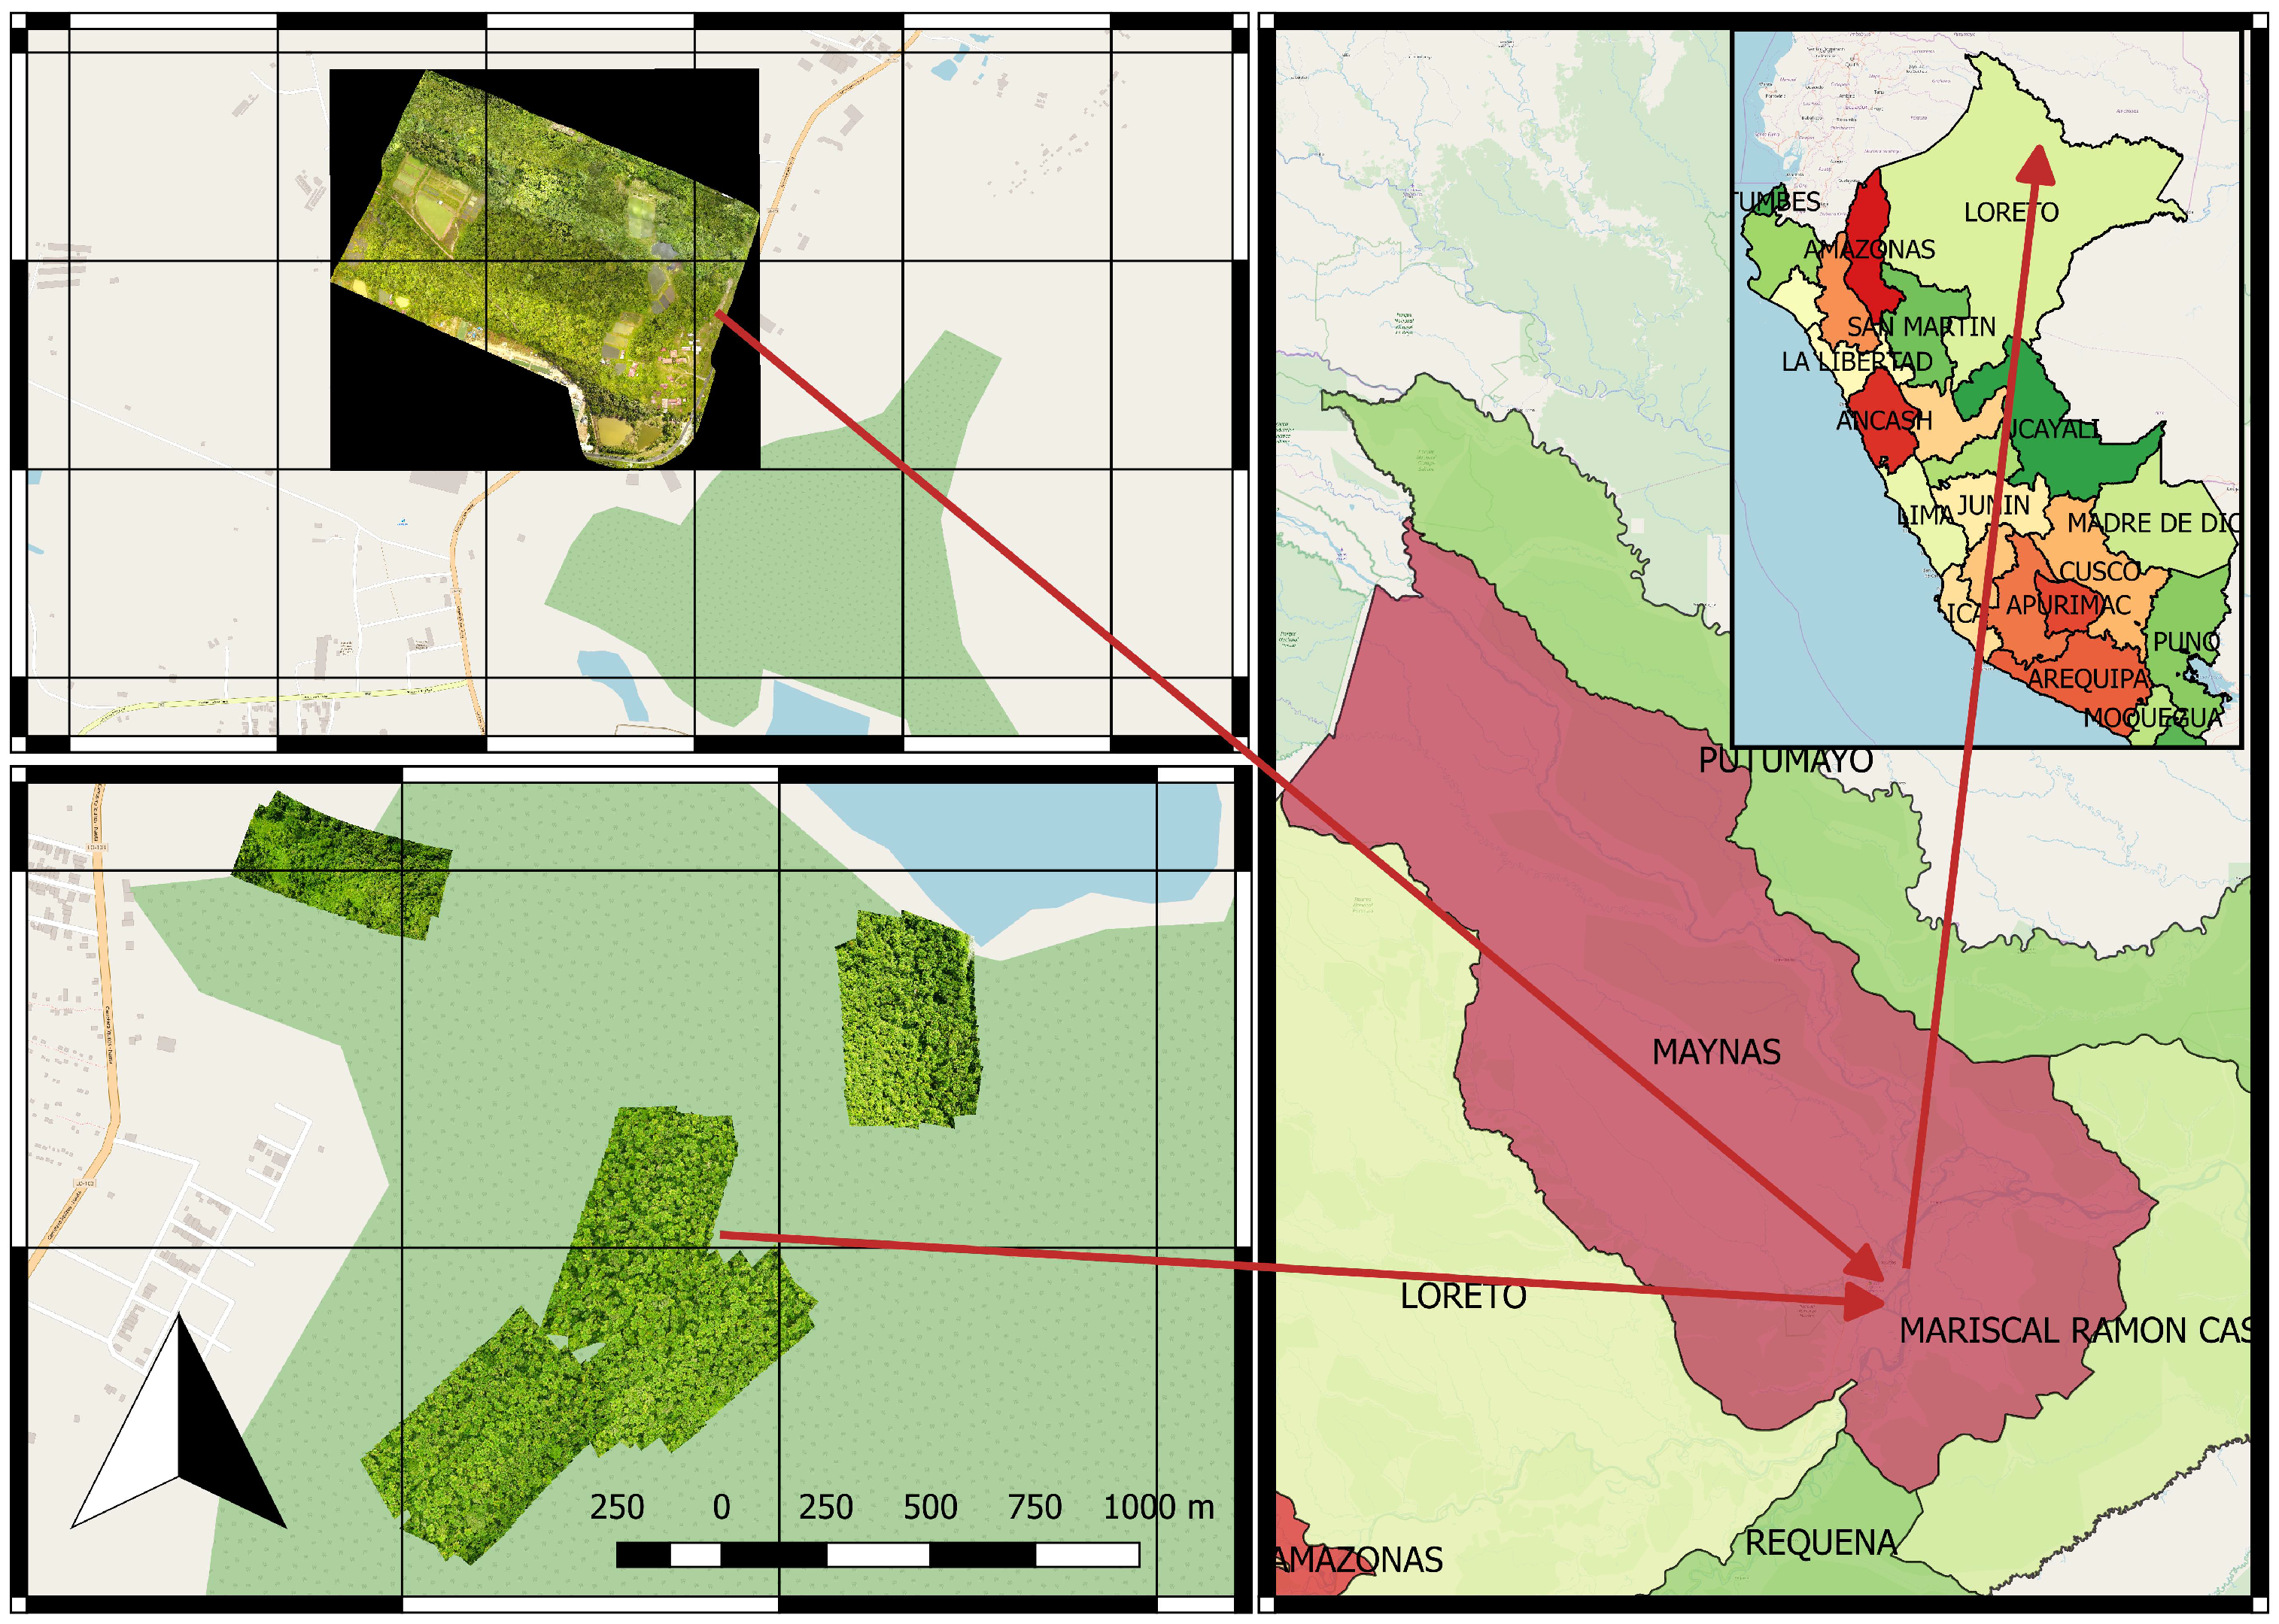
2.2.1. Study Area
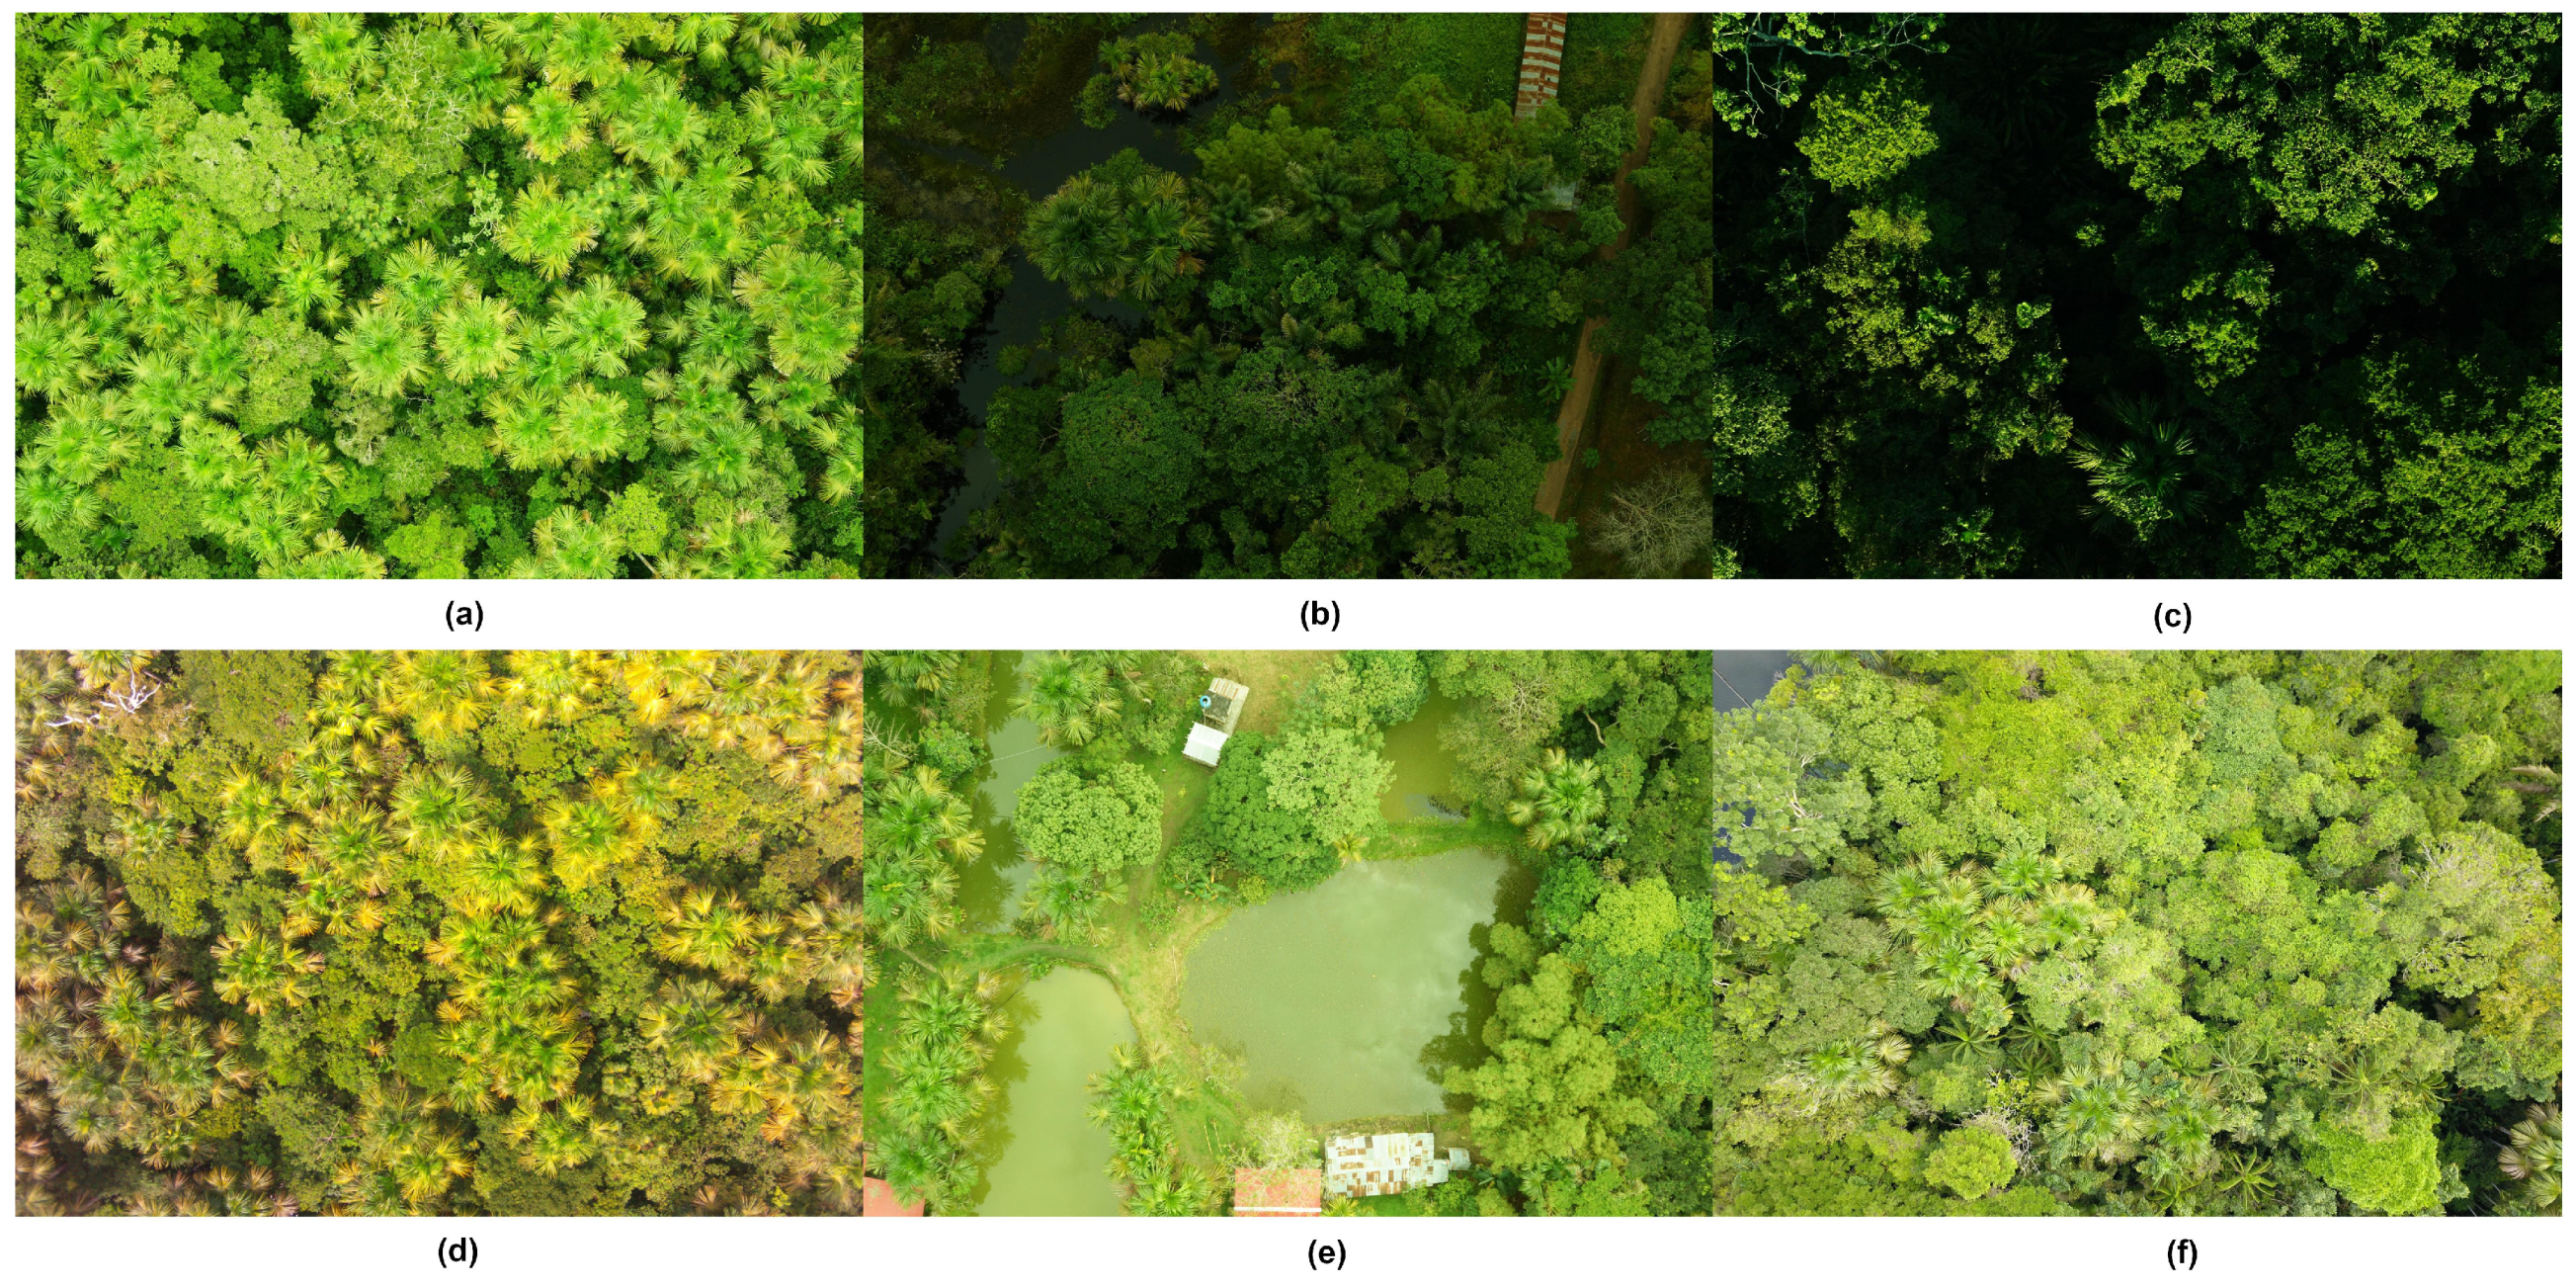
2.2.2. UAV Imagery
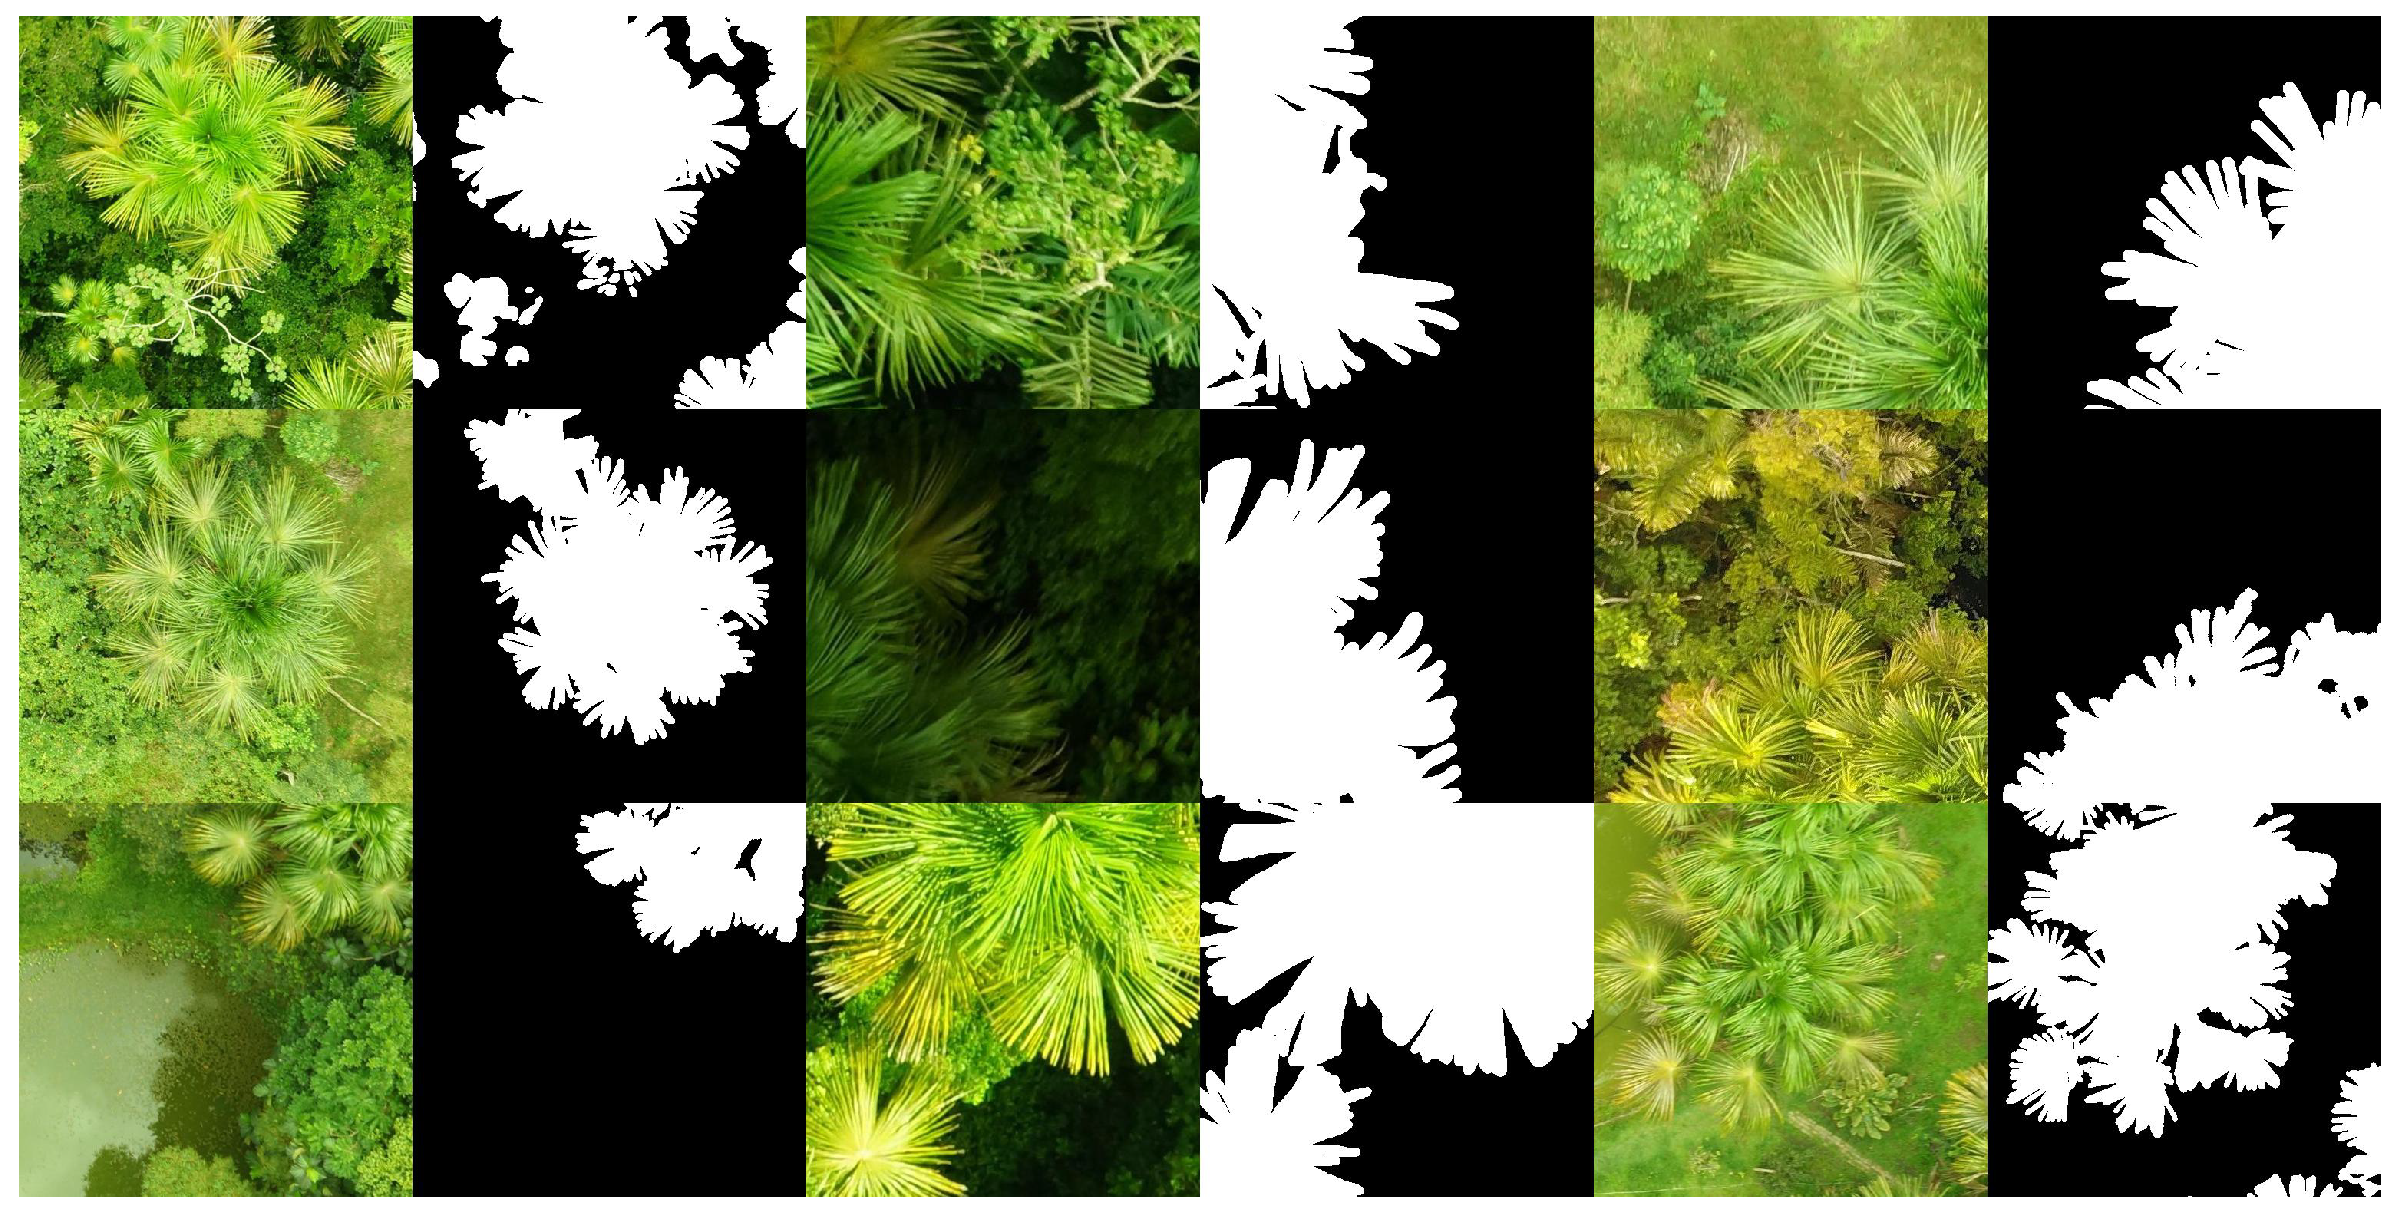
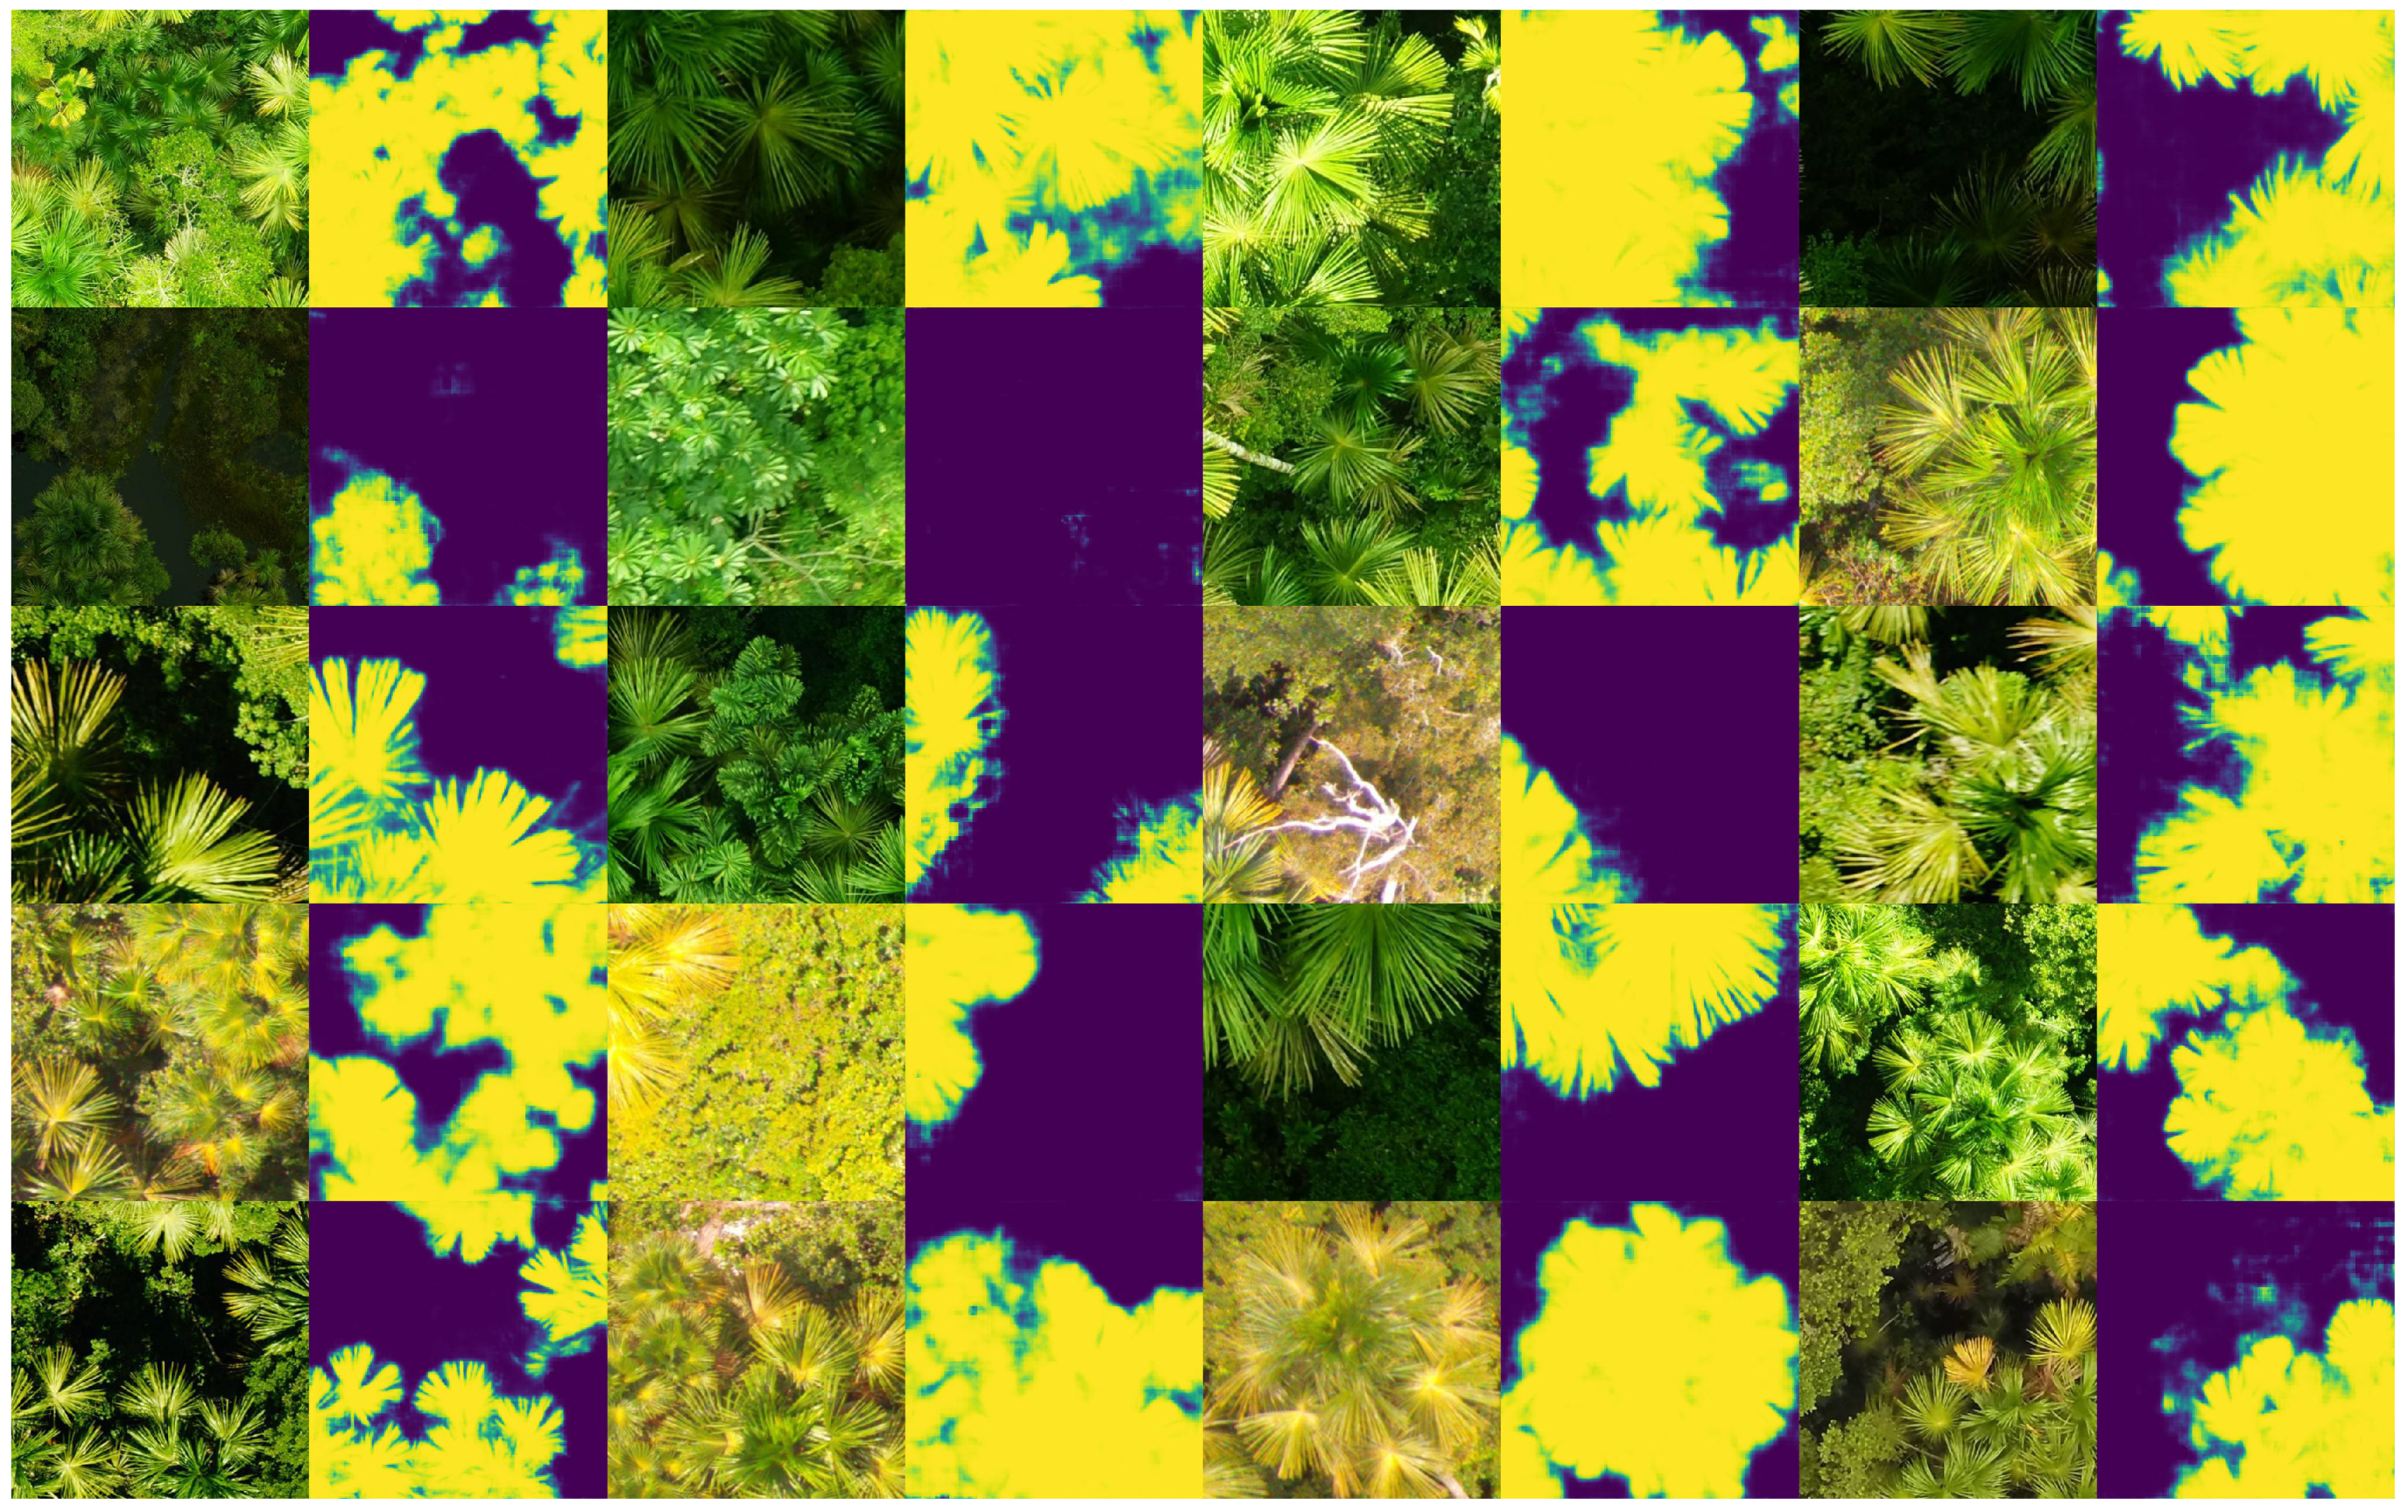
2.2.3. MauFlex Dataset
2.3. Proposed CNN for Segmentation
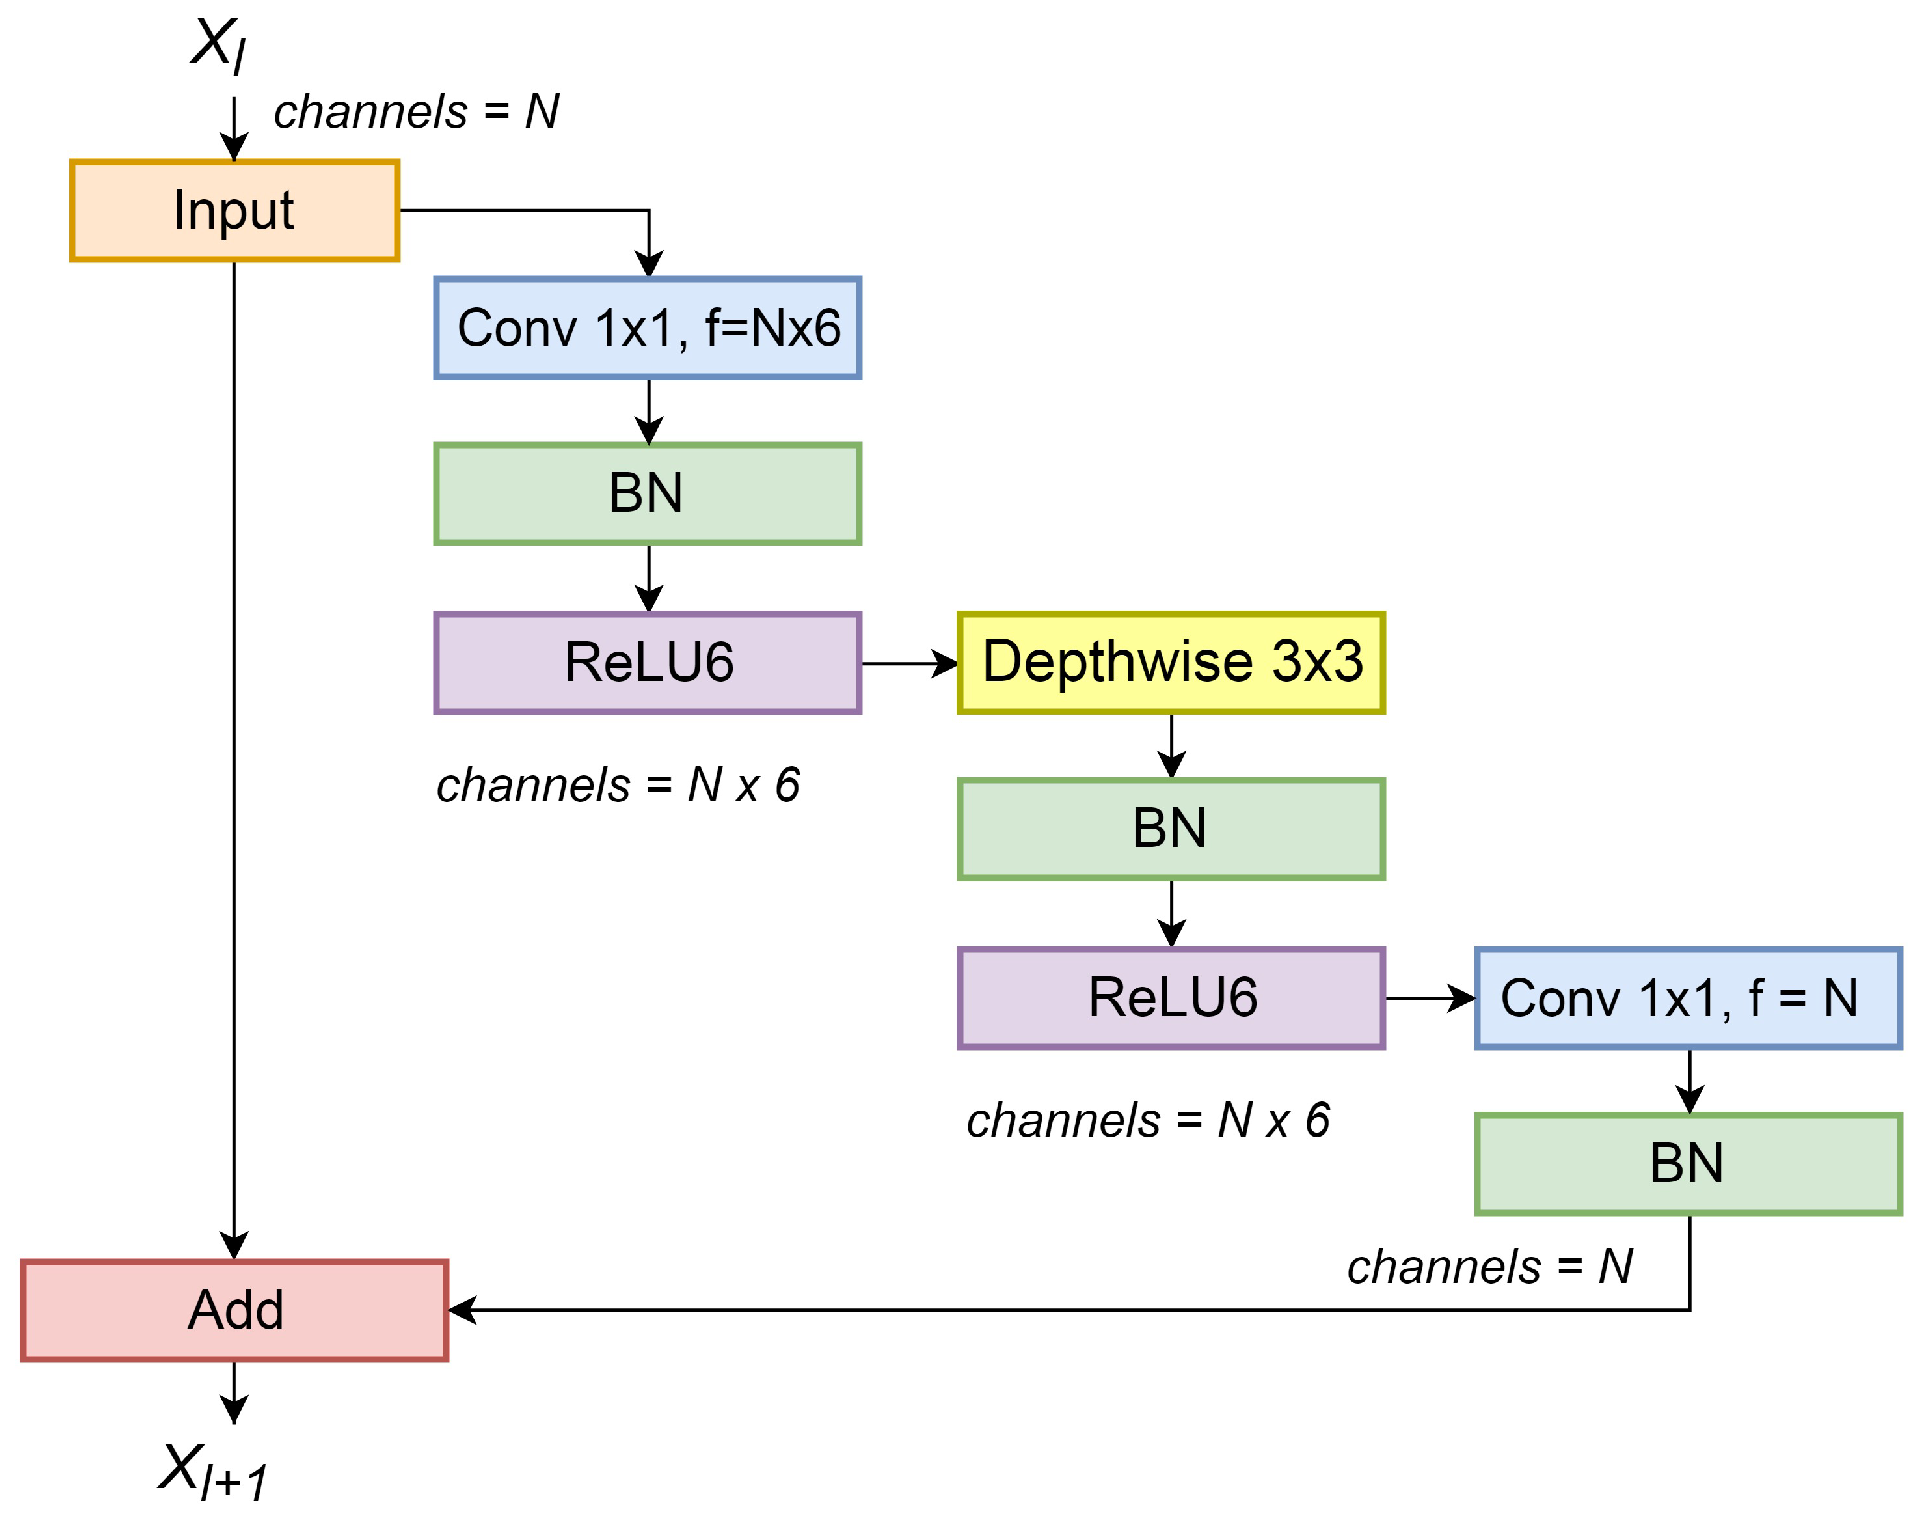
- Inverted residual unit: The main feature of a residual unit is the skip/shortcut between input and output, which allows the network to access earlier activations that were not modified by the convolution blocks, thus preventing network degradation problems such as gradient vanishing or exploding when it is too deep [28]. Inverted residuals units were first introduced in [29]; the main difference is that instead of expanding the number of input channels and then shrinking them, inverted residual units (IRUs) expand the input number of channels using a convolution, then apply a depthwise convolution (the number of channels remains the same), and, finally, apply another convolution that reduces the number of channels, as shown in Figure 5. The IRU shown in Figure 5 uses a batch normalization layer (“BN”) and a Rectified-Linear unit layer with a maximum possible value of 6 (“ReLU6”) after each convolution layer.
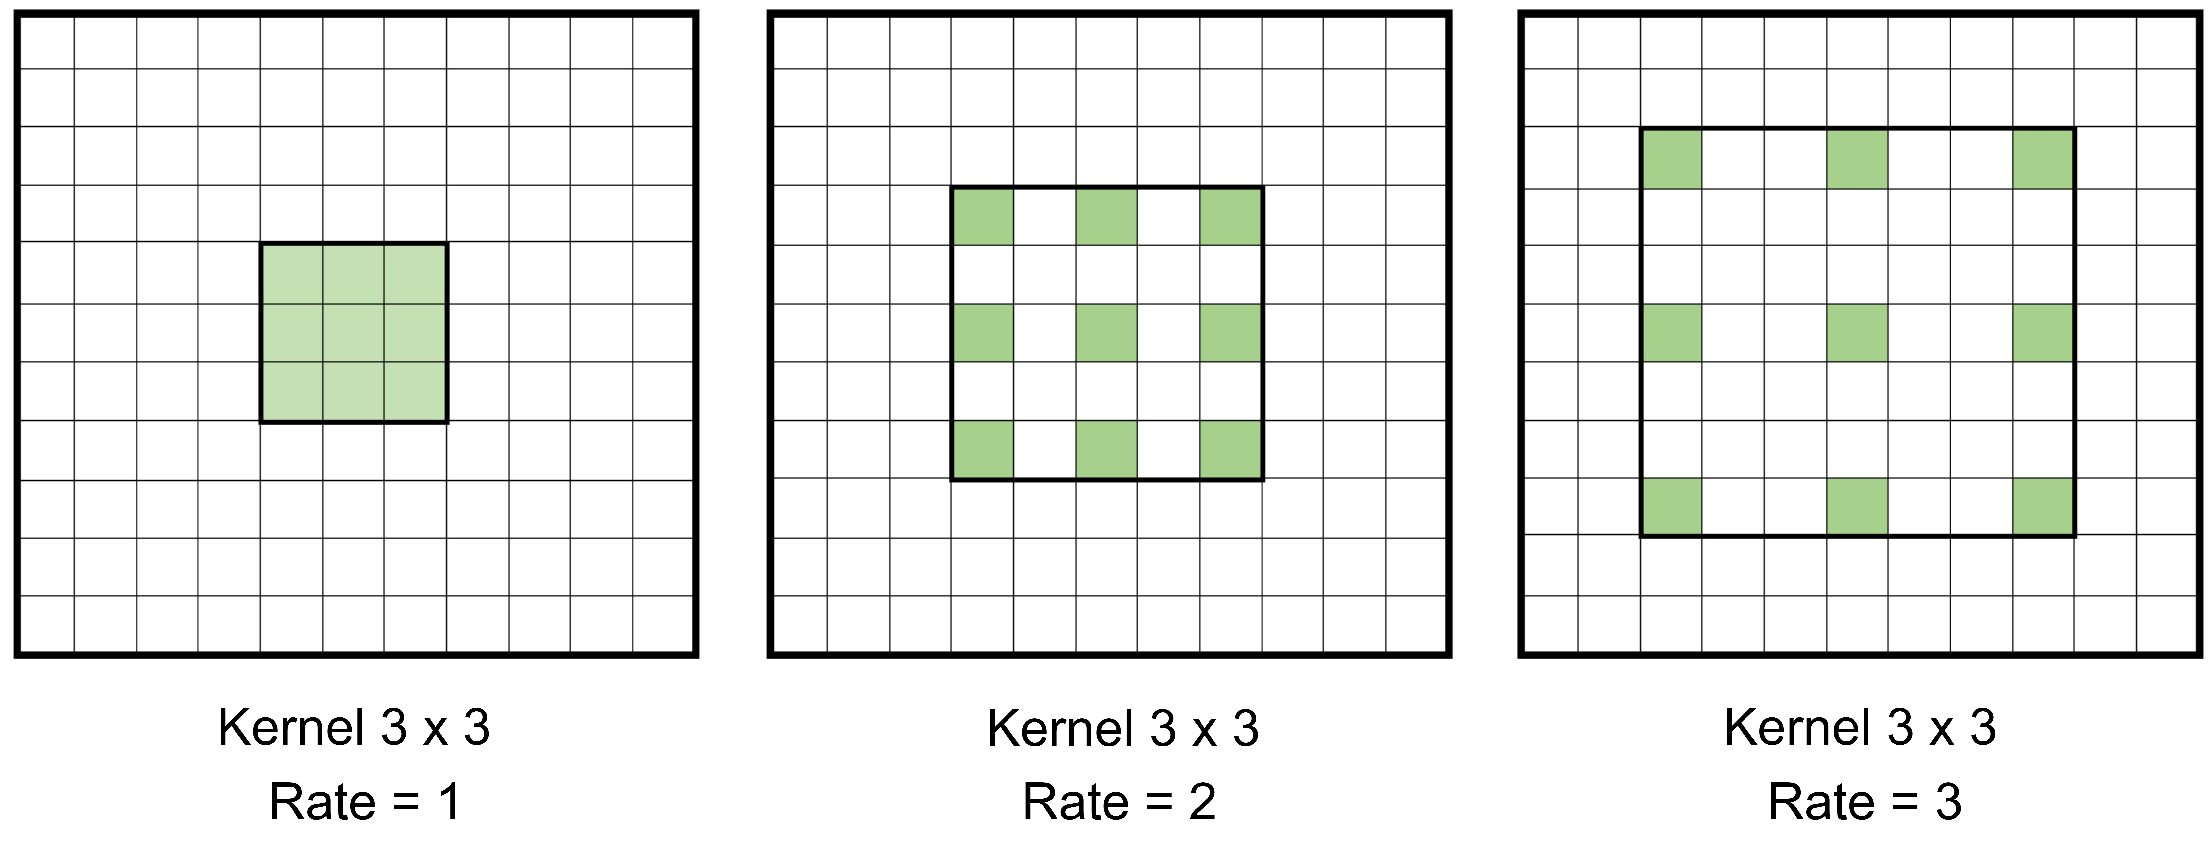
- Atrous convolution: Also known as dilated convolution, it is basically a convolution with upsampled filters [30]. Its advantage over convolutions with larger filters, is that it allows enlarging the field of view of filters without increasing the number of parameters [31]. Figure 6 shows how a convolution kernel with different dilation rates is applied to a channel. This allows for multi-scale aggregation.
- Atrous separable convolution: It is a depthwise convolution with atrous convolutions followed by a pointwise convolution [24]. The former performs an independent spatial atrous convolution over each channel of an input; and the latter combines the output of the previous operation using convolutions. This arrangement effectively reduces the number of parameters and mathematical operations needed in comparison with a normal convolution.
2.4. CNN Architecture
3. Results and Discussion
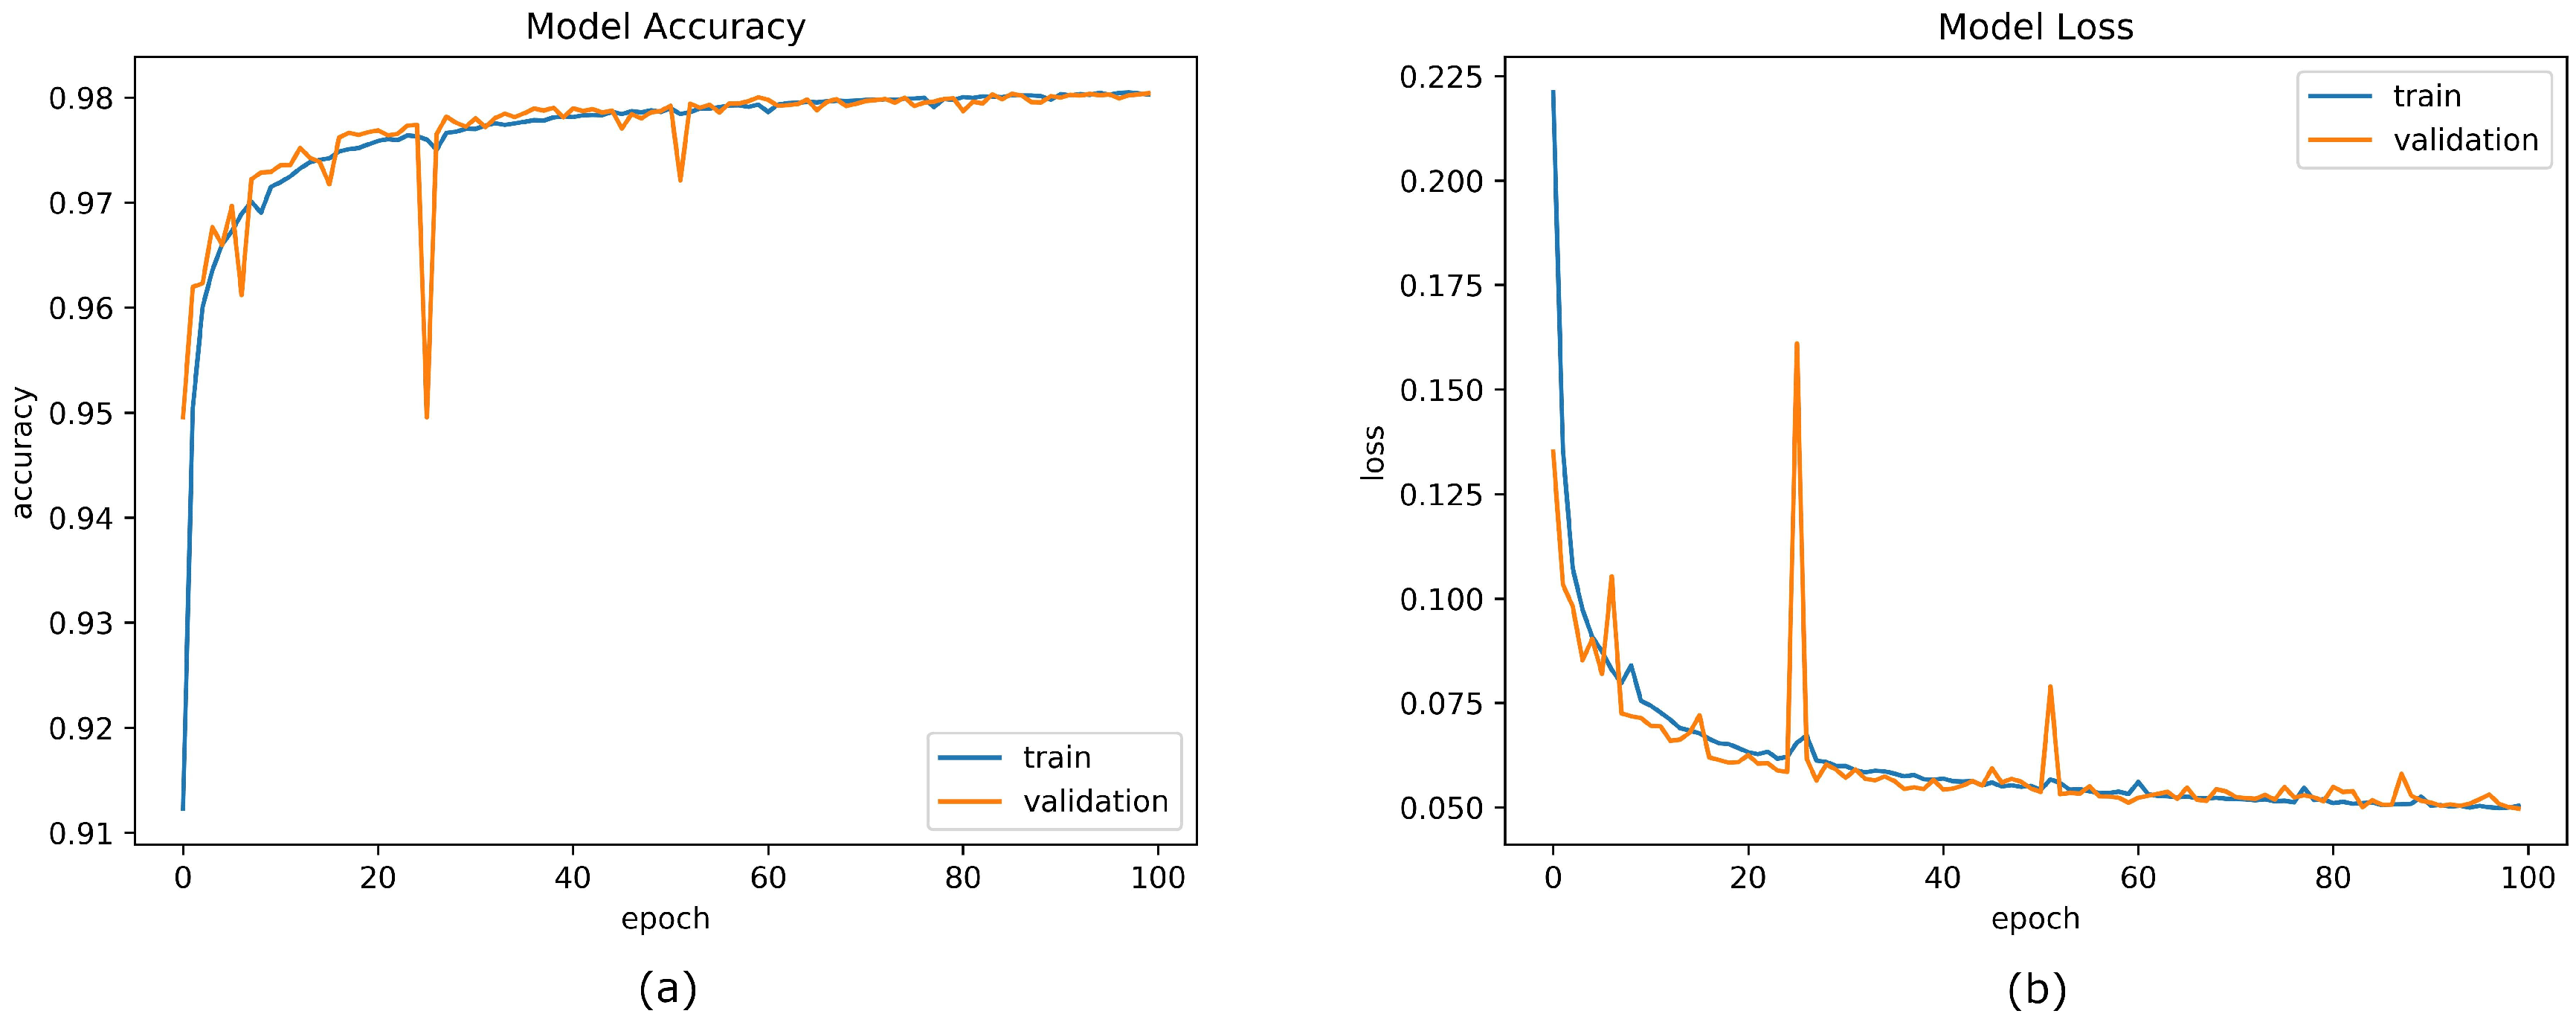
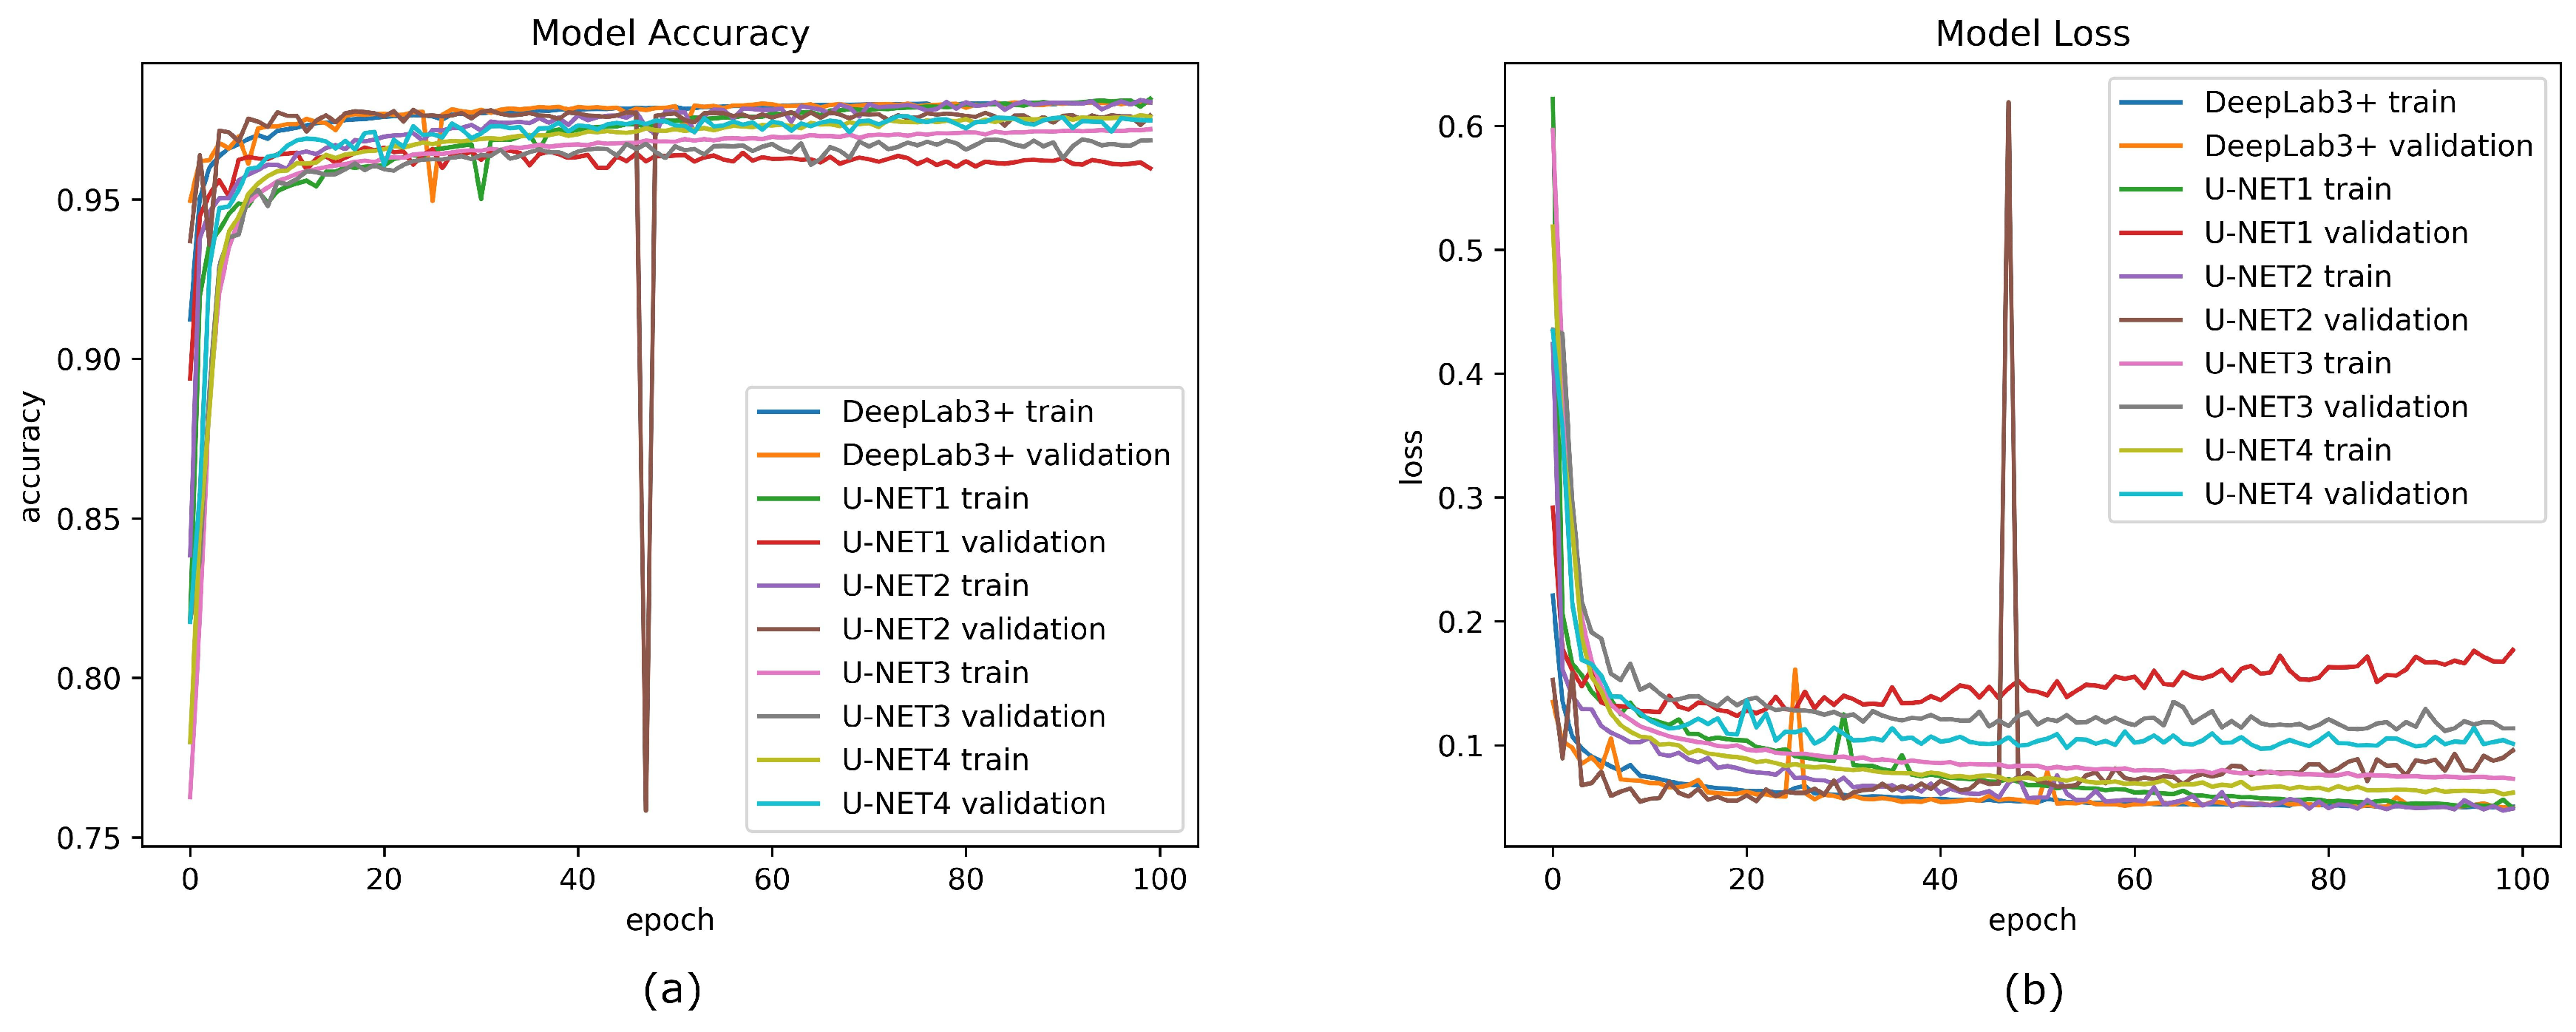
3.1. CNN Training
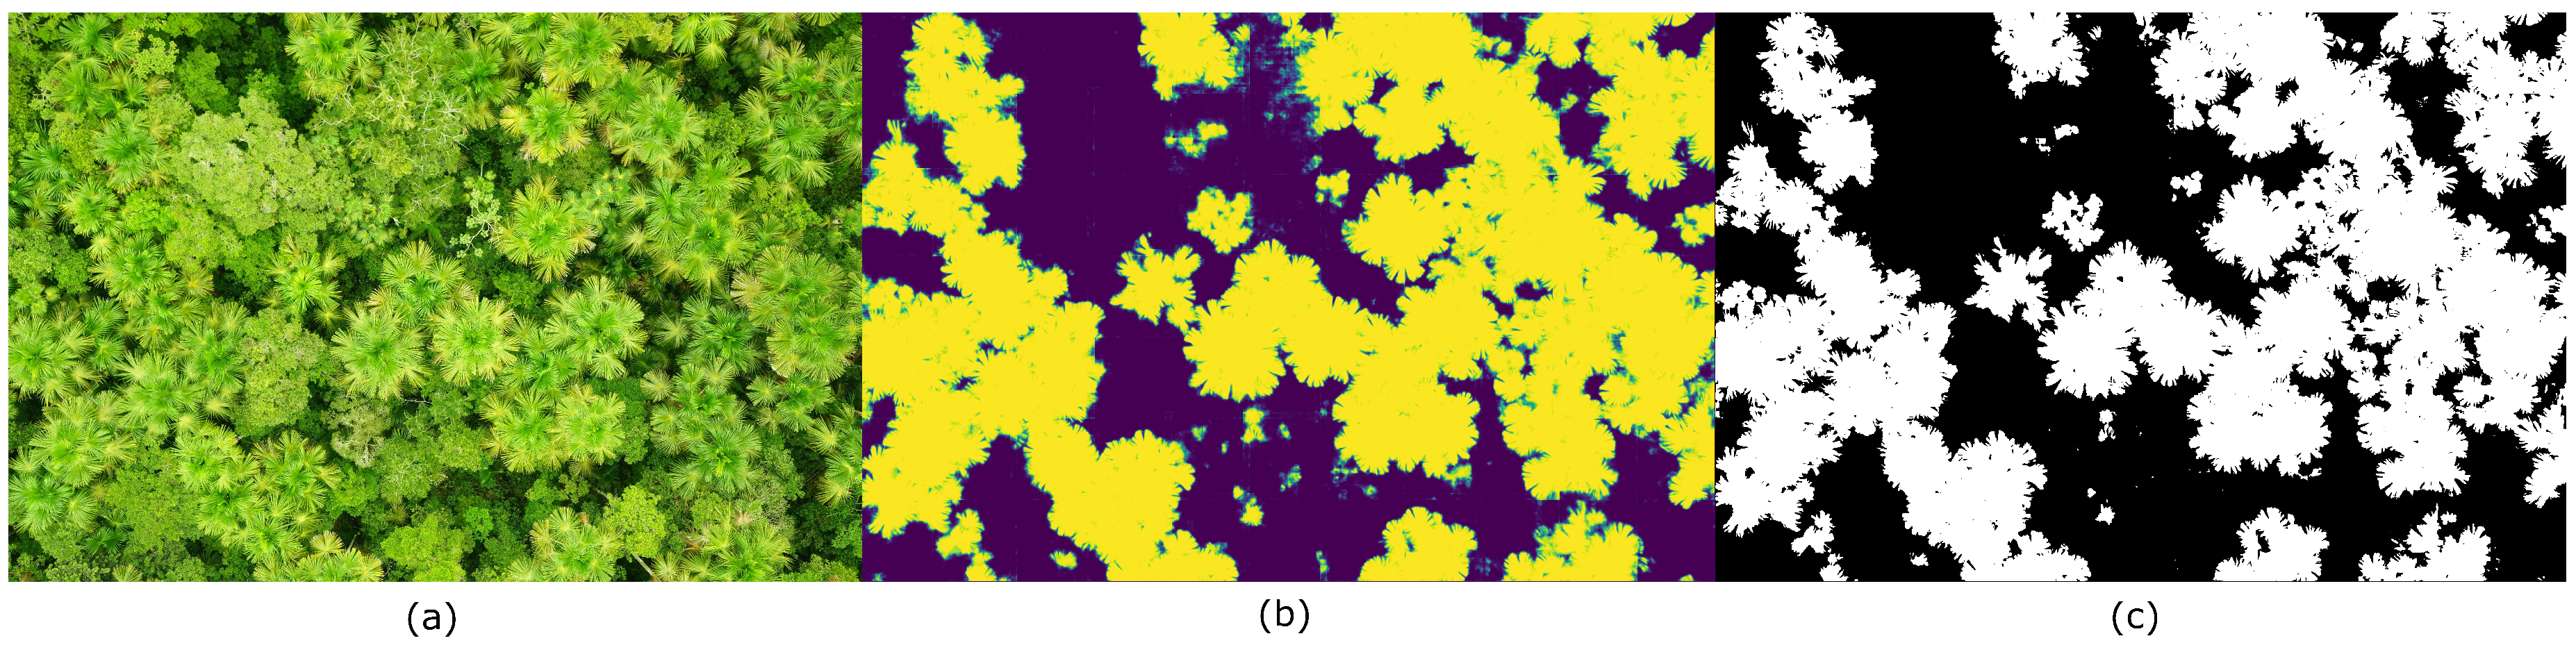
3.2. Mauritia flexuosa Segmentation
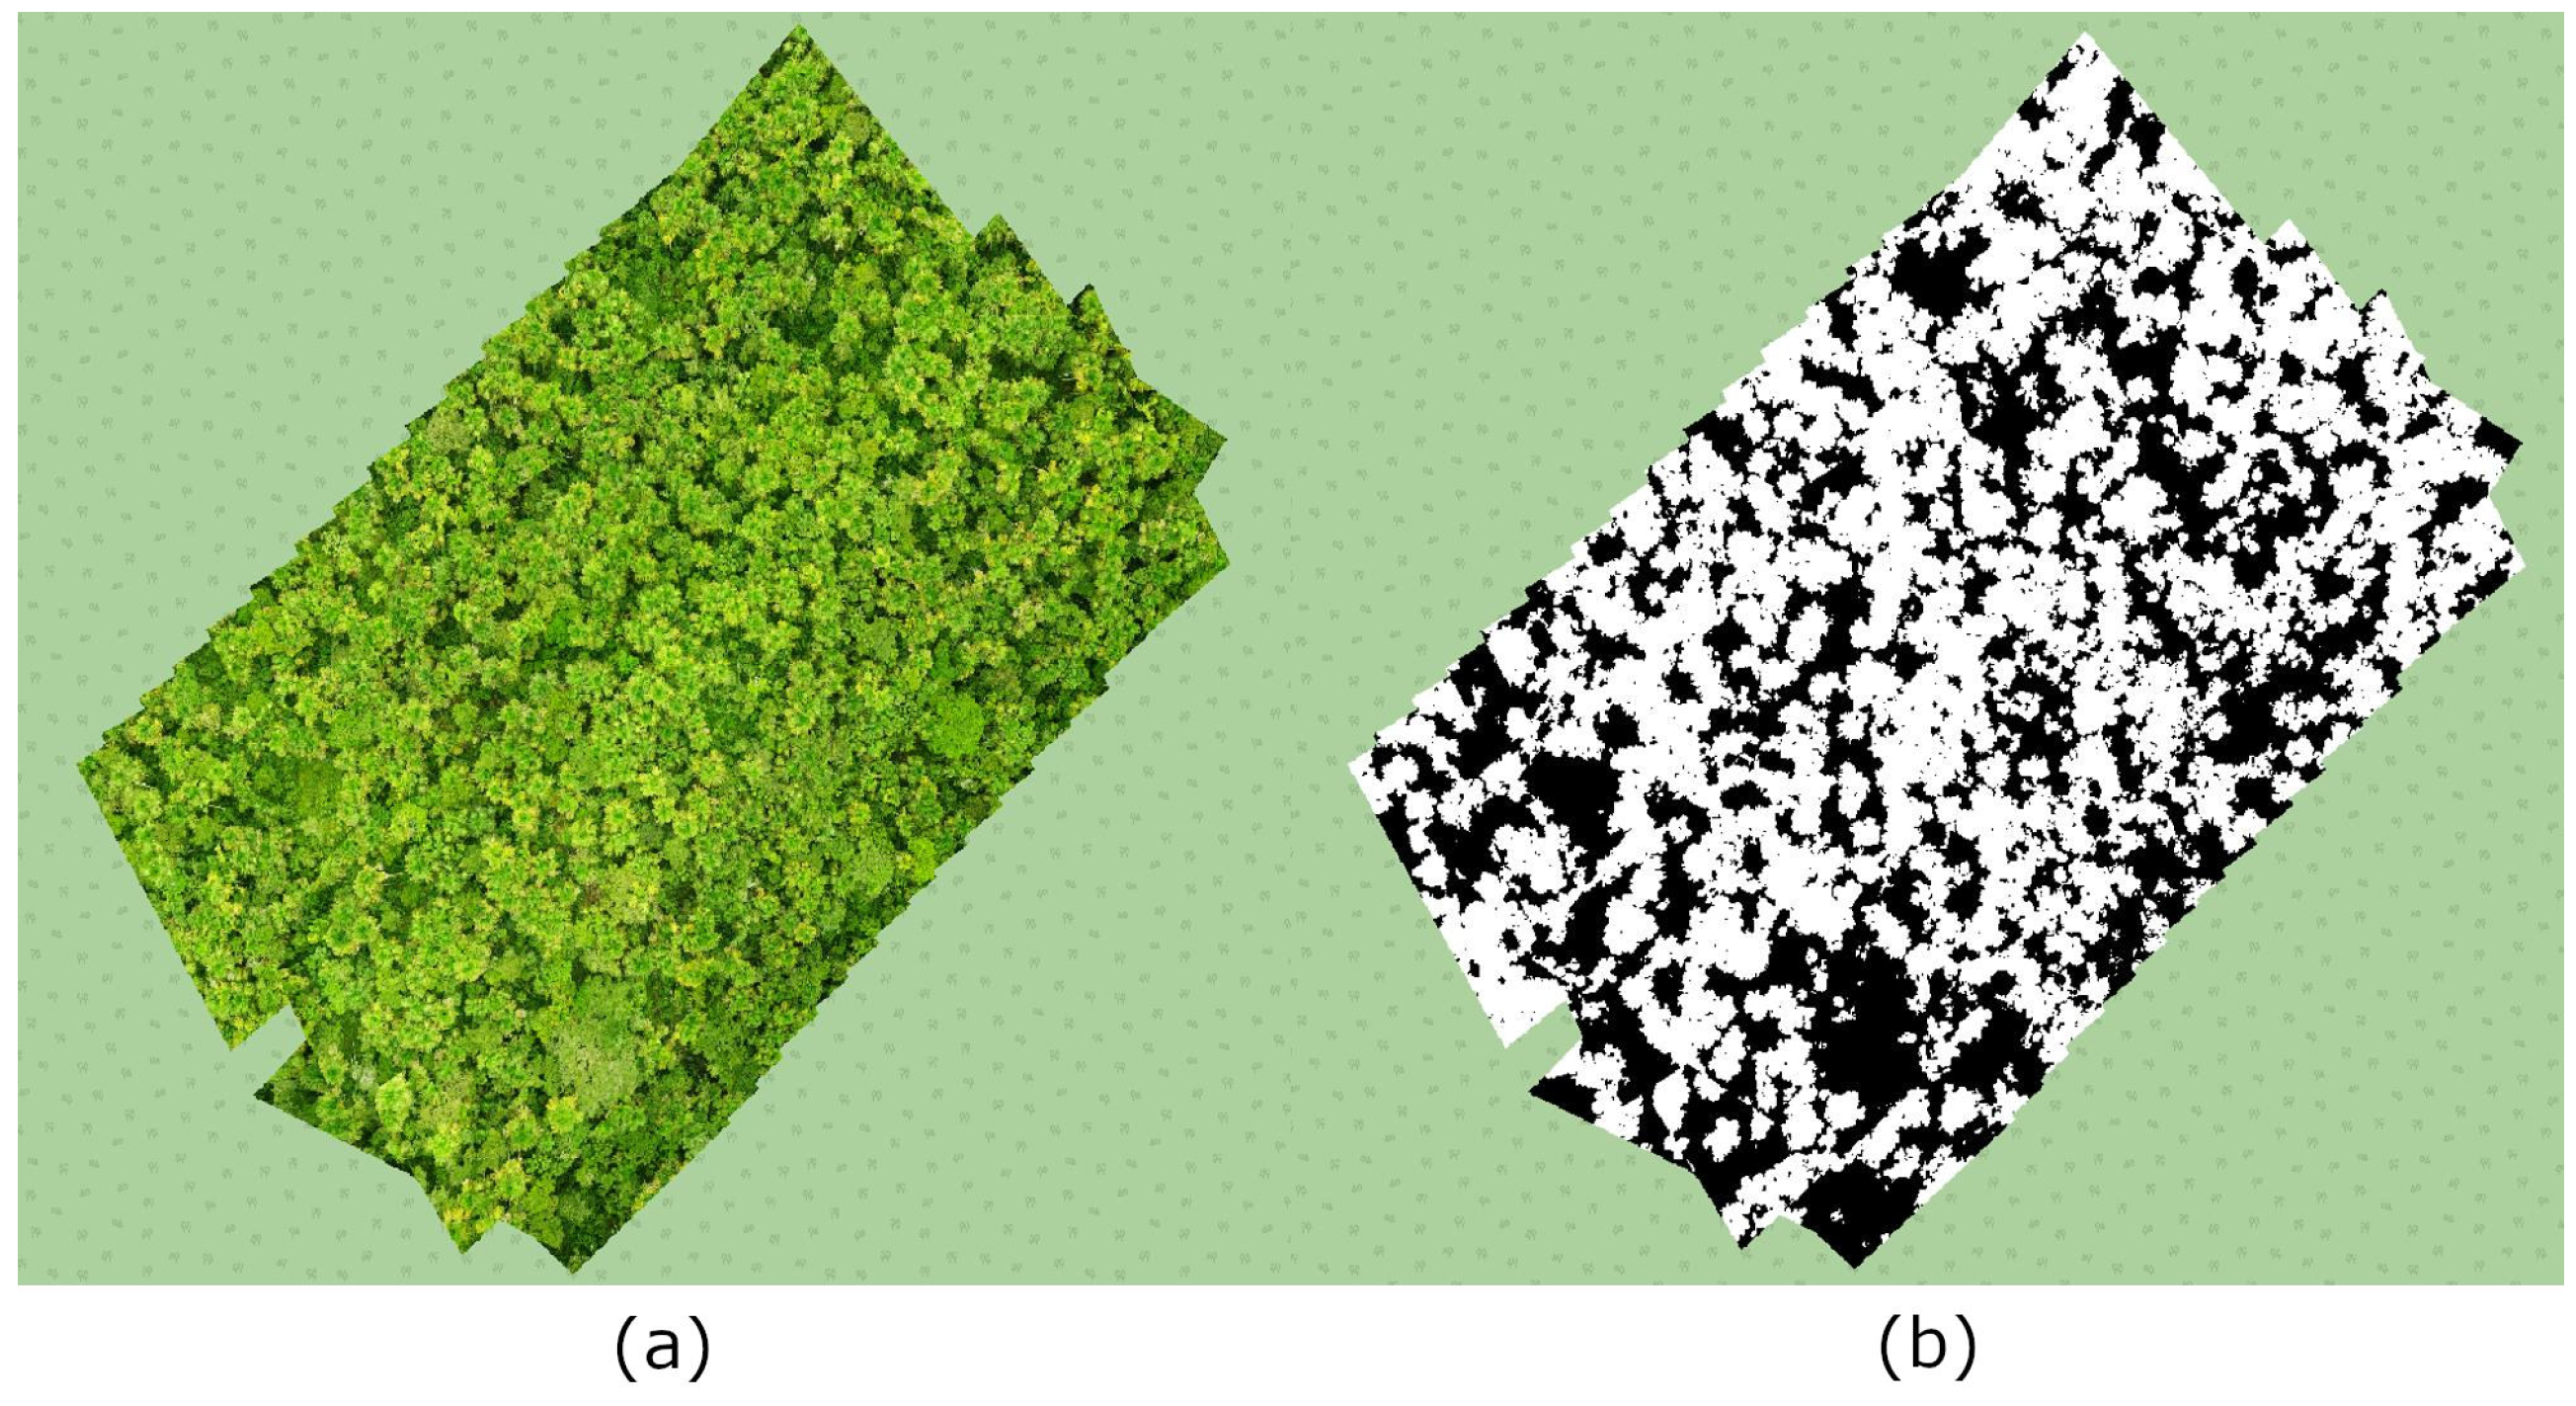
3.3. Mauritia flexuosa Monitoring
4. Conclusions
Supplementary Materials
Author Contributions
Acknowledgments
Conflicts of Interest
References
- Del Castillo, D.; Otárola, E.; Freitas, L. Aguaje: The Amazing Palm Tree of the Amazon; IIAP: Iquitos, Perú, 2006; ISBN 9972-667-34-0. [Google Scholar]
- Freitas, L.; Pinedo, M.; Linares, C.; Del Castillo, D. Descriptores Para el Aguaje (Mauritia flexuosa L.F.); IIAP: Iquitos, Perú, 2006; ISBN 978-9972-667-39-8. [Google Scholar]
- Levistre-Ruiz, J.; Ruiz-Murrieta, J. “El Aguajal”: El bosque de la vida en la Amazonía peruana. Cienc. Amaz. 2011, 1, 31–40. [Google Scholar] [CrossRef]
- Draper, F.C.; Roucoux, K.H.; Lawson, I.T.; Mitchard, E.T.; Honorio, E.N.; Lähteenoja, O.; Torres, L.; Valderrama, E.; Zaráte, R.; Baker, T.R. The distribution and amount of carbon in the largest peatland complex in Amazonia. Environ. Res. Lett. 2014, 9, 124017. [Google Scholar] [CrossRef] [Green Version]
- Malleux, R.; Dapozzo, B. Evaluación de los recursos forestales mundiales 2010—Informe Nacional Perú. Available online: http://www.fao.org/docrep/013/al598S/al598S.pdf (accessed on 22 October 2018).
- Mesa, L.; Galeano, G. Palms uses in the Colombian Amazon. Caldasia 2013, 35, 351–369. [Google Scholar]
- Virapongse, A.; Endress, B.A.; Gilmore, M.P.; Horn, C.; Romulo, C. Ecology, livelihoods, and management of the Mauritia flexuosa palm in South America. Glob. Ecol. Conserv. 2017, 10, 70–92. [Google Scholar] [CrossRef]
- Ticktin, T. The ecological implications of harvesting non-timber forest products. J. Appl. Ecol. 2004, 41, 11–21. [Google Scholar] [CrossRef] [Green Version]
- Puliti, S.; Talbot, B.; Astrup, R. Tree-Stump detection, segmentation, classification, and measurement using Unmanned Aerial Vehicle (UAV) imagery. Forests 2018, 9, 102. [Google Scholar] [CrossRef]
- Feduck, C.; McDermid, G.J.; Castilla, G. Detection of coniferous seedlings in UAV imagery. Forests 2018, 9, 432. [Google Scholar] [CrossRef]
- Balsi, M.; Esposito, S.; Fallavollita, P.; Nardinocchi, C. Single-tree detection in high-density LiDAR data from UAV-based survey. Eur. J. Remote Sens. 2018, 51, 679–692. [Google Scholar] [CrossRef]
- Wallace, L.; Lucieer, A.; Watson, C.S. Evaluating tree detection and segmentation routines on very high resolution UAV LiDAR data. IEEE Trans. Geosci. Remote Sens. 2014, 52, 7619–7628. [Google Scholar] [CrossRef]
- Nevalainen, O.; Honkavaara, E.; Tuominen, S.; Viljanen, N.; Hakala, T.; Yu, X.; Hyyppä, J.; Saari, H.; Pölönen, I.; Imai, N.N.; et al. Individual tree detection and classification with UAV-Based photogrammetric point clouds and hyperspectral imaging. Remote Sens. 2017, 9, 185. [Google Scholar] [CrossRef]
- Klein, A.M.; Dalla, A.P.; Péllico, S.; Strager, M.P.; Schoeninger, E.R. Treedetection: Automatic tree detection using UAV-based data. Floresta 2018, 48, 393–402. [Google Scholar] [CrossRef]
- Mohan, M.; Silva, C.A.; Klauberg, C.; Jat, P.; Catts, G.; Cardil, A.; Hudak, A.T.; Dia, M. Individual tree detection from unmanned aerial vehicle (UAV) derived canopy height model in an open canopy mixed conifer forest. Forests 2017, 8, 340. [Google Scholar] [CrossRef]
- Trichon, V. Crown typology and the identification of rain forest trees on large-scale aerial photographs. Plant Ecol. 2001, 153, 301–312. [Google Scholar] [CrossRef]
- Al Mansoori, S.; Kunhu, A.; Al Ahmad, H. Automatic palm trees detection from multispectral UAV data using normalized difference vegetation index and circular Hough transform. In Proceedings of the SPIE Remote Sensing Conference 10792, Berlin, Germany, 10–13 September 2018. [Google Scholar]
- Franklin, S.E.; Ahmed, O.S. Deciduous tree species classification using object-based analysis and machine learning with unmanned aerial vehicle multispectral data. Int. J. Remote Sens. 2018, 39, 5236–5245. [Google Scholar] [CrossRef]
- Mukashema, A.; Veldkamp, A.; Vrieling, A. Automated high resolution mapping of coffee in Rwanda using an expert Bayesian network. Int. J. Appl. Earth Obs. Geoinf. 2014, 33, 331–340. [Google Scholar] [CrossRef] [Green Version]
- Li, W.; Fu, H.; Yu, L.; Cracknell, A. Deep learning based oil palm tree detection and counting for high-resolution remote sensing images. Remote Sens. 2017, 9, 22. [Google Scholar] [CrossRef]
- Epperson, M. Empowering Conservation through Deep Convolutional Neural Networks and Unmanned Aerial Systems. Master’s Thesis, University of California, Oakland, CA, USA, 2018. [Google Scholar]
- Zakharova, M. Automated Coconut Tree Detection in Aerial Imagery Using Deep Learning. Master’s Thesis, The Katholieke Universiteit Leuven, Löwen, Belgium, 2017. [Google Scholar]
- Onishi, M.; Ise, T. Automatic classification of trees using a UAV onboard camera and deep learning. arXiv, 2018; arXiv:1804.10390. [Google Scholar]
- Chen, L.-C.; Zhu, Y.; Papandreou, G.; Schroff, F.; Adam, H. Encoder-Decoder with Atrous Separable Convolution for Semantic Image Segmentation. In Proceedings of the European Conference on Computer Vision (ECCV 2018), Munich, Germany, 8–14 September 2018. [Google Scholar]
- Ministry of Health of Peru, 2009. Tablas Peruanas de Composición de Alimentos. Available online: http://www.ins.gob.pe/insvirtual/images/otrpubs/pdf/Tabla%20de%20Alimentos.pdf (accessed on 22 October 2018).
- Wang, J.; Perez, L. The Effectiveness of Data Augmentation in Image Classification using Deep Learning. arXiv, 2018; arXiv:1712.04621. [Google Scholar]
- National Institute of Research and Training in Telecommunications (INICTEL-UNI), 2018. MauFlex Dataset. Available online: http://didt.inictel-uni.edu.pe/dataset/MauFlex_Dataset.rar (accessed on 22 October 2018).
- He, K.; Zhang, X.; Ren, S.; Sun, J. Deep residual learning for image recognition. In Proceeding of the IEEE Conference on Computer Vision and Pattern Recognition (CVPR), Las Vegas, NV, USA, 27–30 June 2016; pp. 770–778. [Google Scholar]
- Sandler, M.; Howard, A.; Zhu, M.; Zhmoginov, A.; Chen, L.-C. MobileNetV2: Inverted Residuals and Linear Bottlenecks. arXiv, 2018; arXiv:1801.04381. [Google Scholar]
- Yu, F.; Koltun, V. Multi-scale context aggregation by dilated convolutions. In Proceedings of the International Conference on Learning Representations (ICLR 2016), San Juan, PR, USA, 2–4 May 2016. [Google Scholar]
- Chen, L.-C.; Papandreou, G.; Kokkinos, I.; Murphy, K.; Yuille, A.L. DeepLab: Semantic Image Segmentation with Deep Convolutional Nets, Atrous Convolution, and Fully Connected CRFs. IEEE Trans. Pattern Anal. Mach. Intell. 2018, 40, 834–848. [Google Scholar] [CrossRef] [PubMed] [Green Version]
- Kingma, D.; Ba, J. Adam: A method for stochastic optimization. In Proceedings of the International Conference on Learning Representations (ICLR 2015), San Diego, CA, USA, 7–9 May 2015. [Google Scholar]
- Ronneberger, O.; Fischer, P.; Brox, T. U-net: Convolutional networks for biomedical image segmentation. In Proceedings of the Medical Image Computing and Computer-Assisted Intervention (MICCAI 2015), Munich, Germany, 5–9 October 2015; Volume 9351, pp. 234–241. [Google Scholar]
- Zhang, Z.; Liu, Q.; Wang, Y. Road Extraction by Deep Residual UNet. IEEE Geosci. Remote Sens. Lett. 2018, 15, 749–753. [Google Scholar] [CrossRef]
- Arteaga, D. Desarrollo de un Aplicativo de Software Basado en Algoritmos de Procesamiento Digital de Imágenes y Visión Computacional, Orientado a la Construcción y Georreferenciación de Mosaicos de Imágenes Aéreas Adquiridas vía UAV. Bachelor’s Thesis, Universidad Nacional de Ingeniería, Rímac, Peru, 2018. [Google Scholar]


| UAV Specifications | |||
|---|---|---|---|
| Description | Quadcopter | Quadcopter | Quadcopter |
| Brand | Aeryon | DJI | TurboAce |
| Model | SkyRanger sUAS | Mavic Pro | Matrix-E |
| Vehicle Dimensions | mm | mm | mm |
| Vehicle Weight (kg) | 2.4 | 0.734 | 4 |
| Camera Specifications | |||
| Camera Model | Aeryon MT9F002 | DJI FC220 | Sony Nex-7 |
| Image Size (megapixels) | 14 MP | 12 MP | 24 MP |
| Ground Sampling Distance | 1.4 cm/pixel | 2.5 cm/pixel | 1.4 cm/pixel |
| Flight Altitude | 80 m | 70 m | 100 m |
| Image Dimensions (pixels) | |||
| Bit Depth | 24 | 24 | 24 |
| Metric | ACC (%) | PREC (%) | SN (%) | SP (%) | Parameters | |
|---|---|---|---|---|---|---|
| Method | ||||||
| U-NET1 | 95.973 | 91.381 | 92.632 | 97.087 | 3,736,321 | |
| U-NET2 | 97.682 | 94.858 | 95.953 | 98.261 | 3,910,641 | |
| U-NET3 | 96.843 | 92.534 | 94.886 | 97.486 | 503,100 | |
| U-NET4 | 97.512 | 95.166 | 95.028 | 98.358 | 542,460 | |
| Proposed network | 98.036 | 96.688 | 95.616 | 98.871 | 507,729 | |
© 2018 by the authors. Licensee MDPI, Basel, Switzerland. This article is an open access article distributed under the terms and conditions of the Creative Commons Attribution (CC BY) license (http://creativecommons.org/licenses/by/4.0/).
Share and Cite
Morales, G.; Kemper, G.; Sevillano, G.; Arteaga, D.; Ortega, I.; Telles, J. Automatic Segmentation of Mauritia flexuosa in Unmanned Aerial Vehicle (UAV) Imagery Using Deep Learning. Forests 2018, 9, 736. https://0-doi-org.brum.beds.ac.uk/10.3390/f9120736
Morales G, Kemper G, Sevillano G, Arteaga D, Ortega I, Telles J. Automatic Segmentation of Mauritia flexuosa in Unmanned Aerial Vehicle (UAV) Imagery Using Deep Learning. Forests. 2018; 9(12):736. https://0-doi-org.brum.beds.ac.uk/10.3390/f9120736
Chicago/Turabian StyleMorales, Giorgio, Guillermo Kemper, Grace Sevillano, Daniel Arteaga, Ivan Ortega, and Joel Telles. 2018. "Automatic Segmentation of Mauritia flexuosa in Unmanned Aerial Vehicle (UAV) Imagery Using Deep Learning" Forests 9, no. 12: 736. https://0-doi-org.brum.beds.ac.uk/10.3390/f9120736