Changes in Species Composition in Alder Swamp Forest Following Forest Dieback


1
Department of Forest Biodiversity, Institute of Forest Ecology and Silviculture, Faculty of Forestry, University of Agriculture, 29 Listopada 46, 31-425 Kraków, Poland
2
Department of Botany, Institute of Environmental Biology, Faculty of Biological Sciences, University of Wrocław, ul. Kanonia 6/8, 50-328 Wrocław, Poland
*
Author to whom correspondence should be addressed.
Forests 2018, 9(6), 316; https://0-doi-org.brum.beds.ac.uk/10.3390/f9060316
Submission received: 11 May 2018
/
Revised: 30 May 2018
/
Accepted: 31 May 2018
/
Published: 2 June 2018
(This article belongs to the Special Issue Disturbance, Succession, and Development of Forests)
Abstract
:It is generally hypothesized that forest dieback is a characteristic of alder swamp forests (alder carrs, Alnion glutinosae alliance). Different internal and external factors may trigger this process, including human disturbance, changes in river discharge, unusually severe and prolonged flooding, terminal age of an even-aged alder forest (ca. 100–150 years) and others. Although forest dieback in this type of forest may cause major changes in environmental conditions, the influence of this change on the floristic composition has not been well recognized. The study aimed to detect any possible changes in floristic variation in alder swamp forest following forest dieback. Vegetation plots in alder swamp forests affected by forest dieback were resurveyed 20 years after a previous study. PERMANOVA was used to test the significance of the compositional change and nonmetric multidimensional scaling (NMDS) with passively fitted means of the Ellenberg’s Indicator Values were used to interpret its ecological meaning. In addition, different structural and diversity indices were compared, including species richness, percentage cover of vegetation layers, Shannon and Simpson diversity and evenness. Finally, we analyzed changes in the frequency of vascular plant species using Chi square tests. We recorded clear and significant compositional changes following alder swamp forest dieback. This change was most related to the gradient of moisture, followed by the gradients of light and temperature. The analysis of the individual species showed that the species of hummocks declined, while the species of hollows increased. Moreover, the current communities are dominated by some hydrophytes that were not recorded 20 years ago. Forest dieback resulted in profound changes in the hydrological regime. The observed changes are consistent with a model of cyclic succession as proposed for alder swamps. In addition, we conclude that the natural forest dynamics have to be taken into consideration while interpreting the results of re-survey studies.

1. Introduction
In many types of temperate forests, canopy gaps are the main source of regeneration. These canopy gaps are usually formed by a single tree-fall, which improves local light conditions in forests and supports the establishment of tree seedlings and saplings [1,2]. This type of regeneration results in a diverse age structure in the forest stand. However, in some types of forests the regeneration follows large- or medium-scale disturbances and leads to the formation of forest stands characterized by a simplified age structure because the community is typically built by only one generation of trees [3].
It is generally believed that forest dieback is a characteristic of alder swamp forests (also referred to as alder carrs or alder fens, Alnetea glutinosae Br.-Bl. et Tx. ex Westhoff et al. 1946 class). This phenomenon was confirmed by the analysis of peat cores [4,5,6,7,8] and aerial photographs [9] as well as by direct observations [5,10]. Different external factors may trigger alder swamp forest dieback, including human disturbance (mainly clear-cuts) [4,6], unusually severe and prolonged flooding [11,12] or a groundwater level increase as a result of the silting of abandoned drainage channels [9]. Some researchers suggest that natural forest dieback of black alder (Alnus glutinosa (L.) Gaertn.) trees may occur at the age of 100–150 years [5]. Young individuals of black alder have very high light demands and are not able to grow under a closed canopy of a mature alder carr stand [13,14,15]. Due to that, there is no younger generation of trees that could replace dead ones and assure rapid regeneration of the forest stand. Instead of this, a decreased evapotranspiration rate causes heavy waterlogging of the site. In those conditions, open communities of marshes develop directly after forest dieback. There is usually a time-lag preceding the renewed forest regeneration, because new alder seedlings may establish when a newly accumulated peat layer reaches the level above the groundwater table [5]. In many sites, dieback and regeneration processes occur alternately and form a dynamic pattern known as a cyclic succession model [4,5].
Due to the significant fluctuations in the groundwater table, the spatial structure of alder carr stands may be remarkably diverse and consist of two contrasting microhabitats, which are hummocks and hollows [16,17]. Hummocks are formed by adventitious roots of black alder and are elevated above the annual peak of the water table fluctuations [18]. They are covered by a thin layer of soil and litter and harbor numerous plant species typical of temperate deciduous forests. The hummocks are surrounded by the hollows, which are usually submerged from the autumn to the spring due to the high level of the groundwater table. The hummocks host numerous wetland plant species [19,20]. Due to the distinct environmental conditions of these two types of microhabitats, only a small number of well adapted plants can grow both on the hummocks and in the hollows [21].
The species composition in alder carrs is shaped by the intra-annual fluctuations in the water table, however, long-term trends in the level of the groundwater table also affect the compositional variability of wetland forests. The changes in the species composition in alder carrs were studied only in the context of decreases in the water table caused by large scale surface coal mining, extensive use of groundwater reserves and wetland drainage [22,23,24,25]. Contrary to this, a considerable prolonged increase in the groundwater table may follow forest dieback. This also involves changes in the light and temperature conditions. Although this process significantly alters the environmental conditions, little is known about how forest dieback affects the compositional variability in alder carrs. The aim of this study was to characterize and quantify the changes in the species composition in alder carr stands that have experienced forest dieback.
2. Materials and Methods
2.1. Study Site
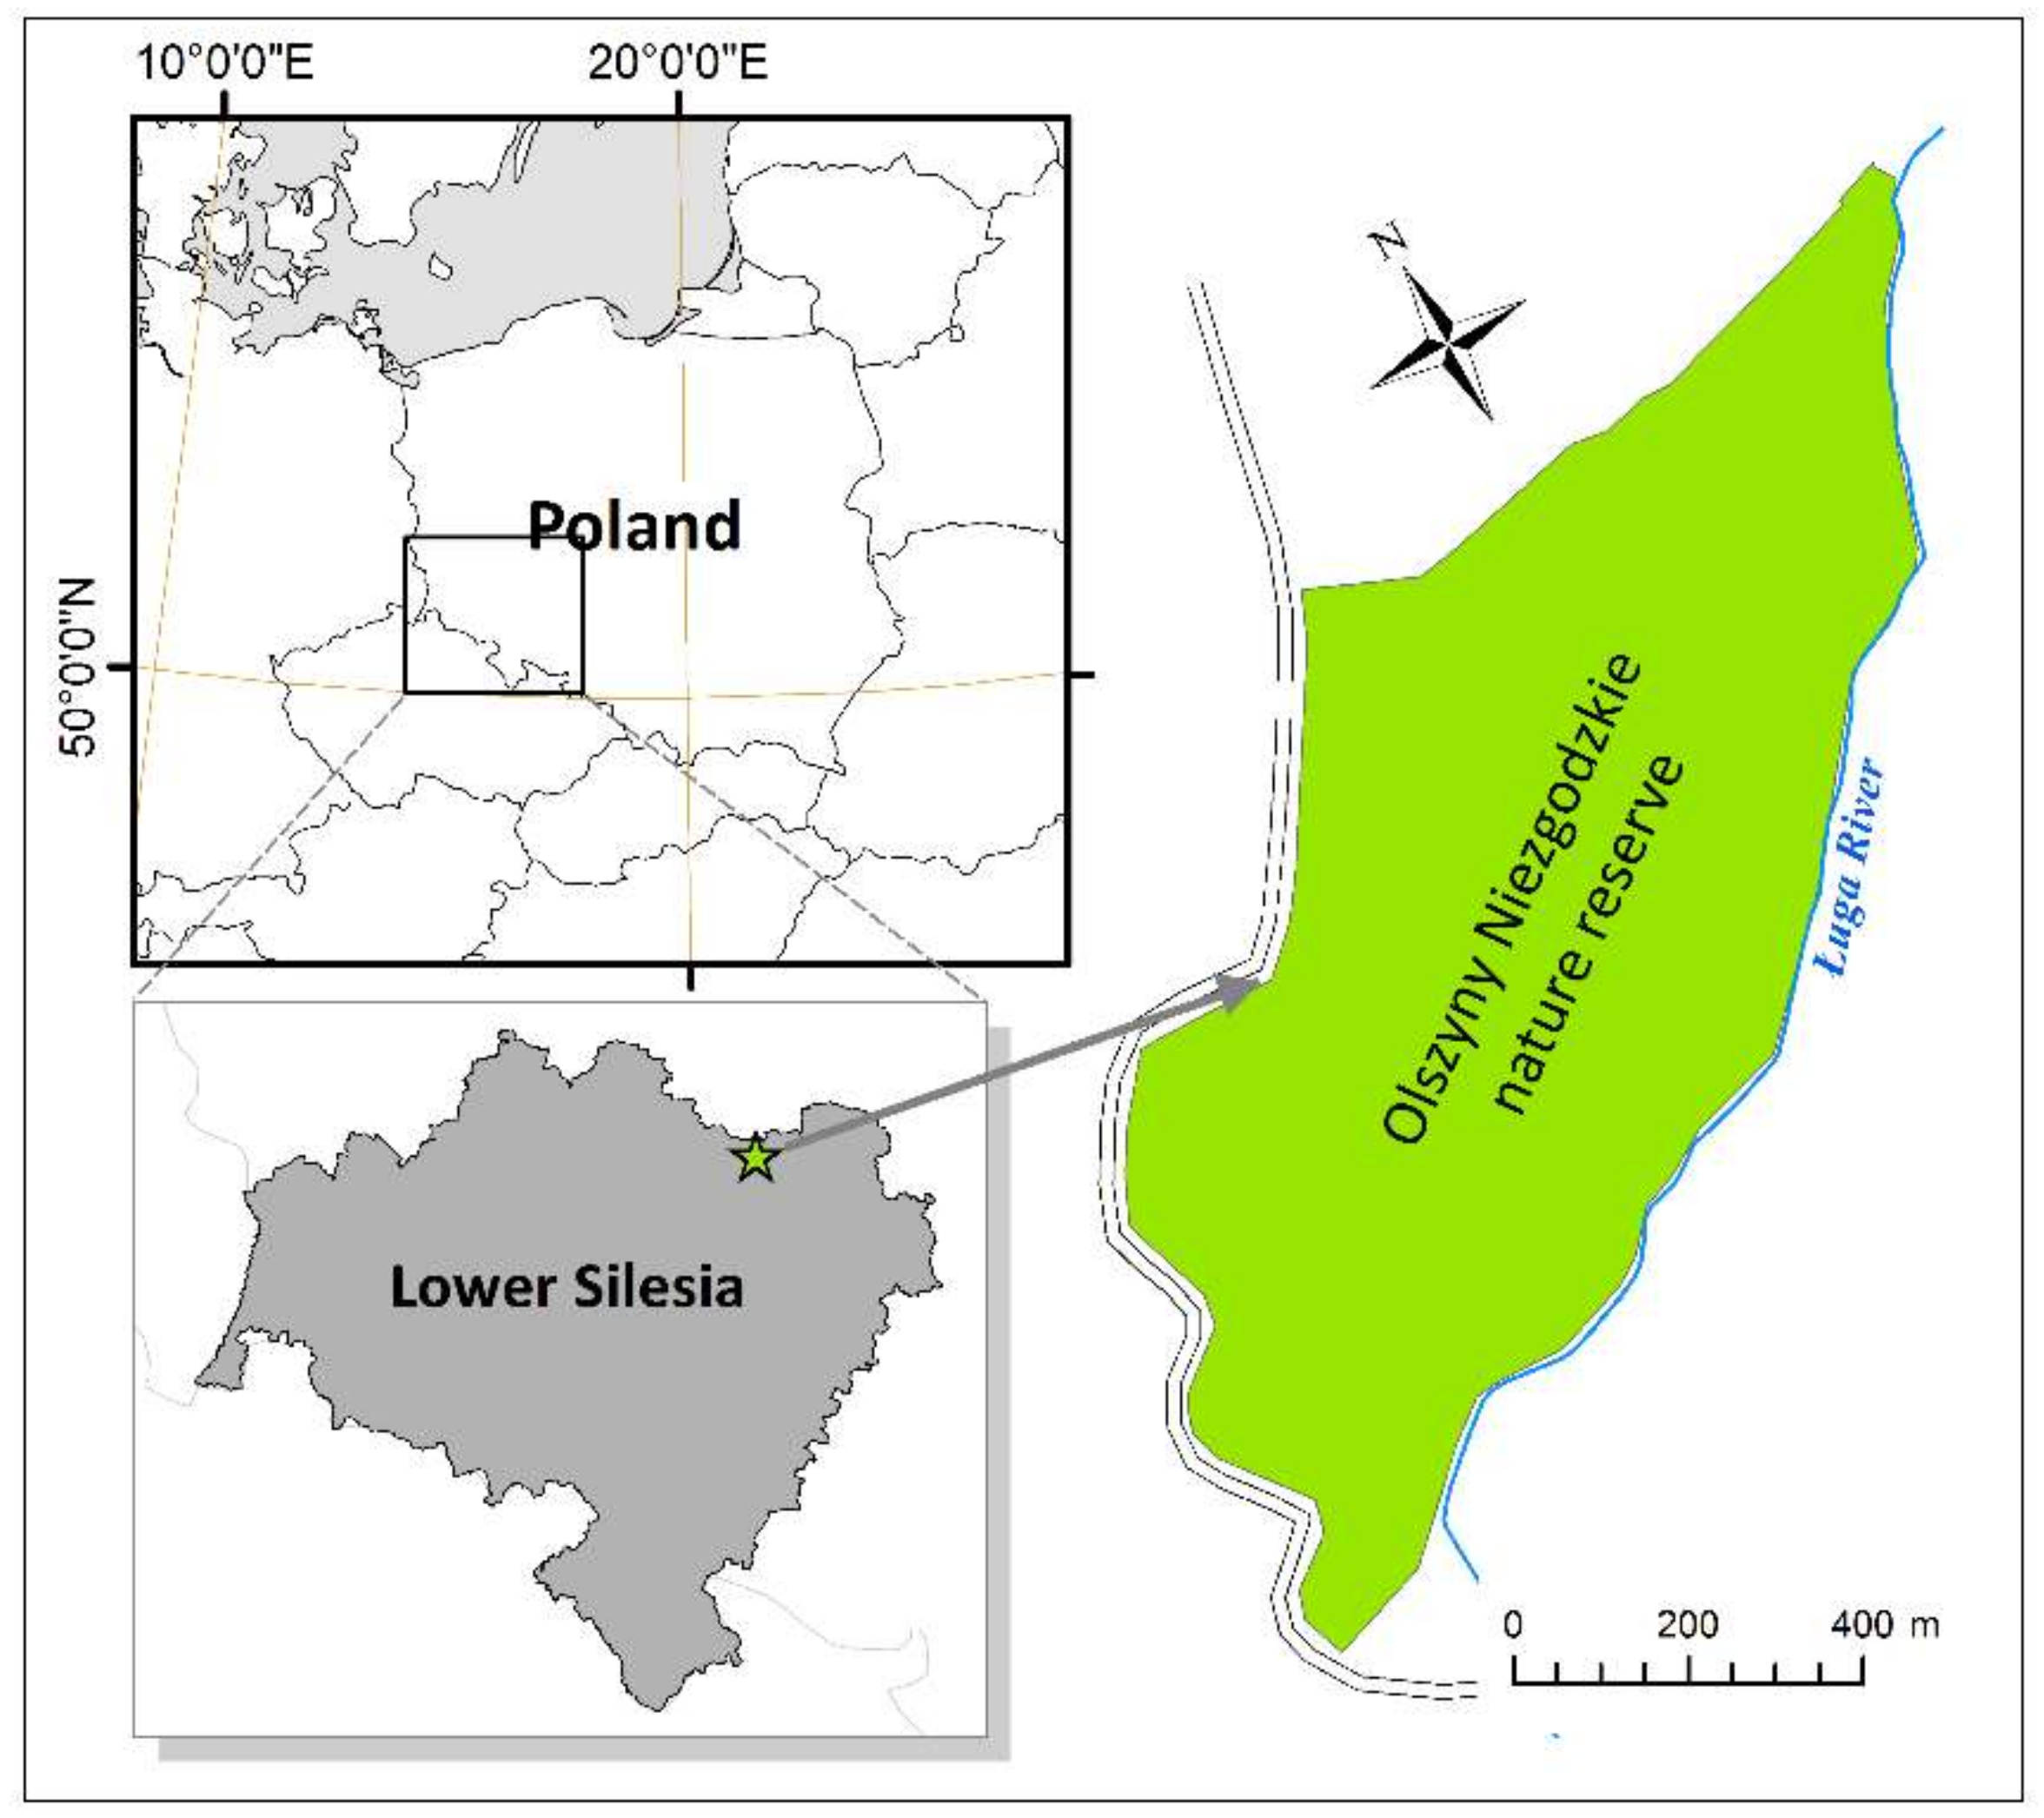
The research was conducted in the Olszyny Niezgodzkie strict nature reserve located in south-western Poland (17°1′54″ E, 51°30′26″ N, see Figure 1). The reserve has an area of 78.3 ha and was established in 1987 to protect natural alder swamp forests [26]. This is only a small portion of the total cover of alder swamp forests that grow in the Barycz River valley region, which is famous for wetland wildlife [27,28,29]. The hydrology of this area is influenced by the management of the nearby ‘Stawy Milickie’ fish-ponds, which is one of the largest complexes of fish-ponds in Europe with 285 ponds that cover a total area of ca. 77 km2. According to some authors, the total area of alder swamps in this region increased due to the development of this large fish-pond complex [30], which started as early as in the Middle Ages [26]. The Olszyny Niezgodzkie nature reserve is situated at an altitude of 93 m a.s.l. The mean annual temperature in this region is in the range of 8–8.5 °C [31], and the mean annual precipitation is about 600 mm [32].
2.2. Vegetation Sampling
In 1993, the Olszyny Niezgodzkie nature reserve was the subject of a detailed phytocosiological study (hereinafter referred to as the ‘old survey’), and the alder carr was documented by 16 phytosociological relevés [33]. The authors recognized the Ribeso nigri-Alnetum Sol.-Górn. (1975) 1987 (=Carici elongatae-Alnetum glutinosae Tüxen 1931) association, which is a common alder swamp forest type in Central Europe [34,35,36]. Unfortunately, no detailed localities of the plots sampled previously in the Olszyny Niezgodzkie reserve were given, with only the numbers of the forest sub-compartments, which are the smallest administration units in State Forests in Poland. A forest patch is distinguished as a sub-compartment that usually has the same age, structure, habitat conditions and species composition of trees. Thus, it may be generalized that within a whole forest sub-compartment the structure and composition of the forest community is similar.
In 2013, which was 20 years after the previous study, we resurveyed the same patches of alder carrs (hereinafter referred to as the ‘recent survey’). Due to a lack of information on detailed localities, we randomly generated the localities for the same number of new plots with the same size as previously surveyed in the forest sub-compartments. The area of the sub-compartments ranged from 0.6 to 8.5 hectares (mean = 3.1, Standard Deviation (SD) = 2.4). The new localities were generated in ArcGIS using the Create Random Points function (ArcGIS 10.1, Esri, Redlands, CA, USA). This procedure resulted in possible relocations of the re-surveyed plots. Based on the shape and size of the forest sub-compartments, we estimated a maximum possible plot relocation of up to 400 m. However, recent studies have clearly demonstrated that the resurvey of historical vegetation is robust to species pseudo-turnover caused by uncertainty in original plot location [37,38]. In addition, alder carr vegetation within sub-compartments was very homogeneous, thus the effect of the relocation error is reasonably low [38,39].
To avoid any possible phenological differences between the sampled plots, the new stands were surveyed at the same time of the year (with a five day accuracy). In addition, the species cover was estimated with the same abundance scale, which was the Braun-Blanquet scale [40]. The percentage cover of three vegetation layers were estimated, including trees, shrubs and herbs. Due to often narrow taxonomic concepts of the species recorded either in old or more recent surveys, they were not suitable sources of possible species determination as we used broader taxonomic concepts for the statistical analyses (for example, we used Galium palustre agg. for two narrowly defined species: G. palustre L. and G. elongatum C.Presl). All relevés from both old and recent surveys are stored in the Forest Database of Southern Poland [41].
2.3. Data Processing and Analysis
We used Non-metric Multidimensional Scaling (NMDS) to examine the overall variation in the species composition in a whole dataset. As the distribution of the plots suggested clear compositional differences between the old and recent survey, we used Permutational Multivariate Analysis of Variance (PERMANOVA) with 1000 permutations to test the significance of the vegetation change. To recognize the main gradients related to compositional shifts detected in the previous analysis, we used the Ellenberg’s Indicator Values (EIVs). The EIVs reflect the habitat preferences of Central-European vascular plants by placing them on defined 9-point (12-point for moisture) ordinal scales for seven environmental variables, including soil moisture, pH, nutrients, light, temperature, continentality and salinity [42]. EIVs are broadly used in applied ecology [43,44], including vegetation resurvey studies [45]. In this study, we calculated non-weighted means of EIVs for all samples from both old and new surveys for light, temperature, moisture, pH and nutrients. The EIVs were passively fitted into the NMDS ordinal space and tested for significance. For the significant variables we produced additional NMDS diagrams with variables presented as a surface. In addition, we compared temporal changes in mean EIVs between old and recent surveys using a permutation test based on randomized EIVs [46] with 10,000 permutations.
Different attributes of vegetation were also compared between old and recent surveys, including species richness, percentage cover of vegetation layers, Shannon and Simpson diversity indices and evenness. Finally, we analyzed changes in the frequency of vascular plant species using Chi square tests. All statistical analyses were conducted and graphically presented using R [47] with “vegan” [48] and “ggplot2” [49] packages. The biological nomenclatures used in this paper follow The Plant List (www.theplantlist.org, accessed 1 February 2018) for vascular plants and Mucina et al. [50] for vegetation units.
3. Results
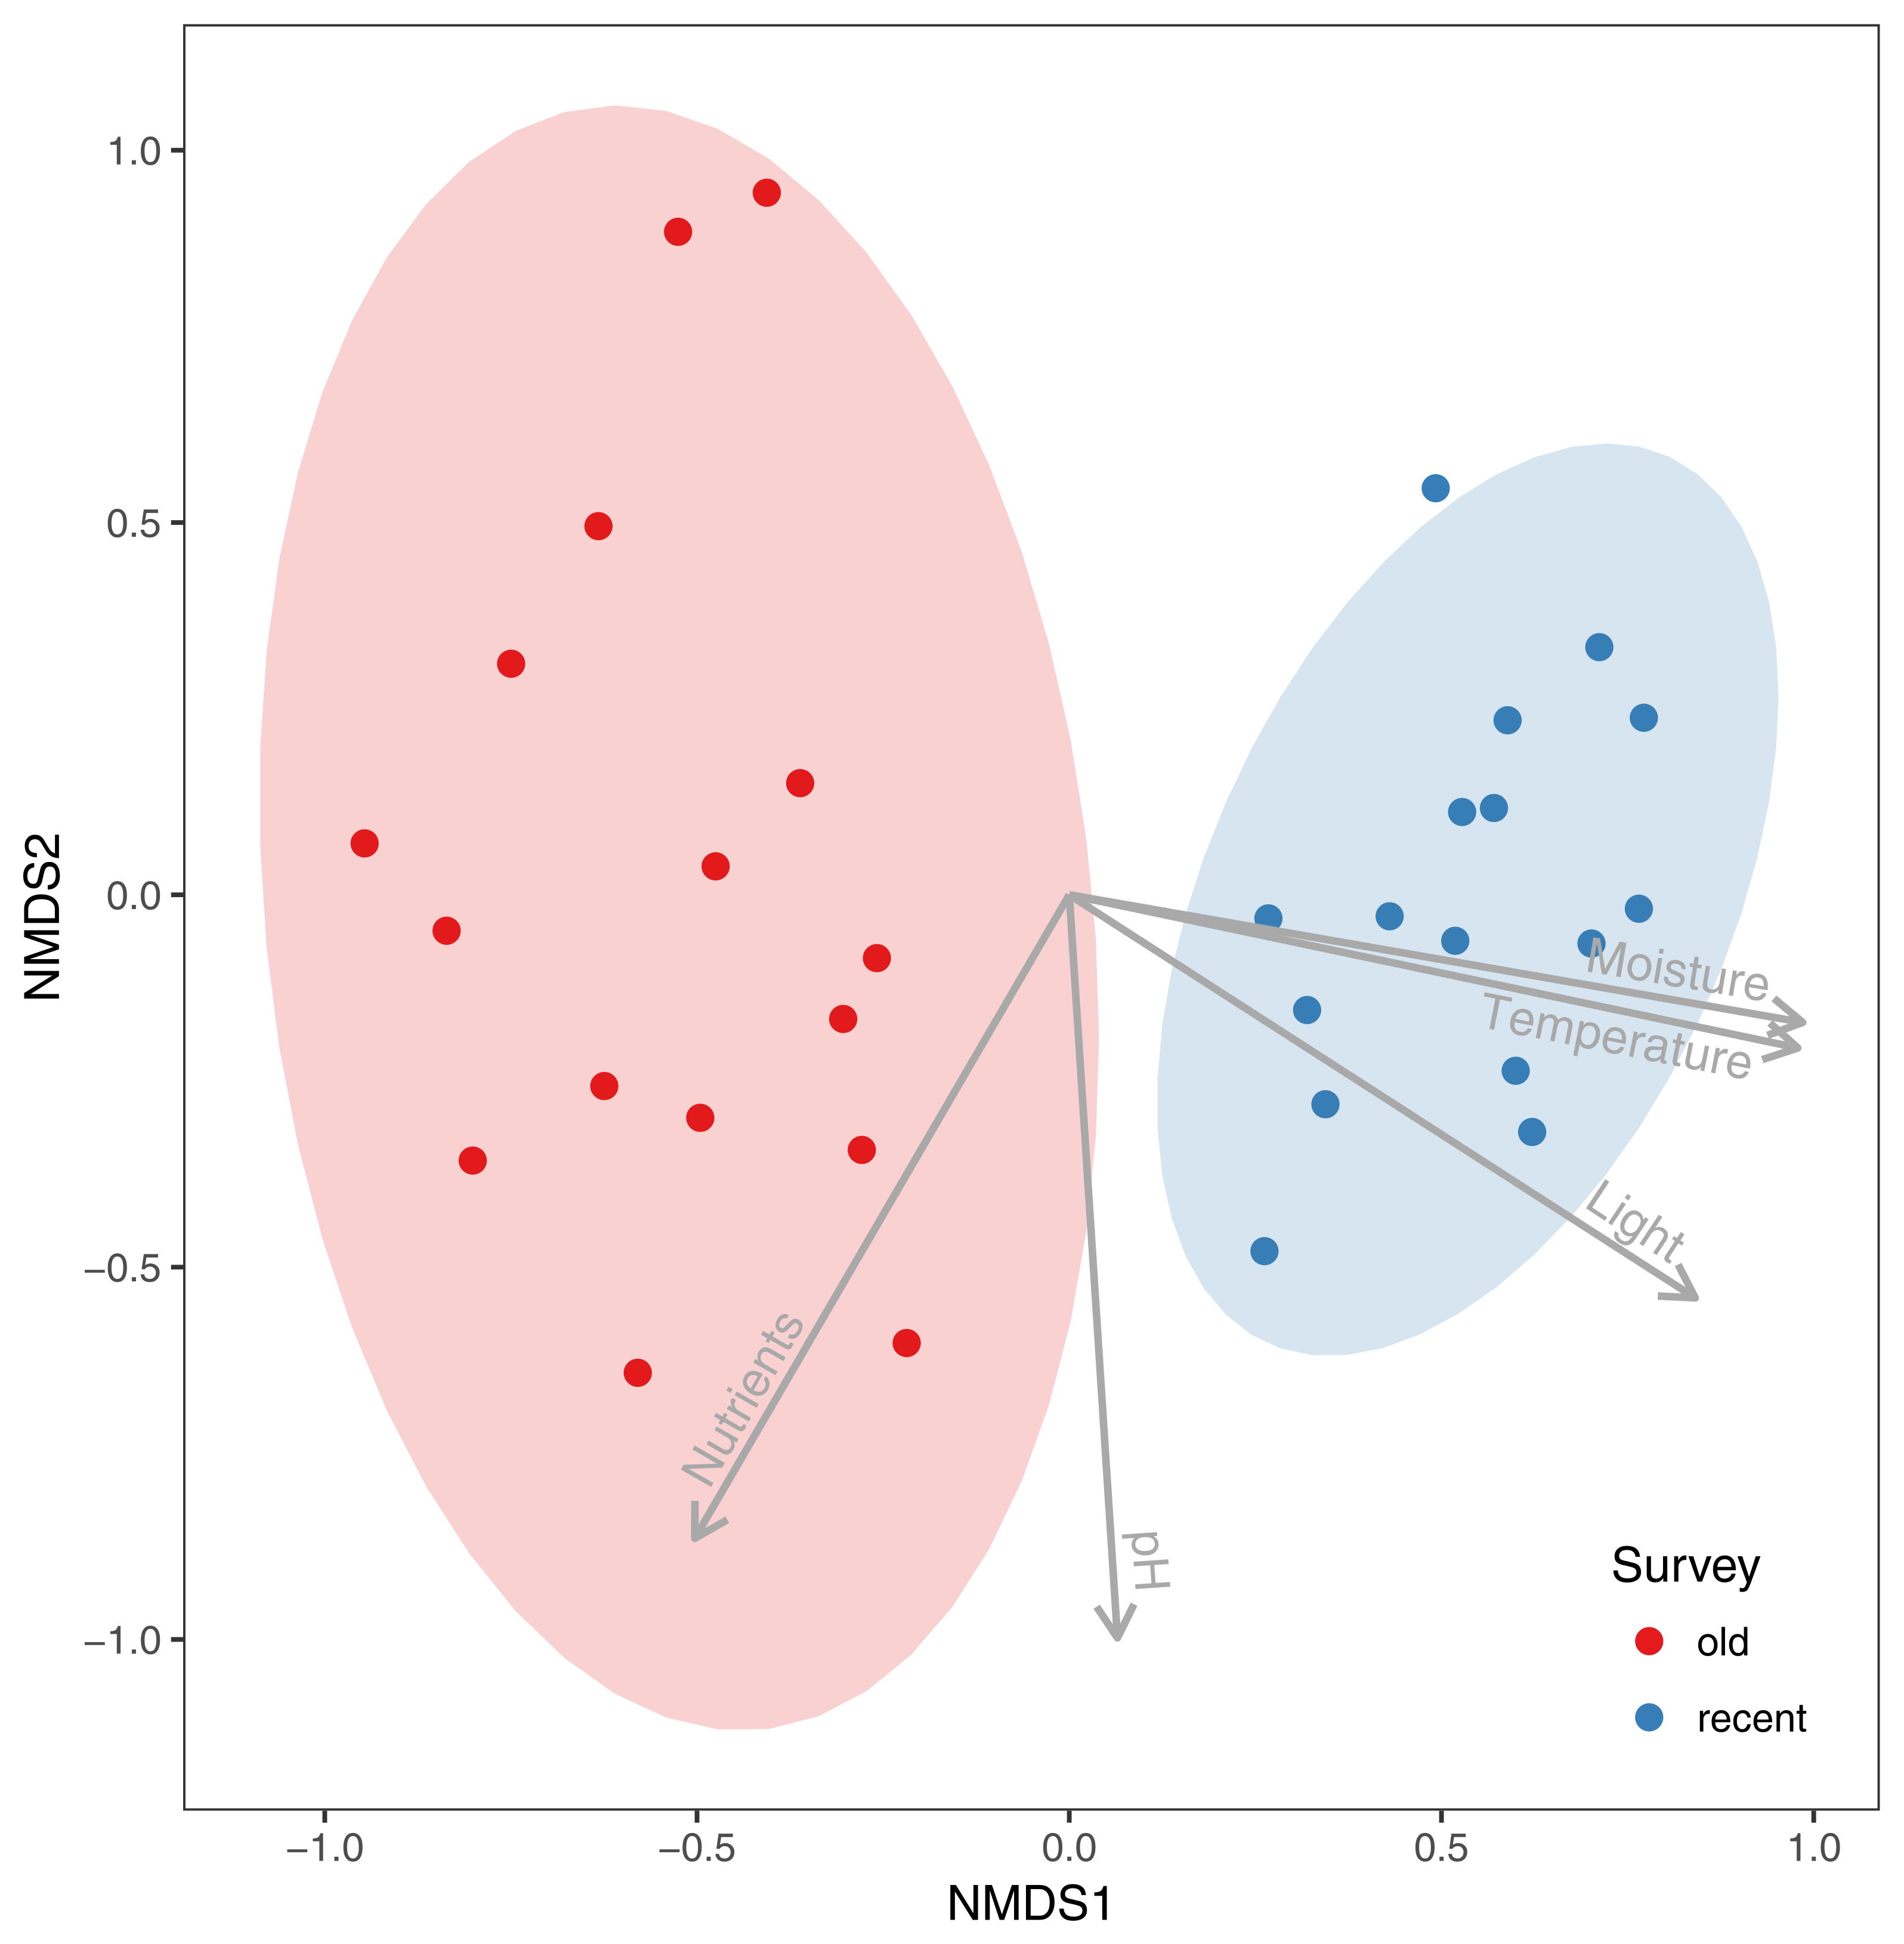
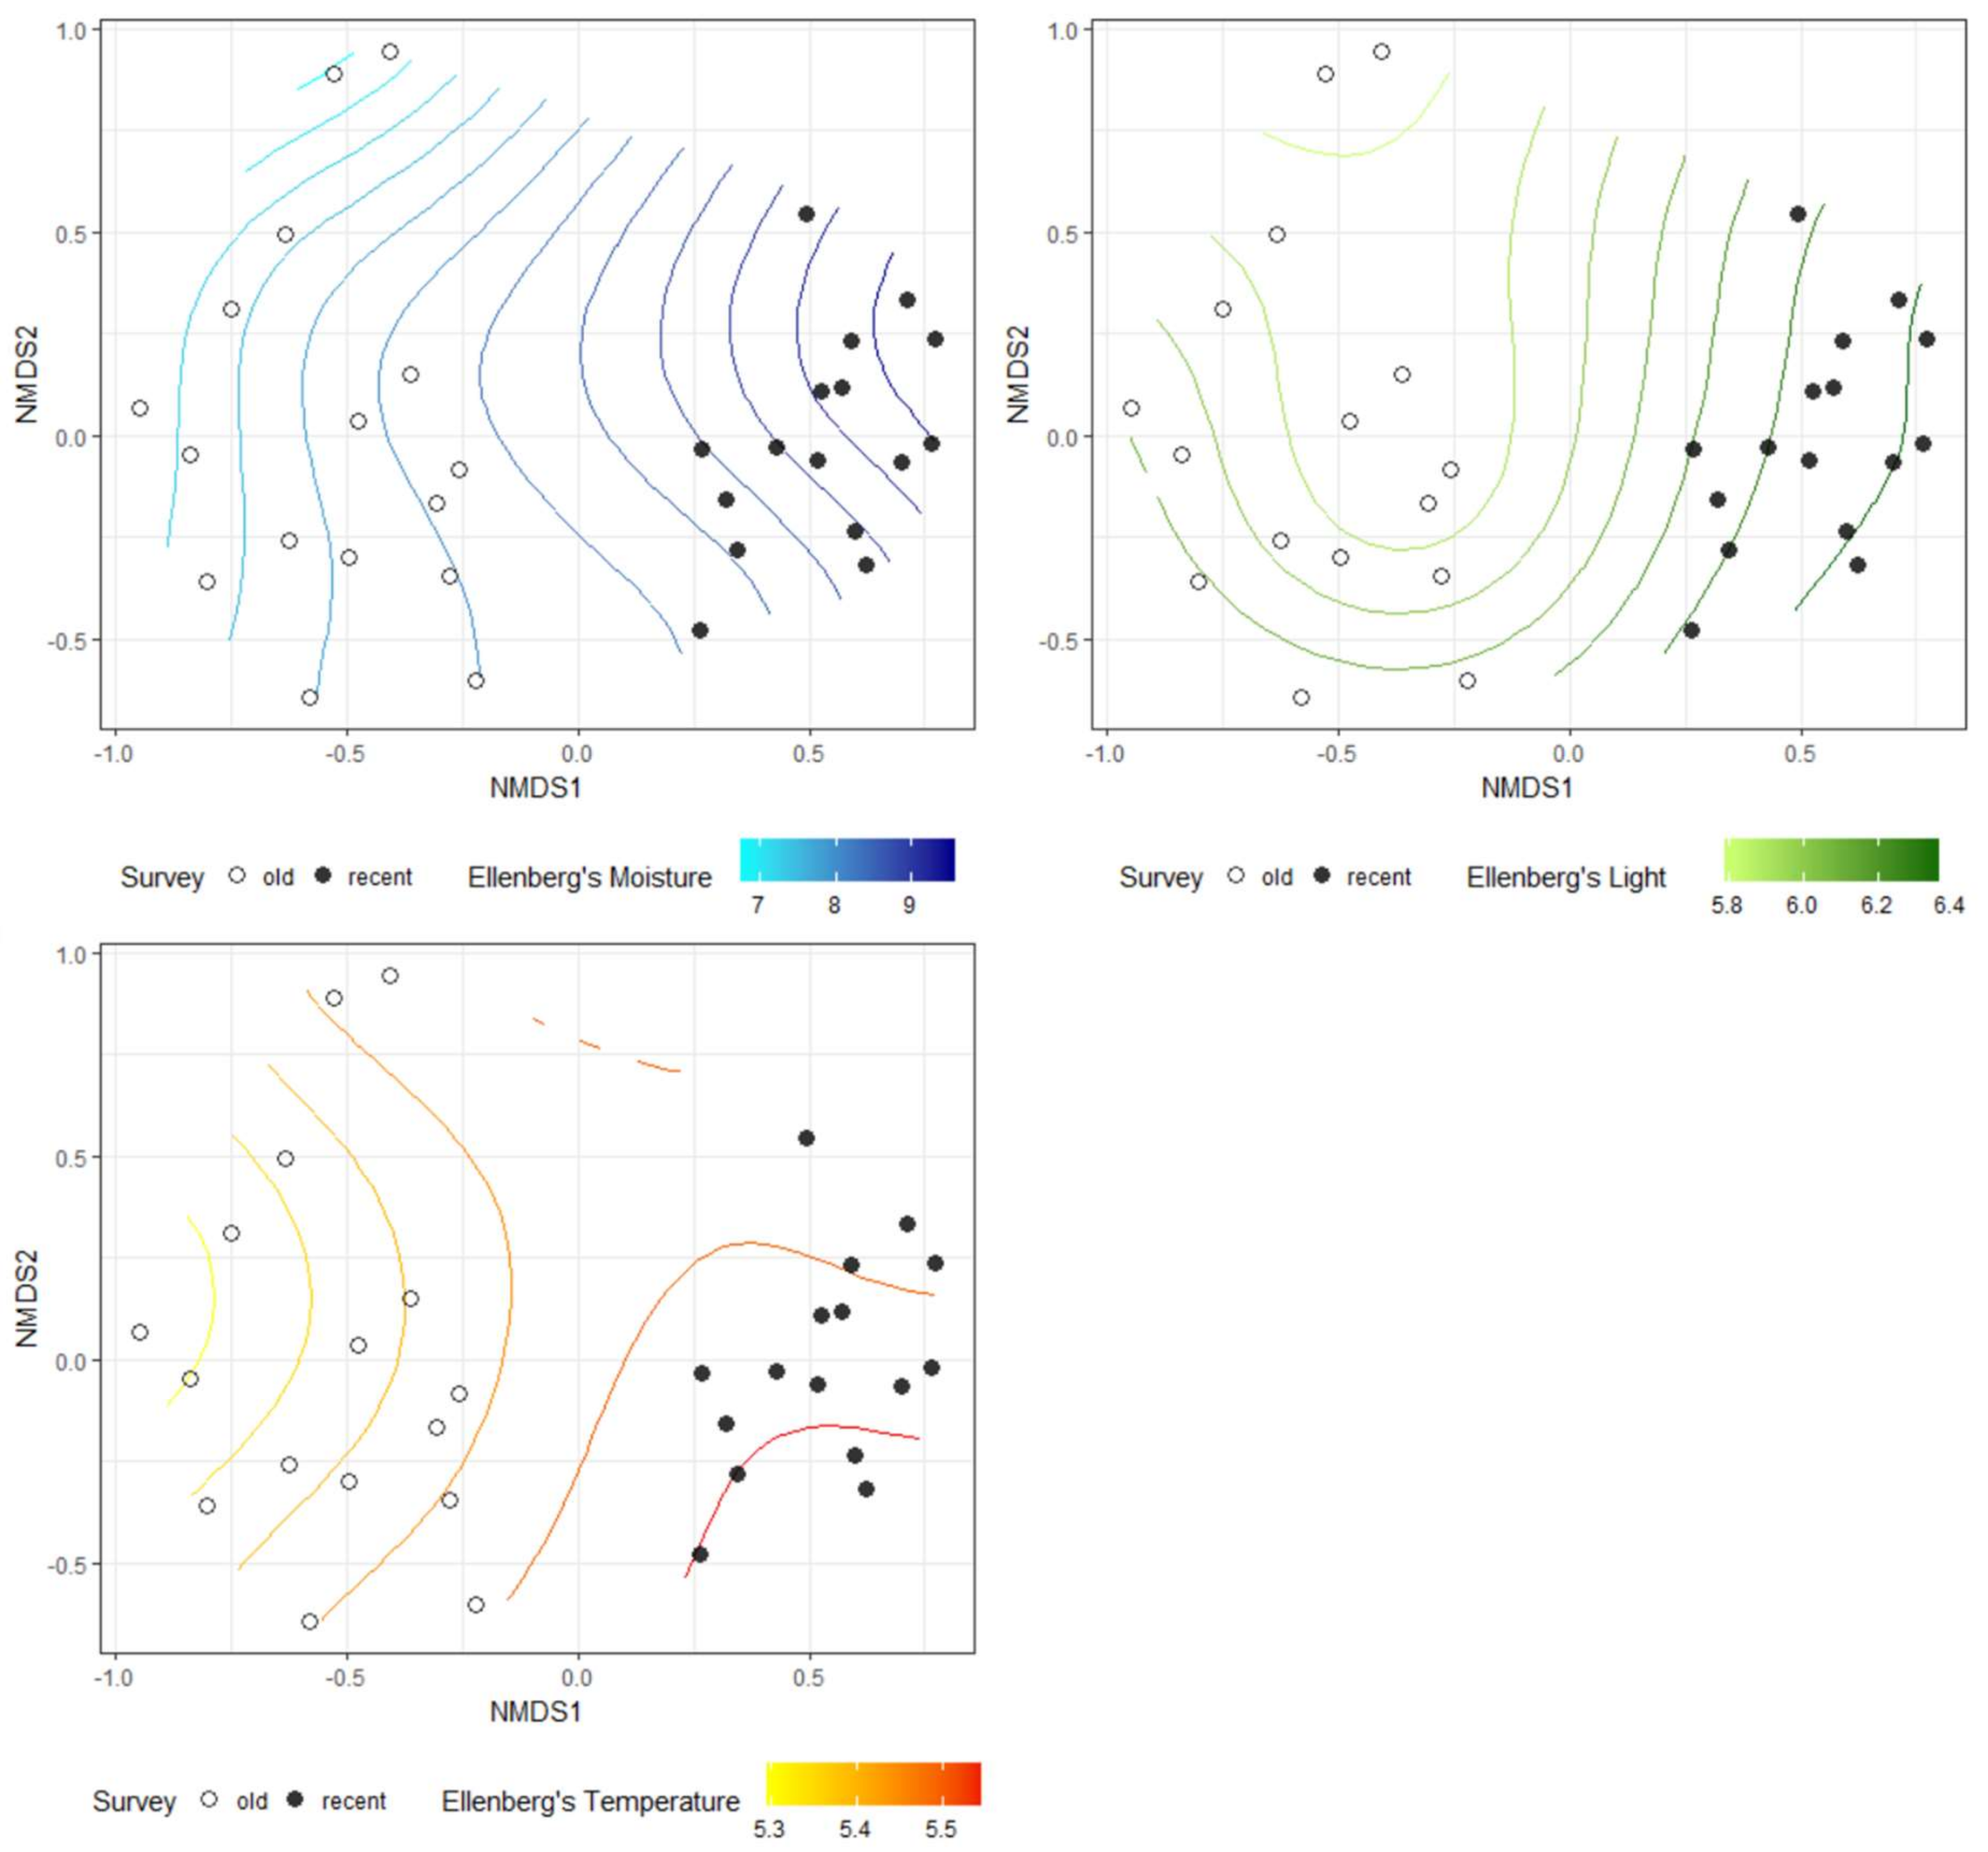
The NMDS analysis showed clear differences in species composition in alder carrs between old and recent surveys (Figure 2). The detected differences were statistically significant according to PERMANOVA (F = 13.306, R2 = 0.307, p = 0.001). Three out of five passively fitted variables were significant (Table 1). The correlation of the NMDS axes with the means for the EIVs revealed that differentiation of the plots along the first axis was positively correlated with an increase in moisture, light and temperature. Additional NMDS diagrams with the significant variables presented as a surface are given in Figure 3. However, a comparison of the mean EIVs using the modified permutation test revealed that only EIVs for moisture differed significantly between the old and recent surveys (Table 2).
Comparison of species richness, diversity indices and evenness did not reveal any significant changes between the old and recent surveys. The cover of trees decreased significantly after forest dieback; mean values in 1993 and 2013 were 51.9% and 34.4%, respectively. However, the opening of the canopy and subsequent increase in solar radiation reaching the shrubs and herbs did not influence the cover of the lower vegetation layers (Table 3).
The analysis of the frequencies of individual species showed that among the common species, five species increased and three species decreased (Table 4). In addition, we recorded five new species that had not been found in the old survey and we did not confirm two species that were common in 1993. A main pattern of compositional change emerged after a consideration of habitat preferences for the above-mentioned species: species of hollows with high moisture demands increased (Carex elongata L., Hydrocharis morsus-ranae L., Lemna minor L., L. trisulca L., Lycopus europaeus L., Lysimachia vulgaris L., L. thyrsiflora L., Lythrum salicaria L., Solanum dulcamara L.), while species of hummocks with moderate moisture demands decreased (Humulus lupulus L., Ribes nigrum L., Urtica dioica L.).
4. Discussion
4.1. Alder Carrs Dynamics and Related Floristic Changes
During the 20 years that had passed between the old and new surveys, the mean tree layer cover decreased from 51.9% to 34.4% as a result of dieback of black alder. This change significantly influenced the habitat conditions in the analyzed forest stands. Higher moisture is a result of a decreased evapotranspiration rate from black alder foliage, while higher light availability is an obvious effect of increased canopy transmittance and lower density of trees. We showed that the majority of the most common alder carr species responded to this environmental change. Many hygrophilous species growing in hollows increased, while some species with moderate moisture demands decreased. These findings are consistent with our initial expectation, of course. We also expected that decreasing one ecological group of species (hummocks) in favor of the second ecological group of species (hollows) will result in decreasing total plant diversity. Moreover, previous studies clearly suggest that increased tree mortality in most cases significantly influenced the ground flora species richness and diversity [51,52]. Surprisingly, we did not find any evidence for an effect on plant species richness and diversity indices. Compared to the survey conducted 20 years earlier, both plant species richness and diversity indices remained at the same level. In addition, the mean cover of shrub and herb layers remained stable throughout the analyzed period. It is possible that plant species in alder carrs are adapted to severe disturbances and loser species are able to survive in local microhabitats as long as the ecosystem will change towards more favorable conditions. However, an alternative explanation may be given based on the ecological threshold theory [53]. No significant change in plant diversity indices may be due to the fact that ongoing processes did not reach the ecological threshold, which represents the point of rapid change [52]. Thus, maintaining the current trend may cause rapid and abrupt changes in biodiversity indices in the future [54].
The detected compositional shifts revealed changes in the moisture conditions. It was reasonable to expect this trend, however the magnitude of the change in moisture conditions was really surprising. In the recent survey we identified a group of species, which were not reported 20 years earlier. These species are hydrophytes with leaves floating on the water surface and are typical of water bodies (Hydrocharis morsus-ranae, Lemna minor, L. trisulca). What is more, they dominated the ecosystems by covering about half of the sampled plots in the recent survey. These species clearly indicate that in dieback-affected alder carrs, the groundwater table can remain above the ground level over a whole year, as opposed to alder fens that developed in typical conditions with the soils inundated only for several months during a year [35]. The surveyed alder carr stands affected by forest dieback are changing towards a complex of marsh communities and this is consistent with previous observations and analysis of peat cores [4,5,6,7] in different parts of Europe. At this moment, it is not possible to reliably predict if this open marshland will be re-colonized by black alder. However, in the Barycz River valley, where this study was conducted, there are at least a few patches of marsh communities dominated by different sedges species, which are now being colonized by a young generation of black alder trees. Thus, it may be reasonably assumed that within this area the dynamic of at least some patches of alder swamp forests is consistent with a cyclic succession model [4,5].
4.2. Knowledge Gaps Related to Biodiversity Dynamics in Alder Carrs
Dieback of alder swamp forests was reported from different parts of Europe, however, little is known about the spatial extent of this phenomenon. Alder carrs can cover an area from several to hundreds of hectares. These patches are influenced by one hydrological system and it can be assumed that forest dieback may affect the whole community at a relatively large scale. However, large patches of alder swamp forests may be characterized by relatively high spatial heterogeneity, including differences in ground elevation, proximity to the river or the age of black alder trees. Thus, it is also possible that the forest dieback may affect only part of the large stand of the swamp forest, e.g., only the area placed at the lowest locations. An analysis of peat cores is local by nature, and thus cannot be normally used to address considerations relating to the spatial extent of swamp forest dieback. It seems that more insight may be given by a comparison of old and recent aerial photographs. These methods were successfully applied to document succession and large-scale dieback in alder swamp forests in the Czech Republic [9]. This study, however, documented dieback in forests developed on previously managed wet meadows, and more research is needed in forest stands with a documented forest continuity and little anthropogenic disturbance.
Assuming that natural large-scale diebacks in alder swamp forests are possible and forest communities may be temporarily replaced by open communities of marshlands, it is unknown how newly formed hummocks are recolonized by forest species. Observations and long-term studies in the recent forest showed that recolonization of forest herbs is a function of time and depends on the proximity to ancient woodland [55,56,57]. It has also been shown that the mean migration rate of ancient forest plant species in black alder wetland forests was lower than 1 m per year [58]. At this rate, it could be impossible to colonize a large patch of marshland during alder swamp forest succession. Thus, it is unknown how forest species of hummocks can survive a period of forest dieback and open communities with an elevated level of ground water. Furthermore, it needs to be tested if the broadly used concept of ancient forest indicator species [59,60,61] can be reliably applied to such a dynamic and cyclic forest ecosystem.
The spatial heterogeneity of alder swamp forests drives high plant species diversity. Species with significantly different habitat requirements may occur in close proximity on the hummocks and in the hollows. This microhabitat heterogeneity may also influence the diversity of other groups of organisms. For example, recent studies have shown that different proportions of spider guilds are associated with hummocks and hollows in alder swamp forests [62]. Unfortunately, there is no evidence for such differences in other groups of organisms, e.g., bryophytes, fungi, insects or snails. In addition, if swamp forest dieback eliminates microhabitats of hummock, how can the above mentioned groups respond to this phenomenon? Finally, there is also evidence that at least some of the stands of alder swamp forests may be relatively stable and continuous [30]. It remains unclear how those stands differ from the alder carrs undergoing cyclic succession in terms of environmental conditions, spatial structure and management history.
4.3. Implication for Resurvey Studies
In the era of rapid global changes, ecologists keep seeking robust and efficient methods for monitoring these changes. In recent years, studies on re-surveying vegetation plots that had been documented previously gained much attention [38,63,64]. In that field, Braun-Blanquet’s phytosociological approach [65] plays a crucial role. In spite of some limitations, this approach has some undisputed advantages, including consistent methods applied by researchers over the recent century and large amounts of historical data stored in databases worldwide [66,67,68]. This is probably the main reason why so many studies apply this method to re-survey vegetation on either permanent, quasi-(semi-) permanent or even non-traceable plots [38]. This study shows that extensive compositional changes in forest communities detected within two decades are a result of cyclical dynamics of alder swamp forests and has nothing to do with global changes. What is more, although the process of cyclic changes in different types of natural temperate forests is a well-known phenomenon, recent studies showed that forest dynamics may be also characterized by stochastic, unpredictable development pathways of acyclic nature [69,70]. Thus, the natural forest dynamics may strongly influence the results of re-survey studies that aimed to detect any possible global change [71,72]. To avoid biased interpretation of the compositional changes revealed in the re-survey studies, natural forest dynamics have to be taken into consideration.
5. Conclusions
The dieback in alder swamp forest resulted in extensive changes in the species composition. The main drivers of this change are a permanently higher groundwater level and higher light accessibility. As a result, the species of hummocks declined, while the species of hollows increased. The revealed tendency will lead to the replacement of forest stands by marshlands. The observed changes are consistent with a model of cyclic succession proposed for alder swamps. In addition, we conclude that natural forest dynamics have to be taken into consideration while interpreting the results of re-survey studies.
Author Contributions
Conceptualization, R.P.; Data curation, R.P. and M.M.; Formal analysis, R.P.; Funding acquisition, R.P.; Investigation, R.P. and M.M.; Methodology, R.P.; Project administration, R.P.; Resources, R.P. and M.M.; Supervision, R.P.; Visualization, R.P.; Writing—original draft, R.P.; Writing—review & editing, R.P.
Funding
This study was financially supported by a grant from the National Science Centre, Poland (2016/20/S/NZ8/00428).
Conflicts of Interest
The authors declare no conflict of interest.
References
- Whitmore, T.C. Canopy gaps and the two major groups of forest trees. Ecology 1989, 70, 536–538. [Google Scholar] [CrossRef]
- Yamamoto, S.-I. Forest gap dynamics and tree regeneration. J. For. Res. 2000, 5, 223–229. [Google Scholar] [CrossRef]
- Holeksa, J.; Jaloviar, P.; Kucbel, S.; Saniga, M.; Svoboda, M.; Szewczyk, J.; Szwagrzyk, J.; Zielonka, T.; Żywiec, M. Models of disturbance driven dynamics in the West Carpathian spruce forests. For. Ecol. Manag. 2017, 388, 79–89. [Google Scholar] [CrossRef]
- Barthelmes, A.; Gerloff, D.; Klerk, P.; Joosten, H. Short-term vegetation dynamics of Alnus dominated peatlands: A high resolution palaeoecological case study from Western Pomerania (NE Germany). Folia Geobot. 2010, 45, 279–302. [Google Scholar] [CrossRef]
- Pokorný, P.; Klimešová, J.; Klimeš, L. Late holocene history and vegetation dynamics of a floodplain alder carr: A case study from Eastern Bohemia, Czech Republic. Folia Geobot. 2000, 35, 43–58. [Google Scholar] [CrossRef]
- Natlandsmyr, B.; Hjelle, K.L. Long-term vegetation dynamics and land-use history: Providing a baseline for conservation strategies in protected Alnus glutinosa swamp woodlands. For. Ecol. Manag. 2016, 372, 78–92. [Google Scholar] [CrossRef]
- Saarse, L.; Niinemets, E.; Poska, A.; Veski, S. Is there a relationship between crop farming and the Alnus decline in the eastern Baltic region? Veg. History Archaeob. 2010, 19, 17–28. [Google Scholar] [CrossRef]
- Muller, S.D.; Miramont, C.; Bruneton, H.; Carré, M.; Sottocornola, M.; Court-Picon, M.; de Beaulieu, J.-L.; Nakagawa, T.; Schevin, P. A palaeoecological perspective for the conservation and restoration of wetland plant communities in the central French Alps, with particular emphasis on alder carr vegetation. Rev. Palaeobot. Palynol. 2012, 171, 124–139. [Google Scholar] [CrossRef]
- Douda, J.; Čejková, A.; Douda, K.; Kochánková, J. Development of alder carr after the abandonment of wet grasslands during the last 70 years. Ann. For. Sci. 2009, 66, 712. [Google Scholar] [CrossRef]
- Stenger, J. Erlenbruchwälder–Dynamik in Raum und Zeit. Konsequenzen für den Prozesschutz in einer Waldgesellschaft. Nat. Landsch. 2000, 32, 262–270. [Google Scholar]
- Reda, P. Rozmieszczenie lasów i parków oraz zmiany w składzie dendroflory po powodzi w 1997 roku w dolinie zalewowej Odry we Wrocławiu. In Praca Doktorska; Uniwersytet Wrocławski: Wrocław, Poland, 2002. [Google Scholar]
- Gorzelak, A. Auswirkungen von überschwemmungen auf die flora am beispiel des oderhochwassers 1997. Beitr. zur Forstwirtsch. Landsch. 2000, 34, 8–11. [Google Scholar]
- McVean, D.N. Ecology of Alnus glutinosa (L.) Gaertn: III. Seedling establishment. J. Ecol. 1956, 44, 195–218. [Google Scholar] [CrossRef]
- Pancer-Kotejowa, E.; Zarzycki, K. Zarys ekologii. In Olsze Alnus Mill; Białobok, S., Ed.; PWN: Warszaw, Poland, 1980; Volume 8, pp. 229–257. [Google Scholar]
- McVean, D.N. Ecology of Alnus glutinosa (L.) Gaertn: V. Notes on some british alder populations. J. Ecol. 1956, 44, 321–330. [Google Scholar] [CrossRef]
- Solinska-Górnicka, B. Alder (Alnus glutinosa) carr in Poland. Tuexenia 1987, 7, 329–346. [Google Scholar]
- Slezák, M.; Hrivnák, R.; Petrášová, A.; Dítě, D. Variability of alder-dominated forest vegetation along a latitudinal gradient in Slovakia. Acta Soc. Bot. Pol. 2013, 82, 25–35. [Google Scholar] [CrossRef]
- McVean, D.N. Ecology of Alnus glutinosa (L.) Gaertn: IV. Root system. J. Ecol. 1956, 44, 219–225. [Google Scholar] [CrossRef]
- Czerwiński, A.; Matowicka, B. Contact dynamic zones between plant communities in river valley and moraine upland. Phytocenosis (Supplementum Cartographie Geobotanicae) 1991, 3, 235–241. [Google Scholar]
- Slezák, M.; Hrivnák, R.; Petrášová, A. Syntaxonomy and ecology of black alder vegetation in the southern part of Central Slovakia. Hacquetia 2011, 10, 119–136. [Google Scholar] [CrossRef]
- Piotrowska, H. Lasy południowo-wschodniego Uznamu. Bad. Fizjogr. nad Polską Zach. 1960, 6, 69–158. [Google Scholar]
- Kazda, M. Changes in alder fens following a decrease in the ground water table: Results of a geographical information system application. J. Appl. Ecol. 1995, 32, 100–110. [Google Scholar] [CrossRef]
- Kazda, M.; Verbücheln, G.; Brans, S.; Luwe, M. Mapping of vegetation and soil changes in an alder carr affected by a decrease of water-table height. Phytocenosis (Supplementum Cartographie Geobotanicae) 1991, 3, 243–250. [Google Scholar]
- Kopeć, D.; Ratajczyk, N.; Wolańska-Kamińska, A.; Walisch, M.; Kruk, A. Floodplain forest vegetation response to hydroengineering and climatic pressure—A five decade comparative analysis in the Bzura river valley (Central Poland). For. Ecol. Manag. 2014, 314, 120–130. [Google Scholar] [CrossRef]
- Wittig, R.; Michels, C.; Wetzstein Sunke, C. Effects of irrigations on swamp forests drained by lignite mining. In Nature Conservation; Gafta, D., Akeroyd, J., Eds.; Spring: Berlin/Heidelberg, Germany, 2006; pp. 402–416. [Google Scholar]
- Dajdok, Z.; Pielech, R.; Raj, A.; Szczęśniak, E.; Wieniawska-Raj, B.; Zając, K. Rezerwaty Przyrody Województwa Dolnośląskiego; Regionalna Dyrekcja Ochrony Środowiska we Wrocławiu: Wrocław, Poland, 2017; p. 151. [Google Scholar]
- Dajdok, Z.; Klink, A.; Polechońska, L.; Dambiec, M.; Pielech, R. Abundance of Coleanthus subtilis in relation to nutrient concentrations in pond soils—A case study of localities in Poland. Flora 2017, 235, 41–50. [Google Scholar] [CrossRef]
- Magnuszewski, P.; Sendzimir, J.; Kronenberg, J. Conceptual modeling for adaptive environmental assessment and management in the Barycz valley, Lower Silesia, Poland. Int. J. Environ. Res. Public Health 2005, 2, 194–253. [Google Scholar] [CrossRef] [PubMed] [Green Version]
- Wuczyński, A.; Smyk, B.; Kołodziejczyk, P.; Lenkiewicz, W.; Orłowski, G.; Pola, A. Long-term changes in numbers of geese stopping over and wintering in south-western Poland. Central Eur. J. Biol. 2012, 7, 495–506. [Google Scholar] [CrossRef] [Green Version]
- Marek, S. Biologia i Stratygrafia Torfowisk Olszynowych w Polsce; PWRiL: Warszawa, Poland, 1965; Volume 57, p. 264. [Google Scholar]
- Piasecki, J. Temperatura powietrza (1951–1980). In Atlas Śląska Dolnego i Opolskiego; Pawlak, W., Ed.; Uniwersytet Wrocławski, Pracownia Atlasu Dolnego Śląska: Wrocław, Poland, 1997; p. 47. [Google Scholar]
- Bac-Bronowicz, J. Opady atmosferyczne (1951–1980). In Atlas Śląska Dolnego i Opolskiego; Pawlak, W., Ed.; Uniwersytet Wrocławski, Pracownia Atlasu Dolnego Śląska: Wrocław, Poland, 1997; p. 43. [Google Scholar]
- Anioł-Kwiatkowska, J.; Pender, K. Plan ochrony leśnego rezerwatu przyrody “Olszyny Niezgodzkie”. Unpublished work. 1997. [Google Scholar]
- Douda, J.; Boublík, K.; Slezák, M.; Biurrun, I.; Nociar, J.; Havrdová, A.; Doudová, J.; Aćić, S.; Brisse, H.; Brunet, J.; et al. Vegetation classification and biogeography of European floodplain forests and alder carrs. Appl. Veg. Sci. 2016, 19, 147–163. [Google Scholar] [CrossRef]
- Ellenberg, H. Vegetation Ecology of Central Europe; Cambridge University Press: Cambridge, UK, 2009; p. 756. [Google Scholar]
- Döring-Mederake, U. Alnion forests in Lower Saxony (FRG), their ecological requirements, classification and position within Carici elongatae-Alnetum of Northern Central Europe. Vegetatio 1990, 89, 107–119. [Google Scholar] [CrossRef]
- Kopecký, M.; Macek, M. Vegetation resurvey is robust to plot location uncertainty. Divers. Distrib. 2015, 21, 322–330. [Google Scholar] [CrossRef] [PubMed] [Green Version]
- Kapfer, J.; Hédl, R.; Jurasinski, G.; Kopecký, M.; Schei, F.H.; Grytnes, J.-A. Resurveying historical vegetation data—opportunities and challenges. Appl. Veg. Sci. 2017, 20, 164–171. [Google Scholar] [CrossRef]
- Ross, L.C.; Woodin, S.J.; Hester, A.; Thompson, D.B.A.; Birks, H.J.B. How important is plot relocation accuracy when interpreting re-visitation studies of vegetation change? Plant Ecol. Divers. 2010, 3, 1–8. [Google Scholar] [CrossRef]
- Kent, M.; Coker, P. Vegetation Description and Analysis: A practical Approach; John Wiley & Sons: Chichester, UK; New York, NY, USA; Brisbane, Australia; Toronto, Japan; Singapore, 1992; p. 363. [Google Scholar]
- Pielech, R.; Baran, J.; Bodziarczyk, J.; Kucharzyk, S.; Malicki, M.; Smoczyk, M.; Wilczek, Z.; Zarzycki, W.; Zięba, A. Forest database of Southern Poland. Phytocoenologia 2018, in press. [Google Scholar]
- Ellenberg, H.; Weber, H.E.; Düll, R.; Wirth, V.; Werner, W.; Paulißen, D. Zeigerwerte von Pflanzen in Mitteleuropa. Scr. Geobot. 1992, 18, 1–258. [Google Scholar]
- Diekmann, M. Species indicator values as an important tool in applied plant ecology—A review. Basic Appl. Ecol. 2003, 4, 493–506. [Google Scholar] [CrossRef]
- Pielech, R.; Zając, K.; Kadej, M.; Malicki, M.; Malkiewicz, A.; Tarnawski, D. Ellenberg’s indicator values support prediction of suitable habitat for pre-diapause larvae of endangered butterfly Euphydryas aurinia. PLoS ONE 2017, 12, e0179026. [Google Scholar] [CrossRef] [PubMed]
- Helm, N.; Essl, F.; Mirtl, M.; Dirnböck, T. Multiple environmental changes drive forest floor vegetation in a temperate mountain forest. Ecol. Evolut. 2017, 7, 2155–2168. [Google Scholar] [CrossRef] [PubMed] [Green Version]
- Zelený, D.; Schaffers, A.P. Too good to be true: Pitfalls of using mean Ellenberg indicator values in vegetation analyses. J. Veg. Sci. 2012, 23, 419–431. [Google Scholar] [CrossRef]
- R Core Team. R: A Language and Environment for Statistical Computing; R Foundation for Statistical Computing: Vienna, Austria, 2018. [Google Scholar]
- Oksanen, J.; Blanchet, F.G.; Friendly, M.; Kindt, R.; Legendre, P.; McGlinn, D.; Minchin, P.R.; O’Hara, R.B.; Simpson, G.L.; Solymos, P.; et al. Vegan: Community Ecology Package. R Package Version 2.5-1. 2018. Available online: https://cran.r-project.org/web/packages/vegan/ (accessed on 17 May 2018).
- Wickham, H. Ggplot2: Elegant Graphics for Data Analysis; Spring: New York, NY, USA, 2009. [Google Scholar]
- Mucina, L.; Bültmann, H.; Dierßen, K.; Theurillat, J.-P.; Raus, T.; Čarni, A.; Šumberová, K.; Willner, W.; Dengler, J.; García, R.G.; et al. Vegetation of europe: Hierarchical floristic classification system of vascular plant, bryophyte, lichen, and algal communities. Appl. Veg. Sci. 2016, 19, 3–264. [Google Scholar] [CrossRef]
- Martin, P.A.; Newton, A.C.; Cantarello, E.; Evans, P. Stand dieback and collapse in a temperate forest and its impact on forest structure and biodiversity. For. Ecol. Manag. 2015, 358, 130–138. [Google Scholar] [CrossRef]
- Evans, P.M.; Newton, A.C.; Cantarello, E.; Martin, P.; Sanderson, N.; Jones, D.L.; Barsoum, N.; Cottrell, J.E.; A’Hara, S.W.; Fuller, L. Thresholds of biodiversity and ecosystem function in a forest ecosystem undergoing dieback. Sci. Rep. 2017, 7, 6775. [Google Scholar] [CrossRef] [PubMed] [Green Version]
- Scheffer, M.; Carpenter, S.R.; Lenton, T.M.; Bascompte, J.; Brock, W.; Dakos, V.; van de Koppel, J.; van de Leemput, I.A.; Levin, S.A.; van Nes, E.H.; et al. Anticipating critical transitions. Science 2012, 338, 344–348. [Google Scholar] [CrossRef] [PubMed] [Green Version]
- Scheffer, M.; Carpenter, S.R. Catastrophic regime shifts in ecosystems: Linking theory to observation. Trends Ecol. Evolut. 2003, 18, 648–656. [Google Scholar] [CrossRef]
- Lõhmus, K.; Paal, T.; Liira, J. Long-term colonization ecology of forest-dwelling species in a fragmented rural landscape—Dispersal versus establishment. Ecol. Evolut. 2014, 4, 3113–3126. [Google Scholar] [CrossRef] [PubMed]
- Brunet, J.; Von Oheimb, G. Migration of vascular plants to secondary woodlands in southern Sweden. J. Ecol. 1998, 86, 429–438. [Google Scholar] [CrossRef] [Green Version]
- Dzwonko, Z. Relations between the floristic composition of isolated young woods and their proximity to ancient woodland. J. Veg. Sci. 1993, 4, 693–698. [Google Scholar] [CrossRef]
- Orczewska, A. Colonization capacity of herb woodland species in fertile, recent alder woodlanda adjacent to ancient forest sites. Pol. J. Ecol. 2010, 58, 297–310. [Google Scholar]
- Hermy, M.; Honnay, O.; Firbank, L.; Grashof-Bokdam, C.; Lawesson, J.E. An ecological comparison between ancient and other forest plant species of Europe, and the implications for forest conservation. Biol. Conserv. 1999, 91, 9–22. [Google Scholar] [CrossRef]
- Hermy, M.; Verheyen, K. Legacies of the past in the present-day forest biodiversity: A review of past land-use effects on forest plant species composition and diversity. Ecol. Res. 2007, 22, 361–371. [Google Scholar] [CrossRef]
- Dzwonko, Z. Wskaźnikowe gatunki roślin starych lasów i ich znaczenie dla ochrony przyrody i kartografii roślinności. Prace Geogr. 2001, 178, 120–132. [Google Scholar]
- Stańska, M.; Stański, T.; Gladzka, A.; Bartos, M. Spider assemblages of hummocks and hollows in a primeval alder carr in the Bialowieza National Park - effect of vegetation structure and soil humidity. Pol. J. Ecol. 2016, 64, 564–577. [Google Scholar] [CrossRef]
- Verheyen, K.; De Frenne, P.; Baeten, L.; Waller, D.M.; Hédl, R.; Perring, M.P.; Blondeel, H.; Brunet, J.; Chudomelová, M.; Decocq, G.; et al. Combining biodiversity resurveys across regions to advance global change research. BioScience 2017, 67, 73–83. [Google Scholar] [CrossRef]
- Tingley, M.W.; Beissinger, S.R. Detecting range shifts from historical species occurrences: New perspectives on old data. Trends Ecol. Evol. 2009, 24, 625–633. [Google Scholar] [CrossRef] [PubMed]
- Kent, M. Vegetation Description and Data Analysis: A Practical Approach; Wiley-Blackwell: Hoboken, NJ, USA, 2012; p. 414. [Google Scholar]
- Chytrý, M.; Hennekens, S.M.; Jiménez-Alfaro, B.; Knollová, I.; Dengler, J.; Jansen, F.; Landucci, F.; Schaminée, J.H.J.; Aćić, S.; Agrillo, E.; et al. European Vegetation Archive (EVA): An integrated database of European vegetation plots. Appl. Veg. Sci. 2016, 19, 173–180. [Google Scholar] [CrossRef]
- Dengler, J.; Team, S.C. Splot: The first global vegetation-plot database and opportunities to contribute in IAVS. IAVS Bull. 2014, 34–37. [Google Scholar]
- Dengler, J.; Jansen, F.; Glöckler, F.; Peet, R.K.; De Cáceres, M.; Chytrý, M.; Ewald, J.; Oldeland, J.; Lopez-Gonzalez, G.; Finckh, M.; et al. The Global Index of Vegetation-plot Databases (GIVD): A new resource for vegetation science. J. Veg. Sci. 2011, 22, 582–597. [Google Scholar] [CrossRef]
- Woods, K.D. Predictability, contingency, and convergence in late succession: Slow systems and complex data-sets. J. Veg. Sci. 2007, 18, 543–554. [Google Scholar] [CrossRef]
- Král, K.; Daněk, P.; Janík, D.; Krůček, M.; Vrška, T. How cyclical and predictable are Central European temperate forest dynamics in terms of development phases? J. Veg. Sci. 2018, 29, 84–97. [Google Scholar] [CrossRef]
- Hédl, R.; Kopecký, M.; Komárek, J. Half a century of succession in a temperate oakwood: From species-rich community to mesic forest. Divers. Distrib. 2010, 16, 267–276. [Google Scholar] [CrossRef]
- Taverna, K.; Peet, R.K.; Phillips, L.C. Long-term change in ground-layer vegetation of deciduous forests of the North Carolina Piedmont, USA. J. Ecol. 2005, 93, 202–213. [Google Scholar] [CrossRef] [Green Version]
Figure 1.
Location of the Olszyny Niezgodzkie nature reserve in the Central-European and regional (Lower Silesia) context.
Figure 1.
Location of the Olszyny Niezgodzkie nature reserve in the Central-European and regional (Lower Silesia) context.

Figure 2.
Comparison of species composition in alder carrs in 1993 (old survey) and 2013 (recent survey) using nonmetric multidimensional scaling with passively fitted community means of Ellenberg’s Indicator Values.
Figure 2.
Comparison of species composition in alder carrs in 1993 (old survey) and 2013 (recent survey) using nonmetric multidimensional scaling with passively fitted community means of Ellenberg’s Indicator Values.
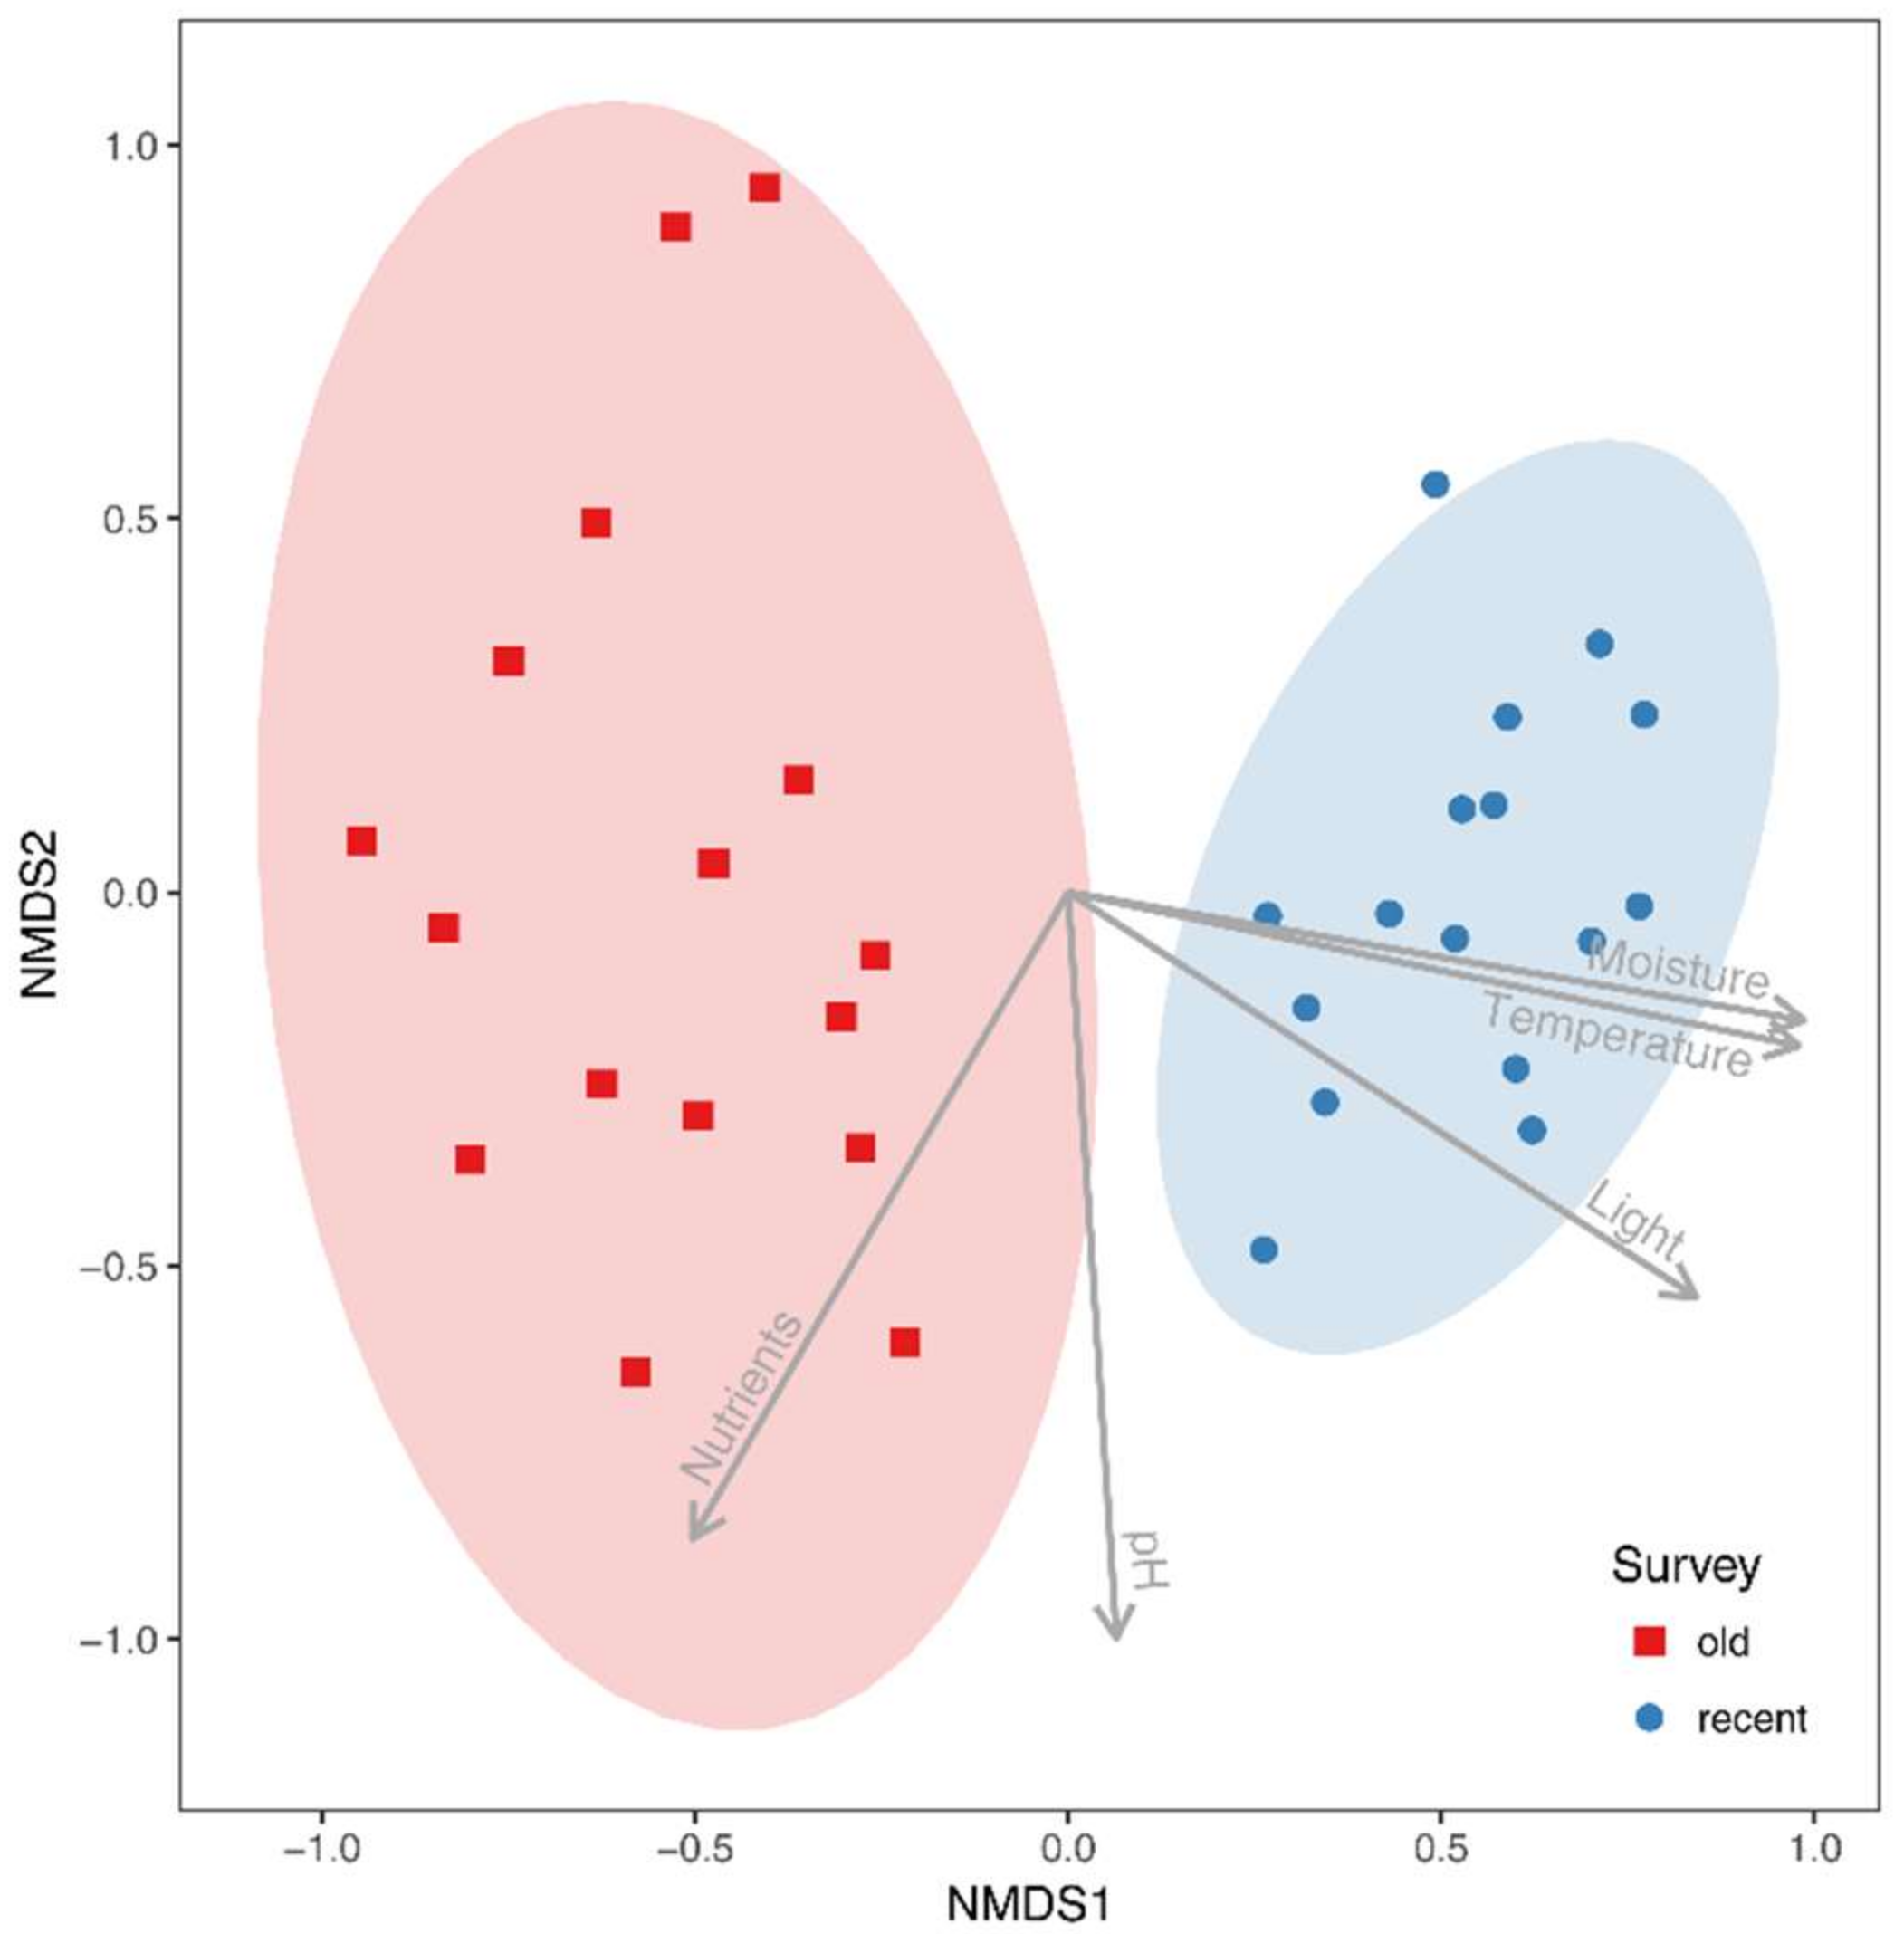
Figure 3.
Ellenberg’s moisture, light and temperature passively fitted as surface into ordinal space in NMDS.
Figure 3.
Ellenberg’s moisture, light and temperature passively fitted as surface into ordinal space in NMDS.


Table 1.
Correlation coefficients of environmental variables with sample scores of NMDS axes 1 and 2.
Table 1.
Correlation coefficients of environmental variables with sample scores of NMDS axes 1 and 2.
| Variable | NMDS1 | NMDS2 | R2 | p |
|---|---|---|---|---|
| Light | 0.841 | −0.541 | 0.391 | 0.004 |
| Temperature | 0.979 | −0.206 | 0.294 | 0.009 |
| Moisture | 0.985 | −0.171 | 0.816 | 0.001 |
| pH | 0.065 | −0.998 | 0.141 | 0.118 |
| Nutrients | −0.503 | −0.864 | 0.120 | 0.157 |
NMDS: nonmetric multidimensional scaling; Significant values (p ≤ 0.05, based on 10,000 permutations) are marked in bold.
Table 2.
Comparison of mean EIVs between surveys in 1993 and 2013 using modified permutation test [46].
Table 2.
Comparison of mean EIVs between surveys in 1993 and 2013 using modified permutation test [46].
| EIVs | 1993 | 2013 | F-value | p | ||
|---|---|---|---|---|---|---|
| x− | SD | x− | SD | |||
| Light | 5.96 | 0.37 | 6.36 | 0.17 | 15.345 | 0.114 |
| Temperature | 5.44 | 0.17 | 5.56 | 0.09 | 5.947 | 0.330 |
| Moisture | 7.54 | 0.51 | 9.01 | 0.49 | 68.107 | 0.001 |
| pH | 5.91 | 0.49 | 5.78 | 0.28 | 0.852 | 0.706 |
| Nutrients | 6.18 | 0.56 | 5.79 | 0.35 | 5.622 | 0.348 |
EIVs: Ellenberg’s Indicator Values; The significant values (p ≤ 0.05) are marked in bold.
Table 3.
Comparison of vegetation layer covers and diversity measures between surveys in 1993 and 2013.
Table 3.
Comparison of vegetation layer covers and diversity measures between surveys in 1993 and 2013.
| Forest Characteristics | 1993 | 2013 | p | ||
|---|---|---|---|---|---|
| x̄ | SD | x̄ | SD | ||
| Trees | 51.88 | 19.31 | 34.38 | 22.20 | 0.024 |
| Shrubs | 3.94 | 4.51 | 4.75 | 6.27 | 0.677 |
| Herbs | 82.19 | 21.83 | 86.25 | 9.57 | 0.503 |
| Evenness | 0.70 | 0.10 | 0.71 | 0.08 | 0.858 |
| Richness | 21.63 | 10.04 | 20.63 | 7.32 | 0.750 |
| Shannon | 2.12 | 0.57 | 2.12 | 0.40 | 0.989 |
| Simpson | 0.78 | 0.10 | 0.79 | 0.08 | 0.845 |
The significant values (p ≤ 0.05) are marked in bold.
Table 4.
List of plant species that formed whole dataset (32 samples) with frequency higher than 25%.
Table 4.
List of plant species that formed whole dataset (32 samples) with frequency higher than 25%.
| Species | Frequency | χ2 | p | ||
|---|---|---|---|---|---|
| 1993 | 2013 | ||||
| Alnus glutinosa (L.) Gaertn. | 100.0% | 100.0% | - | - | |
| Carex elongata L. | ↗ | 31.3% | 93.8% | 10.800 | 0.001 |
| Phragmites australis (Cav.) Trin. ex Steud. | 43.8% | 81.3% | 3.333 | 0.068 | |
| Urtica dioica L. | ↘ | 87.5% | 31.3% | 8.295 | 0.004 |
| Dryopteris carthusiana (Vill.) H.P. Fuchs | ↗ | 25.0% | 81.3% | 8.031 | 0.005 |
| Deschampsia cespitosa (L.) P.Beauv. | 68.8% | 37.5% | 2.008 | 0.156 | |
| Carex acutiformis Ehrh. | 43.8% | 62.5% | 0.502 | 0.479 | |
| Galium palustre L. | 37.5% | 62.5% | 1.125 | 0.289 | |
| Lemna minor L. | + | 0.0% | 100.0% | - | - |
| Iris pseudacorus L. | 31.3% | 62.5% | 2.008 | 0.156 | |
| Thelypteris palustris Schott | 31.3% | 56.3% | 1.143 | 0.285 | |
| Lycopus europaeus L. | ↗ | 12.5% | 75.0% | 10.286 | 0.001 |
| Calamagrostis canescens (Weber) Roth | 43.8% | 43.8% | 0.000 | 1.000 | |
| Solanum dulcamara L. | ↗ | 6.3% | 75.0% | 12.955 | 0.000 |
| Rubus idaeus L. | 56.3% | 25.0% | 2.073 | 0.150 | |
| Lemna trisulca L. | + | 0.0% | 75.0% | - | - |
| Lythrum salicaria L. | ↗ | 12.5% | 62.5% | 6.533 | 0.011 |
| Bidens frondosa L. | 18.8% | 50.0% | 2.216 | 0.136 | |
| Lysimachia vulgaris L. | + | 0.0% | 68.8% | - | - |
| Hydrocharis morsus-ranae L. | + | 0.0% | 62.5% | - | - |
| Ribes nigrum L. | ↘ | 56.3% | 6.3% | 7.127 | 0.008 |
| Prunus padus L. | 37.5% | 25.0% | 0.145 | 0.703 | |
| Lysimachia thyrsiflora L. | + | 0.0% | 56.3% | - | - |
| Sorbus aucuparia L. | 37.5% | 18.8% | 0.618 | 0.432 | |
| Peucedanum palustre (L.) Moench | 25.0% | 31.3% | 0.000 | 1.000 | |
| Galium aparine L. | – | 56.3% | 0.0% | - | - |
| Acer pseudoplatanus L. | 25.0% | 25.0% | 0.000 | 1.000 | |
| Humulus lupulus L. | ↘ | 43.8% | 6.3% | 4.167 | 0.041 |
| Stellaria aquatica (L.) Scop. | – | 50.0% | 0.0% | - | - |
| Scutellaria galericulata L. | 18.8% | 31.3% | 0.167 | 0.683 | |
Changes in site occupation between surveys in 1993 and 2013 were significant for eight species (Chi square test, p < 0.05), and are marked in bold. In addition, two species common during first survey disappeared, while there were five new common plant species in 2013. Symbols indicate dynamic tendencies of species: ↗—increasing species, ↘—decreasing species, +—new common species not recorded in 1993, –—species not recorded in 2013 but frequent in previous survey.
© 2018 by the authors. Licensee MDPI, Basel, Switzerland. This article is an open access article distributed under the terms and conditions of the Creative Commons Attribution (CC BY) license (http://creativecommons.org/licenses/by/4.0/).
Share and Cite
MDPI and ACS Style
Pielech, R.; Malicki, M. Changes in Species Composition in Alder Swamp Forest Following Forest Dieback. Forests 2018, 9, 316. https://0-doi-org.brum.beds.ac.uk/10.3390/f9060316
AMA Style
Pielech R, Malicki M. Changes in Species Composition in Alder Swamp Forest Following Forest Dieback. Forests. 2018; 9(6):316. https://0-doi-org.brum.beds.ac.uk/10.3390/f9060316
Chicago/Turabian StylePielech, Remigiusz, and Marek Malicki. 2018. "Changes in Species Composition in Alder Swamp Forest Following Forest Dieback" Forests 9, no. 6: 316. https://0-doi-org.brum.beds.ac.uk/10.3390/f9060316
Note that from the first issue of 2016, this journal uses article numbers instead of page numbers. See further details here.