Changes in Topsoil Properties after Centennial Scots Pine Afforestation in a European Beech Forest (NE Spain)


Department of Agricultural and Environmental Sciences, Technological College of Huesca, Environmental Sciences Institute (IUCA), University of Zaragoza, Ctra. de Cuarte s/n, 22071 Huesca, Spain
*
Author to whom correspondence should be addressed.
Forests 2018, 9(6), 343; https://0-doi-org.brum.beds.ac.uk/10.3390/f9060343
Submission received: 2 May 2018
/
Revised: 7 June 2018
/
Accepted: 8 June 2018
/
Published: 10 June 2018
(This article belongs to the Special Issue Nutrient Dynamics of Planted Forests)
Abstract
:In this work, we studied the effects of centenary Scots pine (Pinus sylvestris L.) afforestation on topsoil properties conducted in a deforested area that was previously occupied by a natural European beech (Fagus sylvatica L.) forest. Organic layers and topsoil Ah mineral horizons (0–10 cm) were sampled in the Scots pine and European beech forests of Moncayo Natural Park (north-eastern Spain). The physical (stoniness, aggregate stability, and water repellency persistence and intensity), chemical (total organic C, total N, C/N, pH, and exchangeable Ca2+, Mg2+, Na+, K+, Al3+, and Fe3+), and physicochemical (cation exchange capacity) properties of soil were analyzed. Total organic C and N were also obtained for litter samples. The studied topsoils shared a series of common properties, such as a high stoniness and aggregate stability, very low base content, high cation exchange capacity, and extreme acidity. Soils that developed under the pinewood showed a higher soil water repellency intensity. However, K+ content was significantly higher in the beechwood soil. In both forest types, total organic C and N were similar in topsoil and litter (Hemimoder type), although C and N were pooled in different O-layers. Results indicate that pine afforestation in a deforested area was an adequate measure for soil protection since it did not show significant differences in the long term (ca. 100 years) compared to the nearby natural beech stands.
1. Introduction
Afforestation has historically been the main measure applied in Spain for soil protection [1,2]. Scots pine (Pinus sylvestris L.) is one of the most commonly used afforestation species due to its ecological plasticity [3]. In Spain, Scots pine covers up to one million hectares [4], more than one-third of which has been planted [5]. Nevertheless, the long-term effects of pine reforestations on soil properties have not been extensively studied [1].
Literature regarding the pine afforestation conducted in Moncayo Natural Park is scarce. García-Manrique [6] reported that in the late 19th century, uncontrolled logging for coal production reduced the population of European beech (Fagus sylvatica L.) forests in Moncayo Natural Park, nearly causing its disappearance and dramatically increasing soil loss. In order to reduce erosion rates and protect the soil, Scots pine afforestation was initiated in 1895 [7] in the areas in which the European beech had been removed.
The establishment of vegetation in deforested areas may improve soil properties [1]. However, the set of processes that characterize the interaction between plants and soil is complex. Vegetation influences soil properties by, among other factors, the variable amount and composition of soil organic matter (SOM) contributions, hence driving soil nutrient cycling [8]. Therefore, the introduction of pine forests in deforested areas that were formerly covered by beech stands may induce changes in soil properties [9] as biomass production, and its decomposition is different for each species [8]. Some studies have shown a higher accumulation of C and N in the litter of pine forests, but better integration of these in the mineral soil of beech forests [9,10,11,12]. Nevertheless, Leuschner et al. [9], 51–128 years after the afforestation with Scots pine, detected a 50–80% decrease in organic C and N down to a 60 cm depth compared to soils below the original beech forests. Berthrong et al. [13] also showed decreases in C (15%) and N (20%) content in mineral horizons after a global meta-analysis considering the effects of pine afforestation on soils. Many studies have also remarked on the acidifying effect of coniferous afforestation [9,12,13,14], and highly heterogeneous results have been reported regarding the effects of pine introduction on soil cation pools. Berthrong et al. [13] observed a decrease in Ca2+ (−31%) and Mg2+ (−23%) content after afforestation, although a remarkable increase in Na+ (+71%) took place. On the other hand, Prietzel et al. [14] pointed out a depletion in Ca2+ (−2 to 16%), Mg2+ (−31 to 40%), and K+ (−6 to 28%) with pine reforestation in degraded forests. Leuschner et al. [9] obtained similar results, illustrating that soils which developed under natural beech forests showed between a 50% and 90% higher cation content as compared to areas with introduced Scots pine. On the contrary, Carceller [15] observed no significant differences in cation pools between forest types in Moncayo Natural Park, although beechwood soils presented a trend of higher cation content. For these reasons, it is of special interest to study the changes that afforestation can induce on topsoil properties to assess the sustainability of this practice.
The objective of this study was to analyze the changes in litter accumulation and selected physical and chemical soil properties after the afforestation of Scots pine that took place ca. 100 years ago in an area previously covered by a natural European beech forest in Moncayo Natural Park (north-eastern Spain). In this way, we aimed to assess the sustainability of this practice in the long term from the point of view of soil.
2. Material and Methods
2.1. Study Site
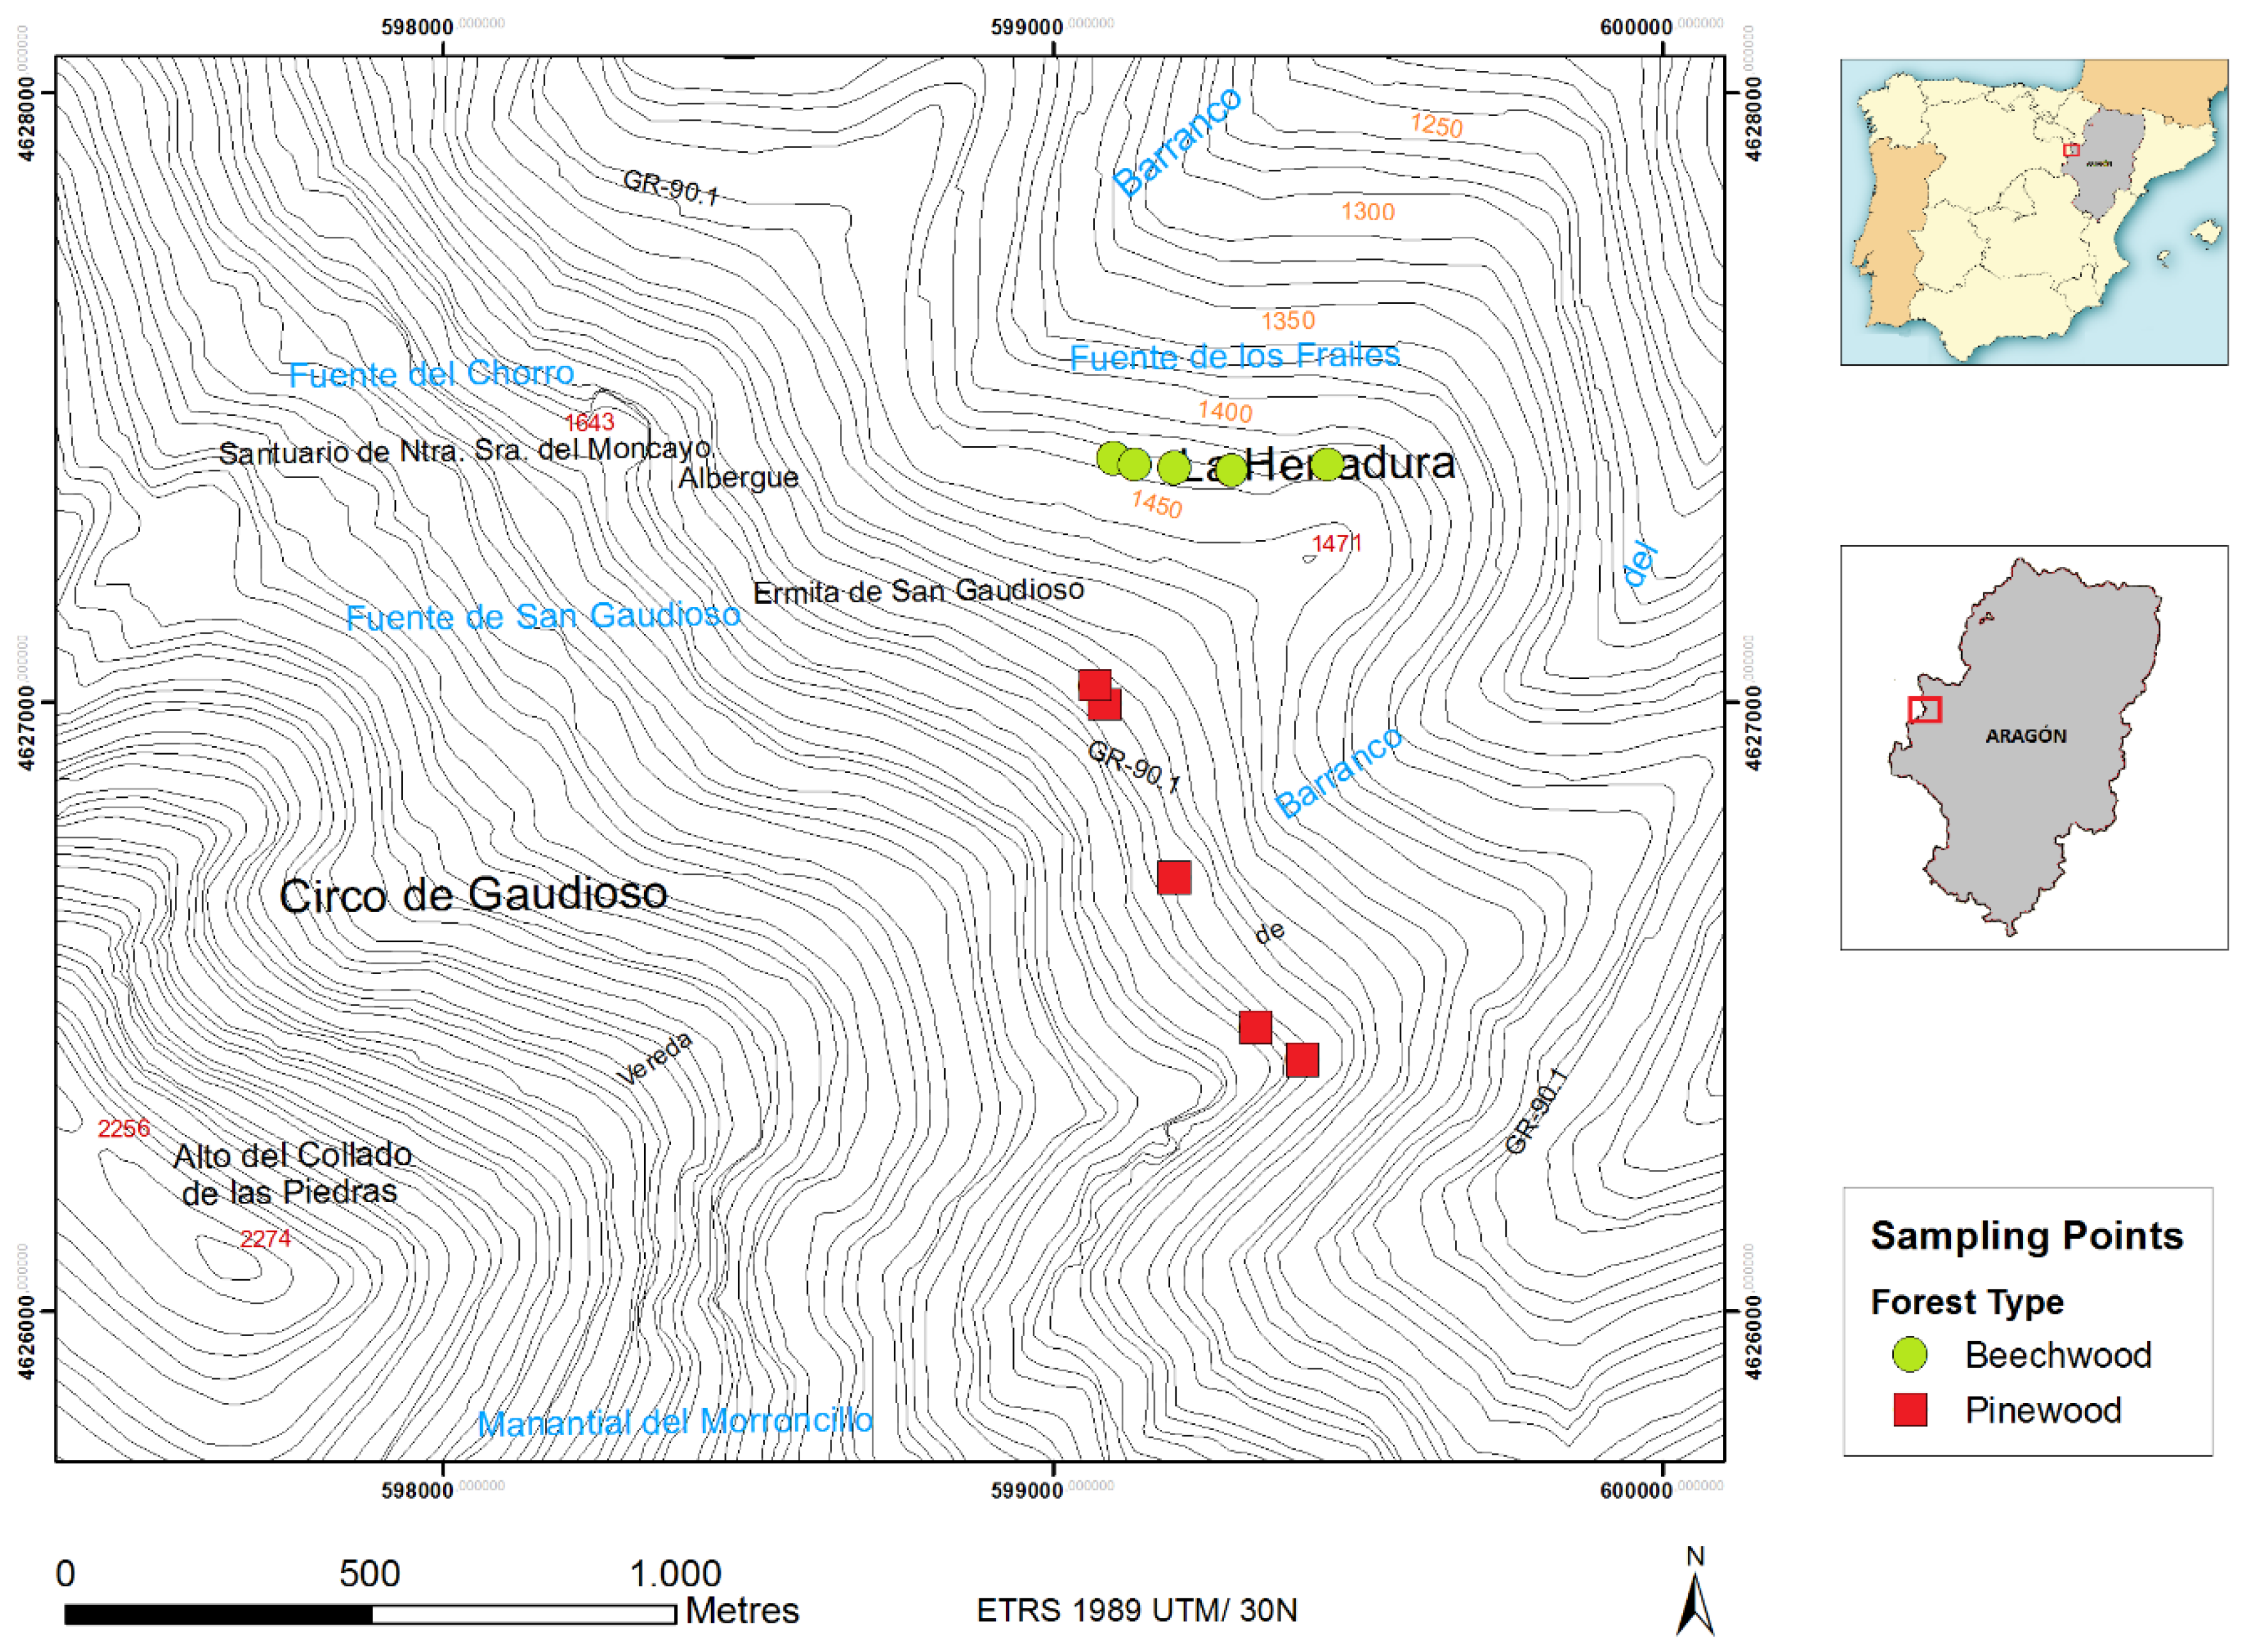
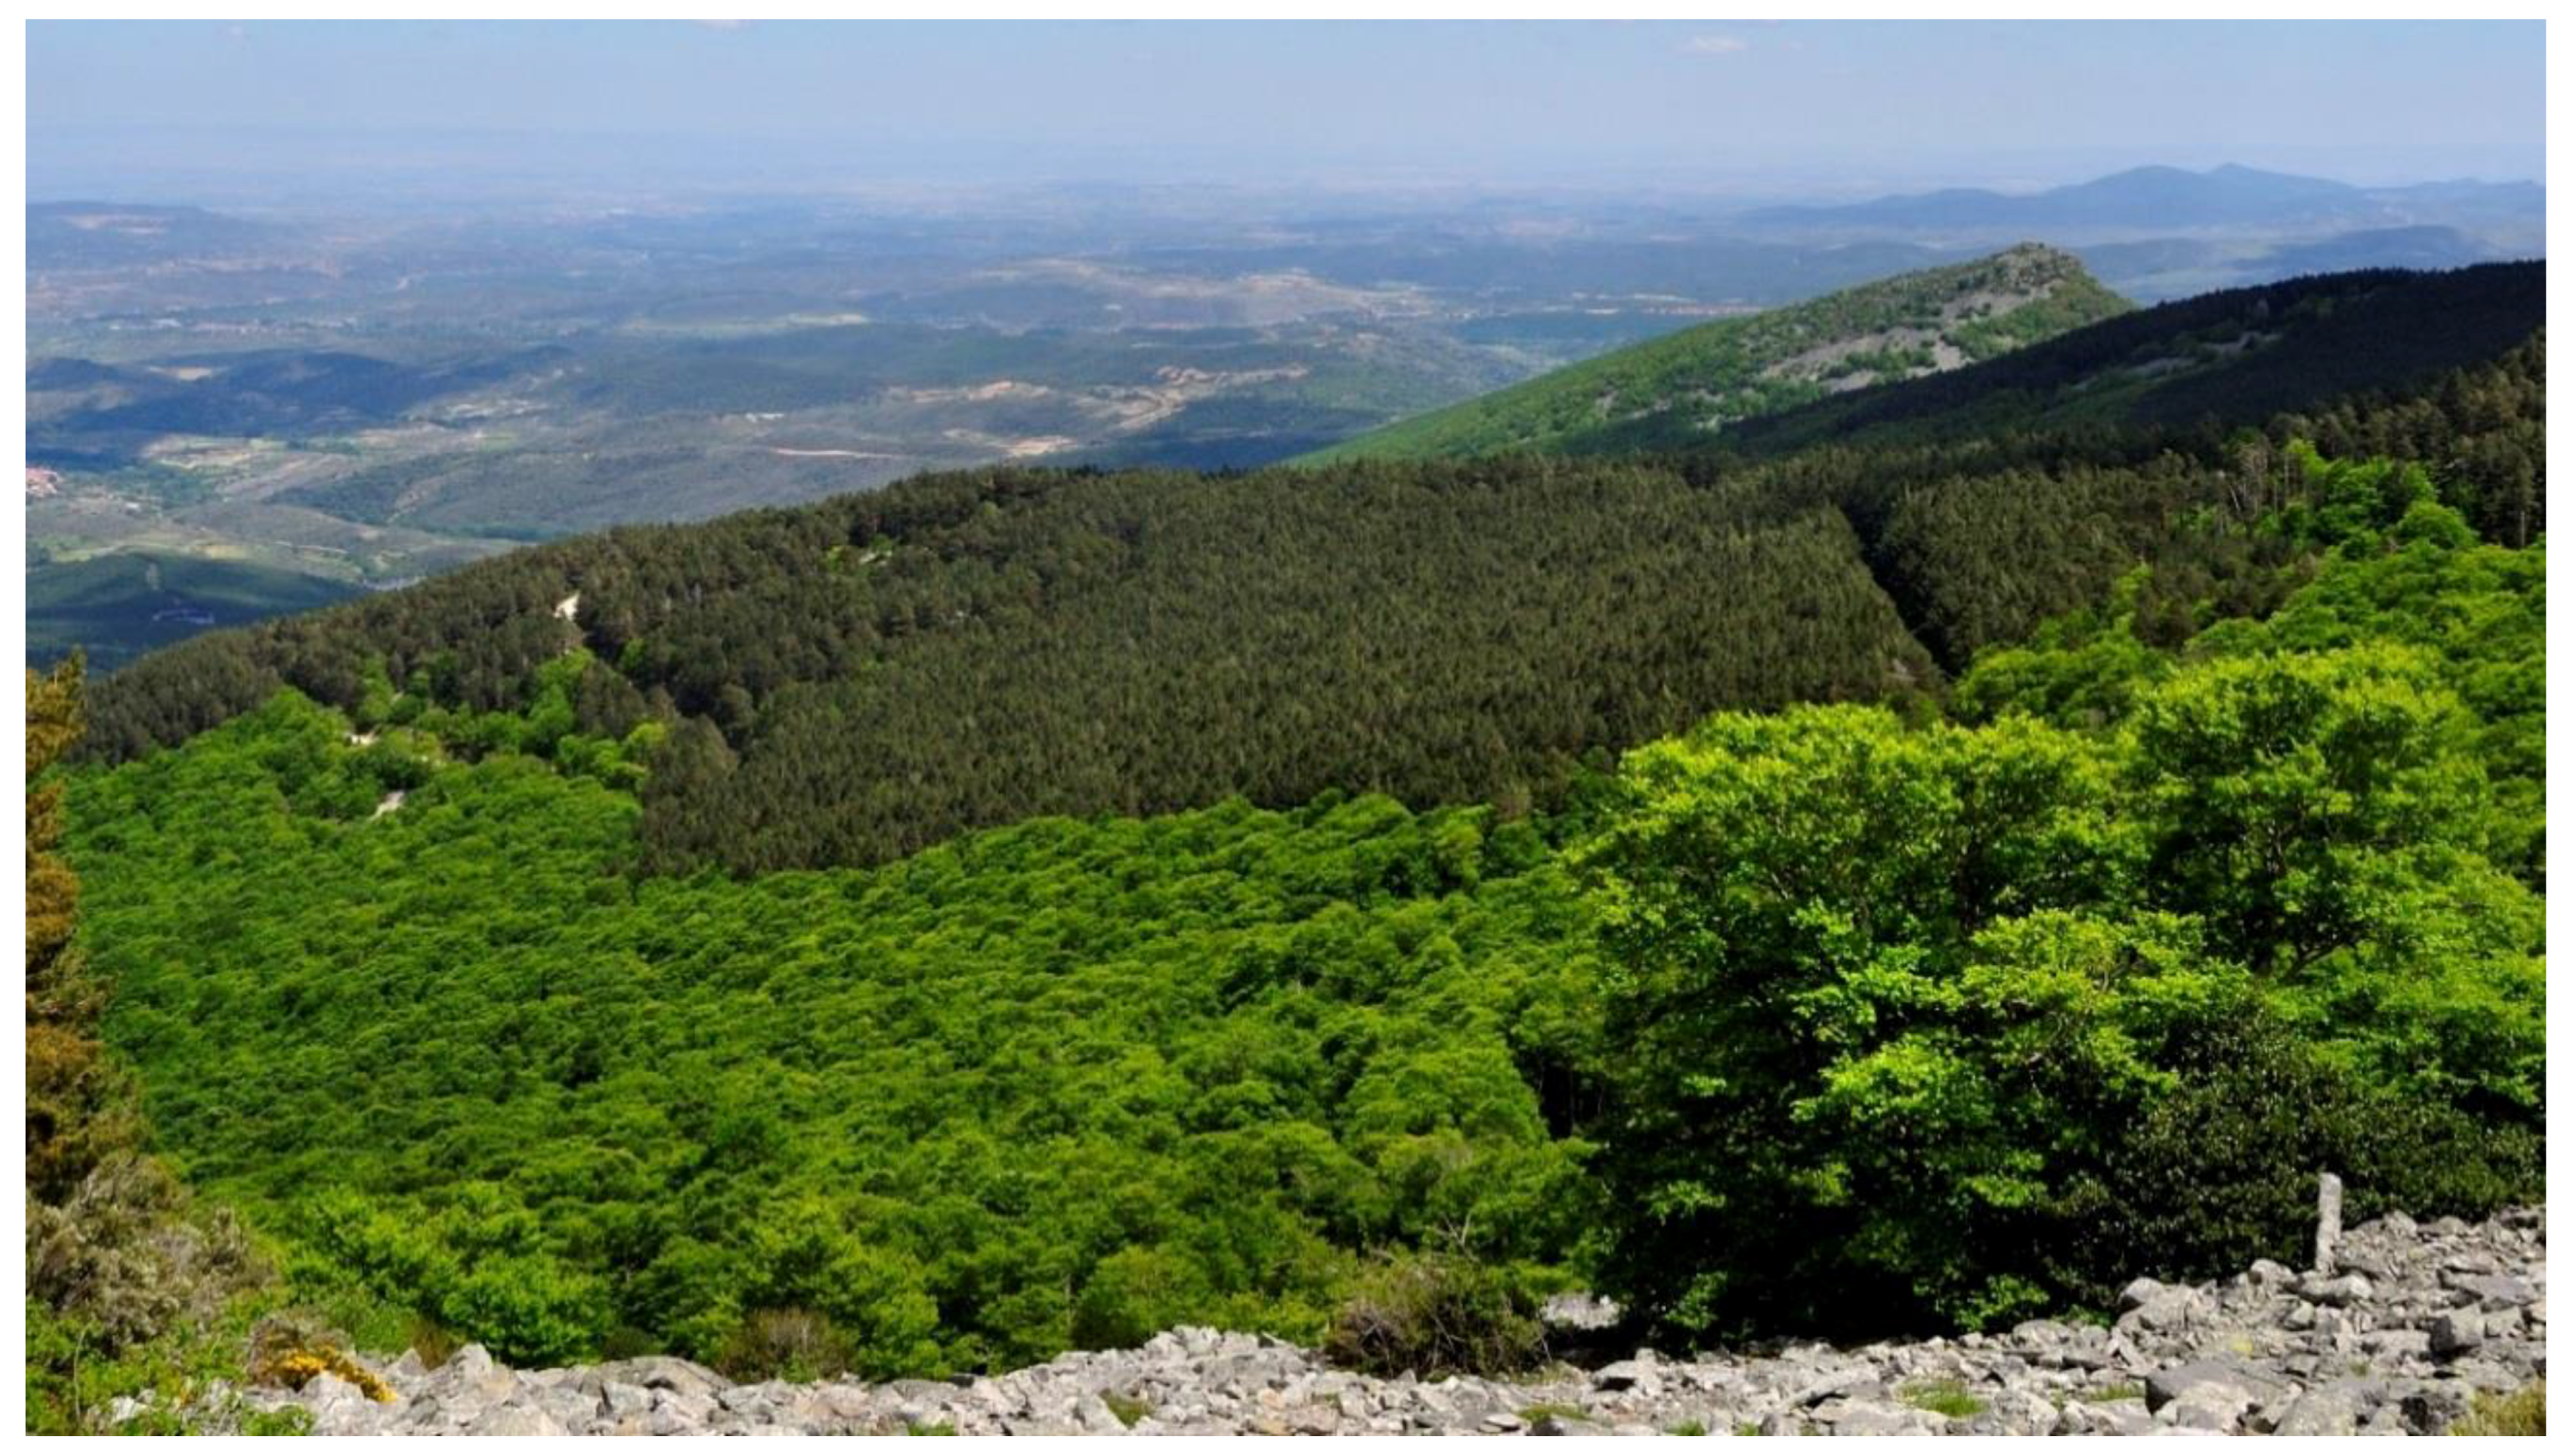
The study area is located in Moncayo Natural Park (Iberian Range, NE-Spain 41°47′ N, 1°48′ W) at altitudes between 1360 and 1475 m.a.s.l. (Figure 1), including the mature natural European beech (Fagus sylvatica L.) and the 100-year old afforested Scots pine (Pinus sylvestris L.) forests (Figure 2). Beech forest understory is mainly composed of Vaccinum myrtillus L. and Erica arborea L., while Ilex aquifolium L. and Deschampsia flexuosa L. can also be found in the pine forest. Mean annual precipitation (MAP) is around 1060 mm and mean annual temperature (MAT) is 9.2 °C according to data obtained in previous studies [16,17]. The soil moisture regime can be interpreted as udic and the temperature regime as mesic [18]. Soils are developed over quartzitic sandstones (Lower Triassic) and are classified as Typic Haplorthod by the Soil Survey Staff [18], and as Albic Podzol (beech forest) and Skeletic Podzol (pine forest) according to the IUSS Working Group WRB [19]. Topsoils present a series of common properties such as high stoniness, a sandy loam or loamy texture, a high cation exchange capacity, a very low base content, and extreme acidity.
2.2. Sampling and Laboratory Analysis
Sampling was conducted in September 2014, following north-east oriented rectilinear slopes with a similar inclination (20%). The first 10 cm of mineral Ah horizons were sampled using steel cylinders with five replicates per forest type (afforested Scots pine and natural European beech forest as a control) following a linear transect at the same topographical level (Figure 1). Additionally, in each of the sampling points, organic layers were also collected in a 30 × 30 cm surface and their thickness was measured.
Litter and topsoil samples were air-dried at room temperature until reaching a constant weight. Then, the different organic layers were described and categorized according to their morphology following the classification key proposed by Zanella et al. [20]. Soil samples were weighed after drying in order to obtain the bulk density (BD) and sieved through a 2 mm mesh separating the gravel (>2 mm) from the fine earth (<2 mm) from which the stoniness percentage was calculated (w w−1).
Litter and soil subsamples were ground to fine powder and homogenized using an agate mortar with liquid nitrogen for total C and N determination by an elemental analyzer (Flash 2000 Elemental Analyzer, Thermo Scientific, Waltham, MA, USA). Given the absence of inorganic C in the parent material composition, all C analyzed corresponds to total organic C (TOC). TOC and N stocks were calculated considering the TOC concentration, bulk density, layer thickness, and stoniness (in soil samples) of each sample. Soil actual pH was determined by potentiometric measurements of a 1:2.5 (w v−1) suspension of soil and distilled water [21]. We also determined the potential pH using 1M KCl instead of water, which may give an indication of the active plus exchangeable acidity [21]. Exchangeable base cations (Ca2+, Mg2+, Na+, and K+) were extracted by 1M ammonium acetate (AcONH4) solution at pH 7 [22] and determined by complexometry (Ca2+, Mg2+) and flame photometry (Na+, K+). Exchangeable Al+3 and Fe3+ forms were extracted by a 1 M KCl solution [22] and determined by inductively coupled plasma optical emission spectrometry (ICP-OES). Cation exchange capacity (CEC) was determined by NH4+ retention after leaching with a neutral solution of 1 M AcONH4 [23].
Soil aggregate stability (SAS) was assessed by the wet-sieving method [24] on 1–2 mm diameter aggregates. Soil water repellency (SWR) persistence was determined by the water drop penetration time (WDPT) method, laying eight drops of distilled water per sample using a hypodermic syringe and recording the time required for their complete infiltration into the soil [25]. SWR intensity was obtained by the ethanol percentage test (EPT) method, consisting of applying droplets of ethanol solutions with an increasing concentration on the soil surface; accepting the value of the lowest concentration that required <3 s to infiltrate into the soil [25].
2.3. Data Analysis
In order to identify the differences in the studied soil properties between forest types (pinewood and beechwood) for each O-layer and Ah horizon, one-way ANOVA tests were used. A normal distribution of values was verified by a Kolmogorov-Smirnov test. The degree of linear association among variables was evaluated by the Pearson correlation coefficient. Correlation coefficients (r) presented in the text are statistically significant at p < 0.05 (*) and p < 0.01 (**). These analyses were performed using StatView for Windows version 5.0.1 (SAS Institute, Cary, NC, USA). We also conducted a principal component analysis (PCA) to identify further relationships between soil properties, using the Pearson correlation matrix and a Varimax rotation with Kaiser normalization, with XLSTAT software.
3. Results and Discussion
3.1. Organic Layers Morphology and Classification
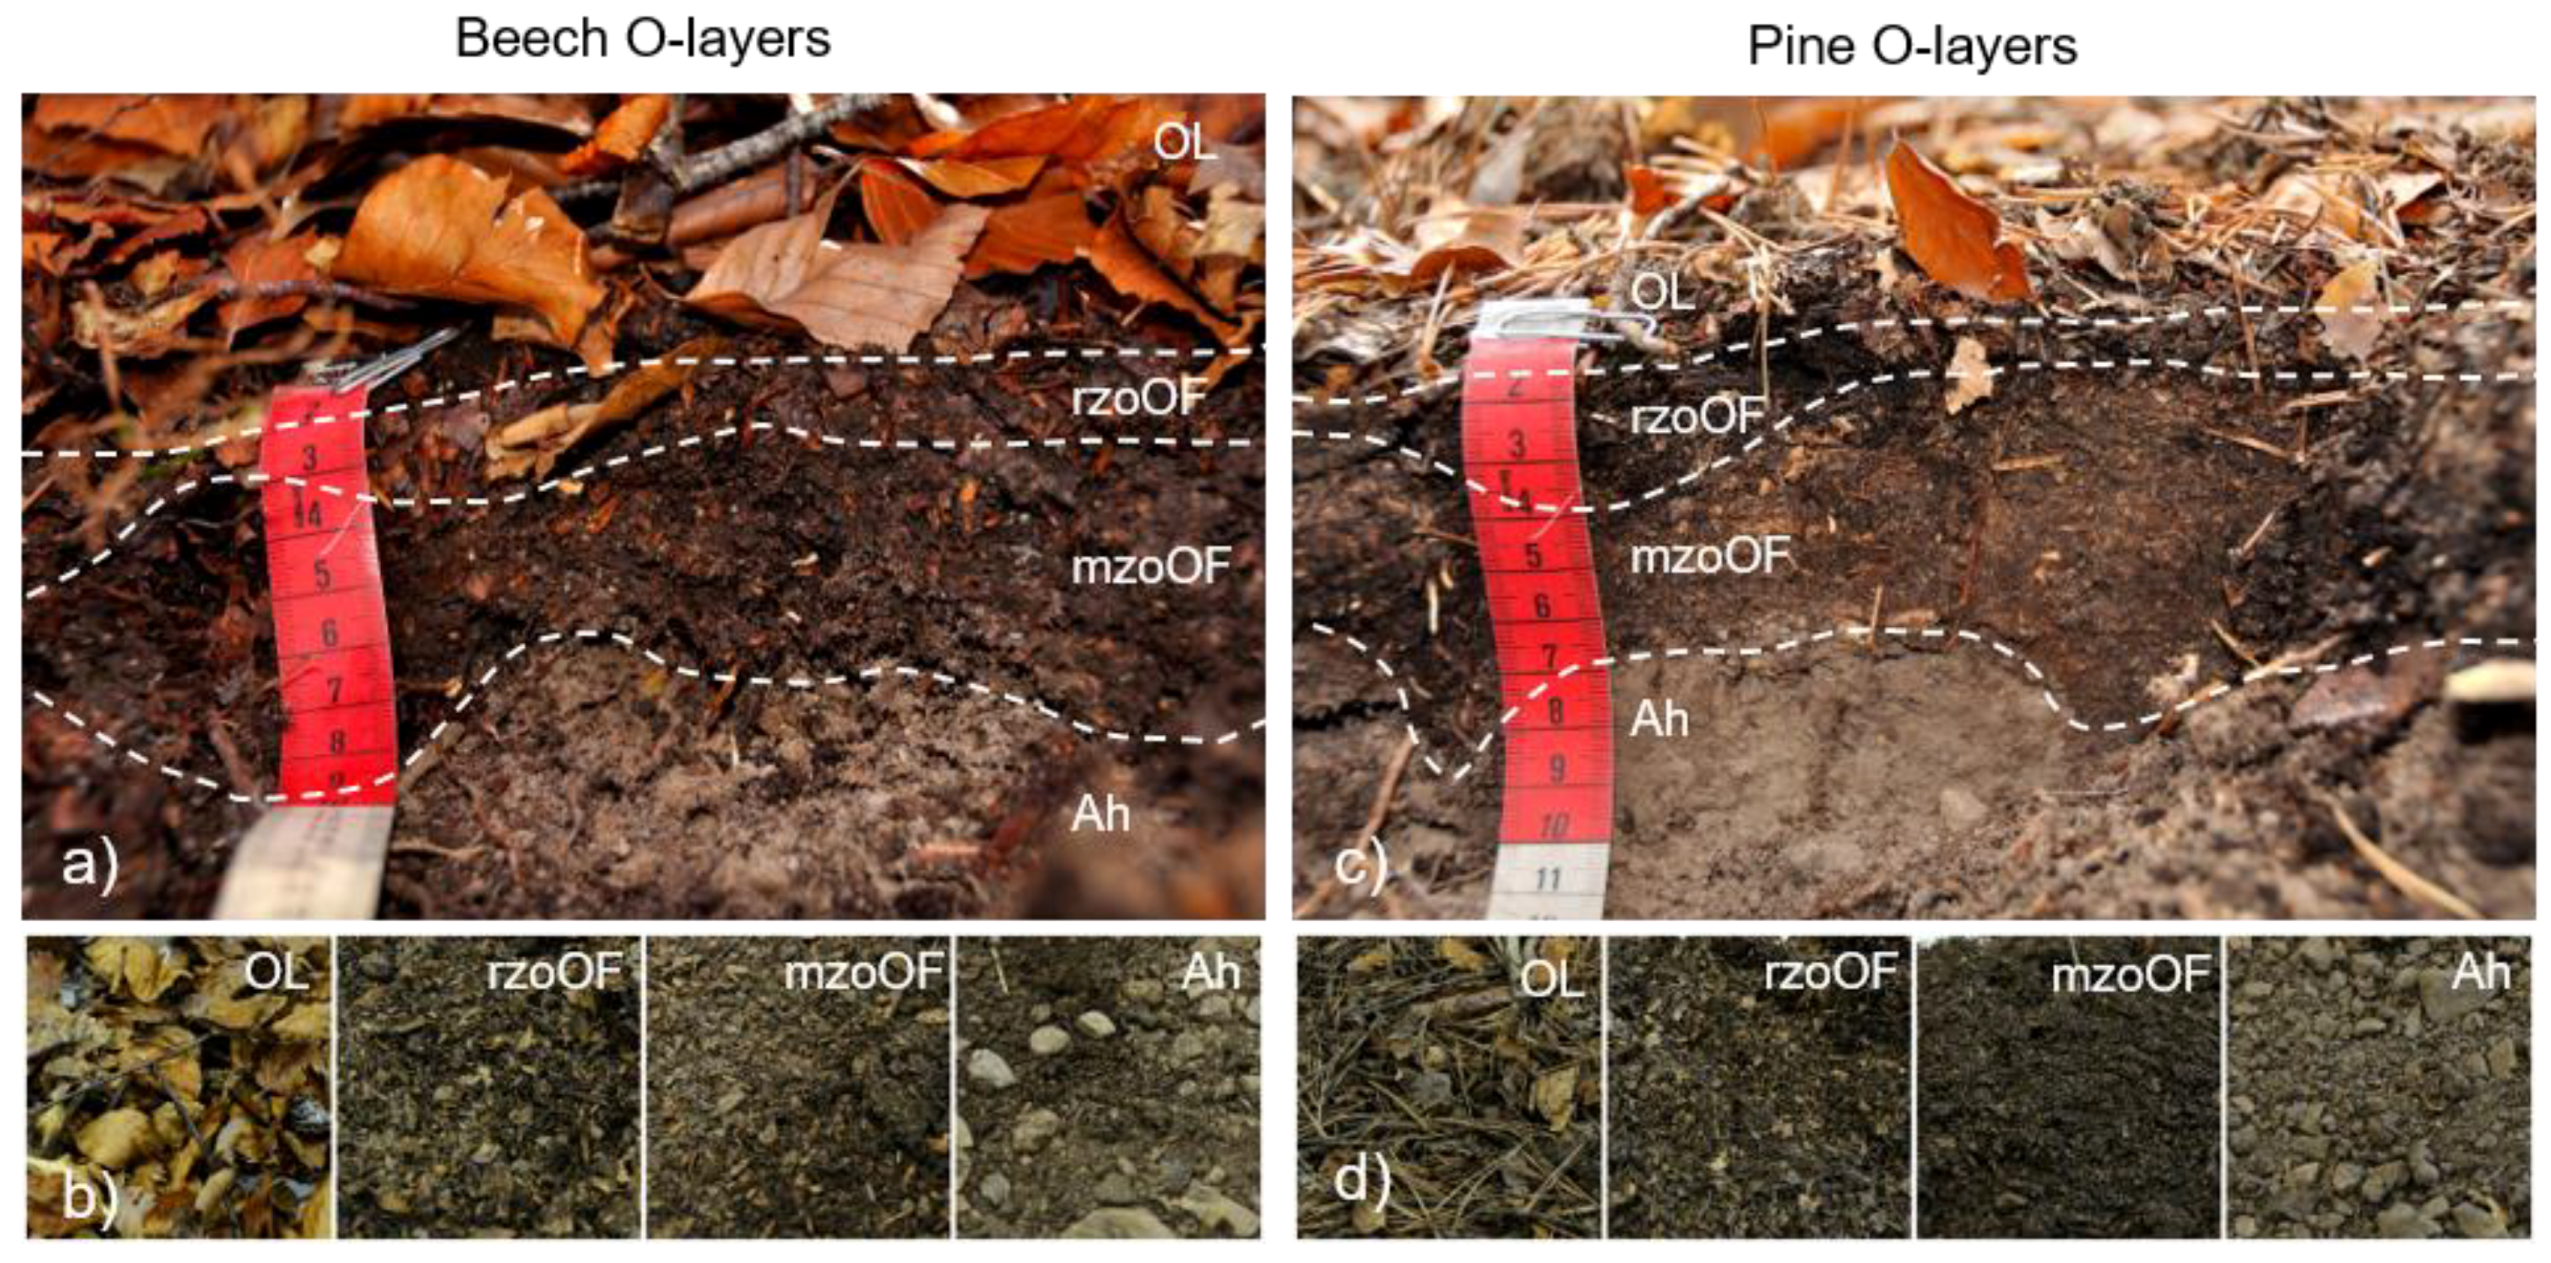
In the natural European beech forest, the uppermost organic layer (OL) showed a thickness range from 1 to 4 cm and mainly consisted of recently deposited litter that had not undergone considerable physical transformation (Figure 3a,b). Beneath this layer, we found thin (1–2 cm) zoogenically fragmented litter layers (rzoOF) mainly composed of fragmented materials of a recognizable foliar origin. Below, thicker layers (2–5 cm) of well-decomposed litter (mzoOF) were observed. On the other hand, the Scots pine forest showed a different O-layer morphology (Figure 3c,d). Pinewood OL-layers tended to be thinner (1–2 cm) than those of beechwood. However, pinewood rzoOF horizons were significantly thicker (4–10 cm) and showed a high density of fungal mycelia. Pinewood mzoOF layers presented a similar thickness to those of beechwood and varied between 1 and 6 cm. The total litter accumulation in the beechwood was between 5 and 10 cm, whereas in the pinewood, it was 7–15 cm. Increasing litter accumulation under coniferous forest is a common result reported in the literature [9,26,27,28]. This is related to the coniferous biomass chemical composition, rich in compounds that are difficult to decompose, which results in thicker O-layers [11]. The sequence of O-layers observed under both forest types could be classified as Hemimoder, according to Zanella et al. [20]. Hemimoders are humus systems in which biological activity and organic matter mineralization are limited by environmental constraints such as low temperatures and/or acidic conditions [29].
3.2. Litter and Topsoil C and N Stocks
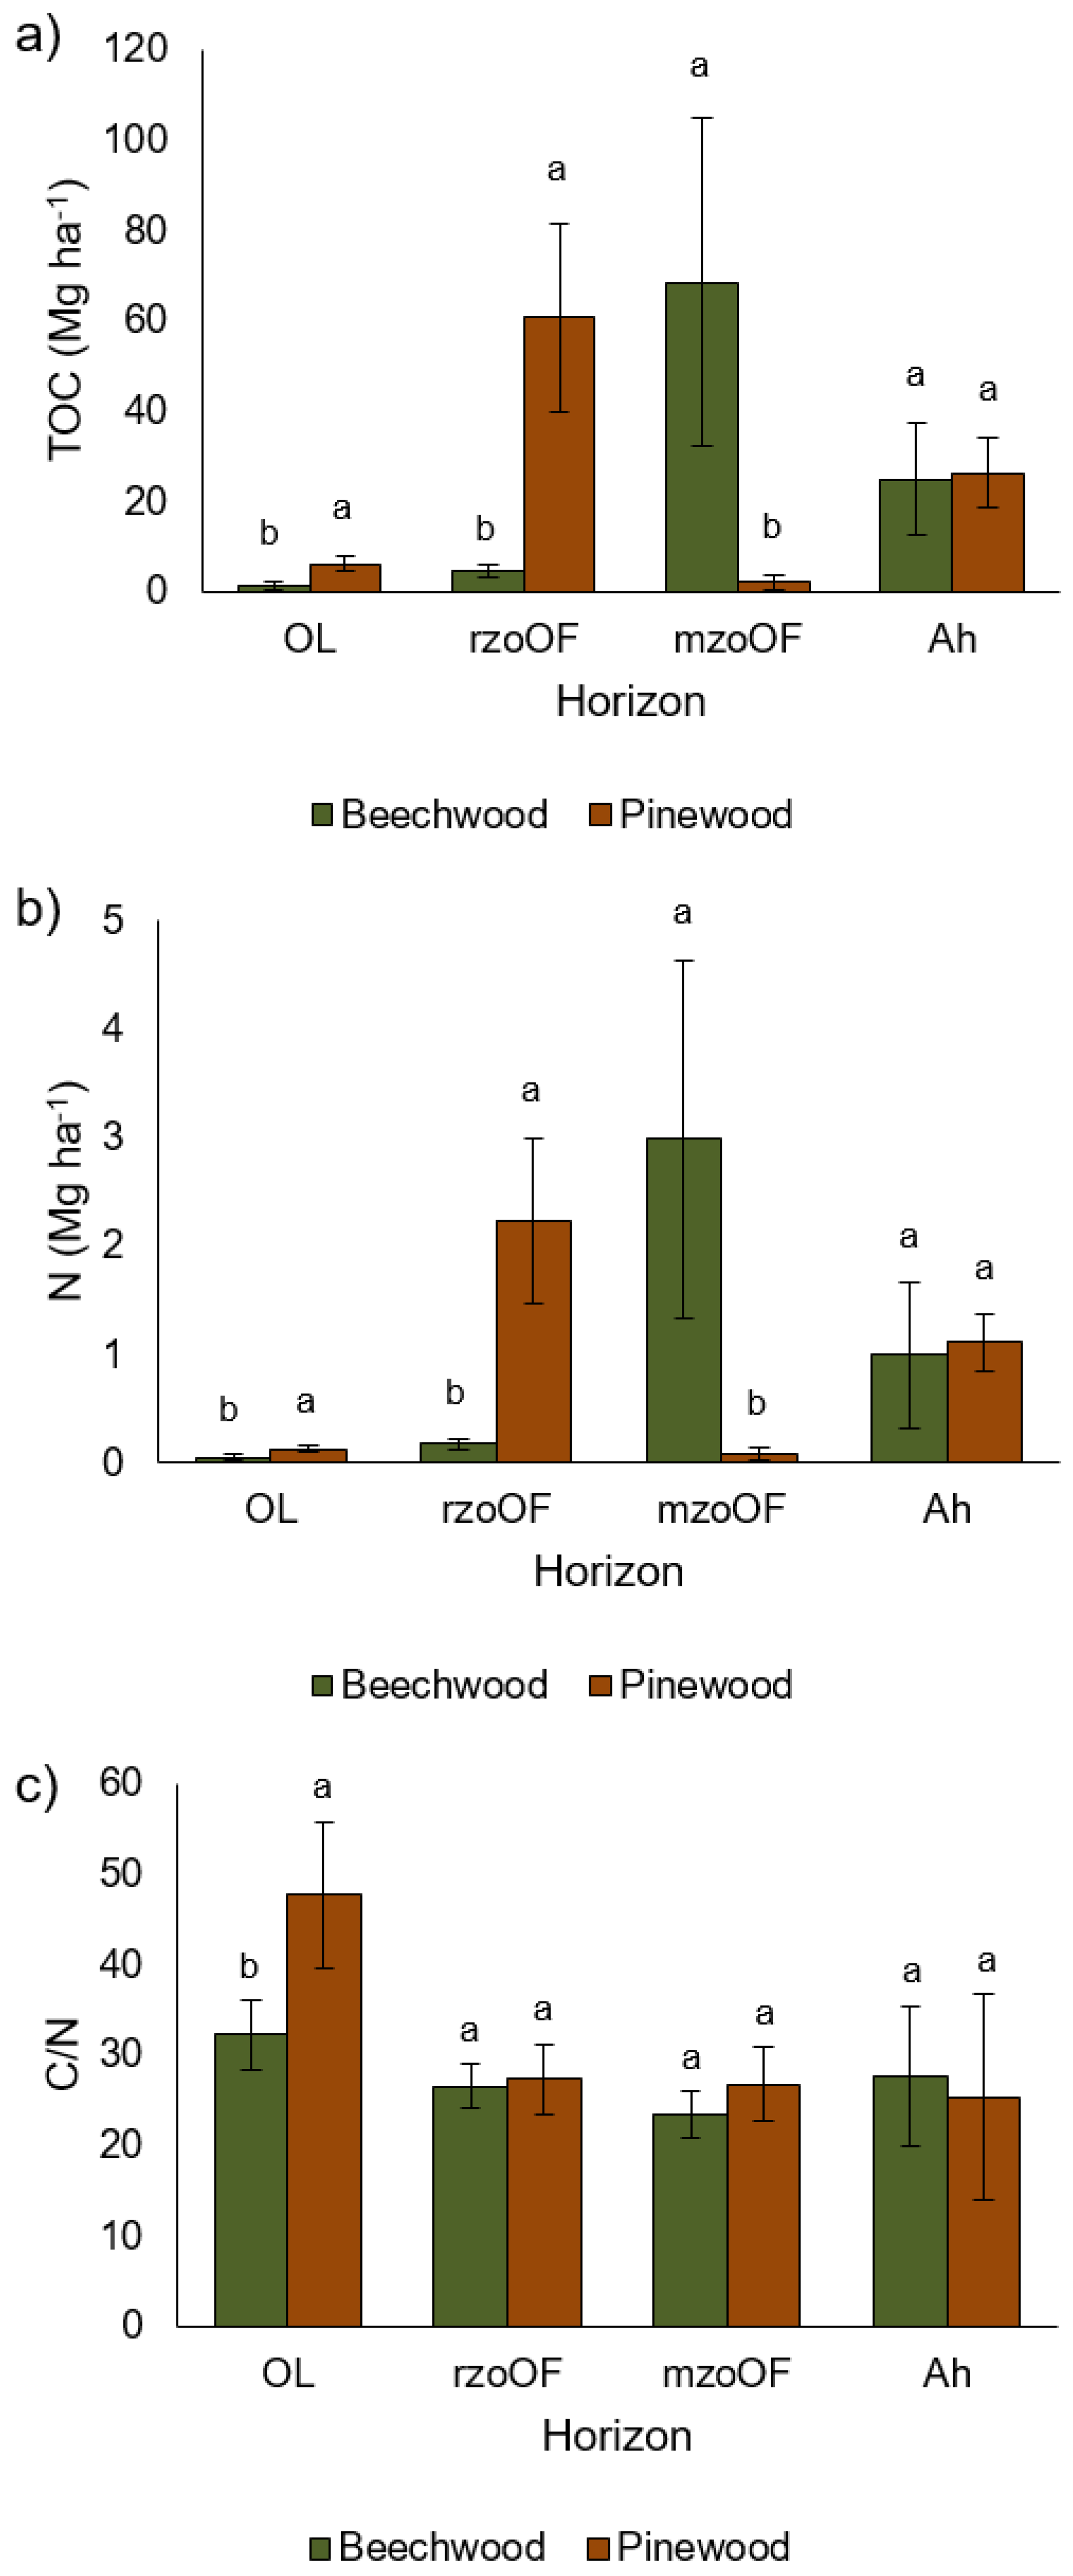
Pinewood OL-layers showed higher TOC (6.27 ± 1.62 Mg ha−1) and N (0.131 ± 0.027 Mg ha−1) stocks than those of beechwood, which were 1.54 ± 0.88 Mg ha−1 and 0.049 ± 0.029 Mg ha−1, respectively (Figure 4a,b). TOC and N stocks in the pinewood rOF-layers (60.68 ± 21.0 and 2.24 ± 0.76 Mg ha−1, respectively) were also higher than those in the beech forest, where TOC was 4.69 ± 1.23 Mg ha−1 and N was 0.179 ± 0.051 Mg ha−1. On the contrary, in the mOF-layers, higher TOC and N stocks were detected for beechwood (68.5 ± 36.3 and 2.99 ± 1.64 Mg ha−1) than for pinewood (2.18 ± 1.60 and 0.080 ± 0.055 Mg ha−1). Despite the gross accumulation of TOC and N in litter being similar between the two forest types, the difference lies in the O-layer type in which SOM is pooled. In the pinewood, the highest SOM accumulation was detected in the rzoOF-layers, whereas in the beechwood, it was in the mzoOF-layers. This indicates that litter in the pinewood is accumulated as physically fragmented vegetal remains in the shape of rzoOF layers, and litter in the beechwood is more easily processed by biota and accumulated in OF horizons dominated by fine organic remains (mzoOF). Differences in litter degradation could be attributed to the higher C/N ratio (Figure 4c) of pine OL litter (47.6 ± 8.0) as compared to beech (22.2 ± 3.8) since climatic conditions and soils are similar in both forests.
Topsoil Ah (0–10 cm) horizons in both forest types contained high TOC stocks, 24.9 ± 12.5 Mg ha−1 (beechwood) and 26.4 ± 7.8 Mg ha−1 (pinewood), and did not show significant differences between forests. Topsoil N content also showed no changes between forest types, and its values were 1.00 ± 0.67 Mg ha−1 for beech and 1.12 ± 0.26 Mg ha−1 for pine forests. The soil TOC and N results are in line with previous work [11,15], but do not match the remarkable decrease in C content observed by Leuschner et al. [9] and Berthrong et al. [13] for Scots pine afforestation in beech forests. These studies were carried out in areas where the plantations had been harvested or had a cultivation history prior to afforestation, which could explain the differences compared to our study.
3.3. Soil Chemical Properties
Both the actual pH (H2O) and potential pH (KCl) were very low (Table 1) and no significant differences were detected between forest types. However, the actual pH in the pinewood soil samples was slightly more acidic (4.1 ± 0.4) than that of beech samples (4.6 ± 0.5). Soil acidity is related to the acid bedrock material and the percolating climate and additionally, in the case of the pinewood, to the possible acidifying effect of pine needles [9,12,13,14]. The values obtained in the present study are slightly different from those previously reported by Carceller and Vallejo [12] for Moncayo Natural Park, which indicated significant soil acidification in the pinewood as compared to the original beech forest.
Among the studied cation contents, Ca2+ was the predominant one (Table 2), followed by Mg2+ and, to a lesser extent, Al3+ and K+, while Fe3+ content was negligible in both forest type soil samples. No significant differences in cation content were seen between forests, except for K+, which was significantly higher (p = 0.0355 *) under beech cover (0.39 ± 0.11 cmol+ kg−1) than under pine (0.16 ± 0.05 cmol+ kg−1) and could be related to the K+ richness in the beech leaf composition [15]. On the other hand, differences were observed in the cation abundance sequences, with Ca2+ > Mg2+ > K+ > Al3+ > Na+ > Fe3+ for the beechwood and Ca2+ > Mg2+ > Al3+ > Na+ > K+ > Fe3+ for the pinewood. These results are contrary to the remarkable decrease in the base cation pool surrogated to the vegetation shift to Scots pine reported in previous work in diverse environments [9,13,14]. The Al3+ content showed no differences between the two forest types (0.37 ± 0.38 and 0.90 ± 0.46 cmol+ kg−1 for beech and pine, respectively); however, the obtained values are close to significance (p = 0.0817) and higher for the pine samples. Additionally, a negative significant correlation was found between Al3+ content and actual pH (r = −0.668 *) and potential pH (r = −0.899 **), explaining the trend of more acidic soils under pine. This trend could also be explained by the significant positive correlation observed between total base cations and actual pH (r = 0.782 **) and potential pH (r = 0.926 **). In both forest types, the base saturation (Vb) was lower than 50%, and was slightly higher in the beechwood; Carceller [15] indicated that the exchange complex in Moncayo soils was saturated by acid cations, especially Al3+, contrary to the data obtained in the present study. However, this difference could be related to the elevation at which soils were sampled, since Carceller [15] worked at 1580–1600 m.a.s.l. and Badía et al. [10] indicated increasing Al3+ content with altitude in the Moncayo massif.
3.4. Soil Physical Properties
All the studied topsoils (0–10 cm) showed high stoniness (Table 2) as a consequence of coarse colluvium accumulation and the quartzitic bedrock. The topsoil aggregate stability (SAS) was very high as the obtained values were near 94%, and similarly to Hobbie et al. [8], no differences were observed based on the forest species. The measure of soil water repellency (SWR) persistence yielded a variety of results. SWR persistence [25] in the beechwood ranged from wettable to strong water repellency, and in the pinewood, from slight to extreme water repellency. Although the differences in SWR persistence between forest types were not statistically significant, a trend toward extreme SWR was observed in the pinewood. This variability was also reported by Buczko et al. [30] and Butzen et al. [31] for soils developed under Fagus sylvatica and Pinus sylvestris forests. However, SWR intensity (EPT) in the topsoil that developed under pinewood was severe and significantly higher than under beech cover, which showed slight intensity. Similar results were reported by Butzen et al. [31], who pointed out that soils developed under coniferous species are generally more water-repellent than those below broadleaf forests and could be due to, among other factors, the higher lipid content [32], as was observed in the Moncayo Natural Park pine litter [33].
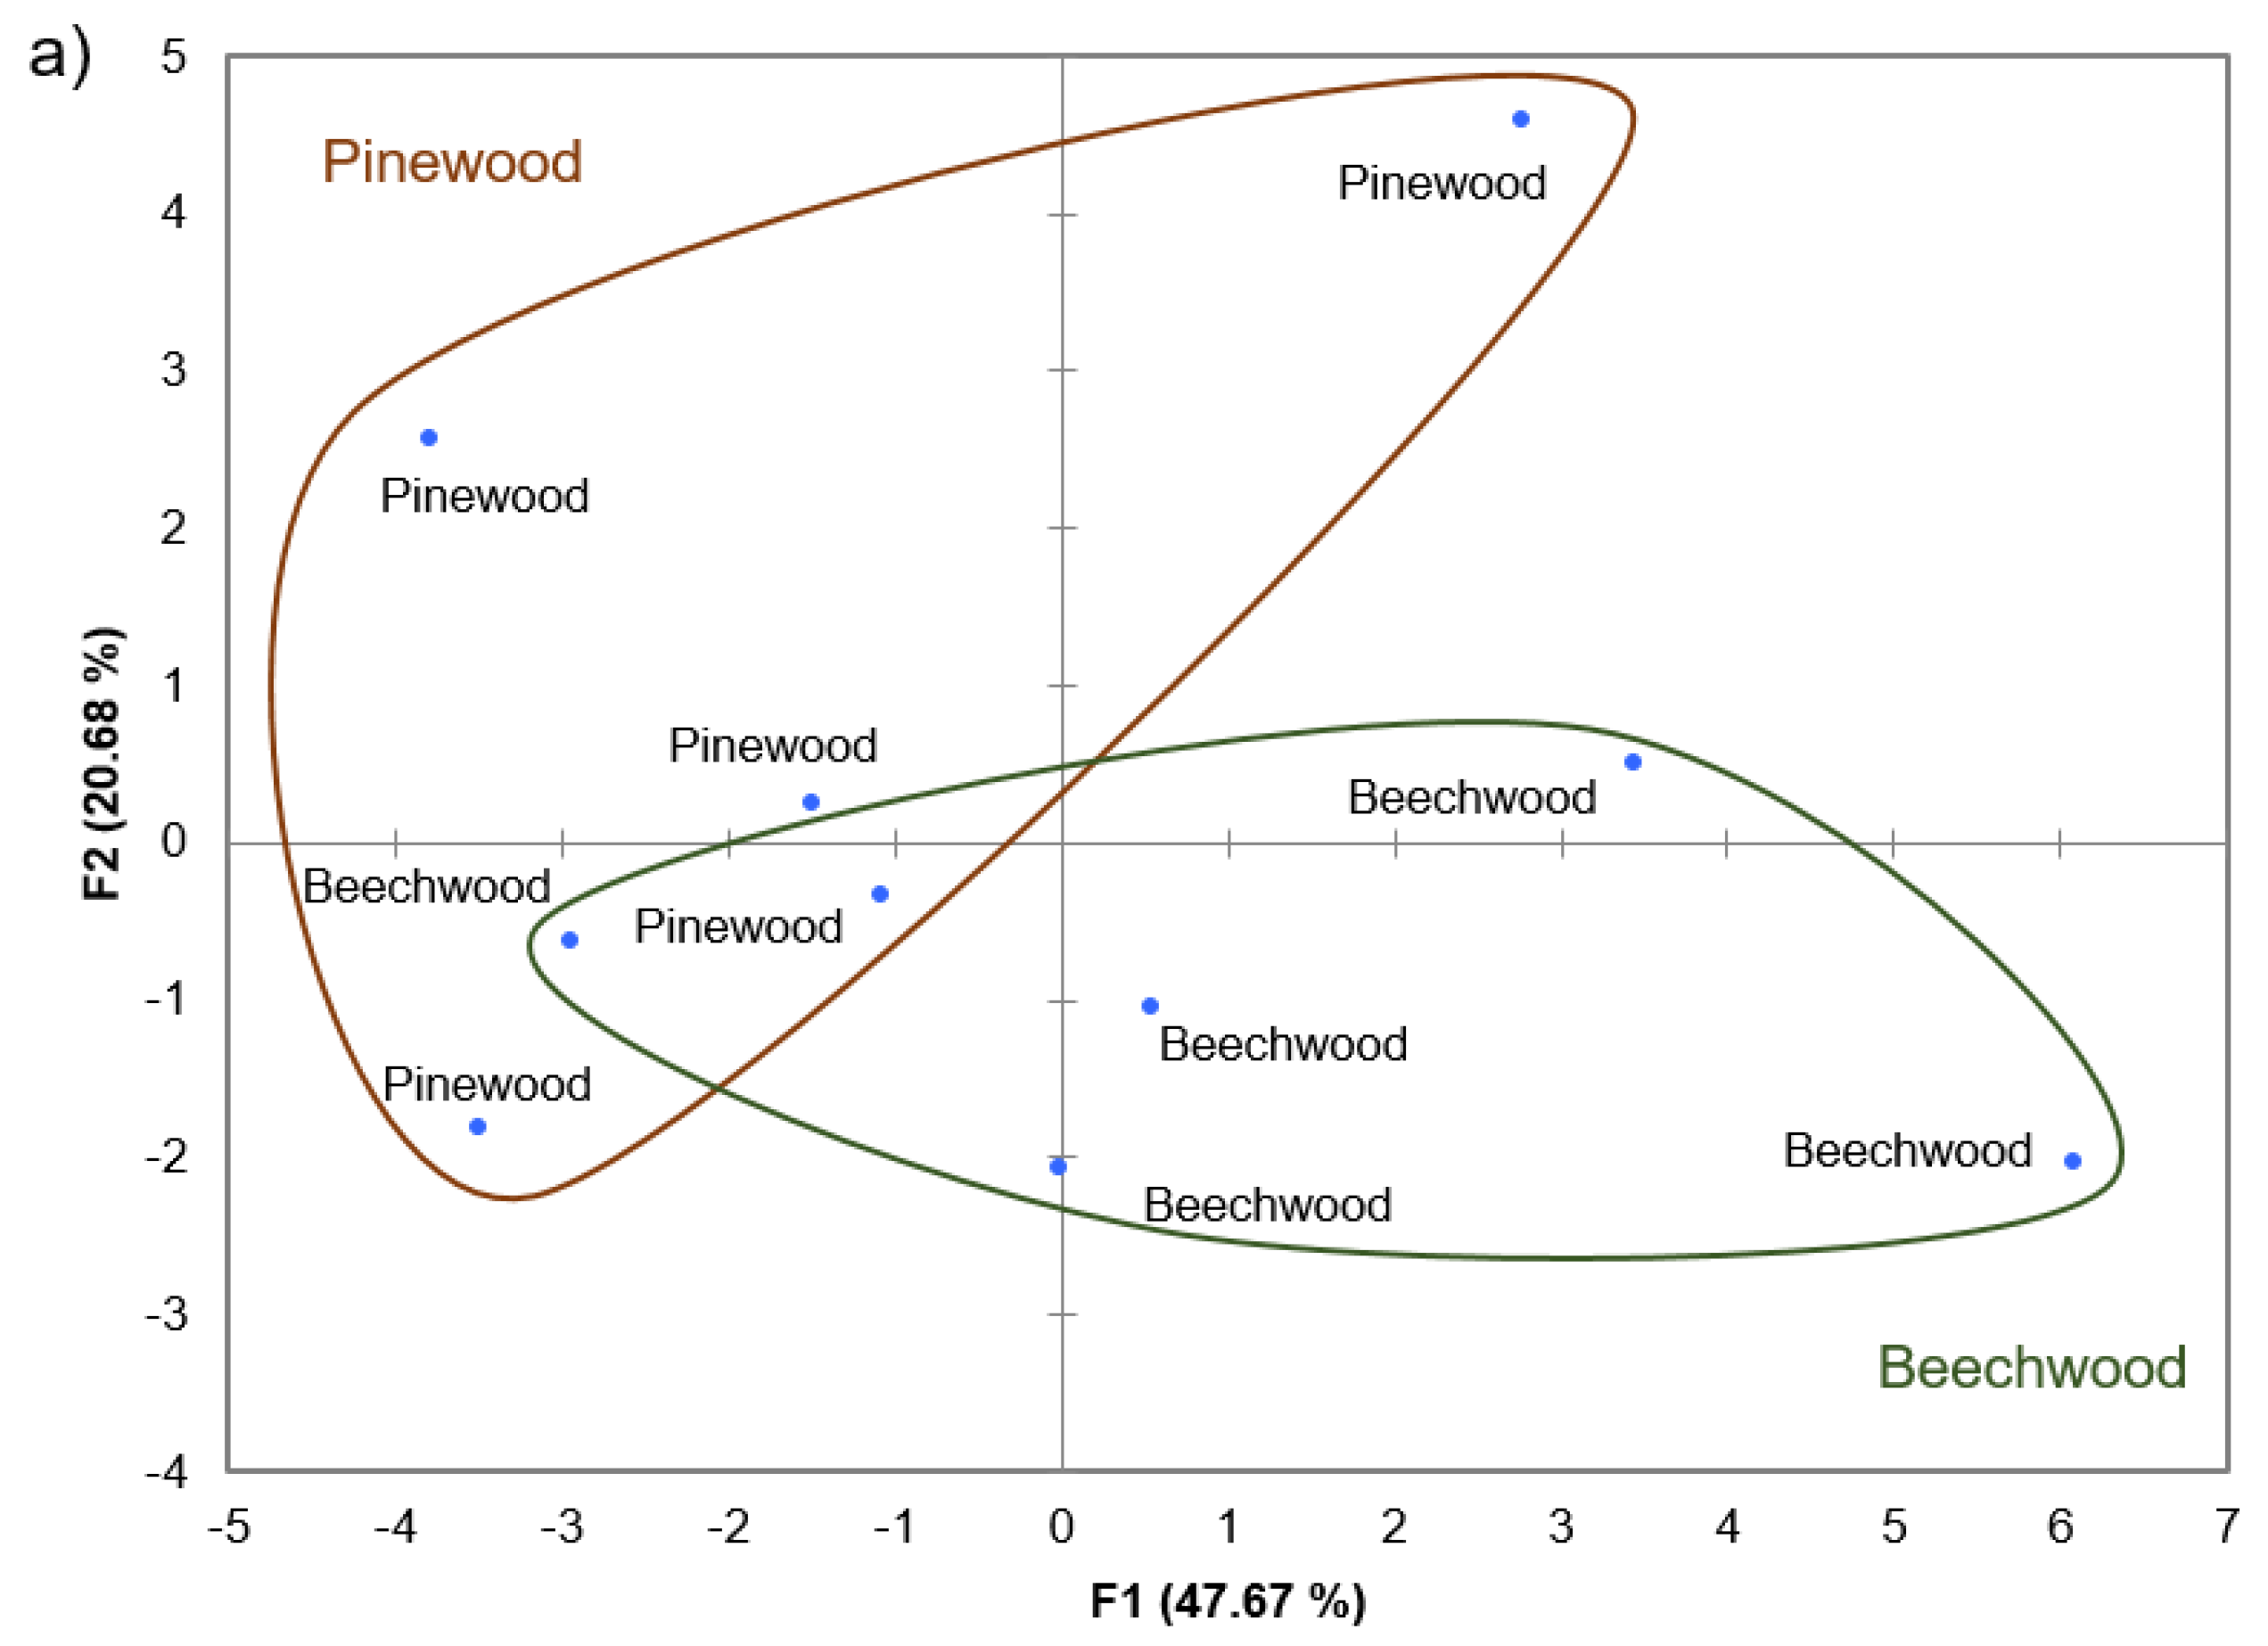
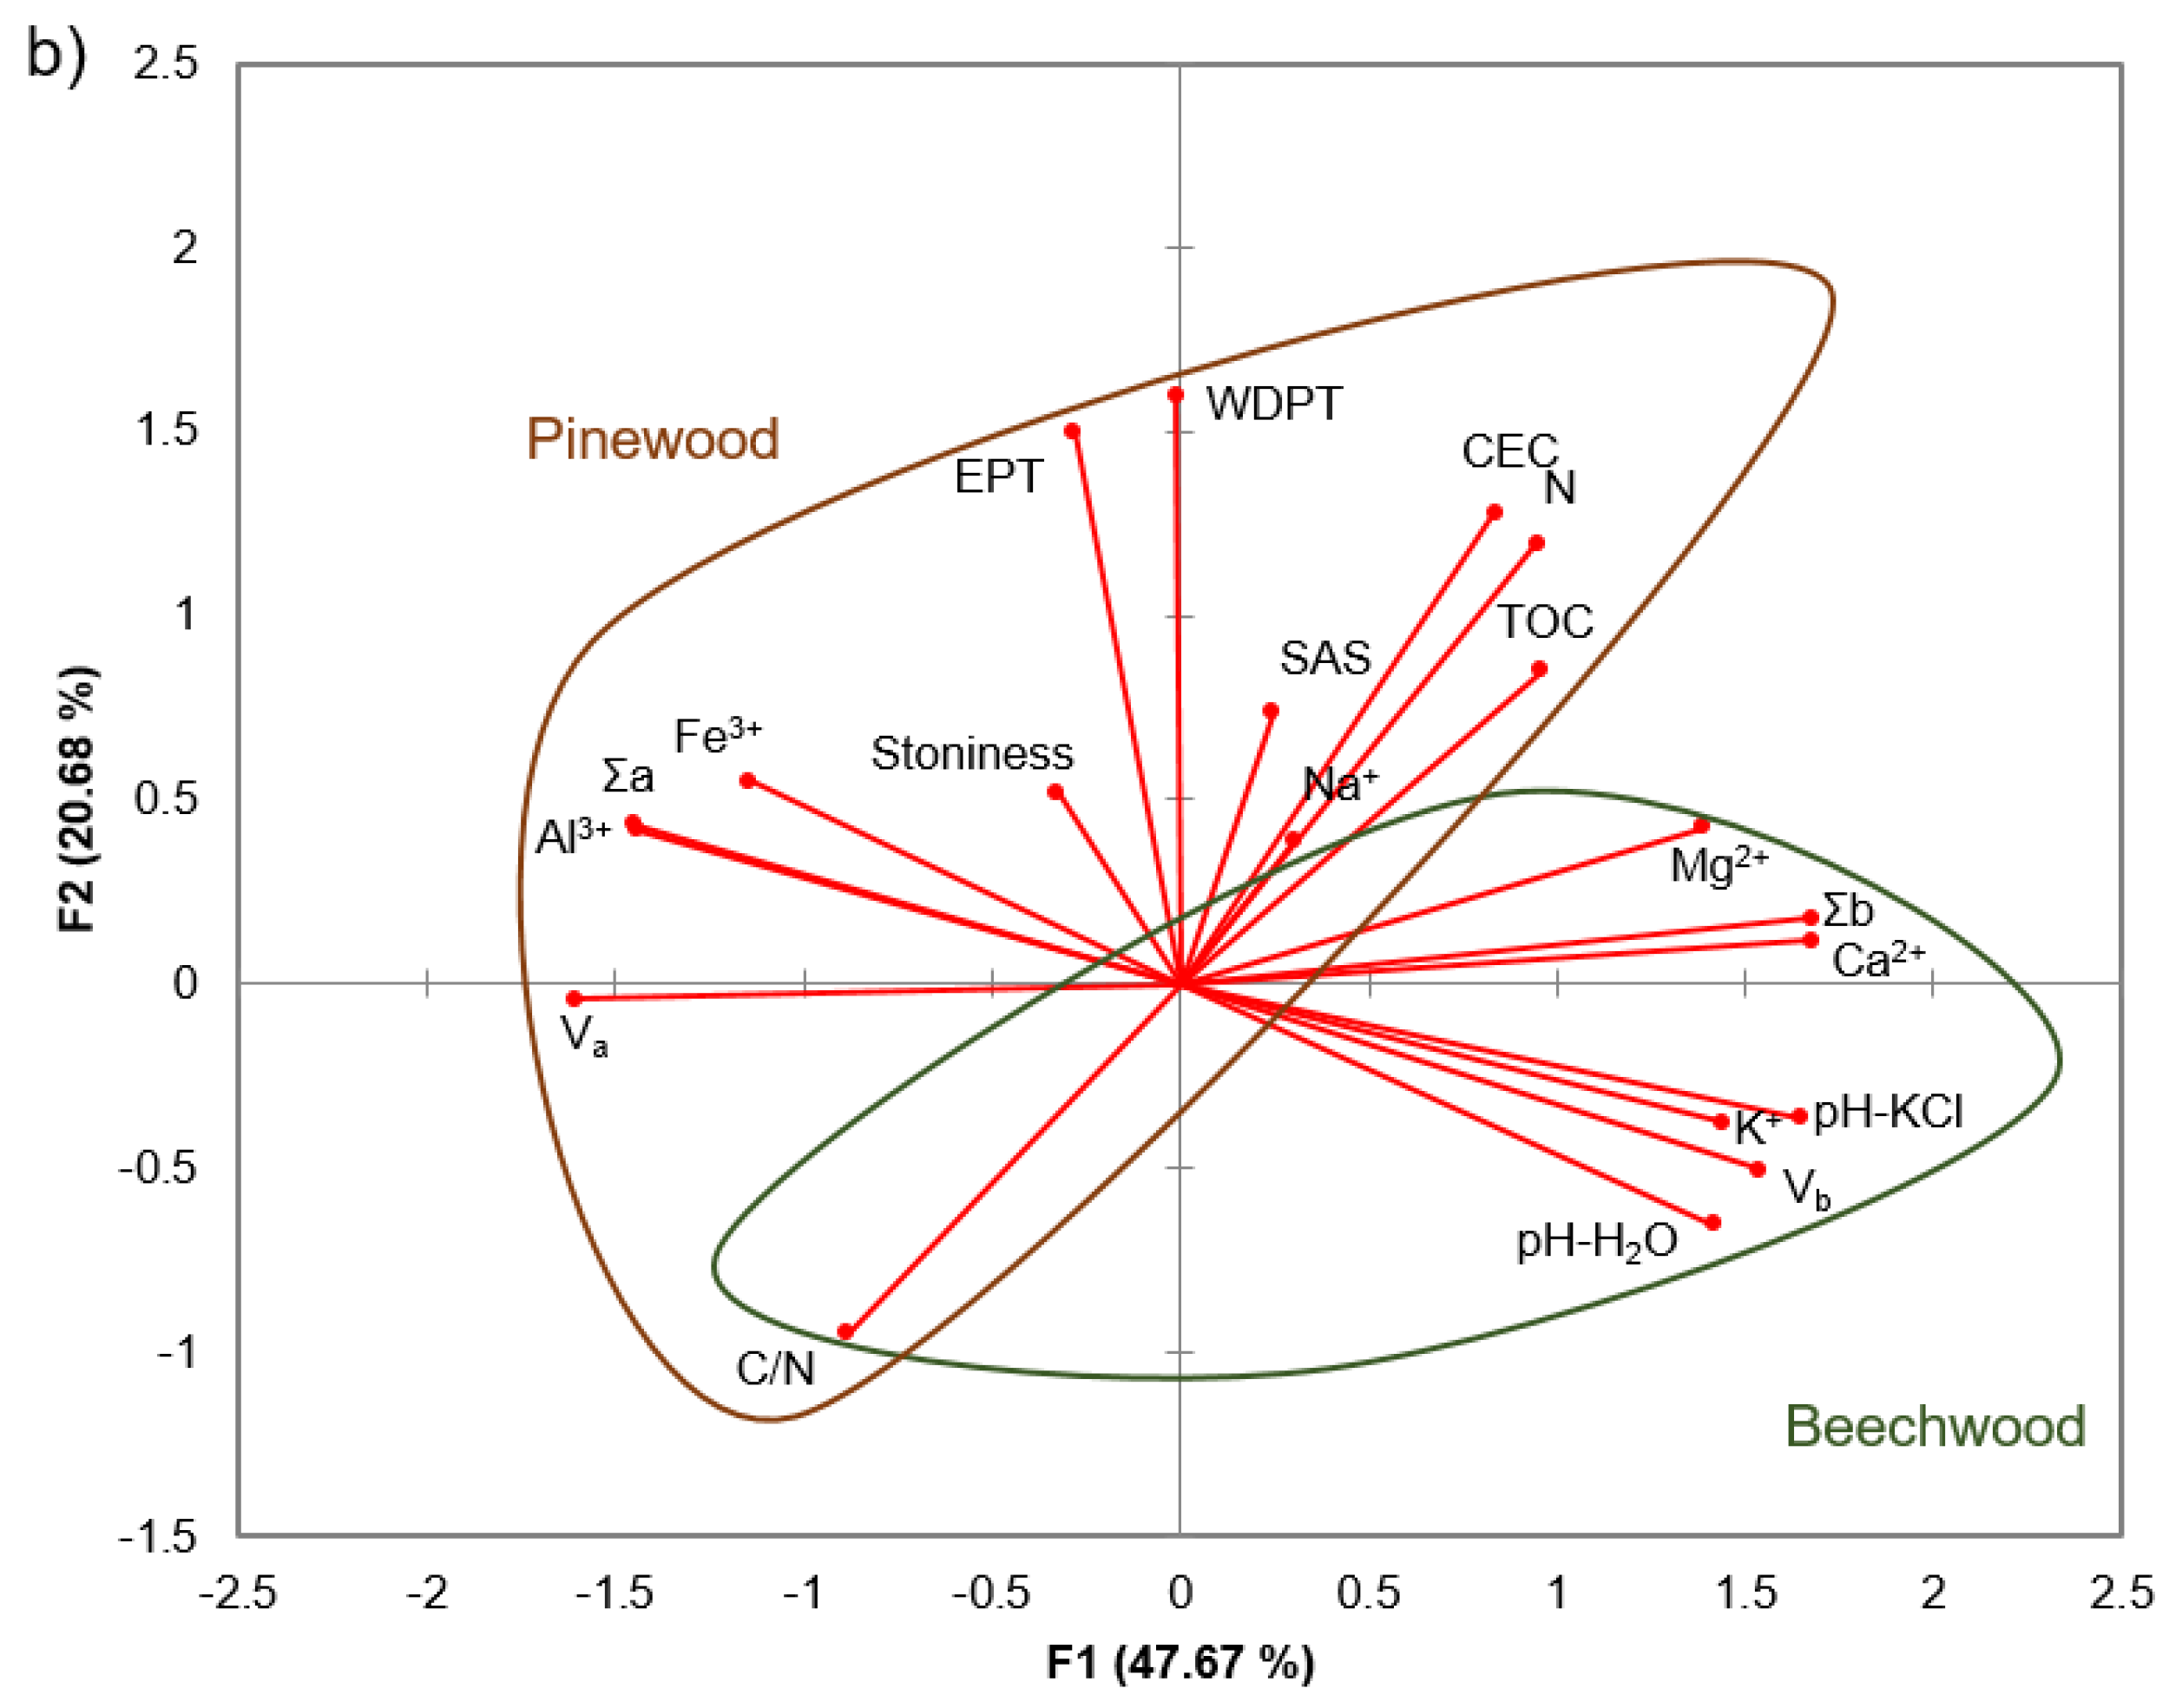
The aforementioned trends and differences detected in the topsoil properties are graphically represented in the PCA obtained from the entire data set (Figure 5). Two big clusters can be defined when taking into account the distribution of the field replicates for the pinewood and beechwood (n = 5 for each forest type) and their analysed soil properties. Data are mainly distributed according to pH-related properties such as base saturation, which was higher in the beechwood. On the other hand, the pinewood samples are grouped by higher acid saturation and SWR, although most of these differences are not statistically significant.
4. Conclusions
After 100 years of Scots pine afforestation in a deforested area previously populated by a natural European beech forest, no differences were observed in the aggregate stability, TOC, total N, pH, and base content of topsoil Ah horizons. However, topsoils under pine showed a strong SWR intensity, while under the natural beech, slight SWR was found. In the pinewood, a higher Al3+ content was found, whereas the K+ content was significantly higher under beech, which modified the exchangeable cation sequence: Ca2+ > Mg2+ > K+ > Al3+ > Na+ > Fe3+ for the beechwood and Ca2+ > Mg2+ > Al3+ > Na+ > K+ > Fe3+ for the pinewood. Organic layers under both forest types are classified as Hemimoder and both stored similar amounts of organic C and total N, although they were pooled in different O-layers. These results suggest the afforestation with Scots pine in a deforested area is a suitable measure for soil protection since it does not show significant differences in the long term (ca. 100 years) as compared to the nearby natural European beech forests.
Author Contributions
Conceptualization, D.B.-V.; Data curation, A.G.-G. and C.M.; Formal analysis, A.G.-G. and C.M.; Funding acquisition, D.B.-V.; Investigation, A.G.-G. and D.B.-V.; Methodology, A.G.-G., D.B.-V. and C.M.; Project administration, D.B.-V.; Supervision, D.B.-V.; Writing—original draft, A.G.-G.; Writing—review and editing, D.B.-V. and C.M.
Funding
This work was supported by the CGL2013-43440-R project (Spanish Ministry of Economy). A.G.-G. was funded by a research grant of the Spanish Ministry of Economy (BES-2014-068072).
Acknowledgments
We thank the Aragonese Agents for Nature Protection (APN) of Moncayo Natural Park for its collaboration and sampling permits. We also thank Asunción Callizo and Belén Aguado for the laboratory aid. ICP-OES analysis of Al and Fe was performed by Agrolab Analítica de Noaín. C and N elemental analysis was carried out in the Institute of Natural Resources and Agrobiology of Sevilla (IRNAS-CSIC) thanks to José Antonio González-Pérez and Nicasio Tomás Jiménez-Morillo. We also thank the anonymous reviewers for their comments and suggestions.
Conflicts of Interest
The authors declare no conflict of interest. The founding sponsors had no role in the design of the study; in the collection, analyses, or interpretation of data; in the writing of the manuscript, and in the decision to publish the results.
References
- Ruiz-Navarro, A.; Barberá, J.; Navarro-Cano, J.A.; Albadalejo, J.; Castillo, V.M. Soil dynamics in Pinus halepensis reforestation: Effect of microenvironments and previous land use. Geoderma 2009, 153, 353–361. [Google Scholar] [CrossRef]
- Maestre, F.T.; Cortina, J. Are Pinus halepensis plantations useful as a restoration tool in semiarid Mediterranean areas? For. Ecol. Manag. 2004, 198, 303–317. [Google Scholar] [CrossRef]
- Robledo-Arnuncio, J.J.; Collada, C.; Alía, R.; Gil, L. Genetic structure of montane isolates of Pinus sylvestris L. in a Mediterranean refugial area. J. Biogeogr. 2005, 32, 595–605. [Google Scholar] [CrossRef]
- Ministerio de Agricultura Pesca y Alimentación. Anuario de Estadística Agroalimentaria 2002; Spanish Ministry of Agriculture: Madrid, Spain.
- Costa, M.; Morla, C.; Sainz, H. Los bosques ibéricos. In Una Interpretación Geobotánica; Planeta: Barcelona, Spain, 1998; ISBN 9788408058205. [Google Scholar]
- García-Manrique, E. Las Comarcas de Borja y Tarazona y el Somontano del Moncayo; Departamento de Geografía Aplicada del Instituto J.S. Elcano (CSIC) y la Institución “Fernando el Católico”: Madrid, Spain, 1960. [Google Scholar]
- Arrechea-Veramendi, E. La ordenación del MUP n° 251 “Dehesa del Moncayo”. Un caso singular de masa artificial en un espacio natural protegido. Cuadernos de la Sociedad Española de Ciencias Forestales 2001, 11, 185–189. [Google Scholar]
- Hobbie, S.E.; Ogdahl, M.; Chorover, J.; Chadwick, O.A.; Oleksyn, J.; Zytkowiak, R.; Reich, P.B. Tree species effects on soil organic matter dynamics: The role of soil cation composition. Ecosystems 2007, 10, 999–1018. [Google Scholar] [CrossRef]
- Leuschner, C.; Wulf, M.; Bäuchler, P.; Hertel, D. Soil C and nutrient stores under Scots pine afforestations compared to ancient beech forests in the German Pleistocene: The role of tree species and forest history. For. Ecol. Manag. 2013, 310, 405–415. [Google Scholar] [CrossRef]
- Badía, D.; Ruiz, A.; Girona, A.; Martí, C.; Casanova, J.; Ibarra, P.; Zufiaurre, R. The influence of elevation on soil properties and forest litter in the Siliceous Moncayo Massif, SW Europe. J. Mt. Sci. 2016, 13, 2155–2169. [Google Scholar] [CrossRef]
- Schulp, C.J.E.; Nabuurs, G.J.; Verburg, P.H.; de Wall, R.W. Effect of tree species on carbon stocks in forest floor and mineral soil and implications for soil carbon inventories. For. Ecol. Manag. 2018, 256, 482–490. [Google Scholar] [CrossRef]
- Carceller, F.; Vallejo, V.R. Influencia de la vegetación en los procesos de podsolización en los suelos de la Sierra del Moncayo (Zaragoza). Geogaceta 1996, 20, 1127–1130. [Google Scholar]
- Berthrong, S.T.; Jobbágy, E.G.; Jackson, R.B. A global meta-analysis of soil exchangeable cations, pH, carbon and nitrogen with afforestation. Ecol. Appl. 2009, 19, 2228–2241. [Google Scholar] [CrossRef] [PubMed]
- Prietzel, J.; Stetter, U.; Klemmt, H.J.; Rehfuess, K.E. Recent carbon and nitrogen accumulation and acidification in soils of two Scots pine ecosystems in Southern Germany. Plant Soil 2006, 289, 153–170. [Google Scholar] [CrossRef]
- Carceller, F. Dinámica Forestal y Ciclo de Nutrientes en los Bosques de la Vertiente Norte del Moncayo. Ph.D. Thesis, Departament de Biologia Vegetal, Universitat de Barcelona, Barcelona, Spain, 1995; p. 360. [Google Scholar]
- Martínez del Castillo, E.; Serrano-Notivoli, R.; Novak, K.; Longares Aladrén, L.A.; Arrechea, E.; de Luis Arrillaga, M.; Saz Sánchez, M.A. Cuantificación de los gradientes climáticos altitudinales en la vertiente norte del Macizo del Moncayo a partir de una nueva red de estaciones automáticas en altura. In Cambio Climático. Extremos e Impactos; Rodríguez Puebla, C., Ceballos Barbancho, A., González-Reviriego, N., Moran Tejeda, E., Hernández Encinas, A., Eds.; AEC: Canberra, Australia, 2012; Volume 8, pp. 519–528. [Google Scholar]
- Ibarra, P.; Echeverría, M.T. Relaciones clima, suelo y vegetación en la vertiente noreste del Moncayo. In Geografía física de Aragón; Aspectos Generales y Temáticos; Peña Monné, J.L., Longares Aladrén, L.A., Sánchez Fabre, M., Eds.; Institución Fernando el Católico y Universidad de Zaragoza: Zaragoza, Spain, 2004; pp. 199–212. [Google Scholar]
- Soil Survey Staff. Keys to Soil Taxonomy, 12th ed.; USDA-NRCS: Washington, DC, USA, 2014.
- IUSS Working Group WRB. World Reference Base for Soil Resources 2014. International Soil Classification System for Naming Soils and Creating Legends for Soil Maps; World Soil Resources Reports; FAO: Rome, Italy, 2014; Volume 106. [Google Scholar]
- Zanella, A.; Ponge, J.F.; Jabiol, B.; Sartori, G.; Kolb, E.; Le Bayon, R.C.; Gobat, J.-M.; Aubert, M.; De Waal, R.; Van Delft, B.; et al. Humusica 1, article 5: Terrestrial humus systems and forms—Keys of classification of humus systems and forms. Appl. Soil Ecol. 2017, 122, 75–86. [Google Scholar] [CrossRef]
- McLean, E.O. Soil pH and lime requirement. In Methods of Soil Analysis. Part 2: Chemical and Microbiological Properties, 2nd ed.; Page, A.L., Miller, R.H., Keeney, D.R., Eds.; American Society of Agronomy: Madison, WI, USA, 1982; pp. 199–224. [Google Scholar]
- Thomas, G.W. Exchangeable Cations. In Methods of Soil Analysis. Part 2: Chemical and Microbiological Properties, 2nd ed.; Page, A.L., Miller, R.H., Keeney, D.R., Eds.; American Society of Agronomy: Madison, WI, USA, 1982; pp. 159–165. [Google Scholar]
- Rhoades, J.D. Cation Exchange Capacity. In Methods of Soil Analysis. Part 2: Chemical and Microbiological Properties, 2nd ed.; Page, A.L., Miller, R.H., Keeney, D.R., Eds.; American Society of Agronomy: Madison, WI, USA, 1982; pp. 149–157. [Google Scholar]
- Kemper, W.D.; Koch, E.J. Aggregate Stability of Soils from Western Portions of the United States and Canada; US Department of Agriculture: Washington, DC, USA, 1966; No. 1355.
- Doerr, S.H.; Shakesby, R.A.; Walsh, R.P.D. Spatial variability of soil water repellency in fire-prone eucalyptus and pine forests, Portugal. Soil Sci. 1998, 163, 313–324. [Google Scholar] [CrossRef]
- Badía-Villas, D.; Girona-García, A. Soil humus changes with elevation in Scots pine stands of the Moncayo Massif (NE Spain). Appl. Soil Ecol. 2017. [Google Scholar] [CrossRef]
- Labaz, B.; Galka, B.; Bogacz, A.; Waroszewski, J.; Kabala, C. Factors influencing humus forms and forest litter properties in the mid-mountains under temperate climate of Southwestern Poland. Geoderma 2014, 230–231, 265–273. [Google Scholar] [CrossRef]
- Marty, C.; Houle, D.; Gagnon, C. Variation in stocks and distribution of organic C in soils across 21 eastern Canadian temperate and boreal forests. For. Ecol. Manag. 2015, 345, 29–38. [Google Scholar] [CrossRef]
- Zanella, A.; Ponge, J.F.; de Waal, R.; Ferronato, C.; de Nobili, M.; Juilleret, J. Humusica 1, article 3: Essential bases—Quick look at the classification. Appl. Soil Ecol. 2017, 122, 42–55. [Google Scholar] [CrossRef]
- Buczko, U.; Bens, O.; Hüttl, R.F. Variability of soil water repellency in sandy forest soils with different stand structure under Scots pine (Pinus sylvestris) and beech (Fagus sylvatica). Geoderma 2005, 126, 317–336. [Google Scholar] [CrossRef]
- Butzen, V.; Seeger, M.; Marruedo, A.; De Jonge, L.; Wengel, R.; Ries, J.B.; Casper, M.C. Water repellency under coniferous and deciduous forest-experimental assessment and impact on overland flow. Catena 2015, 133, 255–265. [Google Scholar] [CrossRef]
- Jiménez-Morillo, N.T.; González-Pérez, J.A.; Jordán, A.; Zavala, L.M.; de la Rosa, J.M.; Jiménez-González, M.A.; González-Vila, F.J. Organic matter fractions controlling soil water repellency in sandy soils from the Doñana National Park (Southwestern Spain). Land Degrad. Dev. 2016, 27, 1413–1423. [Google Scholar] [CrossRef]
- Girona-García, A.; Badía-Villas, D.; González-Pérez, J.A.; Jiménez-Morillo, N.T.; Martí-Dalmau, C. Effect of a long-term afforestation of pine in a beech domain in NE-Spain revealed by Py-GC/MS. In EGU General Assembly Conference Abstracts, Proceedings of the EGU General Assembly 2015, Vienna, Austria, 12–17 April 2015; EGU: Munich, Germany, 2015; Volume 17, EGU2015-12736. [Google Scholar]
Figure 1.
Location of the study area in Moncayo Natural Park (Zaragoza, north-eastern Spain). Round green signs refer to the beechwood sampling points and the red square symbols correspond to the pinewood sampling points.
Figure 1.
Location of the study area in Moncayo Natural Park (Zaragoza, north-eastern Spain). Round green signs refer to the beechwood sampling points and the red square symbols correspond to the pinewood sampling points.

Figure 2.
Overview of Moncayo Natural Park showing the two sampled forest types: European beech forest in light green (front) and Scots pine forest in dark green (back).
Figure 2.
Overview of Moncayo Natural Park showing the two sampled forest types: European beech forest in light green (front) and Scots pine forest in dark green (back).

Figure 3.
Morphology of the organic layers observed in the European beech (a,b) and the Scots pine (c,d) forests.
Figure 3.
Morphology of the organic layers observed in the European beech (a,b) and the Scots pine (c,d) forests.

Figure 4.
Total organic carbon (TOC) stocks (a), N stocks (b), and soil C/N ratios (c) for the observed organic layers (OL, rzoOF, mzoOF) and mineral topsoil (Ah 0–10 cm). Small letters above the bars indicate differences between forest types for each horizon at p <0.05 (ANOVA tests).
Figure 4.
Total organic carbon (TOC) stocks (a), N stocks (b), and soil C/N ratios (c) for the observed organic layers (OL, rzoOF, mzoOF) and mineral topsoil (Ah 0–10 cm). Small letters above the bars indicate differences between forest types for each horizon at p <0.05 (ANOVA tests).

Figure 5.
Principal component analysis (PCA) of the soil samples (a) and soil properties (b). In figure b), the abbreviations refer to: Soil Aggregate Stability (SAS), Water Drop Penetration Time (WDPT) and Ethanol Percentage Test (EPT), actual pH (pH-H2O) and potential pH (pH-KCl), total organic C (TOC), total N (N), soil C/N ratio (C/N), exchangeable basic cations (Ca2+, Mg2+, Na+, K+), exchangeable acid cations (Fe3+, Al3+), sum of basic (Σb) and acid (Σa) cations, cation exchange capacity (CEC), bases (Vb), and acid (Va) saturation.


Table 1.
Topsoil chemical properties of Ah horizons (0–10 cm). Total organic C (TOC), total N, soil C/N ratio, exchangeable basic cations (Ca2+, Mg2+, Na+, K+), exchangeable acid cations (Fe3+, Al3+), sum of basic (Σb) and acid (Σa) cations, cation exchange capacity (CEC), bases (Vb), and acid (Va) saturation. Values are expressed as mean ± standard deviation (n = 5). p indicates the p-value obtained from the one-way ANOVA test and significant differences (p < 0.05) are marked with *.
| Soil Properties | Beechwood | Pinewood | p |
|---|---|---|---|
| pH-H2O | 4.6 ± 0.5 | 4.1 ± 0.4 | 0.1670 |
| pH-KCl | 3.6 ± 0.6 | 3.1 ± 0.3 | 0.1316 |
| Ca2+ (cmol+ kg−1) | 5.99 ± 3.34 | 4.35 ± 2.49 | 0.4025 |
| Mg2+ (cmol+ kg−1) | 1.29 ± 0.84 | 1.03 ± 0.68 | 0.6079 |
| Na+ (cmol+ kg−1) | 0.18 ± 0.07 | 0.19 ± 0.09 | 0.8452 |
| K+ (cmol+ kg−1) | 0.39 ± 0.11 | 0.16 ± 0.05 | 0.0355 * |
| Σb (cmol+ kg−1) | 7.75 ± 4.23 | 5.72 ± 3.02 | 0.4082 |
| Al3+-KCl (cmol+ kg−1) | 0.37 ± 0.38 | 0.90 ± 0.46 | 0.0817 |
| Fe3+-KCl (cmol+ kg−1) | 0.01 ± 0.01 | 0.04 ± 0.04 | 0.1496 |
| Σa (cmol+ kg−1) | 0.38 ± 0.39 | 0.93 ± 0.48 | 0.0799 |
| CEC (cmol+ kg−1) | 16.4 ± 3.68 | 17.0 ± 5.30 | 0.8436 |
| Vb (%) | 46.9 ± 22.5 | 33.0 ± 9.75 | 0.2428 |
| Va (%) | 2.57 ± 2.65 | 6.06 ± 3.15 | 0.0950 |
Table 2.
Topsoil physical properties of Ah horizons (0–10 cm): stoniness, soil aggregate stability (SAS), water drop penetration time (WDPT), and ethanol percentage test (EPT). Values are expressed as mean ± standard deviation (n = 5). p indicates p-value obtained from the one-way ANOVA test and significant differences (p < 0.05) are marked with *.
| Soil Properties | Beechwood | Pinewood | p |
|---|---|---|---|
| Stoniness (%) | 71.5 ± 11.4 | 73.9 ± 6.3 | 0.6913 |
| SAS (%) | 93.6 ± 1.2 | 93.7 ± 2.9 | 0.9187 |
| WDPT (s) | 28.7 ± 33.5 | 1244 ± 1584 | 0.1004 |
| EPT (% ethanol) | 4.00 ± 2.24 | 12.7 ± 7.2 | 0.0319 * |
© 2018 by the authors. Licensee MDPI, Basel, Switzerland. This article is an open access article distributed under the terms and conditions of the Creative Commons Attribution (CC BY) license (http://creativecommons.org/licenses/by/4.0/).
Share and Cite
MDPI and ACS Style
Girona-García, A.; Badía-Villas, D.; Martí, C. Changes in Topsoil Properties after Centennial Scots Pine Afforestation in a European Beech Forest (NE Spain). Forests 2018, 9, 343. https://0-doi-org.brum.beds.ac.uk/10.3390/f9060343
AMA Style
Girona-García A, Badía-Villas D, Martí C. Changes in Topsoil Properties after Centennial Scots Pine Afforestation in a European Beech Forest (NE Spain). Forests. 2018; 9(6):343. https://0-doi-org.brum.beds.ac.uk/10.3390/f9060343
Chicago/Turabian StyleGirona-García, Antonio, David Badía-Villas, and Clara Martí. 2018. "Changes in Topsoil Properties after Centennial Scots Pine Afforestation in a European Beech Forest (NE Spain)" Forests 9, no. 6: 343. https://0-doi-org.brum.beds.ac.uk/10.3390/f9060343
Note that from the first issue of 2016, this journal uses article numbers instead of page numbers. See further details here.