Article

Comparative Genomics and Characterization of the Late Promoter pR’ from Shiga Toxin Prophages in Escherichia coli

Department of Agriculture, Food and Nutritional Science, University of Alberta, Edmonton, AB T6G 2P5, Canada
*
Author to whom correspondence should be addressed.
Submission received: 29 September 2018 / Revised: 26 October 2018 / Accepted: 27 October 2018 / Published: 31 October 2018
(This article belongs to the Special Issue Viruses of Microbes V: Biodiversity and Future Applications)

Abstract

:
Shiga-toxin producing Escherichia coli (STEC) causes human illness ranging from mild diarrhea to death. The bacteriophage encoded stx genes are located in the late transcription region, downstream of the antiterminator Q. The transcription of the stx genes is directly under the control of the late promoter pR’, thus the sequence diversity of the region between Q and stx, here termed the pR’ region, may affect Stx toxin production. Here, we compared the gene structure of the pR’ region and the stx subtypes of nineteen STECs. The sequence alignment and phylogenetic analysis suggested that the pR’ region tends to be more heterogeneous than the promoter itself, even if the prophages harbor the same stx subtype. Furthermore, we established and validated transcriptional fusions of the pR’ region to the DsRed reporter gene using mitomycin C (MMC) induction. Finally, these constructs were transformed into native and non-native strains and examined with flow cytometry. The results showed that induction levels changed when pR’ regions were placed under different regulatory systems. Moreover, not every stx gene could be induced in its native host bacteria. In addition to the functional genes, the diversity of the pR’ region plays an important role in determining the level of toxin induction.

1. Introduction

Bacteriophages shape the genome of their prey through horizontal gene transfer, often transferring genes that provide an evolutionary benefit for both the bacterial host and the prophage. There are several examples of this phenomenon in Escherichia coli including phages that transfer genes into E. coli that confer virulence, or improve its ability to survive environmental stress [1,2,3,4]. One such group of genes are the stx genes that make E. coli toxic to some protist predators, but also convert commensal E. coli to human pathogens [5,6,7,8].
Shiga toxin-producing E. coli (STEC) cause diarrheal disease [9]. A subpopulation of STEC, enterohemorrhagic E. coli (EHEC), combines Stx production with adhesion to the intestinal mucosa. EHEC infections often cause fatal complications such as hemorrhagic colitis (HC) and hemolytic uremic syndrome (HUS), which can be fatal [10]. EHEC derives adhesion factors from the locus of enterocyte effacement (eae) of enteropathogenic E. coli. E. coli O104:H4, an emerging EHEC, caused several outbreaks in Europe from 2009 to 2011 [11,12]. E. coli O104:H4 combines adhesion factors of enteroaggregative E. coli, which produce attaching and effacing (A/E) lesions with Shiga toxin production [13]. The defining virulence factor of STEC, Shiga toxin (Stx) [14,15], inhibits protein synthesis and stimulates programmed cell death [16,17,18]. There are two main types of Stx, Stx1 and Stx2 with multiple subtypes in each group. Stx2a is most commonly associated with human infections [19].
The sequence diversity of Stx prophages affects Stx expression. The stx genes are located in the late region of the prophage, downstream of the antiterminator Q and upstream of the lysis cassette, and are controlled by the late promoter pR’ [20]. Protein Q binds to the Q utilization site (qut), which is found partially between the -10 and -35 sites of pR’, and allows the RNA polymerase to read through the terminator cassette [21]. The Q protein from lambda was unable to act as an antiterminator for the H-19B phage [22]. Sequence diversity of this region may thus affect the expression of stx [23,24]. Antiterminator Q affects stx expression, with Q933 in E. coli EDL933 related to higher stx expression [25], while its alleles, Q21 and QO111:H-, which share a low amino acid identity with Q933, have different properties [24,26]. Genomic differences in the early transcription region also affect toxin production and phage induction. The sequence diversity of proteins O and P, which are in the early region, affect toxin expression [27].
Stx phages have a broad range of genome size ranging from 16 Kb to 68.7 Kb [28,29]. Such variation among the Stx genome, especially the late regulation region [26,30], may directly or indirectly change prophage induction and toxin production; however, sequence variation of the regulatory regions upstream of stx have not been linked to phage induction and stx expression. This study therefore aimed to determine the expression of stx under control of different pR’ regions in their native and non-native strains, demonstrating that the mosaic nature of stx phage affects their virulence and allows for the rapid evolution of Stx phages. Heterogeneous pR’ regions were retrieved from STEC differing in origin and sequence of the stx prophage. A DsRed based reporter system visualized stx expression and the interaction between different pR’ and different target regulatory systems were determined by cloning the reporter construct in different STEC. Previous studies have shown that when two lambdoid prophages are present in a cell both are induced; however, we found that this was not always the case [31].

2. Materials and Methods

2.1. Bacterial Strains and Culture Conditions

The STEC strains used in this study are listed in Table 1 [32]. Strain E. coli O104:H4 strain 11-3088 Δstx::gfp::ampr was used as the reporter strain for DsRed expression; this strain is a derivative of the outbreak strain E. coli O104:H4 that was obtained by the replacement of stx2a by a gfp::ampr cassette [33]. E. coli were routinely grown in Luria-Bertani (LB) medium (BD, Fisher Scientific, Edmonton, CA, USA), at 37 °C with agitation at 200 rpm, or on LB agar plates with 1.5% agar (BD, Fisher Scientific). Ampicillin (50 g/L) and chloramphenicol (100 g/L) were added when required for plasmid maintenance.

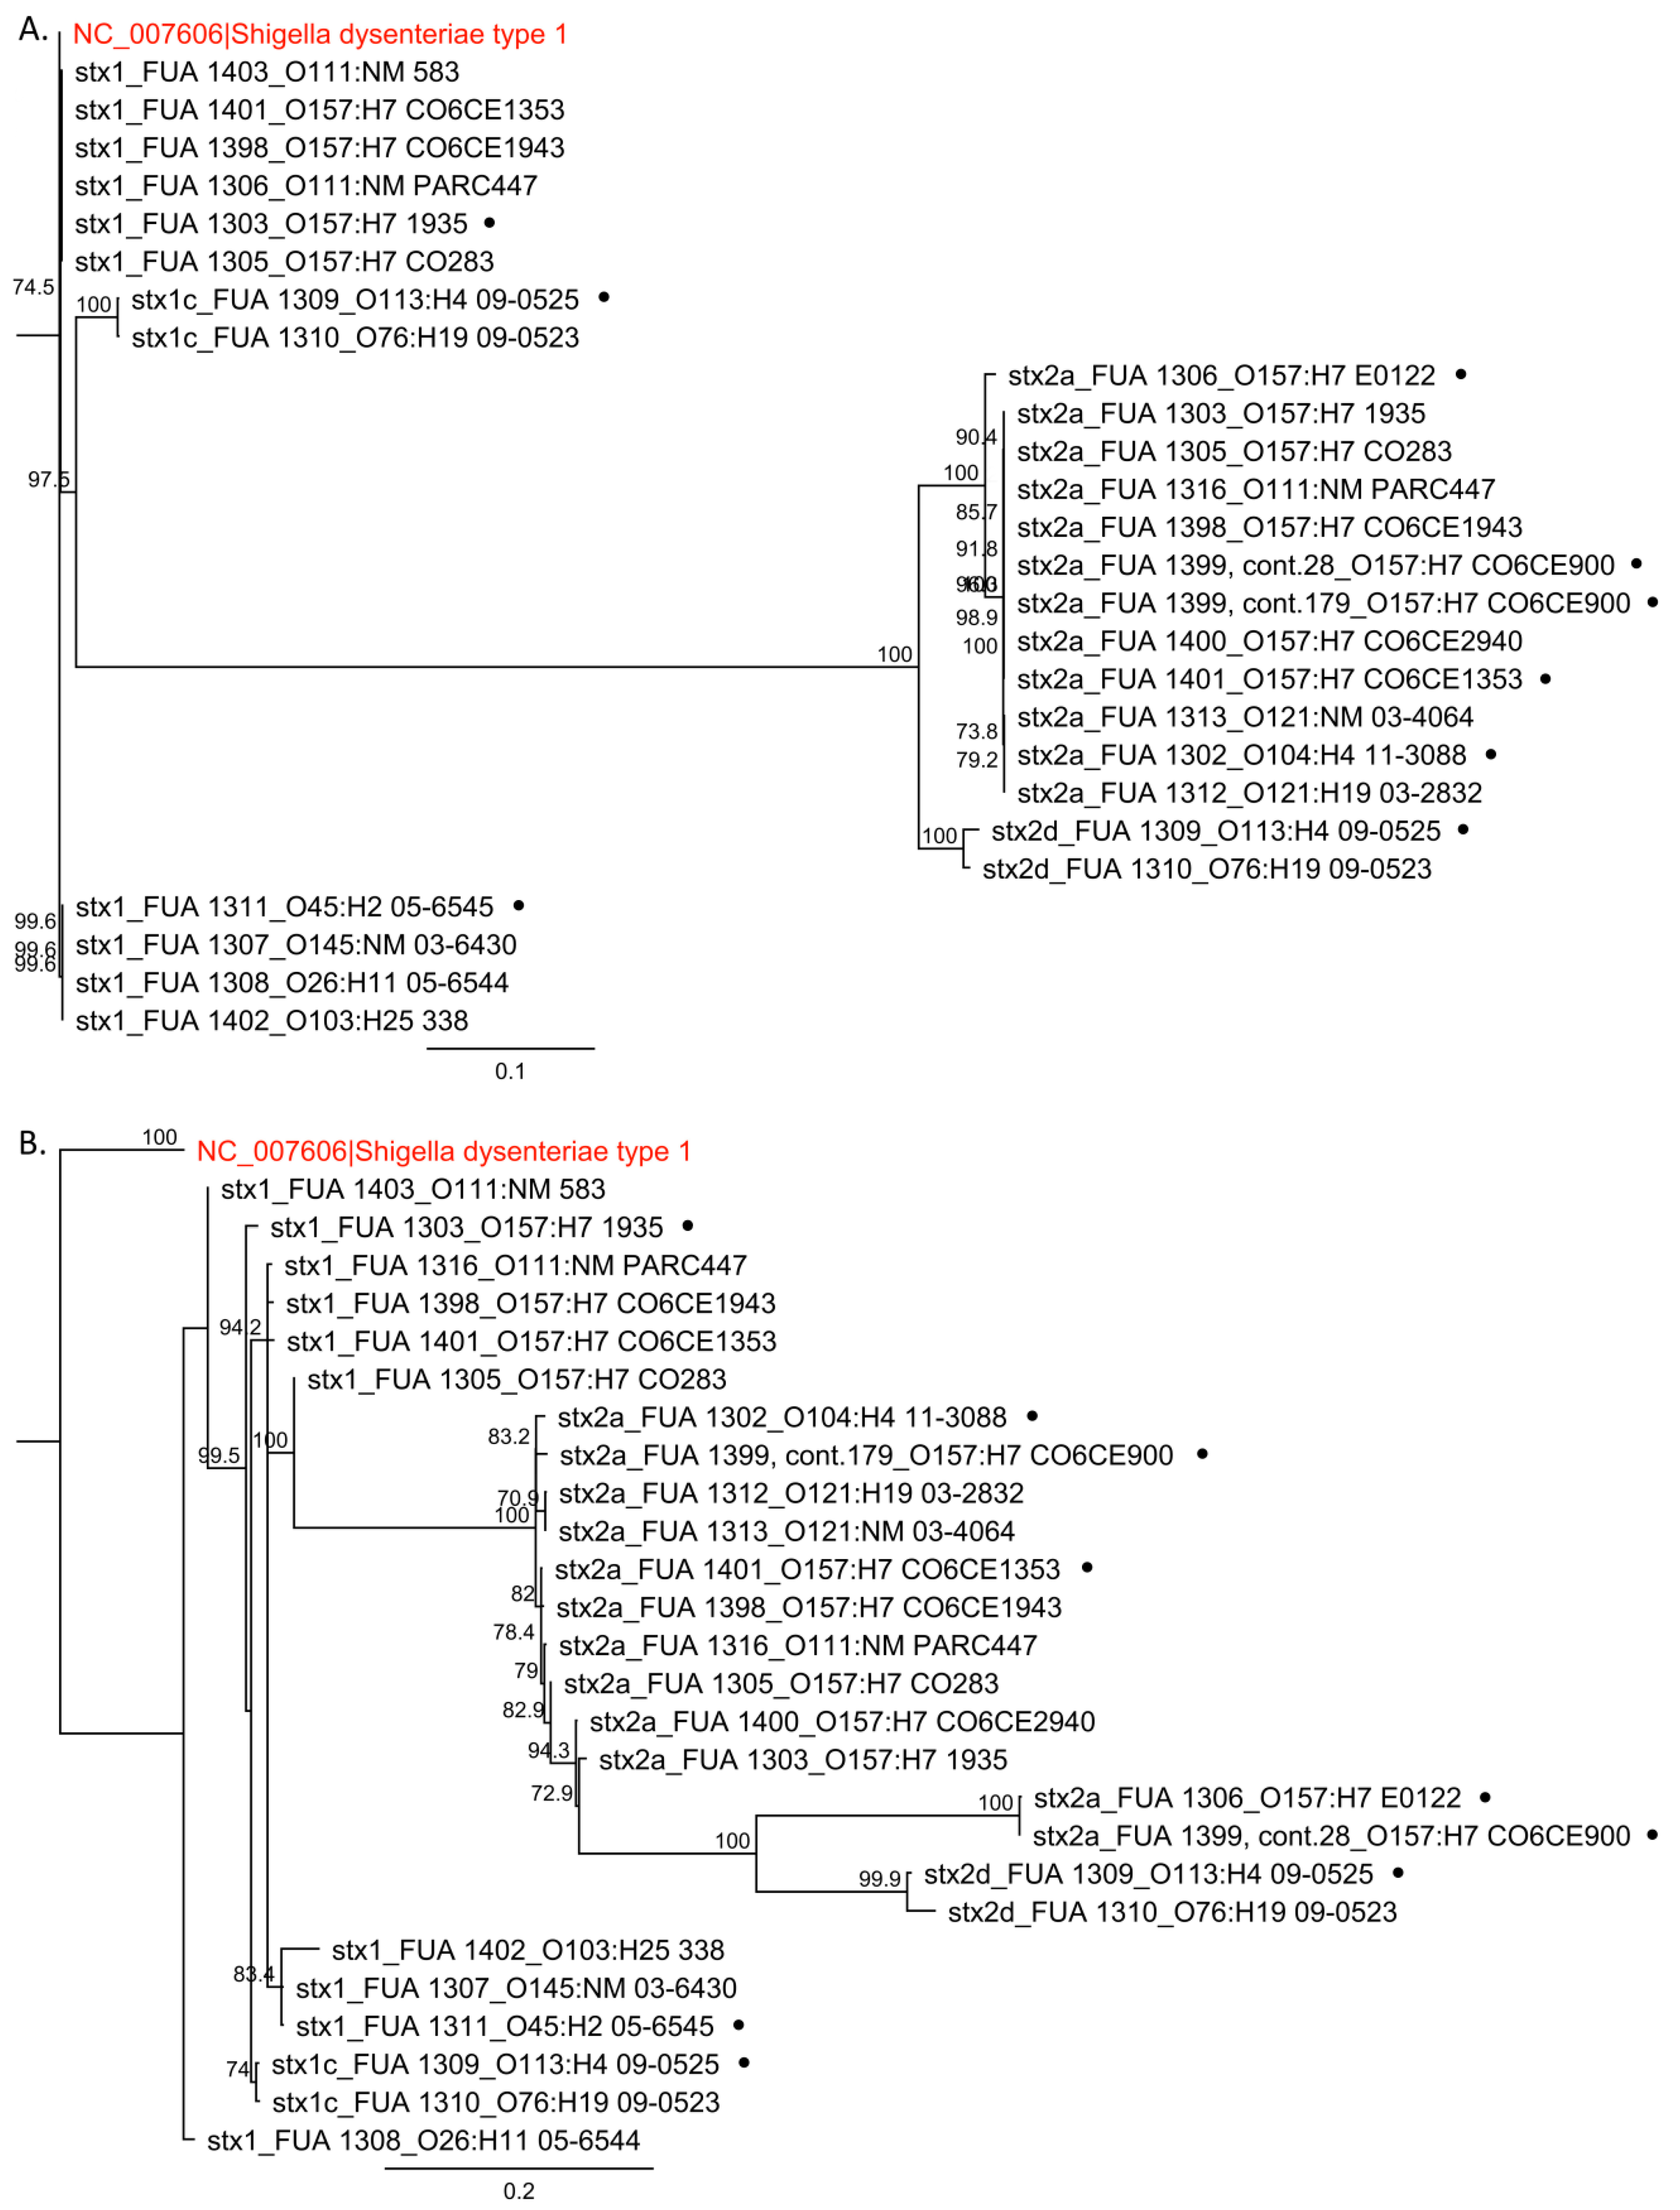
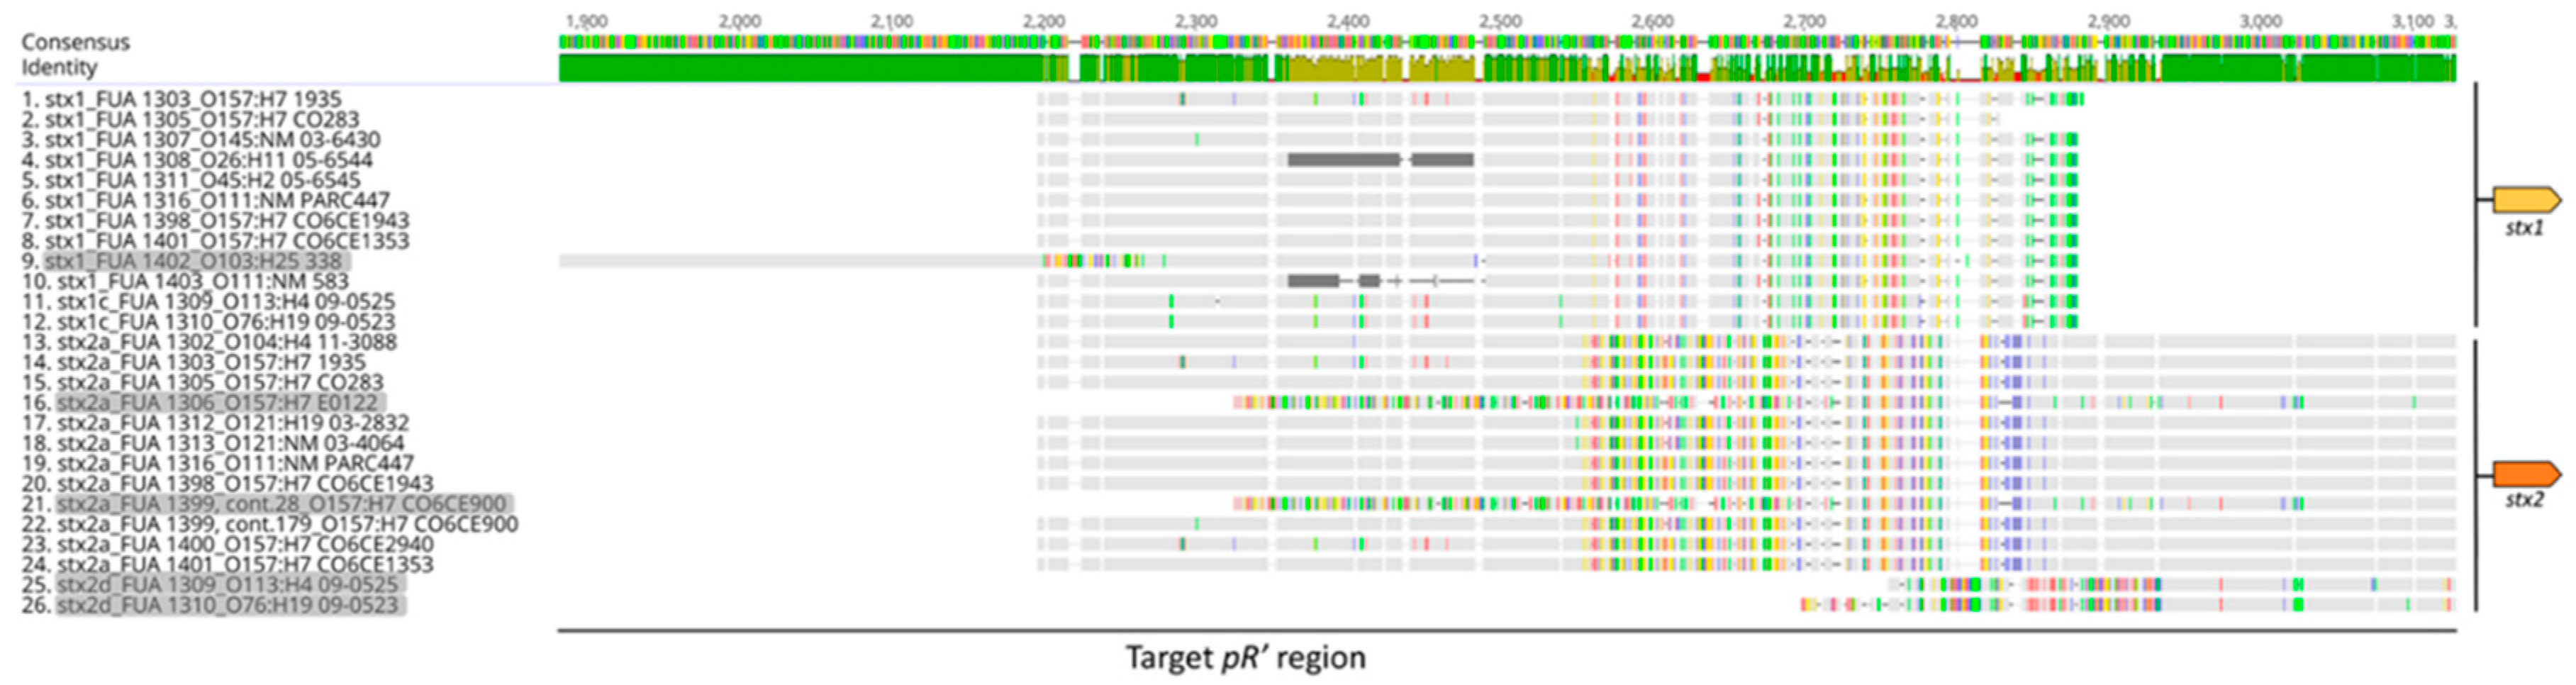
2.2. Sequence Analysis and Phylogenetic Trees

For scaffolding the contigs and pairing, the contig(s) (Table 1) containing stx were retrieved and reference strains with a closed genome were determined by Nucleotide BLAST on the National Center for Biotechnology Information (NCBI) (https://blast.ncbi.nlm.nih.gov/Blast.cgi). To obtain the complete sequence of the target segment, reference genome sequences were downloaded from the NCBI nucleotide database and contigs were manually aligned with the references and assembled into a larger segment in Geneious (Biomatters, Auckland, New Zealand). Gaps between contigs were filled by Sanger sequencing.
Sequence alignment and phylogenetic analysis of the pR’ regions and stx genes were generated by Geneious. To generate the phylogenetic trees, sequences of the pR’ region were first aligned using MUSCLE [35]. Results of the alignment were used to build the tree. The stx from Shigella dysenteriea type 1 strain Sd197 (accession number: NC_007606) was included as the outgroup. Parameters “Tree build Method” and “Resampling Method” were set as “Neighbor-Joining” and “Bootstrap”, respectively, while the rest of the parameters were set to default values.

2.3. Nomenclature of Promotor Constructs

The pR’ region was determined as the region starting from the last 42 bp of the Q protein and ending by the first 39 bp of the stx to make sure that the pR’ from all candidate strains could be included. Plasmids containing the different pR’ were named as Pp, followed by the strain number of the Food Microbiology culture collection at the University of Alberta (FUA number). For example, the pUC19 derived plasmid containing the pR’ fragment from E. coli was termed Pp1302. Plasmids containing the pR’ region from strains with more than one stx gene were denoted by Pp, followed by the FUA number and the abbreviation of the stx subtype. For example, the plasmids containing one of the two pR’ fragments from E. coli FUA1303 were denoted as Pp1303-1 and Pp1303-2a, respectively. Plasmids containing promotor regions from E. coli FUA1399, which harbors two stx2a genes, were denoted by the FUA number and the contig number, which were Pp1399-28 and Pp1399-79.

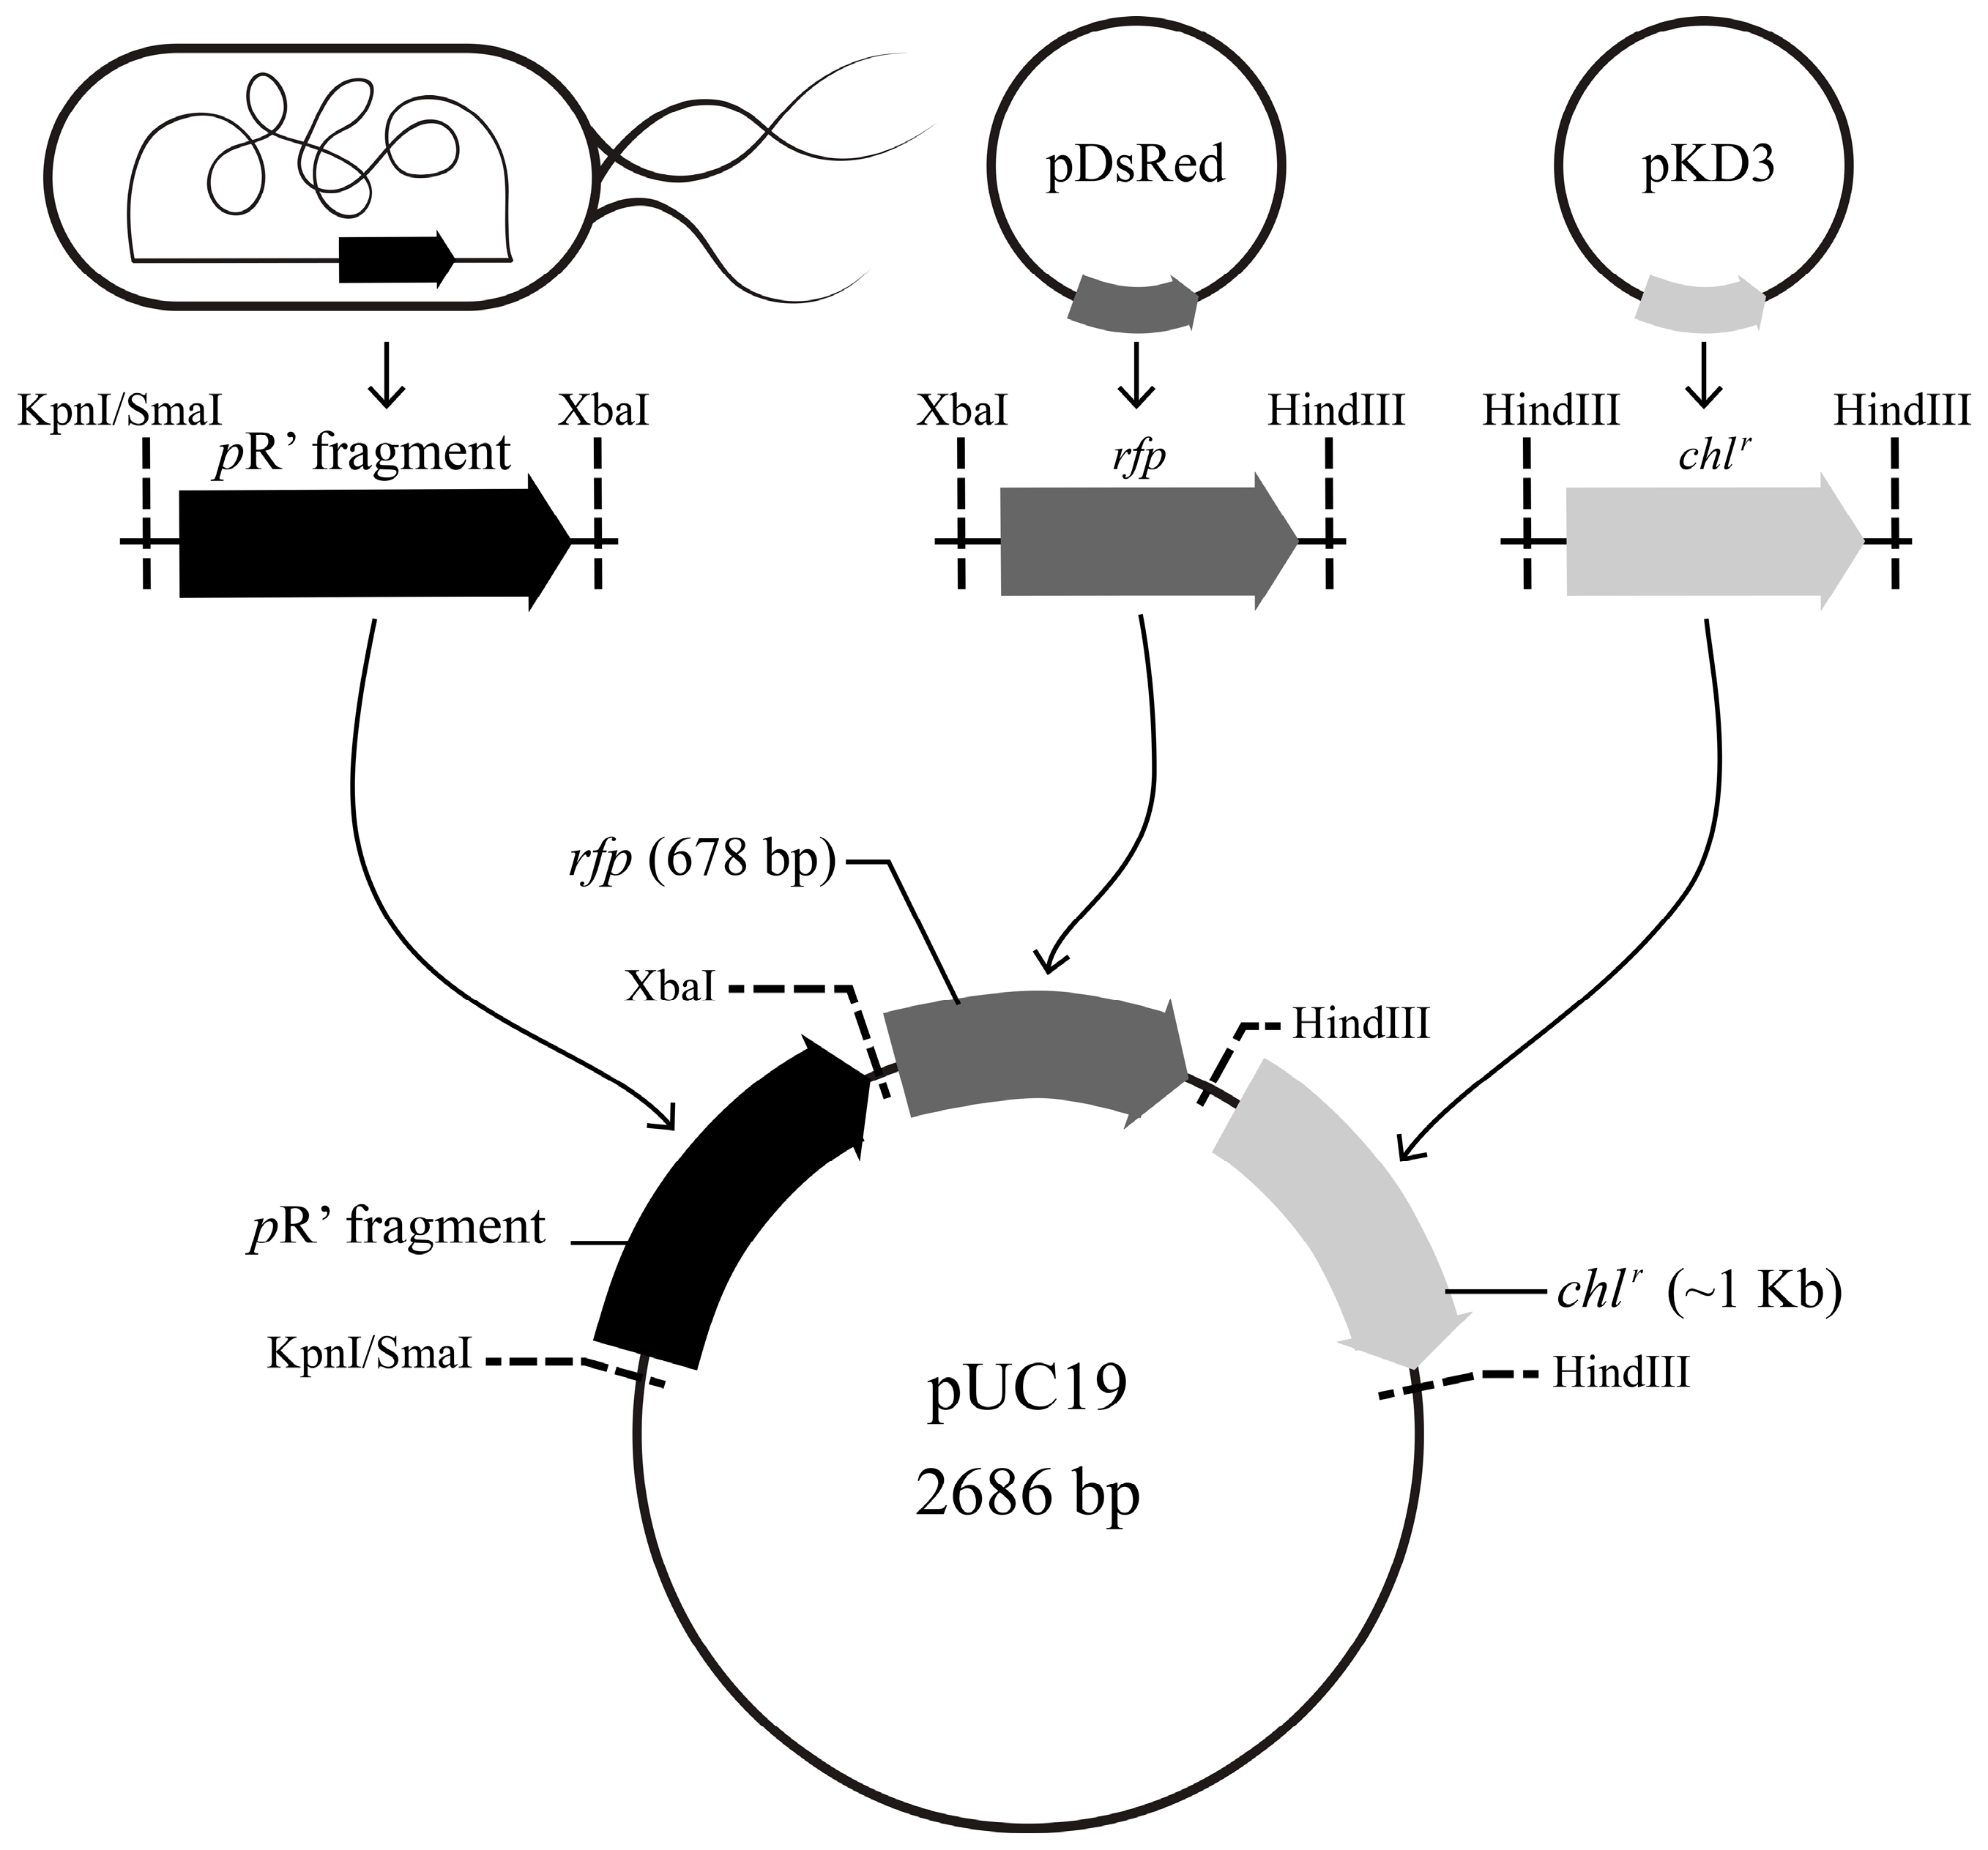
2.4. Construction and Validation of the pR’::rfp::chlr Transcriptional Fusion Reporter System

To construct the pR’::rfp::chlr fusion reporter system, fragments pR’, rfp, and chlr were amplified from candidate STEC strains, plasmid pDsRed (Clontech, Mountain View, CA, USA), and plasmid pKD3 [36], respectively. Three fragments were ligated together and transformed into the vector pUC19. The plasmids and primers used are listed in Table 1 and Table 2.
Construct Pp1302::rfp::chlr was transformed into E. coli O104:H4 11-3088 Δstx::gfp::ampr and O157:H7 CO6CE900, respectively, to validate the RFP reporter system. To measure the phage induction level under the control of the same regulatory system, constructs Prfp::chlr, Pp1302::rfp::chlr, Pp1303-1::rfp::chlr, Pp1303-2a::rfp::chlr, Pp1306::rfp::chlr, Pp1309-1c::rfp::chlr, Pp1309-2d::rfp::chlr, and Pp1311::rfp::chlr were transformed into E. coli O104:H4 11-3088 Δstx::gfp::ampr. To determine the induction level in the native environment, constructs Pp1303-1::rfp::chlr, Pp1303-2a::rfp::chlr, Pp1311::rfp::chlr, Pp1399-28::rfp::chlr, and Pp1399-79::rfp::chlr were transformed back into their parent strains: E. coli FUA1303, FUA1311, and FUA1399. To measure the induction level of the same prophage under the control of different regulatory system, Pp1302::rfp::chlr was transformed into E. coli FUA1303, FUA1311, and FUA1399; Prfp::chlr was selected as the control. Electroporation transformation was employed to obtain the transformants.
To validate the fluorescence gene fusion reporter system, DsRed expression by strains harboring the reporter constructs was visualized by fluorescent microscopy under the Axio Imager microscope (Carl Zeiss Canada Ltd., Toronto, ON, Canada). Image acquisition was performed with multi-channel fluorescence imaging with filters for Rhodamine (red fluorescence) and GFP. Cells were grown in LB with a 0.5 µg/mL final concentration MMC (M0503-2MG, Millipore Sigma, St. Louis, MO, USA) for 4.5 h, and observed with a 10× or 40× objective lens and a 10× ocular. Pictures were captured by an AxioCam M1m 385 camera and viewed by Axio Vision software (v.4.8.2.0, Carl Zeiss Canada Ltd., Toronto, ON, Canada).

2.5. Determination of the Treatment Conditions for Flow Cytometry Detection

To prevent cell lysis prior to analysis by flow cytometry without interfering with the folding of DsRed, a time course experiment of heat inactivation was performed. The heating was performed at a time when DsRed was produced, but before the expression of phage genes resulted in cell lysis. Cells were induced with MMC (0.5 g/L) when OD600 reached 0.4~0.6 (exponential phase), further incubated for 3 h, and sampled every 30 min. Samples were heated to 60 °C for 5 min, resulting in cell inactivation but not cell lysis [37], and incubated at 4 °C for 27 h, 37 °C for 7 h, or 37 °C for 27 h.
A LSRFortessa™ X-20 cell analyzer (Biosciences, Mississauga, ON, Canada) was used to perform the cell analysis. Fluorescence was excited with a 488 nm Argon ion laser and followed by a 530/30–575/26 nm bandpass filters, and finally detected by side scatter detectors and a forward scatter detector. To adjust the detected cell number per second (e/s) between 300~3000 e/s, samples were resuspended and diluted between 1:100 and 20:100 with 1 mL 1× PBS (pH 7.4). Data was recorded by BD FACSDIVATM software (BD Biosciences, San Jose, CA, USA) and analyzed by FlowJo (BD Biosciences, San Jose, CA, USA) (Figure 1). The single cell population was defined by selecting the cell population located along the diagonal of the “FSC-A; FSC-H” dot plot, and “cells of favorite” was set as 100% of the singlets in the “FSC-A; SSC-A” dot plot. The gating strategy for the flow cytometric analysis is shown in Figure 1.

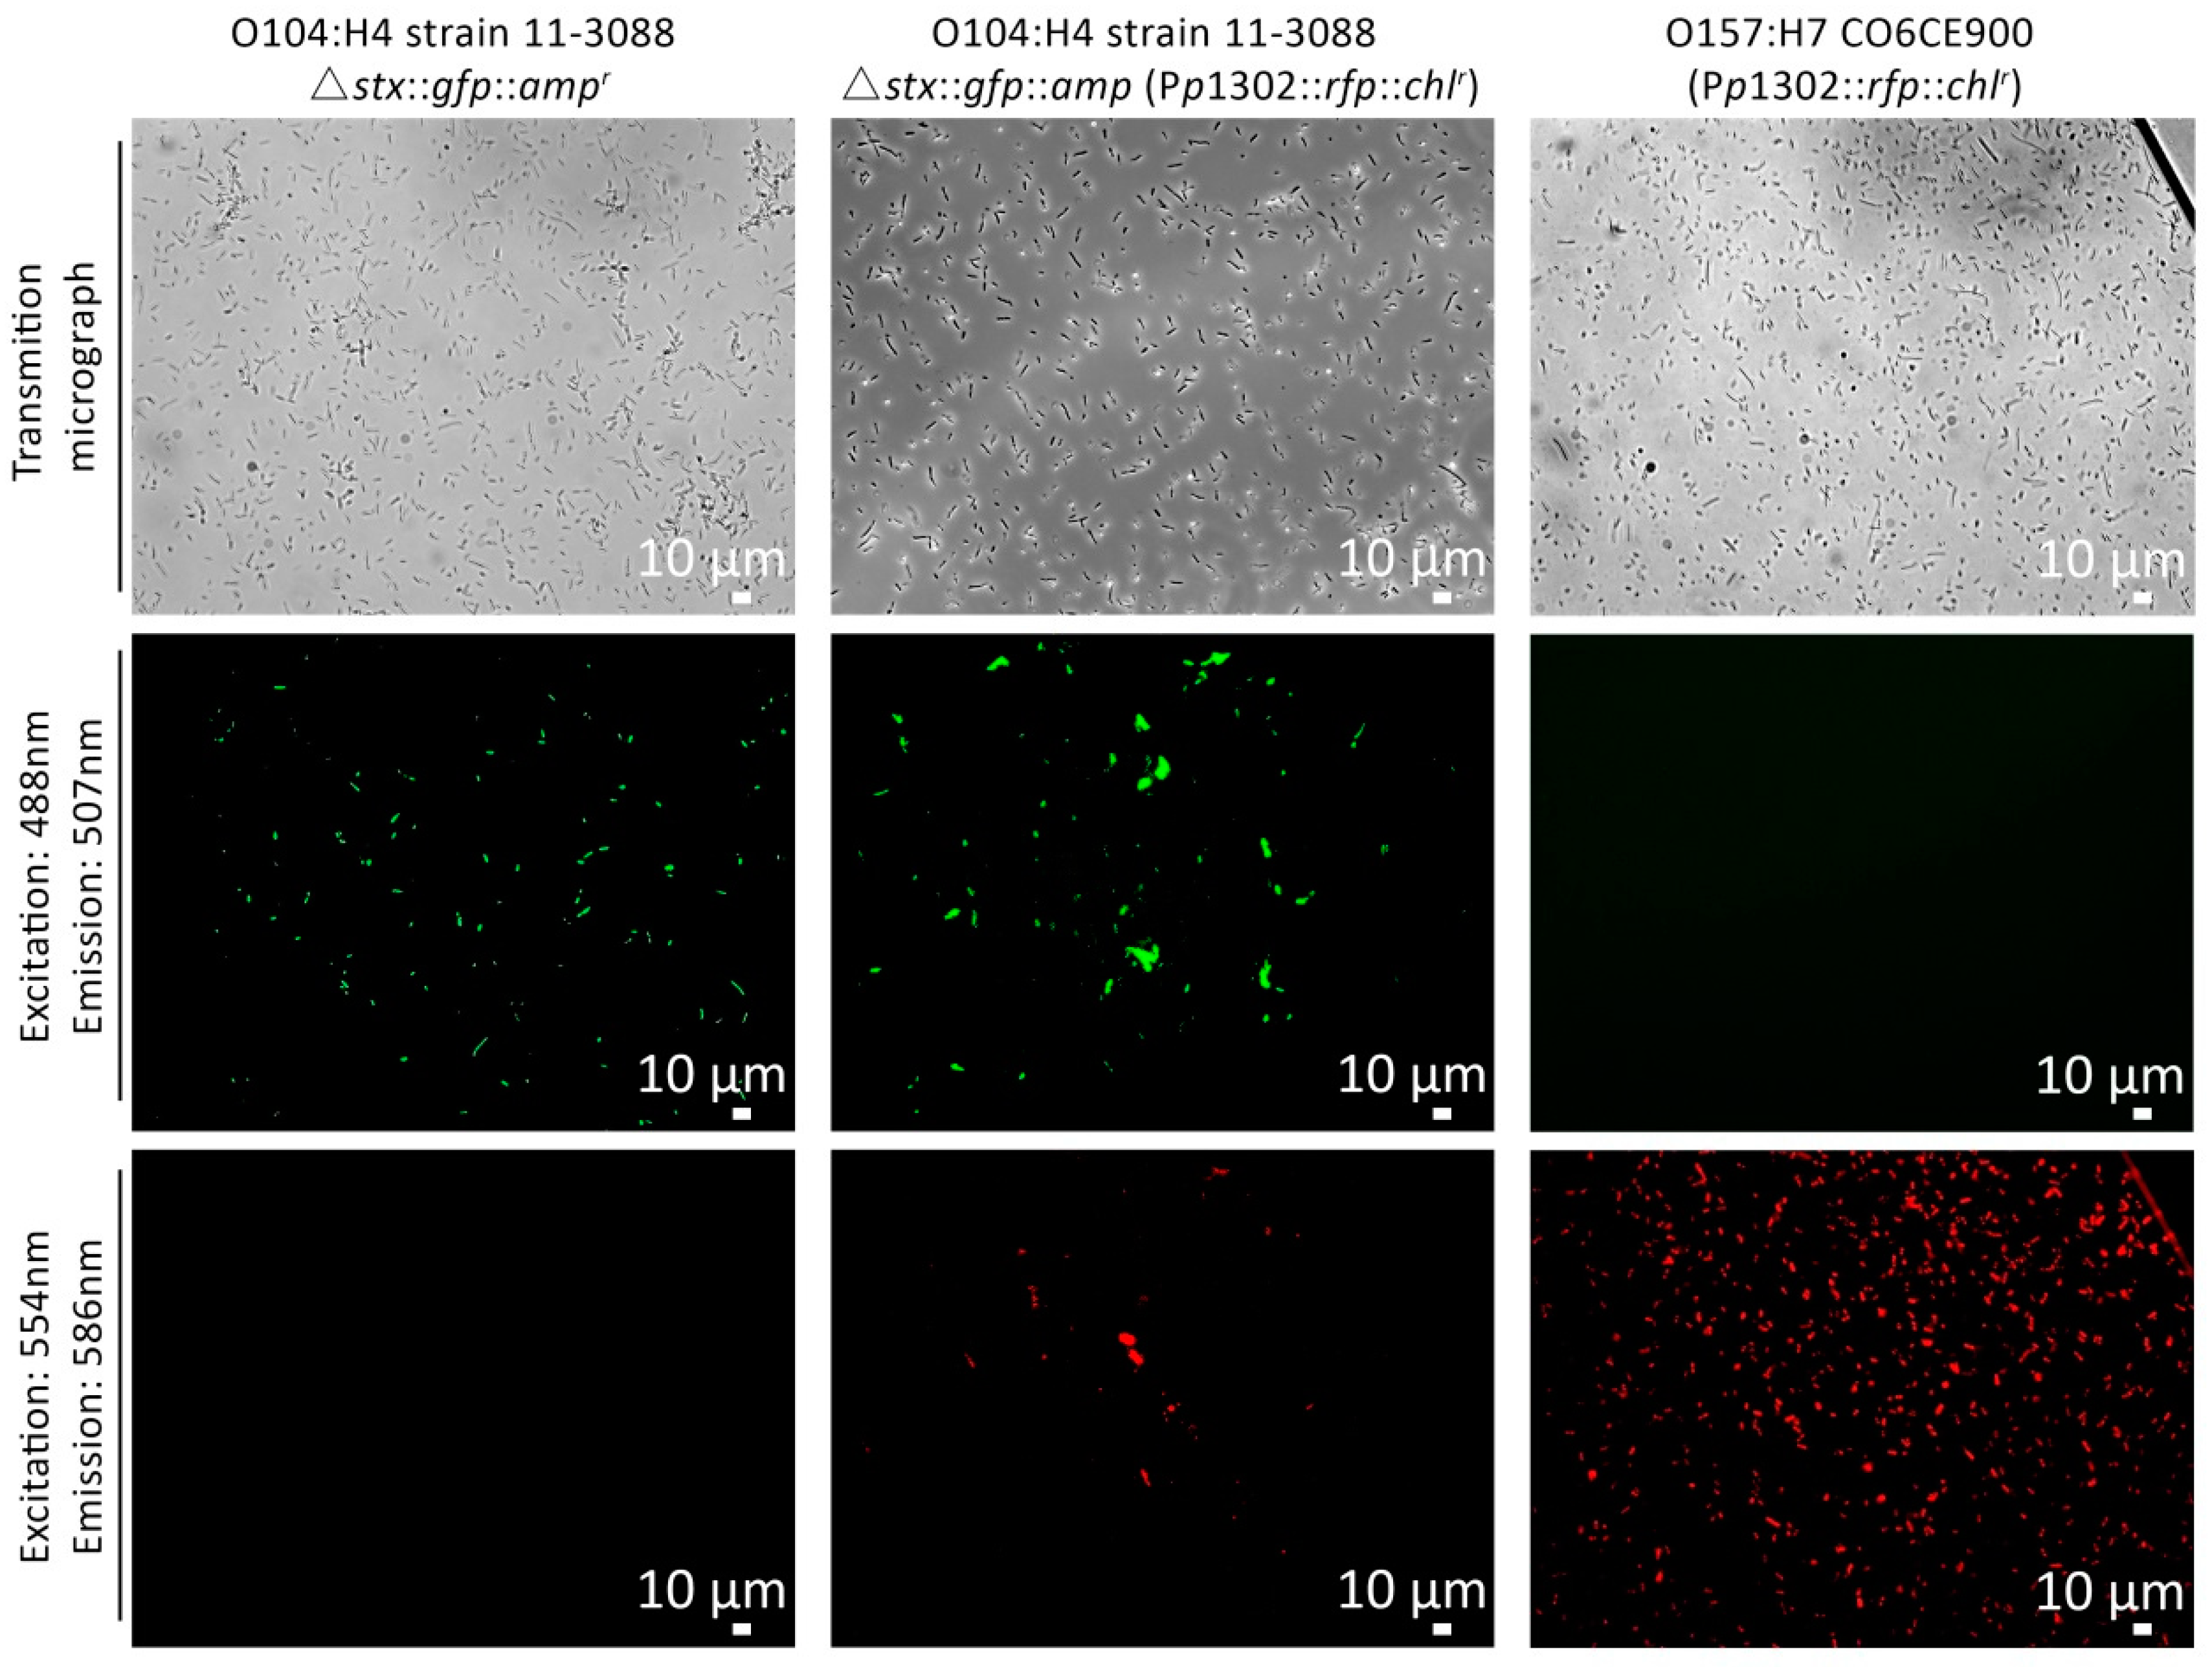
2.6. Flow Cytometry Detection of the Behavior of the pR’::rfp::chlr Constructs in Different Target Strains

To evaluate the induction efficiency, exponential phase cultures were inducted by MMC (0.5 g/L), heat inactivated 4.5 h after induction, and measured by flow cytometer 27 h after induction (22.5 h after heating inactivation). The method used for the detection of the fluorescent cell population was the same as described above.

2.7. Statistical Analysis

The experiments were repeated at least three separate times (biological replicates). Statistical analysis was performed with SigmaPlot (v.12.5., Systat Software Inc., London, UK) using one-way analysis of variance (ANOVA). A p-value of ≤0.05 was considered statistically significant.

3. Results

3.1. Sequence Alignment and Phylogenetic Analysis

Previous studies have demonstrated the mosaic nature of stx phages [30,38]. In this study, a phylogenetic analysis was performed to compare the pR’ region and stx to determine whether the phylogeny of stx corresponded to the phylogeny of the pR’ region that controls stx and prophage expression (Figure 2). The stx genes of the same subtype were located in the same clade (Figure 2A); stx1 and stx1c were located in two separate clades where genes belonging to the stx2 subtypes were all in the same branch. The phylogeny of pR’ regions was more heterogeneous (Figure 2B) and did not match the phylogeny of the corresponding stx.
The late promoter region, which includes the pR’ promoter, is directly upstream of stx and downstream of Q [39]. To assess the sequence diversity, 26 sequences of the pR’ region were aligned (Figure 3). The comparison of the pR’ regions confirmed that the sequences of pR’ regions were highly divergent even if they regulated the same stx subtype (Figure 3). Most of the sequence differences in the pR’ regions were caused by single nucleotide changes and not the insertion of a whole flanking region, which suggested the possibility of functional diversity during phage induction [40]. Several pR’ regions including p1402, p1309-2d, p1310-2d, p1306, and p1399-28 lacked the pR’ site that was identified in highly virulent strains (Acc. No. AP000400) [41]. In order to determine the effect of the pR’ region on phage induction levels, we selected nine prophages with diverse sequences of stx and the pR’ region for subsequent analyses excluding closely related sequences.

3.2. Construction and Validation of the pR’::rfp::chlr Transcriptional Fusion

To determine the role of the pR’ region in stx expression, we amplified the pR’ fragments from 16 strains by PCR and ligated the pR’ fragments into the plasmid pUC19, respectively. The DsRed reporter protein and the antibiotic resistance gene chlr was introduced into the vector, downstream of the pR’ region. The resulting plasmid is depicted in Figure 4 (schematic rings).
To validate the pR’::rfp::chlr transcriptional fusion, E. coli O104:H4 11-3088 Δstx::gfp::ampr (Pp1302::rfp::chlr) and E. coli O157:H7 CO6CE900 (Pp1302::rfp::chlr) were induced by 0.5 g/L MMC for 4.5 h (Figure 5). E. coli O104:H4 11-3088 Δstx::gfp::ampr was used as the negative control. In this strain, stx was replaced by gfp to visualize protein expression by fluorescence microscopy or flow cytometry [33]. In the absence of the pR’ construct, only GFP positives could be observed after induction, whereas RFP positives were only detected in the target strain carrying a pR’::rfp construct. Moreover, E. coli O104:H4 11-3088 Δstx::gfp::ampr (Pp1302::rfp::chlr) showed both GFP and RFP positive cells, which demonstrated that the expression of the chromosomal gfp and the plasmid rfp were not affected by each other (p ≥ 0.05).

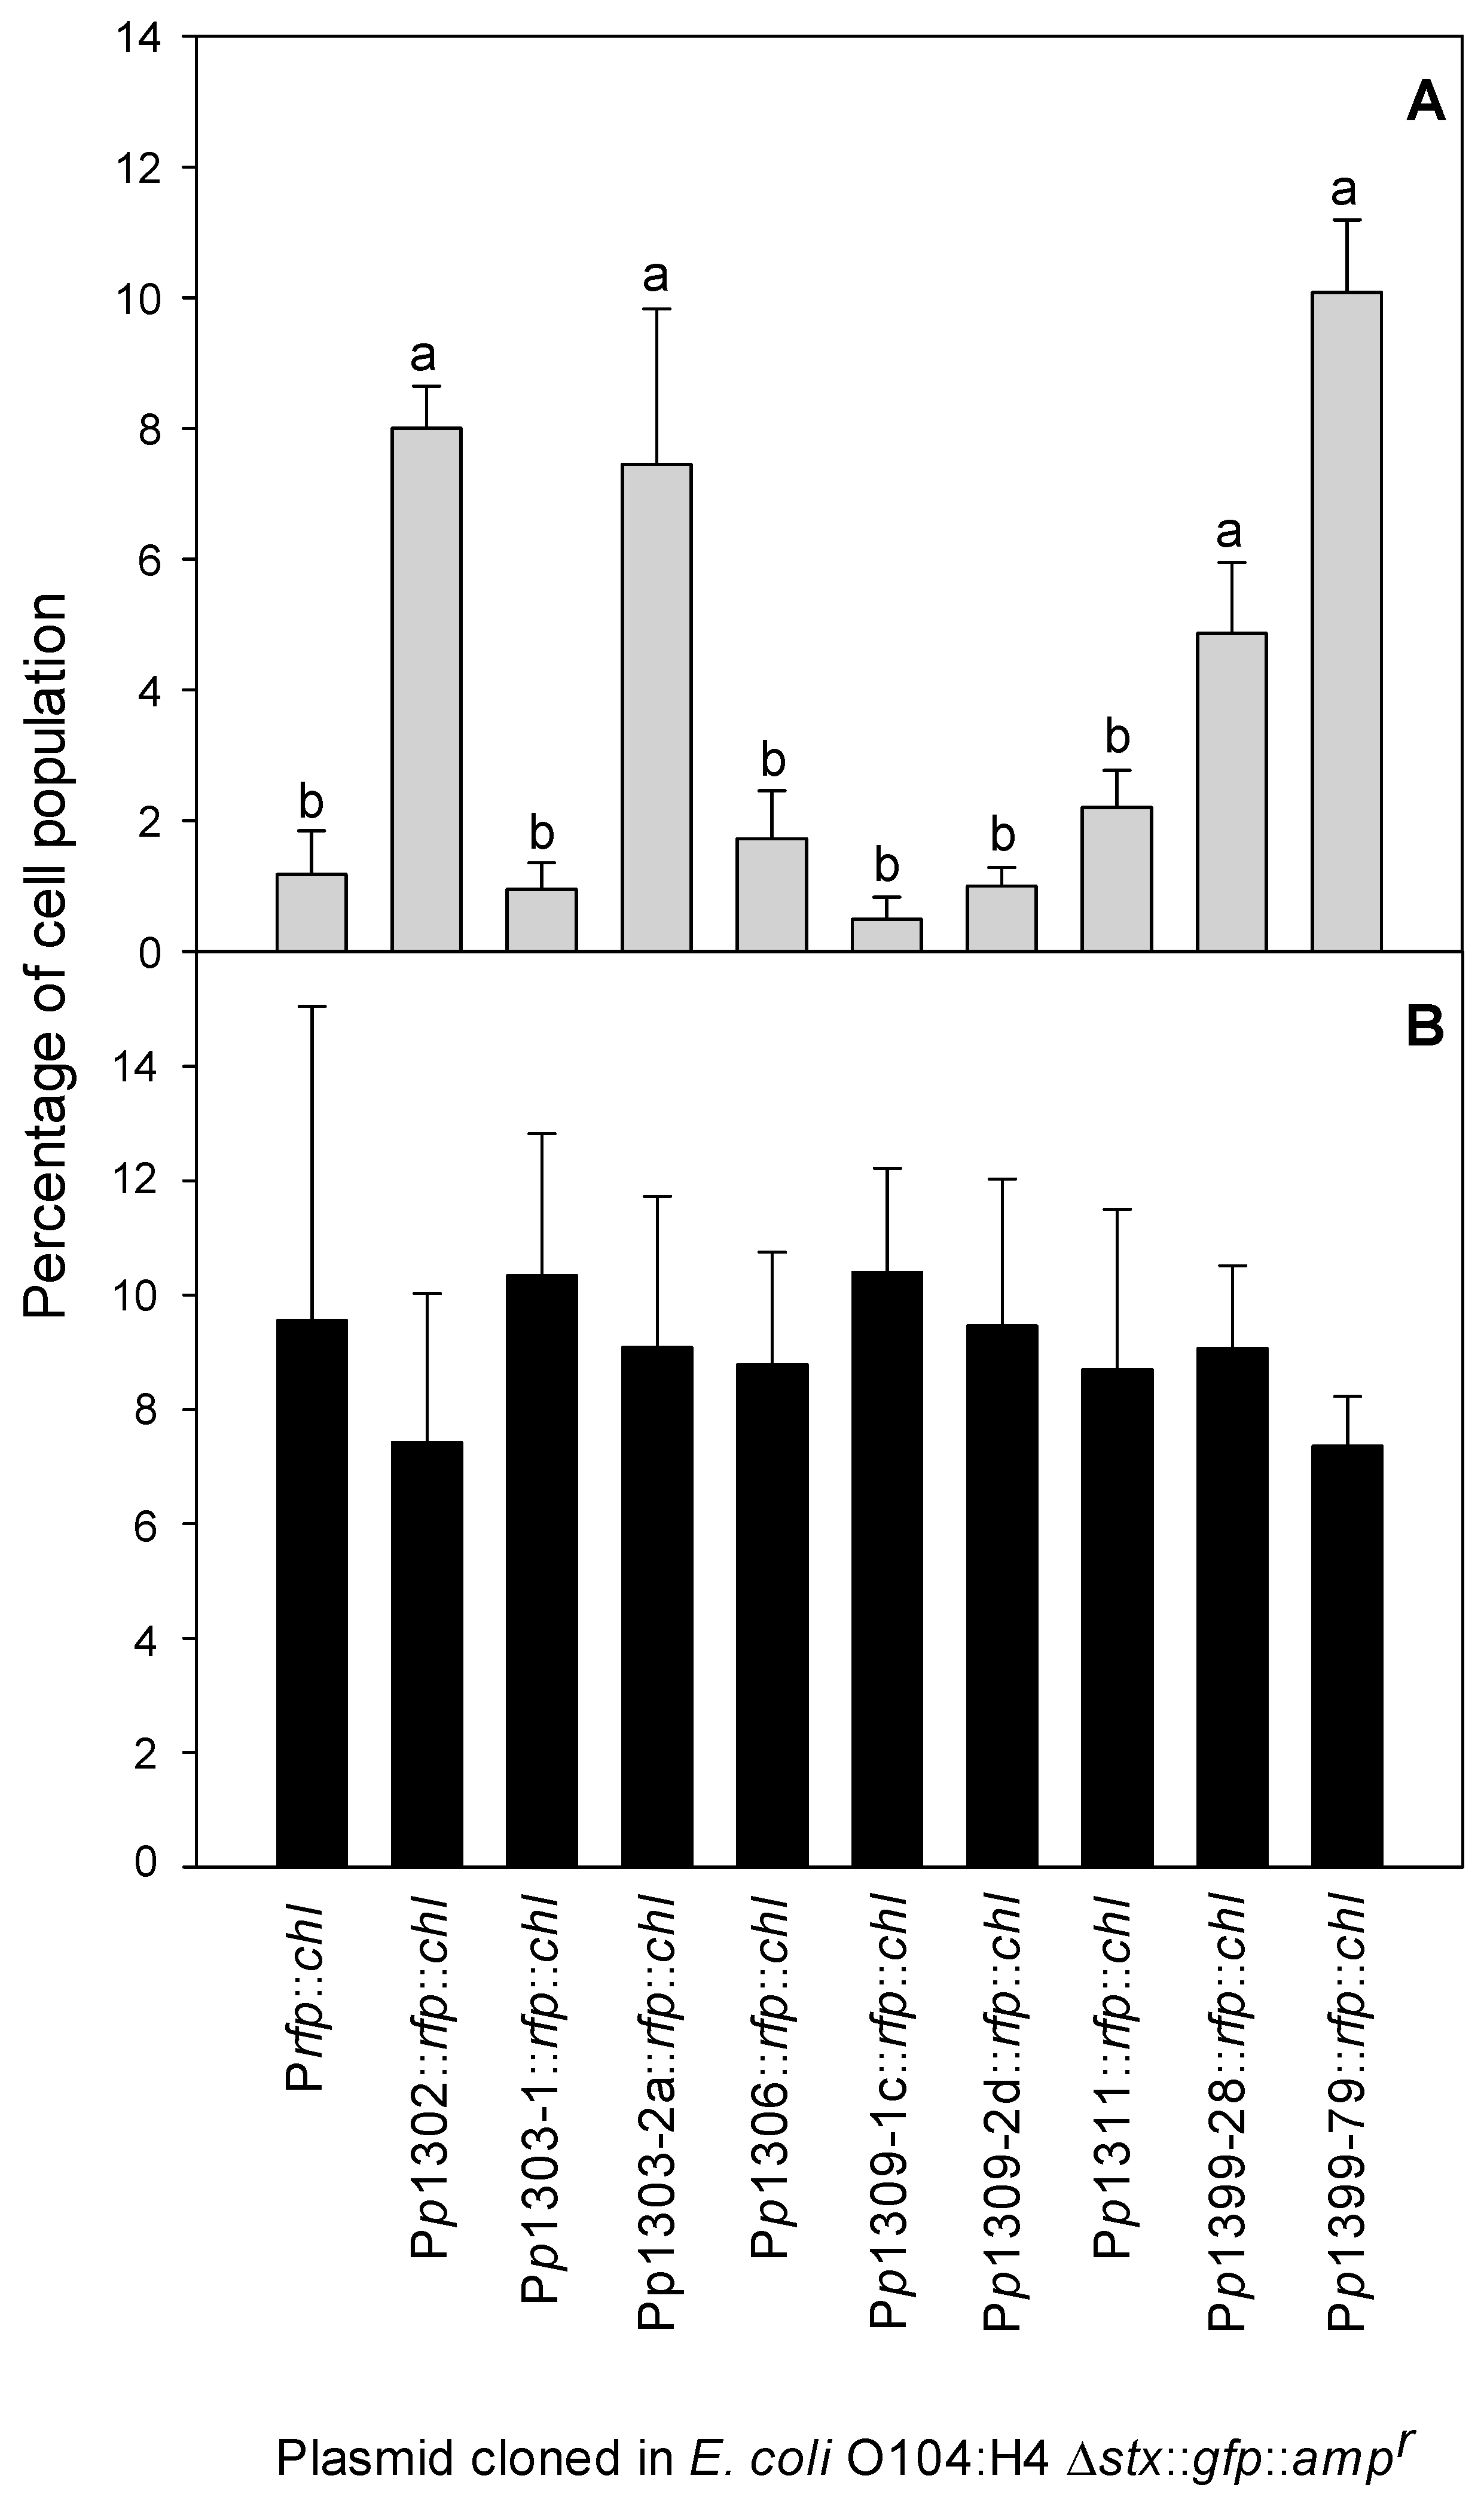
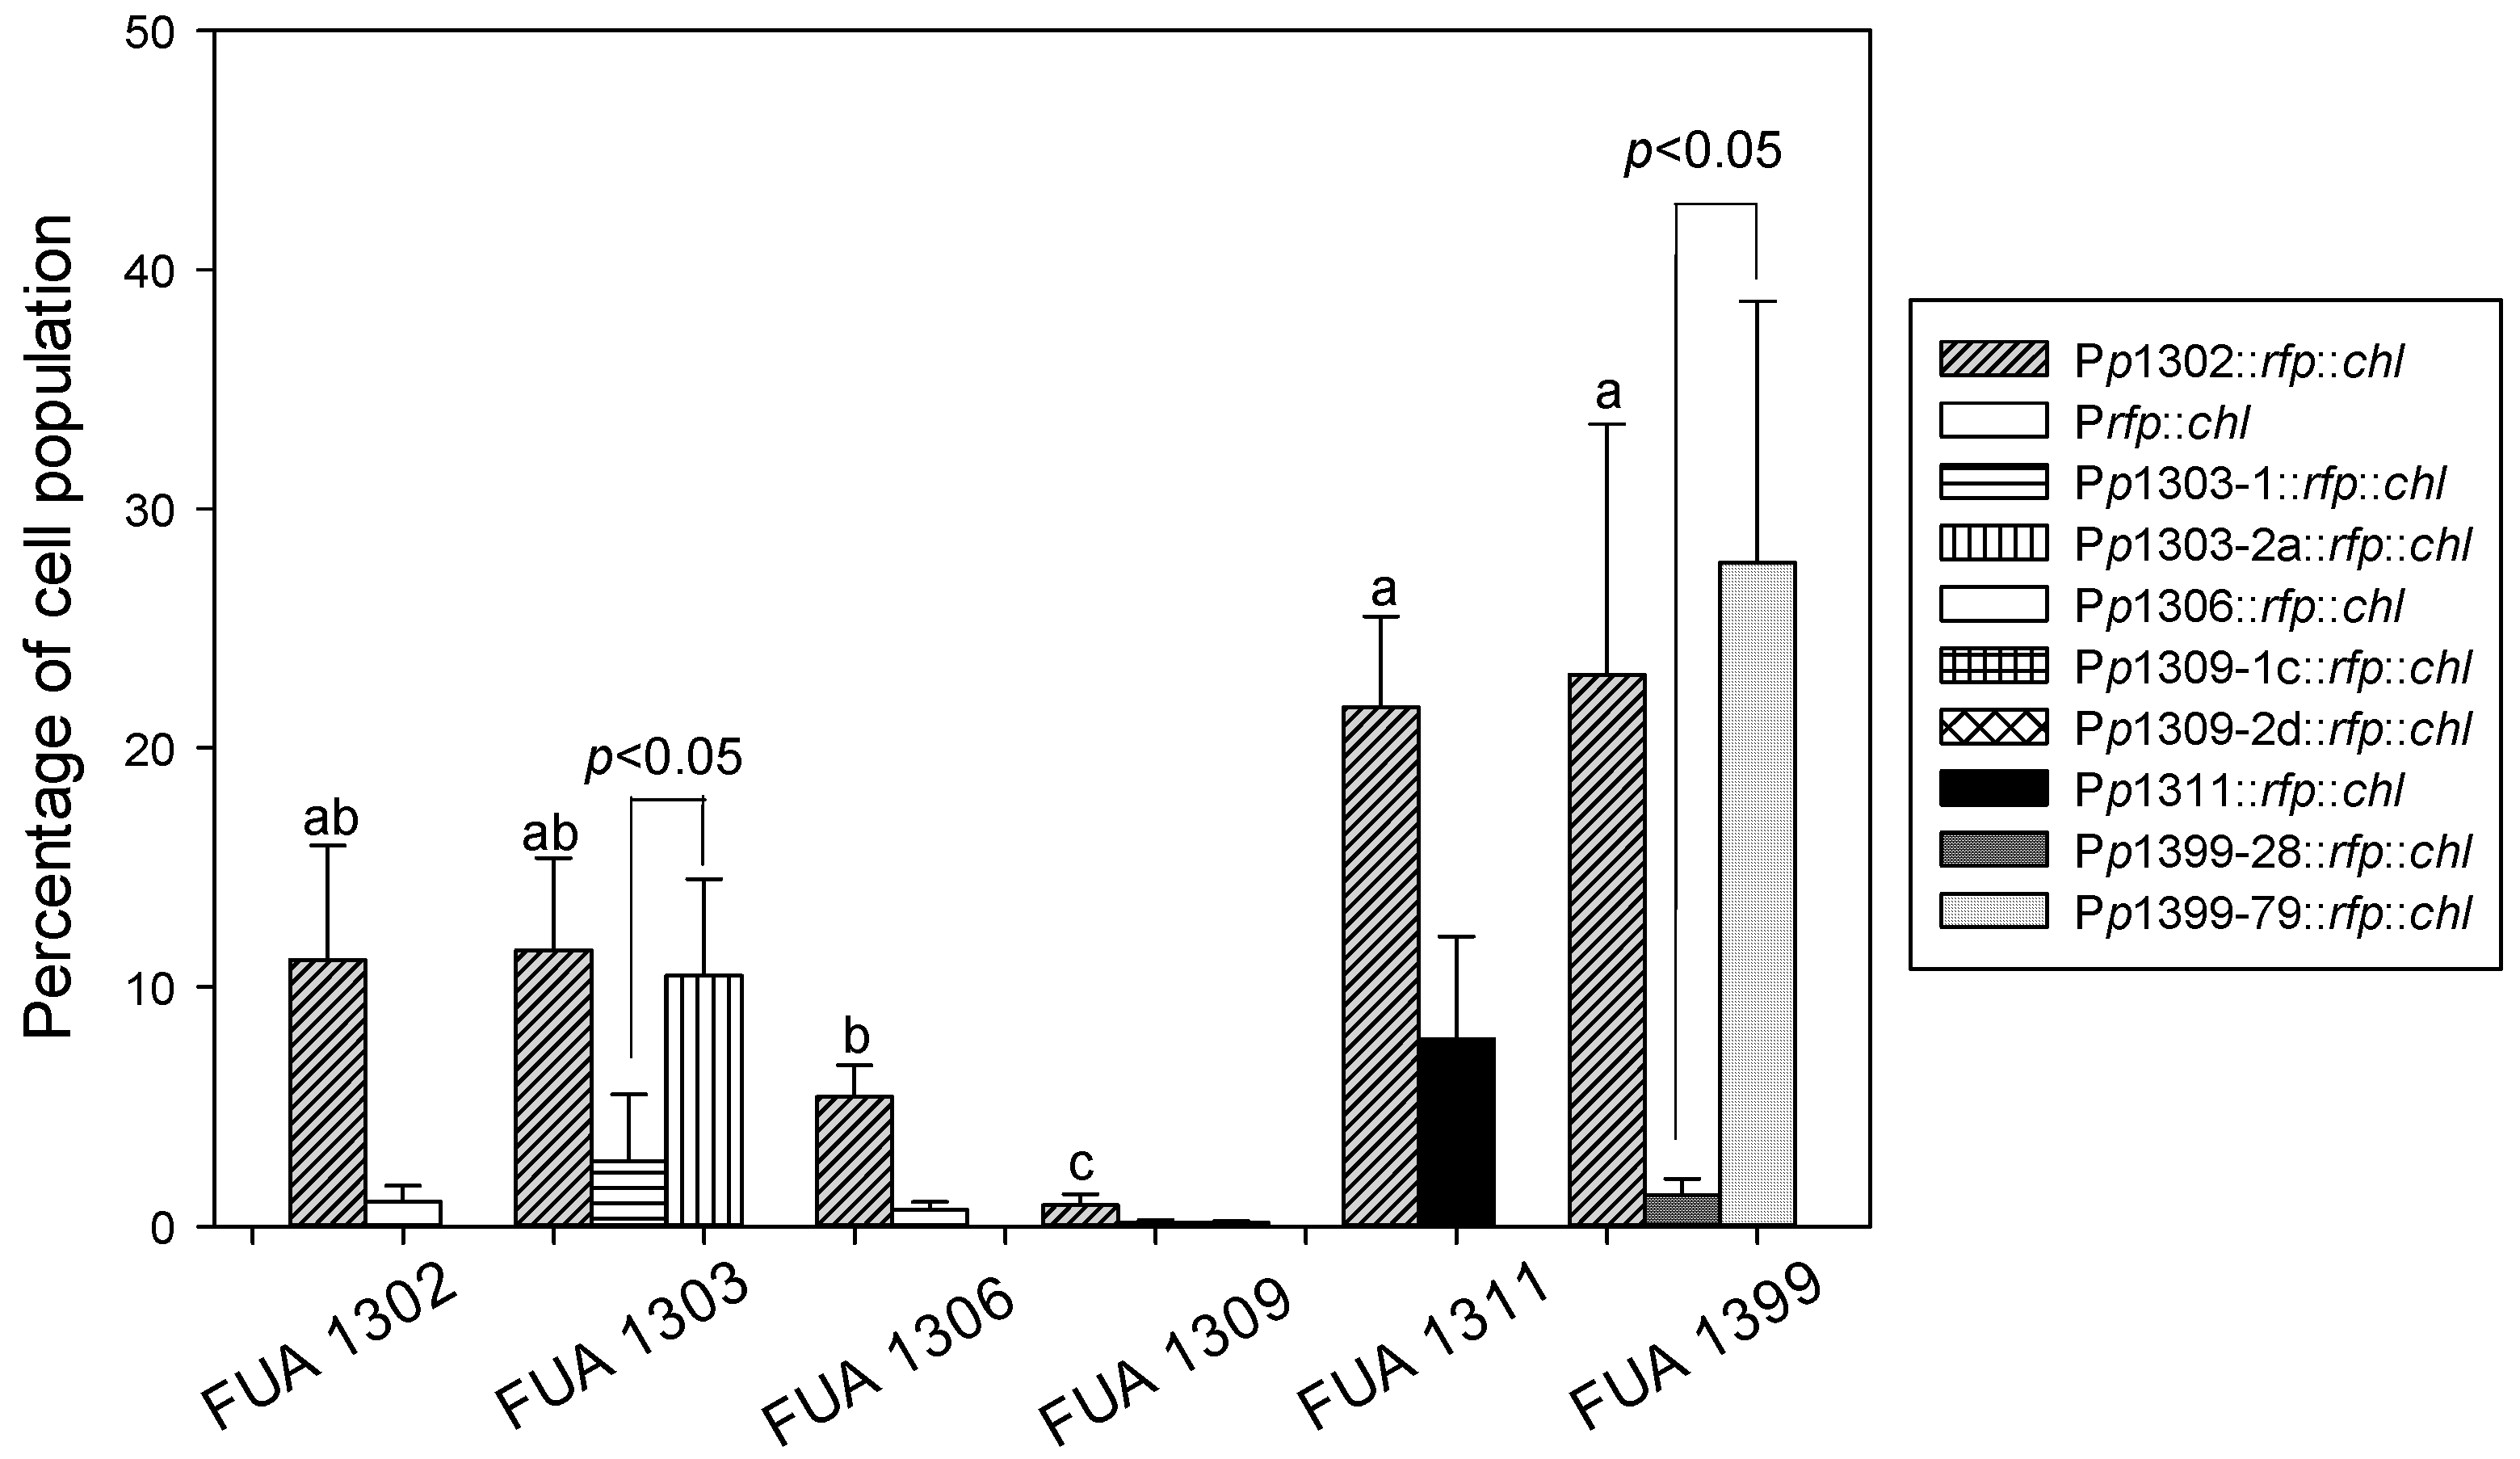
3.3. Detection of Stx Induction Levels in STEC Populations

Since stx is located in the late lytic region [42], Stx induction also induces the lytic cycle and eventually results in cell lysis, which obscures the detection of cells by flow cytometry. Thus, cultures were inactivated with heat 4.5 h after MMC induction, followed by incubated at 37 °C for 22.5 h. This protocol enabled the quantification of the proportion of cells expressing GFP or DsRed, or both, by flow cytometry (Figure 1).
To determine the impact of the diversity of the pR’ region, we selected 16 transformants that represented various combinations of the pR’ and regulatory regions, and measured the induction levels in the presence and absence of the MMC with flow cytometry. Initially, we measured the induction level in seven E. coli O104:H4 11-3088 Δstx::gfp::ampr (PpR’::rfp::chlr) transformants. Under the control of regulatory proteins of the E. coli O104:H4 11-3088 prophage, transformants carrying the constructs p1302::rfp::chlr, p1303-2a::rfp::chlr, p1399-28::rfp::chlr, and p1399-79::rfp::chlr showed higher DsRed expression; other transformants did not express DsRed (Figure 6A). GFP expression among the transformants was not different (Figure 6B) (p ≥ 0.05), indicating that expression of the chromosomal gfp was not influenced by the plasmid-encoded heterologous pR’ region.
To investigate the behavior of the pR’ region under the control of its parent prophage, we measured the induction level of eight transformants: E. coli FUA1303 (Pp1303-1::rfp::chlr), E. coli FUA1303 (Pp1303-2a::rfp::chlr), E. coli FUA1306 (Pp1306::rfp::chlr), E. coli FUA1309 (Pp1309-1c::rfp::chlr) and E. coli FUA1309 (Pp1309-2d::rfp::chlr), E. coli FUA1311 (Pp1311::rfp::chlr), E. coli FUA1399 (Pp1399-28::rfp::chlr), and E. coli FUA1399 (Pp1399-79::rfp::chlr) (Figure 7). To determine the induction behavior resulting from the combination of the same pR’ and different regulatory regions, we transformed p1302::rfp::chlr into six different strains (Figure 7). We examined the induction levels in E. coli FUA1303, E. coli FUA1309, and E. coli FUA1399, which carry two prophages in their chromosome. The percentage of RFP positives revealed that not all of the prophages can be induced by MMC: Pp1303-1::rfp::chlr and Pp1399-28::rfp::chlr were not induced; in E. coli FUA 1309, both Pp1309-1c::rfp::chlr and Pp1309-2d::rfp::chlr were uninduced. We also compared the induction level of the p1302::rfp::chlr in different STECs and found significant differences among the six transformants. The pR’ promoter region from 1302 was regulated differently by different strains, in E. coli FUA1303, E. coli FUA1311, and E. coli FUA1399, the induction level of Pp1302::rfp::chlr was comparable to its native strain; while in E. coli FUA 1309, the expression was lower (p ≤ 0.05). Additionally, the percentage of fluorescent cells in E. coli FUA1306 and E. coli FUA1311 with the heterologous promoter Pp1302::rfp::chlr was higher than the expression of the same protein under control of the homologous promoter in E. coli FUA1306 (Pp1306::rfp::chlr) and E. coli FUA1311 (Pp1311::rfp::chlr) (p ≤ 0.05). Finally, the induction levels among Pp1302::rfp::chlr, Pp1309-1c::rfp::chlr, and Pp1309-2d::rfp::chlr were not different when under the control of the prophages from E. coli FUA 1309 (p ≥ 0.05). Taken together, these data demonstrate that the sequence diversity of pR’ as well as prophage-encoded regulatory proteins resulted in a concomitant diversity of expression levels.

4. Discussion

STEC genomes have a high degree of sequence diversity [26,43,44,45] and different STECs differ in their virulence with disease symptoms ranging from mild diarrhea to hemolytic-uremic syndrome leading to death [44]. Sequence diversity in the early regulatory region directly affects stx expression and toxin production [46,47,48], and accounts for differences in virulence. The present study provides evidence that sequence diversity in the late promoter region also contributes to different Stx expression in STEC. As Stx prophages not only confer virulence to STEC, but also convert commensal E. coli to pathogens [49,50], differences in the expression of late phage genes likely results in different degrees of virulence of different strains.
Sequence analysis of the pR’ region revealed the presence of a great number of nucleotide differences. Of the two promoters upstream of stx, the distal promoter pR’ controls Stx production [20]. To investigate the genetic relationship between pR’ and stx, we conducted a phylogenetic analysis for these two sequences. The stx were highly conserved within the stx subtypes, whereas the pR’ regions, whose stx are from the same subtype, are distinct from each other (Figure 3). This is in agreement with previous studies where the late gene region of Shiga phages exhibits considerable genetic diversity [30,42] and the emergence of the STECs in E. coli cannot be predicted through the serotypes [51].
Induction efficiency is positively correlated to Stx production and pathogenicity [44,52,53]. To determine the effect of the diversity in the late promoter region on the behavior of STECs, we transformed pR’::rfp::chlr constructs with representative promoter sequence structures into different target strains and quantified gene expression with fluorescent reporter proteins. Bacterial behavior is commonly assessed in bulk [51,52]. To include the stochastic switching during detection [54], we employed flow cytometry to allow the efficient measurement at a single-cell level [33,34]. As one of the most commonly used inducers, MMC was chosen to induce cultures in this research. However, lambdoid phages show different induction efficiency in response to different induction agents [52]. Thus, it is possible that the efficiency of induction may change under the treatment of other induction agents.
The use of pR’ from seven different Stx prophages to control DsRed expression in E. coli O104:H4 11-3088 Δstx::gfp::ampr demonstrated that the sequence diversity of the pR’ region corresponded to different levels of gene expression. E. coli O157:H7 harboring stx2 under the control of Q21 rather than Q933 may exhibit a Stx2-negative phenotype [55]. The present study confirmed that prophage encoded regulatory proteins impact Stx expression as the same construct showed different expression levels in different strains. However, prophages in E. coli FUA1302 and E. coli FUA1311 both harbored the typical pR’ site [41] and the highly conserved Q933 [23]. Induction efficiencies of Pp1302::rfp::chlr and Pp1311::rfp::chlr were different under the control of the E. coli FUA1302 prophage. We thus propose that the Q and pR’ sites are not the only determinants of induction efficiency of the late transcript region; sequence diversity in the late promoter region pR’ [26] also regulates induction efficiency. Moreover, the similar GFP populations among samples indicates that the expression of the plasmid rfp did not interrupt the regulation of the chromosomal gfp.
A sequence of the pR’ site is related to high Stx production. We thus used this reported pR’ site as our reference to investigate our candidate pR’ sites. The reference pR’ site (accession number: AP000400) [41], which is related to high Stx production [27,40], was not found in the candidate prophages from E. coli FUA 1306, E. coli FUA 1309, and E. coli FUA 1399; and the constructs that do not have the pR’ site as the reference did not express DsRed after induction. Additionally, it seems that different types of pR’ sites randomly combine with different stx genotypes: Pp1399-28::rfp::chlr has the same stx2a as Pp1399-79::rfp::chlr, but different pR’ sites. Another finding is that the induction level of Pp1303-1::rfp::chlr, which harbors the same pR’ site as the reference sequence, did not increase significantly. Typically, strains with the reference pR’ site have a higher expression level; this phenotype might relate to the change of the binding ability of RNA polymerase to the prophage DNA and Q [56], and thus affect phage metabolism and physical behavior during lysis.
The presence of two more stx prophages was proposed to increase the pathogenicity of the STEC by changing the toxin expression [57]. However, other research has reported that lysogens with more than one phage produce less toxin [58]. In this study, E. coli FUA1399, prophages 1399-28 and 1399-79 carry the same stx2a, which is related to a high rate of HUS [59]. While Pp1399-79::rfp::chlr was highly induced, Pp1399-28::rfp::chlr was not induced. This indicates that expression of the Shiga toxin in a STEC is not determined by the number of Stx prophages, but by the expression levels that are controlled by the interaction of the regulatory Q protein(s) and the pR’ site.
Genetic exchange through phages generates genomic diversity and promotes the evolution of the host bacteria. Such gene transfer helps bacteria survive in the diverse environments in nature, but also gives the chance for bacteria to gain virulence determinants from pathogenic strains, thus generating new pathogens [3,7,45,60,61]. As a food-borne pathogen, E. coli gaining stx during evolution has a substantial impact on human health. Beef cattle are a main source of STEC transmission to humans, either directly through the meat supply or indirectly through contamination of water and plant foods [62,63]. Predatory protists are proposed to exert a selective pressure for maintenance of the Shiga-toxin prophage by commensal E. coli in ruminants [7]. It is tempting to speculate that the sequence diversity of Shiga-toxin prophages responds to the diversity of predatory protozoa in the gut microbiome of ruminants [64]. Understanding the link between genomic diversity of Stx prophages and Stx production may provide solutions to predict and prevent STEC contamination in ruminants and human STEC infections.

5. Conclusions

In this study, the phylogenetic relationship of the stx confirmed previous investigations that the sequence structure of stx is highly conserved. However, the phylogenetic analysis of the pR’ region revealed that this late promoter region was more heterogeneous. The combination of the fluorescent reporter fusion system and flow cytometric analysis confirmed that toxin expression could be observed at the single-cell level. Our data from the phylogenetic analysis and the determination of toxin expression levels of the pR’::rfp::chlr transformants indicated a correlation between the diversity of the late promoter pR’ region and the efficiency of toxin expression. These results may provide evidence that in addition to the diversity of the functional genes, the diversity of the late promoter region, pR’ region also contributes to the level of toxin expression.

Author Contributions

Conceptualization, M.G.G. and L.M.M.; Methodology, D.J.S.; Validation, L.X.Z.; Formal Analysis, L.X.Z.; Investigation, L.X.Z.; Resources, M.G.G. and L.M.M.; Writing—Original Draft Preparation, L.X.Z.; Writing—Review & Editing, D.J.S., M.G.G., and L.M.M.; Visualization, L.X.Z. and D.J.S.; Supervision, M.G.G. and L.M.M.; Project Administration, D.J.S.; Funding Acquisition, M.G.G. and L.M.M.

Funding

This research was funded by the Alberta Livestock and Meat Agency Ltd. (grant number 2014H018R).

Acknowledgments

We are grateful to Aja Rieger, University of Alberta, for providing training in the BD LSRFortessa™ X-20 Flow Cytometer System.

Conflicts of Interest

The authors declare no conflict of interest.

References

  1. Van Elsas, J.D.; Semenov, A.V.; Costa, R.; Trevors, J.T. Survival of Escherichia coli in the environment: Fundamental and public health aspects. ISME J. 2011, 5, 173–183. [Google Scholar] [CrossRef] [PubMed]
  2. Ochman, H.; Lawrence, J.G.; Groisman, E.A. Lateral gene transfer and the nature of bacterial innovation. Nature 2000, 405, 299–304. [Google Scholar] [CrossRef] [PubMed]
  3. Canchaya, C.; Fournous, G.; Chibani-Chennoufi, S.; Dillmann, M.-L.; Brüssow, H. Phage as agents of lateral gene transfer. Curr. Opin. Microbiol. 2003, 6, 417–424. [Google Scholar] [CrossRef]
  4. Blount, Z.D. The unexhausted potential of E. coli. eLife 2015, 4. [Google Scholar] [CrossRef] [PubMed]
  5. Fuhrman, J.A. Marine viruses and their biogeochemical and ecological effects. Nature 1999, 399, 541–548. [Google Scholar] [CrossRef] [PubMed]
  6. Erken, M.; Lutz, C.; McDougald, D. The rise of pathogens: predation as a factor driving the evolution of human pathogens in the environment. Microb. Ecol. 2013, 65, 860–868. [Google Scholar] [CrossRef] [PubMed]
  7. Łoś, J.M.; Łoś, M.; Węgrzyn, A.; Węgrzyn, G. Altruism of Shiga toxin-producing Escherichia coli: Recent hypothesis versus experimental results. Front. Cell. Infect. Microbiol. 2013, 2, 166. [Google Scholar] [CrossRef] [PubMed]
  8. Lee, M.-S.; Koo, S.; Jeong, D.; Tesh, V.; Lee, M.-S.; Koo, S.; Jeong, D.G.; Tesh, V.L. Shiga toxins as multi-functional proteins: Induction of host cellular stress responses, role in pathogenesis and therapeutic applications. Toxins 2016, 8, 77. [Google Scholar] [CrossRef] [PubMed]
  9. Karmali, M.A.; Petric, M.; Lim, C.; Fleming, P.C.; Arbus, G.S.; Lior, H. The association between idiopathic hemolytic uremic syndrome and infection by Verotoxin-producing Escherichia coli. J. Infect. Dis. 1985, 151, 775–782. [Google Scholar] [CrossRef] [PubMed]
  10. Kaper, J.B.; Nataro, J.P.; Mobley, H.L.T. Pathogenic Escherichia coli. Nat. Rev. Microbiol. 2004, 2, 123–140. [Google Scholar] [CrossRef] [PubMed]
  11. Beutin, L.; Hammerl, J.A.; Strauch, E.; Reetz, J.; Dieckmann, R.; Kelner-Burgos, Y.; Martin, A.; Miko, A.; Strockbine, N.A.; Lindstedt, B.A.; et al. Spread of a distinct Stx2-encoding phage prototype among Escherichia coli O104:H4 strains from outbreaks in Germany, Norway, and Georgia. J. Virol. 2012, 86, 10444–10455. [Google Scholar] [CrossRef] [PubMed]
  12. Karch, H.; Denamur, E.; Dobrindt, U.; Finlay, B.B.; Hengge, R.; Johannes, L.; Ron, E.Z.; Tønjum, T.; Sansonetti, P.J.; Vicente, M. The enemy within us: Lessons from the 2011 European Escherichia coli O104:H4 outbreak. EMBO Mol. Med. 2012, 4, 841–848. [Google Scholar] [CrossRef] [PubMed]
  13. Bielaszewska, M.; Mellmann, A.; Zhang, W.; Köck, R.; Fruth, A.; Bauwens, A.; Peters, G.; Karch, H. Characterisation of the Escherichia coli strain associated with an outbreak of haemolytic uraemic syndrome in Germany, 2011: A microbiological study. Lancet Infect. Dis. 2011, 11, 671–676. [Google Scholar] [CrossRef]
  14. Steyert, S.R.; Sahl, J.W.; Fraser, C.M.; Teel, L.D.; Scheutz, F.; Rasko, D.A. Comparative genomics and stx phage characterization of LEE-negative Shiga toxin-producing Escherichia coli. Front. Cell. Infect. Microbiol. 2012, 2, 133. [Google Scholar] [CrossRef] [PubMed]
  15. Croxen, M.A.; Law, R.J.; Scholz, R.; Keeney, K.M.; Wlodarska, M.; Finlay, B.B. Recent advances in understanding enteric pathogenic Escherichia coli. Clin. Microbiol. Rev. 2013, 26, 822–880. [Google Scholar] [CrossRef] [PubMed]
  16. Endo, Y.; Tsurugi, K.; Yutsudo, T.; Takeda, Y.; Ogasawara, T.; Igarashi, K. Site of action of a Vero toxin (VT2) from Escherichia coli O157:H7 and of Shiga toxin on eukaryotic ribosomes. RNA N-glycosidase activity of the toxins. Eur. J. Biochem. 1988, 171, 45–50. [Google Scholar] [CrossRef] [PubMed]
  17. Saxena, S.K.; O’Brien, A.D.; Ackerman, E.J. Shiga toxin, Shiga-like toxin II variant, and ricin are all single-site RNA N-glycosidases of 28 S RNA when microinjected into Xenopus oocytes. J. Biol. Chem. 1989, 264, 596–601. [Google Scholar] [PubMed]
  18. Tesh, V.L. Induction of apoptosis by Shiga toxins. Futur. Microbiol. 2010, 5, 431–453. [Google Scholar] [CrossRef] [PubMed] [Green Version]
  19. Fuller, C.A.; Pellino, C.A.; Flagler, M.J.; Strasser, J.E.; Weiss, A.A. Shiga toxin subtypes display dramatic differences in potency. Infect. Immun. 2011, 79, 1329–1337. [Google Scholar] [CrossRef] [PubMed]
  20. Wagner, P.L.; Neely, M.N.; Zhang, X.; Acheson, D.W.K.; Waldor, M.K.; Friedman, D.I.; Acheson, W.K.; Waldor, M.K.; Friedman, D.I.; Acheson, D.W.K. Role for a phage promoter in Shiga toxin 2 expression from a pathogenic Escherichia coli strain. J. Bacteriol. 2001, 183, 2081–2085. [Google Scholar] [CrossRef] [PubMed]
  21. Yarnell, W.S.; Roberts, J.W. The phage λ gene Q transcription antiterminator binds DNA in the late gene promoter as it modifies RNA polymerase. Cell 1992, 69, 1181–1189. [Google Scholar] [CrossRef]
  22. Neely, M.N.; Friedman, D.I. Functional and genetic analysis of regulatory regions of coliphage H-19B: Location of shiga-like toxin and lysis genes suggest a role for phage functions in toxin release. Mol. Microbiol. 1998, 28, 1255–1267. [Google Scholar] [CrossRef] [PubMed]
  23. Plunkett, G.; Rose, D.J.; Durfee, T.J.; Blattner, F.R. Sequence of Shiga toxin 2 phage 933W from Escherichia coli O157:H7: Shiga toxin as a phage late-gene product. J. Bacteriol. 1999, 181, 1767–1778. [Google Scholar] [PubMed]
  24. Haugum, K.; Lindstedt, B.-A.; Løbersli, I.; Kapperud, G.; Brandal, L.T. Identification of the anti-terminator qO111:H− gene in Norwegian sorbitol-fermenting Escherichia coli O157:NM. FEMS Microbiol. Lett. 2012, 329, 102–110. [Google Scholar] [CrossRef] [PubMed]
  25. Lejeune, J.T.; Abedon, S.T.; Takemura, K.; Christie, N.P.; Sreevatsan, S. Human Escherichia coli O157:H7 genetic marker in isolates of bovine origin. Emerg. Infect. Dis. 2004, 10, 1482–1485. [Google Scholar] [CrossRef] [PubMed]
  26. Olavesen, K.K.; Lindstedt, B.-A.; Løbersli, I.; Brandal, L.T. Expression of Shiga toxin 2 (Stx2) in highly virulent Stx-producing Escherichia coli (STEC) carrying different anti-terminator (q) genes. Microb. Pathog. 2016, 97, 1–8. [Google Scholar] [CrossRef] [PubMed]
  27. Ogura, Y.; Mondal, S.I.; Islam, M.R.; Mako, T.; Arisawa, K.; Katsura, K.; Ooka, T.; Gotoh, Y.; Murase, K.; Ohnishi, M.; et al. The Shiga toxin 2 production level in enterohemorrhagic Escherichia coli O157:H7 is correlated with the subtypes of toxin-encoding phage. Sci. Rep. 2015, 5, 16663. [Google Scholar] [CrossRef] [PubMed]
  28. Krüger, A.; Lucchesi, P.M.A. Shiga toxins and stx phages: Highly diverse entities. Microbiology 2015, 161, 451–462. [Google Scholar] [CrossRef] [PubMed]
  29. Yin, S.; Rusconi, B.; Sanjar, F.; Goswami, K.; Xiaoli, L.; Eppinger, M.; Dudley, E.G. Escherichia coli O157:H7 strains harbor at least three distinct sequence types of Shiga toxin 2a-converting phages. BMC Genom. 2015, 16, 733. [Google Scholar] [CrossRef] [PubMed]
  30. Smith, D.L.; Rooks, D.J.; Fogg, P.C.M.; Darby, A.C.; Thomson, N.R.; McCarthy, A.J.; Allison, H.E. Comparative genomics of Shiga toxin encoding bacteriophages. BMC Genom. 2012, 13, 311. [Google Scholar] [CrossRef] [PubMed]
  31. Livny, J.; Friedman, D.I. Characterizing spontaneous induction of Stx encoding phages using a selectable reporter system. Mol. Microbiol. 2004, 51, 1691–1704. [Google Scholar] [CrossRef] [PubMed] [Green Version]
  32. Mercer, R.G.; Zheng, J.; Garcia-Hernandez, R.; Ruan, L.; Gänzle, M.G.; McMullen, L.M.; Allard, M.W.; Gänzle, M.G.; McMullen, L.M. Genetic determinants of heat resistance in Escherichia coli. Front. Microbiol. 2015, 6, 1–13. [Google Scholar] [CrossRef] [PubMed]
  33. Shapiro, H.M. Microbial analysis at the single-cell level: Tasks and techniques. J. Microbiol. Methods 2000, 42, 3–16. [Google Scholar] [CrossRef]
  34. Fang, Y.; Mercer, R.G.; McMullen, L.M.; Gänzle, M.G. Induction of Shiga toxin-encoding prophage by abiotic environmental stress in food. Appl. Environ. Microbiol. 2017, 83, 1–13. [Google Scholar] [CrossRef] [PubMed]
  35. Edgar, R.C. MUSCLE: Multiple sequence alignment with high accuracy and high throughput. Nucleic Acids Res. 2004, 32, 1792–1797. [Google Scholar] [CrossRef] [PubMed]
  36. Datsenko, K.A.; Wanner, B.L. One-step inactivation of chromosomal genes in Escherichia coli K-12 using PCR products. Proc. Natl. Acad. Sci. USA 2000, 97, 6640–6645. [Google Scholar] [CrossRef] [PubMed]
  37. Liu, Y.; Gill, A.; McmMullen, L.; Gänzle, M.G. Variation in heat and pressure resistance of Verotoxigenic and nontoxigenic Escherichia coli. J. Food Prot. 2015, 78, 111–120. [Google Scholar] [CrossRef] [PubMed]
  38. Smith, D.L.; Wareing, B.M.; Fogg, P.C.M.M.; Riley, L.M.; Spencer, M.; Cox, M.J.; Saunders, J.R.; McCarthy, A.J.; Allison, H.E. Multilocus characterization scheme for Shiga toxin-encoding bacteriophages. Appl. Environ. Microbiol. 2007, 73. [Google Scholar] [CrossRef] [PubMed]
  39. Casjens, S.R.; Hendrix, R.W. Bacteriophage lambda: Early pioneer and still relevant. Virology 2015, 479–480, 310–330. [Google Scholar] [CrossRef] [PubMed]
  40. Manning, S.D.; Motiwala, A.S.; Springman, A.C.; Qi, W.; Lacher, D.W.; Ouellette, L.M.; Mladonicky, J.M.; Somsel, P.; Rudrik, J.T.; Dietrich, S.E.; et al. Variation in virulence among clades of Escherichia coli O157:H7 associated with disease outbreaks. Proc. Natl. Acad. Sci. USA 2008, 105, 4868–4873. [Google Scholar] [CrossRef] [PubMed]
  41. Yokoyama, K.; Makino, K.; Kubota, Y.; Watanabe, M.; Kimura, S.; Yutsudo, C.H.; Kurokawa, K.; Ishii, K.; Hattori, M.; Tatsuno, I.; et al. Complete nucleotide sequence of the prophage VT1-Sakai carrying the Shiga toxin 1 genes of the enterohemorrhagic Escherichia coli O157:H7 strain derived from the Sakai outbreak. Gene 2000, 258, 127–139. [Google Scholar] [CrossRef]
  42. Wegrzyn, G.; Licznerska, K.; Wegrzyn, A. Phage λ-New Insights into Regulatory Circuits. Adv. Virus Res. 2012, 82, 155–178. [Google Scholar] [CrossRef] [PubMed]
  43. Ohnishi, M.; Terajima, J.; Kurokawa, K.; Nakayama, K.; Murata, T.; Tamura, K.; Ogura, Y.; Watanabe, H.; Hayashi, T. Genomic diversity of enterohemorrhagic Escherichia coli O157 revealed by whole genome PCR scanning. Proc. Natl. Acad. Sci. USA 2002, 99, 17043–17048. [Google Scholar] [CrossRef] [PubMed]
  44. Muniesa, M.; Blanco, J.E.; de Simón, M.; Serra-Moreno, R.; Blanch, A.R.; Jofre, J. Diversity of stx2 converting bacteriophages induced from Shiga-toxin-producing Escherichia coli strains isolated from cattle. Microbiology 2004, 150, 2959–2971. [Google Scholar] [CrossRef] [PubMed]
  45. Boyd, E.F.; Brüssow, H. Common themes among bacteriophage-encoded virulence factors and diversity among the bacteriophages involved. Trends Microbiol. 2002, 10, 521–529. [Google Scholar] [CrossRef]
  46. Miyamoto, H.; Nakai, W.; Yajima, N.; Fujibayashi, A.; Higuchi, T.; Sato, K.; Matsushiro, A. Sequence analysis of Stx2-converting phage VT2-Sa shows a great divergence in early regulation and replication regions. DNA Res. 1999, 6, 235–240. [Google Scholar] [CrossRef] [PubMed]
  47. Wagner, P.L.; Acheson, D.W.; Waldor, M.K. Isogenic lysogens of diverse shiga toxin 2-encoding bacteriophages produce markedly different amounts of shiga toxin. Infect. Immun. 1999, 67, 6710–6714. [Google Scholar] [PubMed]
  48. Tyler, J.S.; Mills, M.J.; Friedman, D.I. The operator and early promoter region of the Shiga toxin type 2-encoding bacteriophage 933W and control of toxin expression. J. Bacteriol. 2004, 186. [Google Scholar] [CrossRef] [PubMed]
  49. Muniesa, M.; de Simon, M.; Prats, G.; Ferrer, D.; Pañella, H.; Jofre, J. Shiga toxin 2-converting bacteriophages associated with clonal variability in Escherichia coli O157:H7 strains of human origin isolated from a single outbreak. Infect. Immun. 2003, 71, 4554–4562. [Google Scholar] [CrossRef] [PubMed]
  50. Phage, T.; Gamage, S.D.; Patton, A.K.; Hanson, J.F.; Weiss, A.A. Diversity and host range of Shiga diversity and host range of Shiga toxin-encoding phage. Society 2004, 72, 7131–7139. [Google Scholar] [CrossRef]
  51. Hao, W.; Allen, V.G.; Jamieson, F.B.; Low, D.E.; Alexander, D.C. Phylogenetic incongruence in E. coli O104: understanding the evolutionary relationships of emerging pathogens in the face of homologous recombination. PLoS ONE 2012, 7, e33971. [Google Scholar] [CrossRef] [PubMed]
  52. Łoś, J.M.; Łoś, M.; Węgrzyn, G.; Węgrzyn, A.; Joanna, M.; Alicja, W.; Łoś, J.M.; Łoś, M.; Węgrzyn, G.; Węgrzyn, A. Differential efficiency of induction of various lambdoid prophages responsible for production of Shiga toxins in response to different induction agents. Microb. Pathog. 2009, 47, 289–298. [Google Scholar] [CrossRef] [PubMed]
  53. Shimizu, T.; Ohta, Y.; Tsutsuki, H.; Noda, M. Construction of a novel bioluminescent reporter system for investigating Shiga toxin expression of enterohemorrhagic Escherichia coli. Gene 2011, 478, 1–10. [Google Scholar] [CrossRef] [PubMed]
  54. King, O.D.; Masel, J. The evolution of bet-hedging adaptations to rare scenarios. Theor. Popul. Biol. 2007, 72, 560–575. [Google Scholar] [CrossRef] [PubMed] [Green Version]
  55. Koitabashi, T.; Vuddhakul, V.; Radu, S.; Morigaki, T.; Asai, N.; Nakaguchi, Y.; Nishibuchi, M. Genetic characterization of Escherichia coli O157:H7/- strains carrying the stx2 gene but not producing Shiga toxin 2. Microbiol. Immunol. 2006, 50, 135–148. [Google Scholar] [CrossRef] [PubMed]
  56. Vorobiev, S.M.; Gensler, Y.; Vahedian-Movahed, H.; Seetharaman, J.; Su, M.; Huang, J.Y.; Xiao, R.; Kornhaber, G.; Montelione, G.T.; Tong, L.; et al. Structure of the DNA-binding and RNA-polymerase-binding region of transcription antitermination factor λQ. Structure 2014, 22, 488–495. [Google Scholar] [CrossRef] [PubMed]
  57. Fogg, P.C.M.; Saunders, J.R.; McCarthy, A.J.; Allison, H.E. Cumulative effect of prophage burden on Shiga toxin production in Escherichia coli. Microbiology 2012, 158, 488–497. [Google Scholar] [CrossRef] [PubMed]
  58. Krüger, A.; Lucchesi, P.M.A.; Parma, A.E. Verotoxins in bovine and meat verotoxin-producing Escherichia coli isolates: Type, number of variants, and relationship to cytotoxicity. Appl. Environ. Microbiol. 2011, 77, 73–79. [Google Scholar] [CrossRef] [PubMed]
  59. Eppinger, M.; Mammel, M.K.; Leclerc, J.E.; Ravel, J.; Cebula, T.A. Genomic anatomy of Escherichia coli O157:H7 outbreaks. Proc. Natl. Acad. Sci. USA 2011, 108, 20142–20147. [Google Scholar] [CrossRef] [PubMed]
  60. O’Brien, A.D.; Newland, J.W.; Miller, S.F.; Holmes, R.K.; Smith, H.W.; Formal, S.B. Shiga-like toxin-converting phages from Escherichia coli strains that cause hemorrhagic colitis or infantile diarrhea. Science 1984, 226, 694–696. [Google Scholar] [CrossRef]
  61. Chang, D.-E.; Smalley, D.J.; Tucker, D.L.; Leatham, M.P.; Norris, W.E.; Stevenson, S.J.; Anderson, A.B.; Grissom, J.E.; Laux, D.C.; Cohen, P.S.; et al. Carbon nutrition of Escherichia coli in the mouse intestine. Proc. Natl. Acad. Sci. USA 2004, 101, 7427–7432. [Google Scholar] [CrossRef] [PubMed]
  62. Yatsuyanagi, J.; Saito, S.; Ito, I. A case of hemolytic-uremic syndrome associated with shiga toxin 2-producing Escherichia coli O121 infection caused by drinking water contaminated with bovine feces. Jpn. J. Infect. Dis. 2002, 55, 174–176. [Google Scholar] [PubMed]
  63. Eurosurveillance editorial team. The European Union summary report on trends and sources of zoonoses, zoonotic agents and food-borne outbreaks in 2011 has been published. Eurosurveillance 2013, 18, 20449. [Google Scholar] [CrossRef]
  64. Newbold, C.J.; de la Fuente, G.; Belanche, A.; Ramos-Morales, E.; McEwan, N.R. The role of ciliate protozoa in the rumen. Front. Microbiol. 2015, 6, 1313. [Google Scholar] [CrossRef] [PubMed]
Figure 1. The gating strategy of E. coli O104:H4 11-3088 Δstx::gfp::ampr (p1302::rfp::chlr) with or without MMC induction. (A) Dot plot of the negative control without MMC induction. (B) Dot plot of the sample induced with MMC for 4.5 h. Gating as represented by reference lines divided cell populations based on the fluorescent signal: Q1, RFP+, GFP; Q2, RFP+, GFP+; Q3, RFP, GFP+; Q4, RFP, and GFP. The gating was set to include 99.5% of the cells of the negative control.
Viruses 10 00595 g001
Figure 2. Phylogenetic tree analysis of the stx gene sequences and the DNA sequence of the corresponding pR’ fragments. The phylogenetic tree was based on 26 sequences from 17 STEC strains (Table 1). Neighbor-Joining trees were generated in Geneious using the Tamura–Nei model. The reliabilities of the internal branches were assessed using bootstrapping with 1000 pseudo-replicates. The scale bars represent the number of the substitution per site. Bootstrap values over 70% are displayed. Shigella dysenteriea type 1 strain Sd197 was included as the outgroup. Strains that had significant phylogenetic differences between the pR’ region and stx gene are highlighted by dots and were used in downstream studies. (A) Phylogenetic tree generated by comparing the stx genes, which included both subunit A and B. (B) Phylogenetic tree generated by aligning the pR’ region located between Q and stx.
Viruses 10 00595 g002
Figure 3. The sequence comparison of the pR’ regions. The toxin subtypes and the name of their host strains are listed on the left. Consensus is shown on top. Sequence identities are colored in green, yellow, and red, which indicate that the residue at that position is the same across all sequences, less than complete identity and very low identity, respectively. The schematic stx genes were annotated behind the pR’ regions. The sequences that did not have the same pR’ site as the reference are shaded. The figure is provided in high resolution for large scale printing or viewing.
Viruses 10 00595 g003
Figure 4. Scheme representing the construction of PpR’::rfp::chlr reporter plasmids. Arrows with direction indicate the transcription orientation. The black arrow represents the pR’ region; dark gray is the rfp fragment; light gray is the chloramphenicol resistance gene. Dashed lines indicate restriction sites; note that p1402 used restriction enzymes SmaI/XbaI, since the sequence of p1402 contains the restriction site KpnI. The fragment of the pR’ region and rfp were transformed into pUC19 vector, followed by a chlr fragment for positive screening.
Viruses 10 00595 g004
Figure 5. Microscopic observation of strains of E. coli expressing GFP or DsRed under control of Shiga-toxin promotors after MMC induction. Cells were visualized at 400× magnification by light microscopy or fluorescence microscopy as indicated. Shown from left to right are E. coli O104:H4 11-3088 Δstx::gfp::ampr (negative control for DsRed expression); E. coli O104:H4 11-3088 Δstx::gfp::ampr (Pp1302::rfp::chlr), and E. coli O157:H7 CO6CE900 (Pp1302::rfp::chlr) (negative control for GFP expression). MMC induction was performed 4.5 h before microscopy observation.
Viruses 10 00595 g005
Figure 6. Expression of GFP and DsRed by E. coli O104:H4 11-3088 Δstx::gfp::ampr (PpR’::rfp::chlr) transformants after MMC induction. (A) Percentage of the population expressing plasmid-encoded DsRed under control of the plasmid-encoded promotor indicated. The promotorless plasmid Prfp::chlr served as the negative control. (B) Percentage of the population expressing the chromosomal gene coding for GFP under control of the native promotor. The percentage of the red or green fluorescent cell population was determined by flow cytometric analysis and is shown as mean ± standard deviations of quadruplicate independent experiments. Bars that do not share a common letter are significantly different (p ≤ 0.05).
Viruses 10 00595 g006
Figure 7. Percentage of the population of strains of E. coli expressing DsRed under the control of different Shiga-toxin regulatory sequences. To determine the effect of the native regulator to the pR’ region, the pR’::rfp::chlr constructs were cloned from the target strains and transformed back into their parent strains. To determine whether the same pR’ region was differentially expressed in different strains, the construct p1302::rfp::chlr was transformed into all target strains and its parent strain E. coli FUA1302 O104:H4. Transformants were induced with MMC. Bars are grouped by the six target strains, the bars represent different pR’ constructs shown in the figure legend. Bars with the same pattern that do not share a common letter differed significantly. The percentage of fluorescent cells are shown as mean ± standard deviations of quadruplicate independent experiments (p ≤ 0.05).
Viruses 10 00595 g007
Table 1. Strains and plasmids used in this study.
Accession NumbersStrains and SerotypeFUA Number Used for Plasmid NomenclatureDescriptionRef.
LDYN00000000E. coli O26:H11 05-65441308stx1[32]
LDZZ00000000E. coli O121:H19 03-28321312stx2a[32]
LEAA00000000E. coli O121:NM 03-40641313stx2a[32]
LEAB00000000E. coli O145:NM 03-64301307stx1[32]
LEAD00000000E. coli O157:H7 19351303stx1 stx2a[32]
LEAE00000000E. coli O157:H7 CO6CE9001399stx2a[32]
LEAF00000000E. coli O157:H7 CO6CE13531401stx1 stx2a[32]
LEAG00000000E. coli O157:H7 CO6CE19431398stx1 stx2a[32]
LEAH00000000E. coli O157:H7 CO6CE29401400stx2a[32]
LEAI00000000E. coli O157:H7 CO2831305stx1 stx2a[32]
LEAJ00000000E. coli O157:H7 E01221306stx2a[32]
LECF00000000E. coli O103:H25 3381402stx1[32]
LECH00000000E. coli O104:H4 11-30881302stx2a[32]
LECI00000000E. coli O111:NM 5831403stx1[32]
LECJ00000000E. coli O111:NM PARC4471316stx1 stx2[32]
LECK00000000E. coli O113:H4 09-05251309stx1c stx2d[32]
LECM00000000E. coli O45:H2 05-65451311stx1[32]
LECN00000000E. coli O76:H19 09-05231310stx1c stx2d[32]
E. coli DH5α
E. coli Top10 pUC19
E. coli Top10 pRFP
E. coli O104:H4 11-3088 Δstx::gfp::amp stx gene replaced with gfp[34]
Table 2. Primers used for obtaining pR’ and rfp fragments.
PrimerSequence (5′-3′) a)Restriction Site
LP F1-15′-CGGGAAGGTACCACCTCTGTATTTTATCAG-3′KpnI
LP R1-35′-GGGCCGTCTAGAAAAGAAAAAAGTTAGCAC-3′XbaI
LP F2-25′-ATTAGTCCCGGGCTTGGATTTATTGATGGT-3′SmaI
LP R3-25′-ATAACGTCTAGATAACAGGCACAGTACCCA-3′XbaI
LP F3-25′-AGCGGTACCAAAAACCGGAAACGTGTA-3′KpnI
LP F4-15′-TGCGTAGGTACCAGCGTCTATAATTGTATG-3′KpnI
LP R4-25′-GCATTATCTAGACAACAGGCACAGTATCCA-3′XbaI
RFP F-25′-CTGATATCTAGAATGGCCTCCTCCGAG-3′XbaI
RFP R-55′-ATCTGTAAGCTTCTACAGGAACAGGTGGT-3′HindIII
a) Restriction enzyme sites are underlined.

