
Early Humoral Response Correlates with Disease Severity and Outcomes in COVID-19 Patients

 , , , , , , , , and
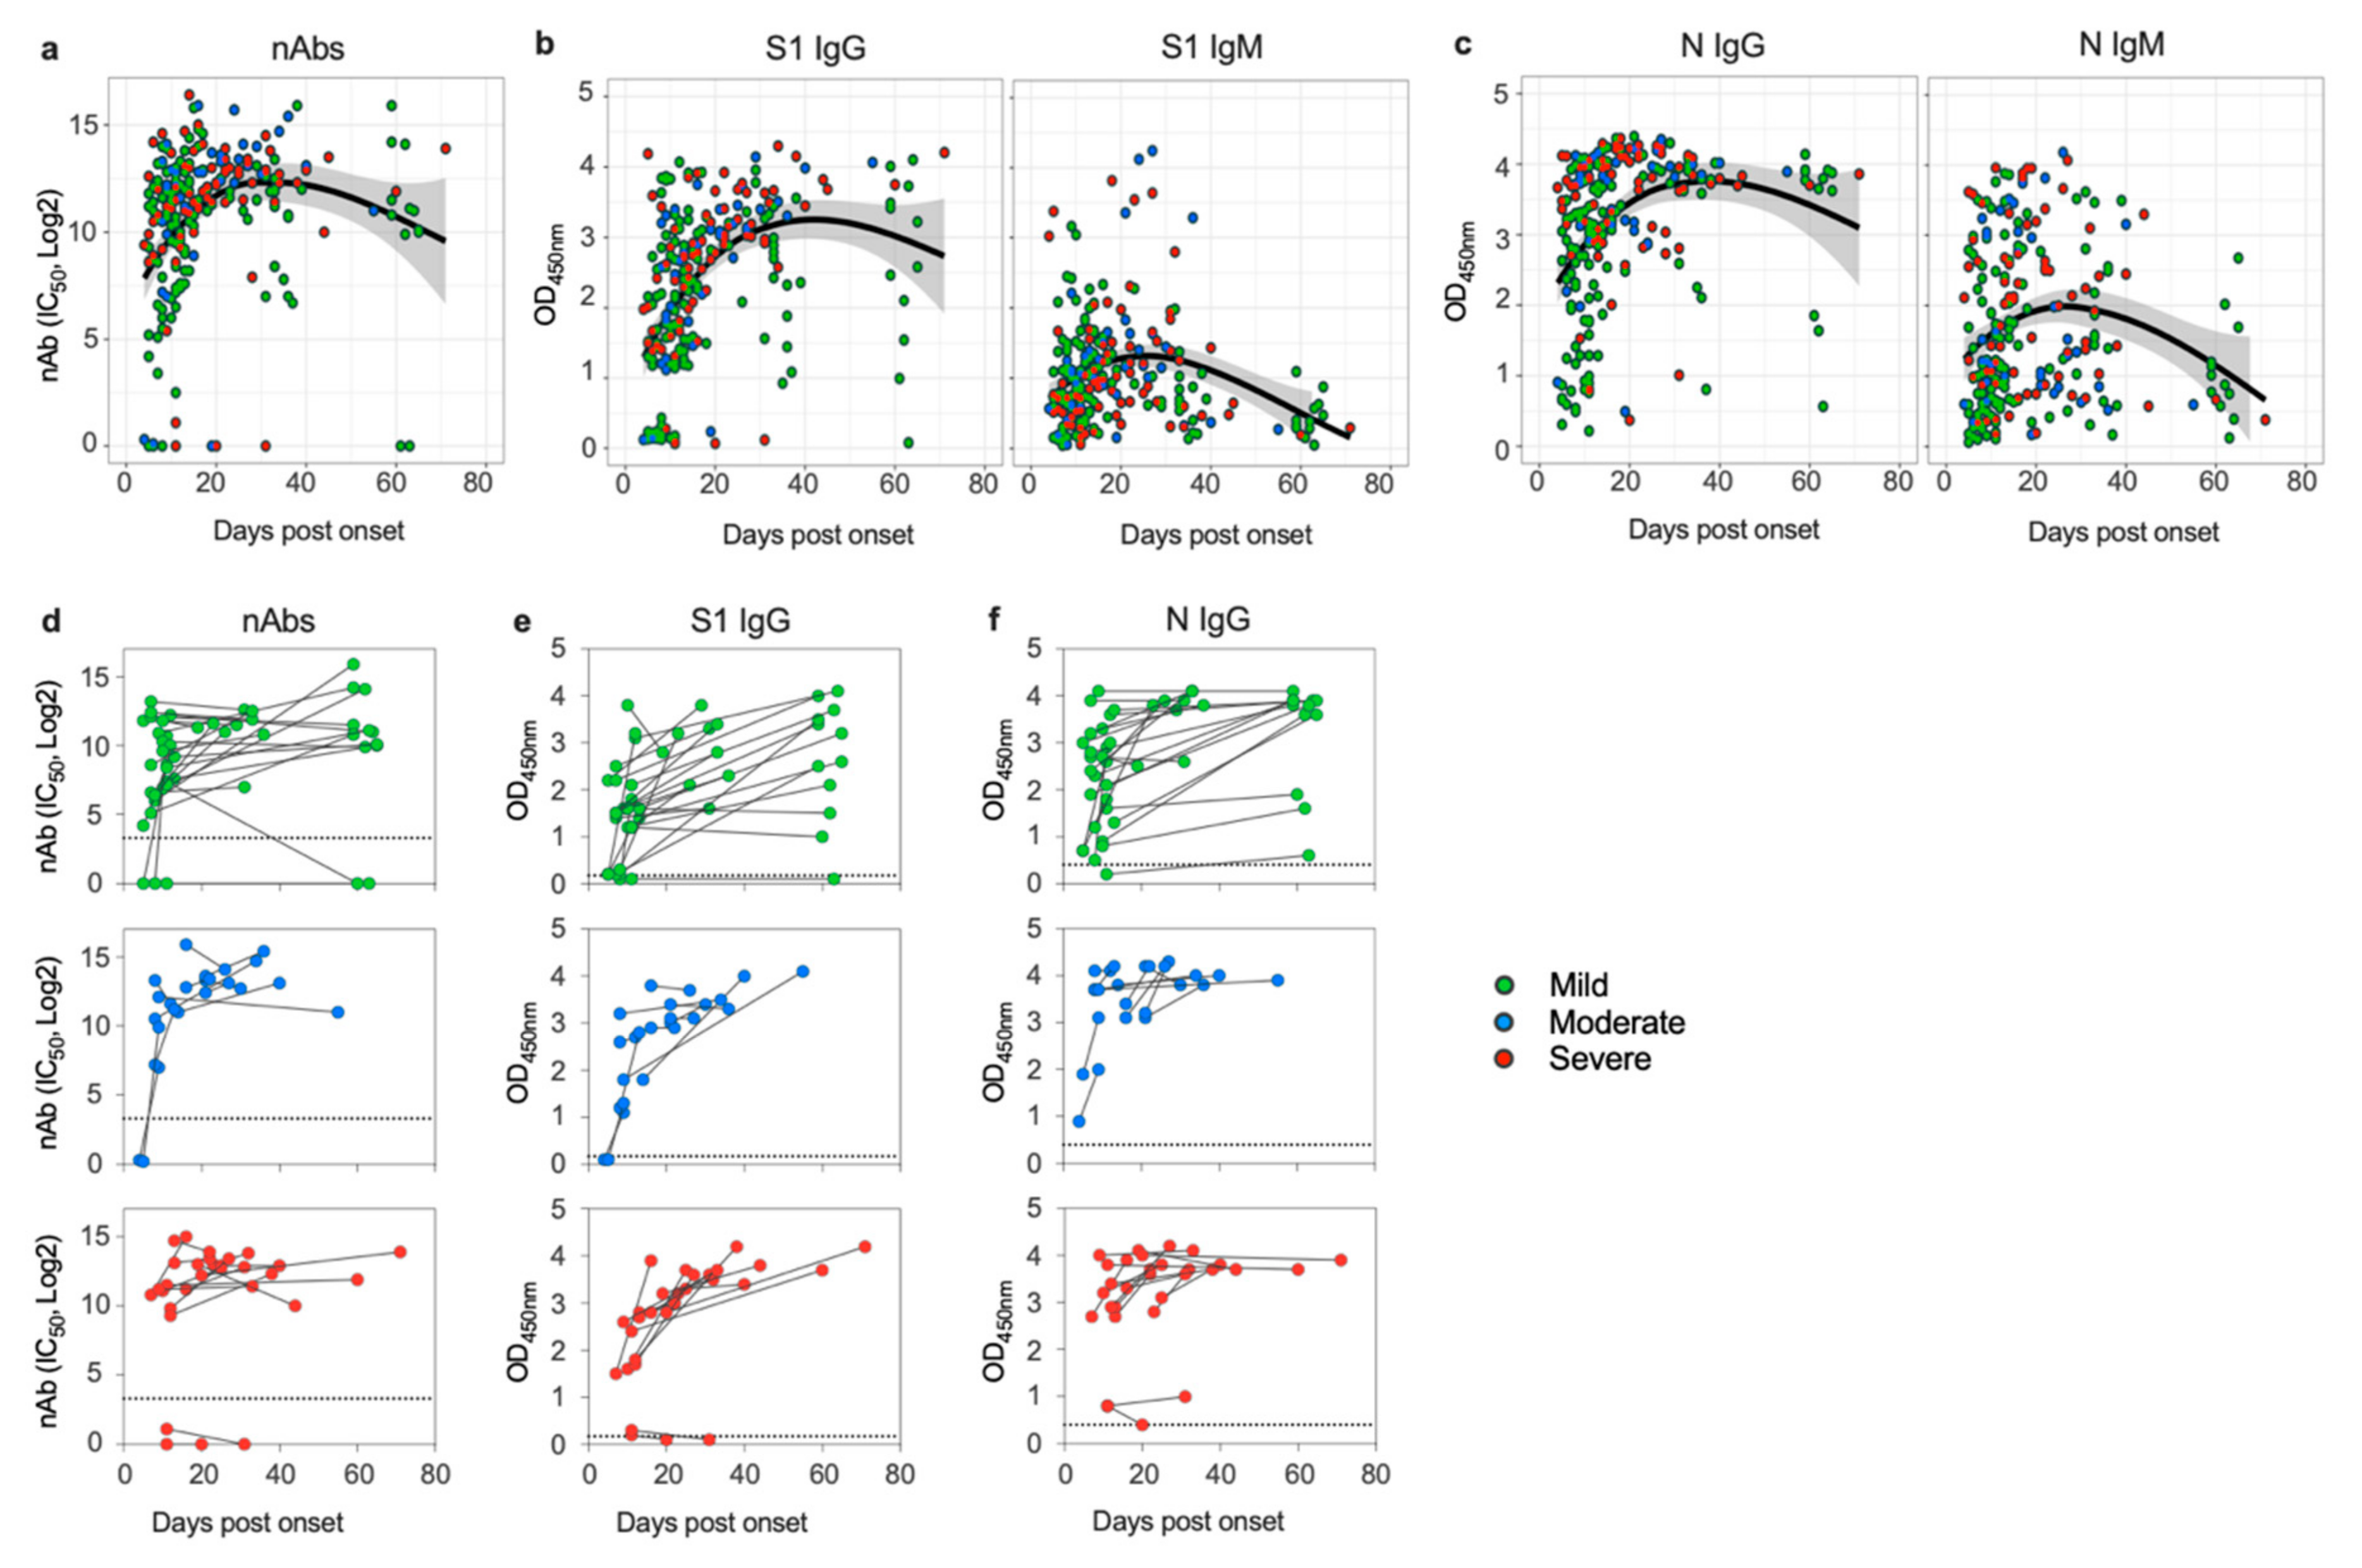
Abstract
:1. Introduction
2. Materials and Methods
2.1. Human Subjects
2.2. Samples
2.3. Cells
2.4. Indirect ELISA
2.5. Generation of rVSV-ΔG/SARS-2-S*-Luciferase Pseudovirus
2.6. Pseudovirus Neutralization Assay
2.7. Statistical Analysis
3. Results
3.1. SARS-CoV-2 Induces Sustained Antibody Response in Patients despite Disease Severity
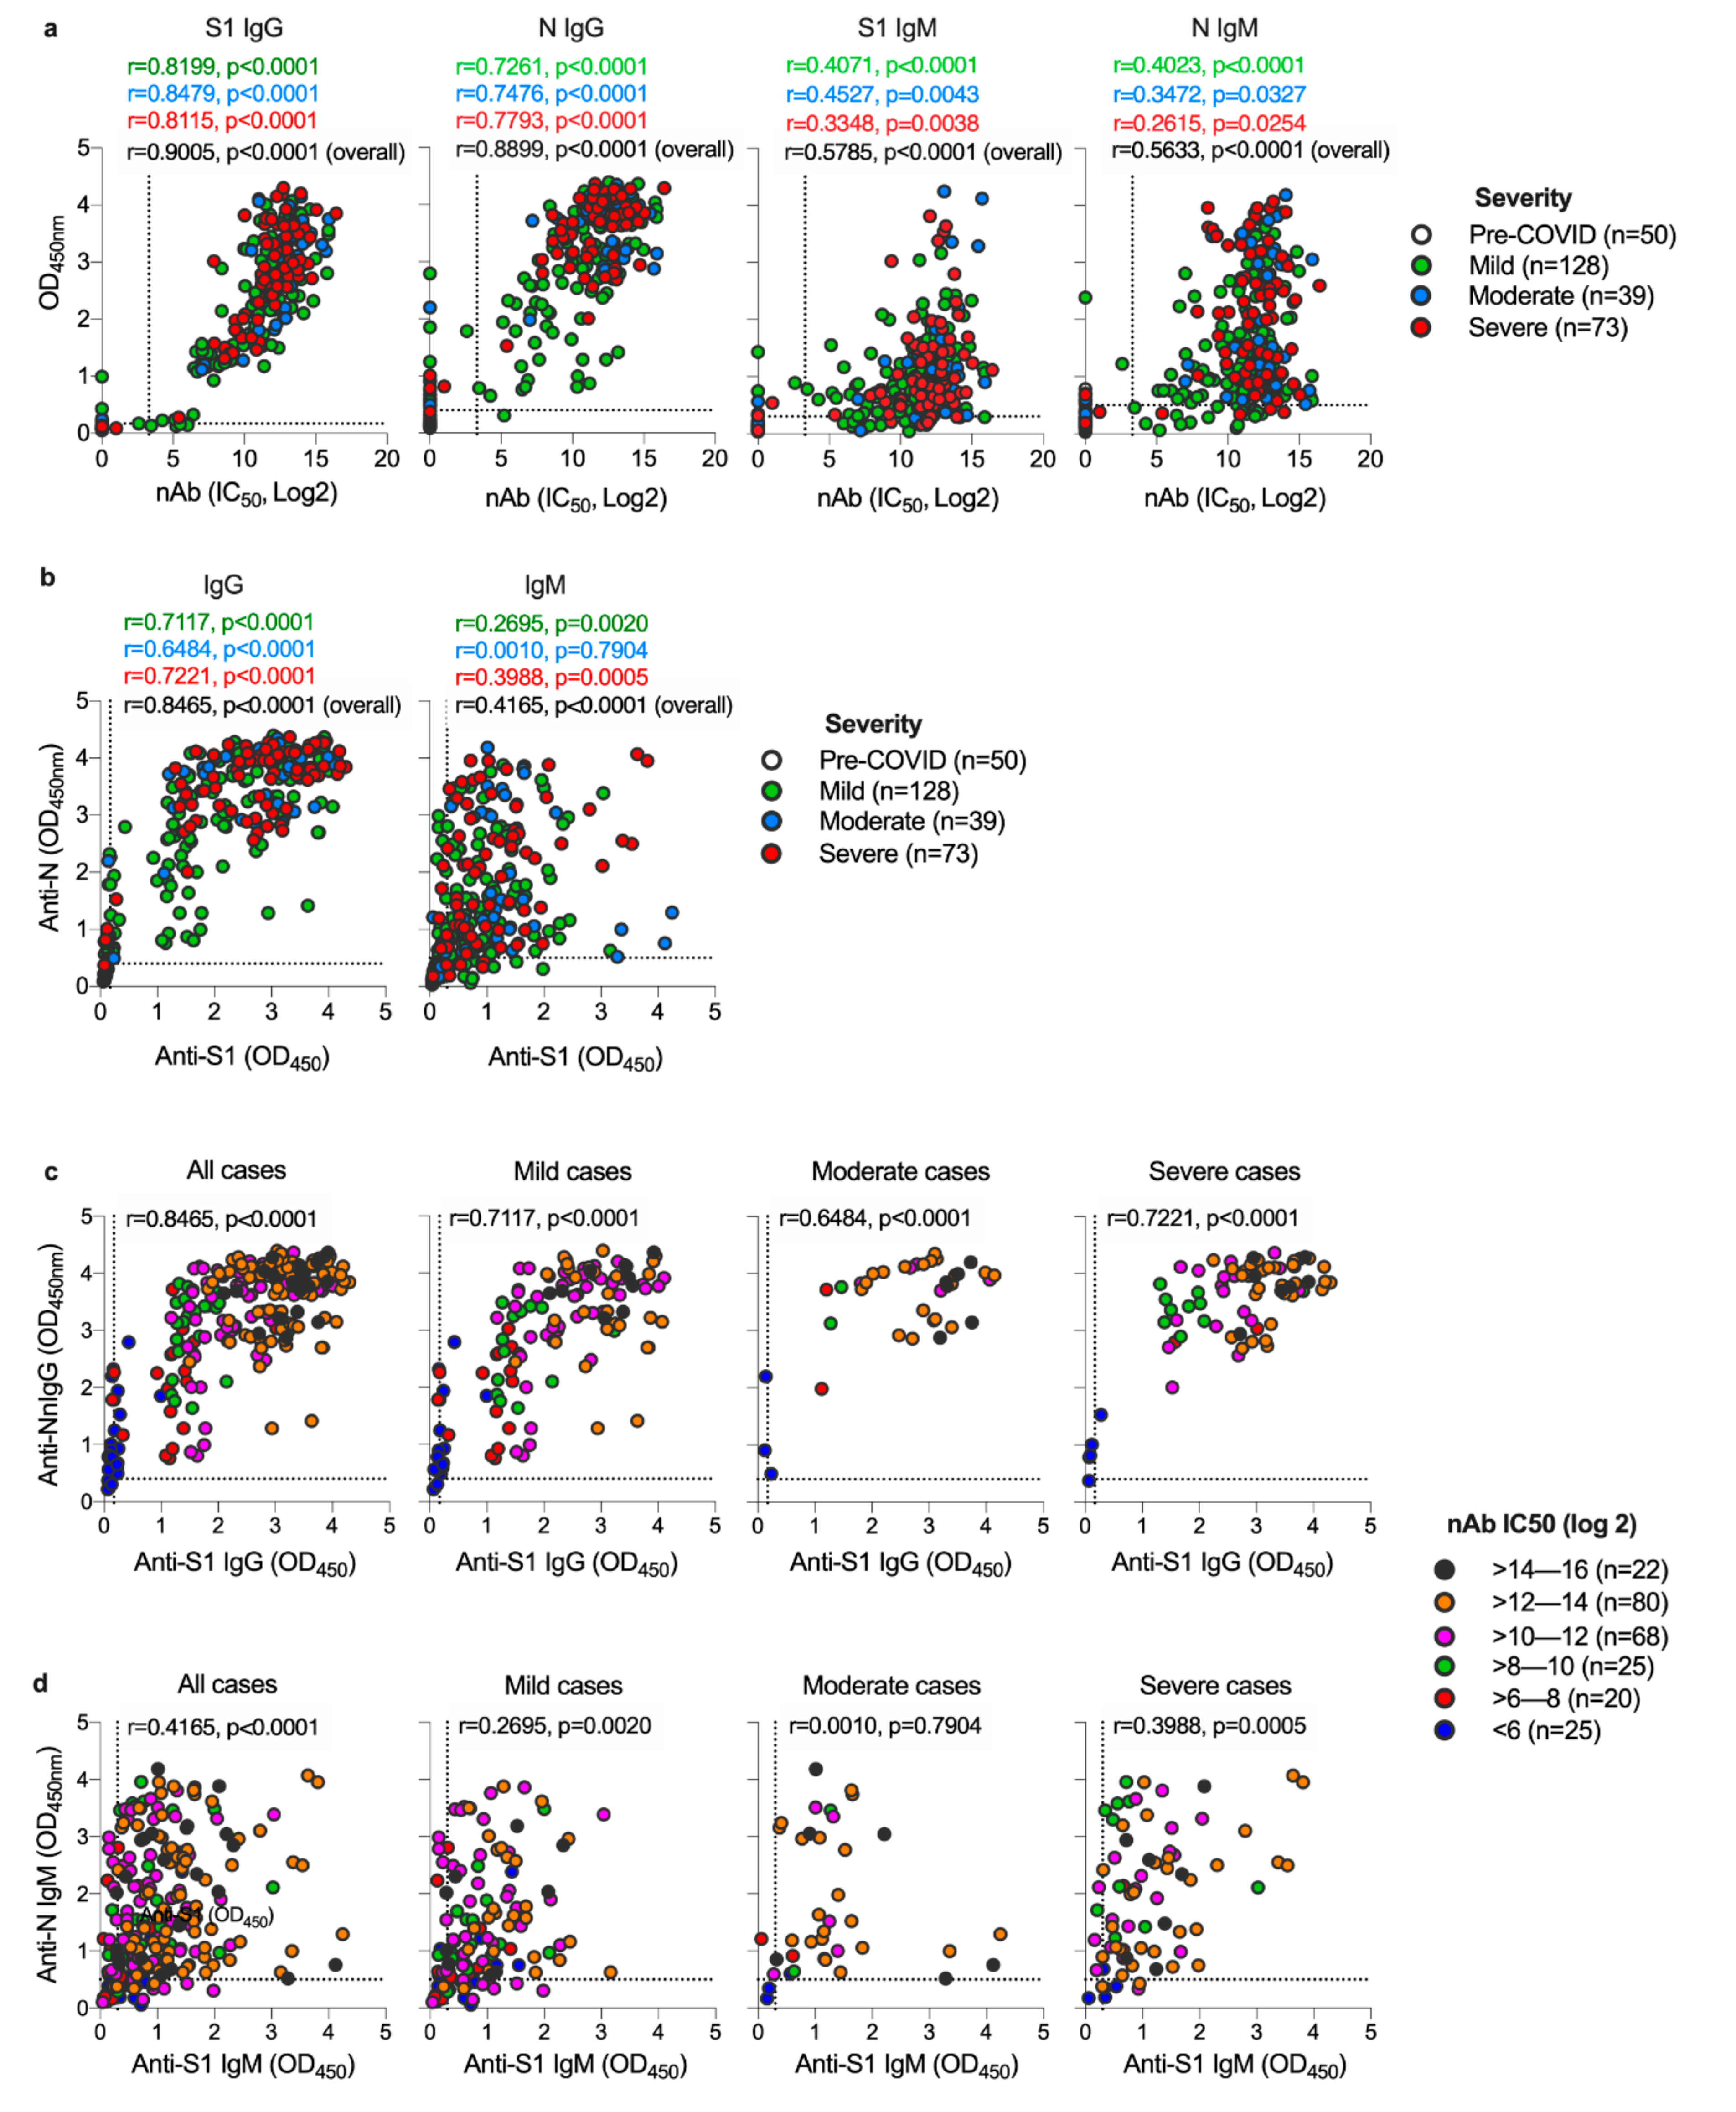
3.2. Both S1 and N-Specific IgG Antibodies Correlate with Each Other and with nAbs in COVID-19 Patients
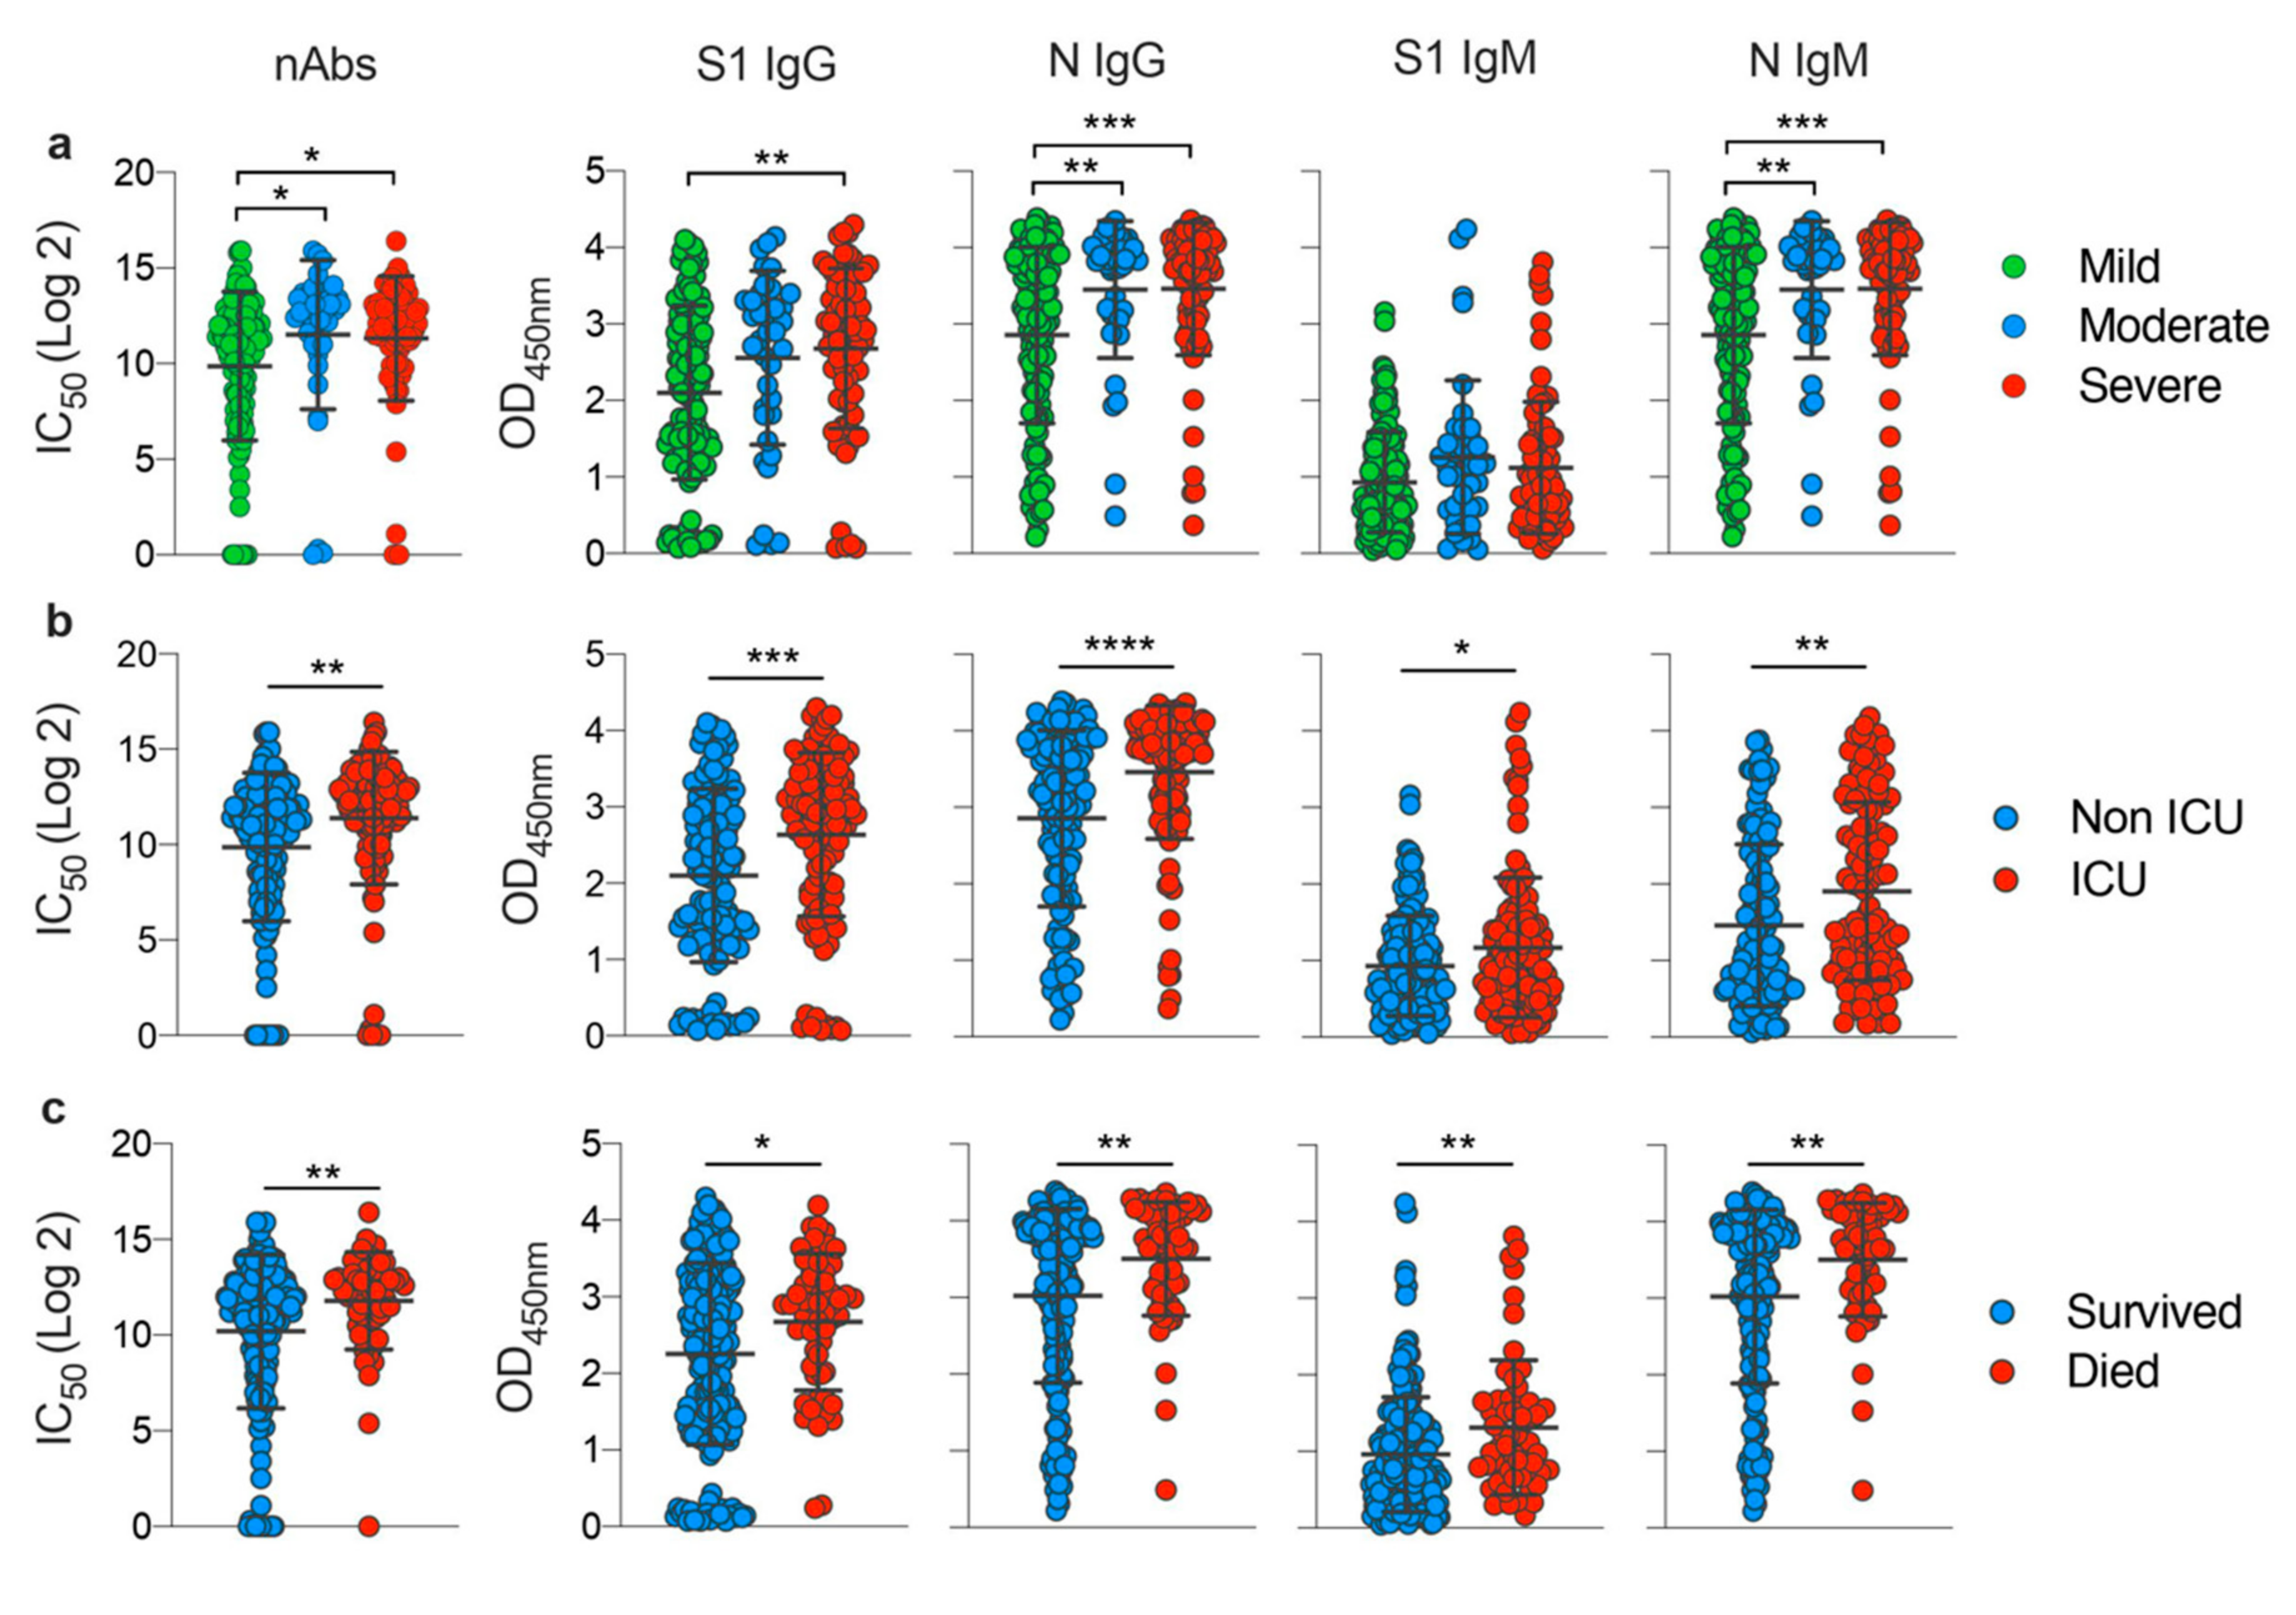
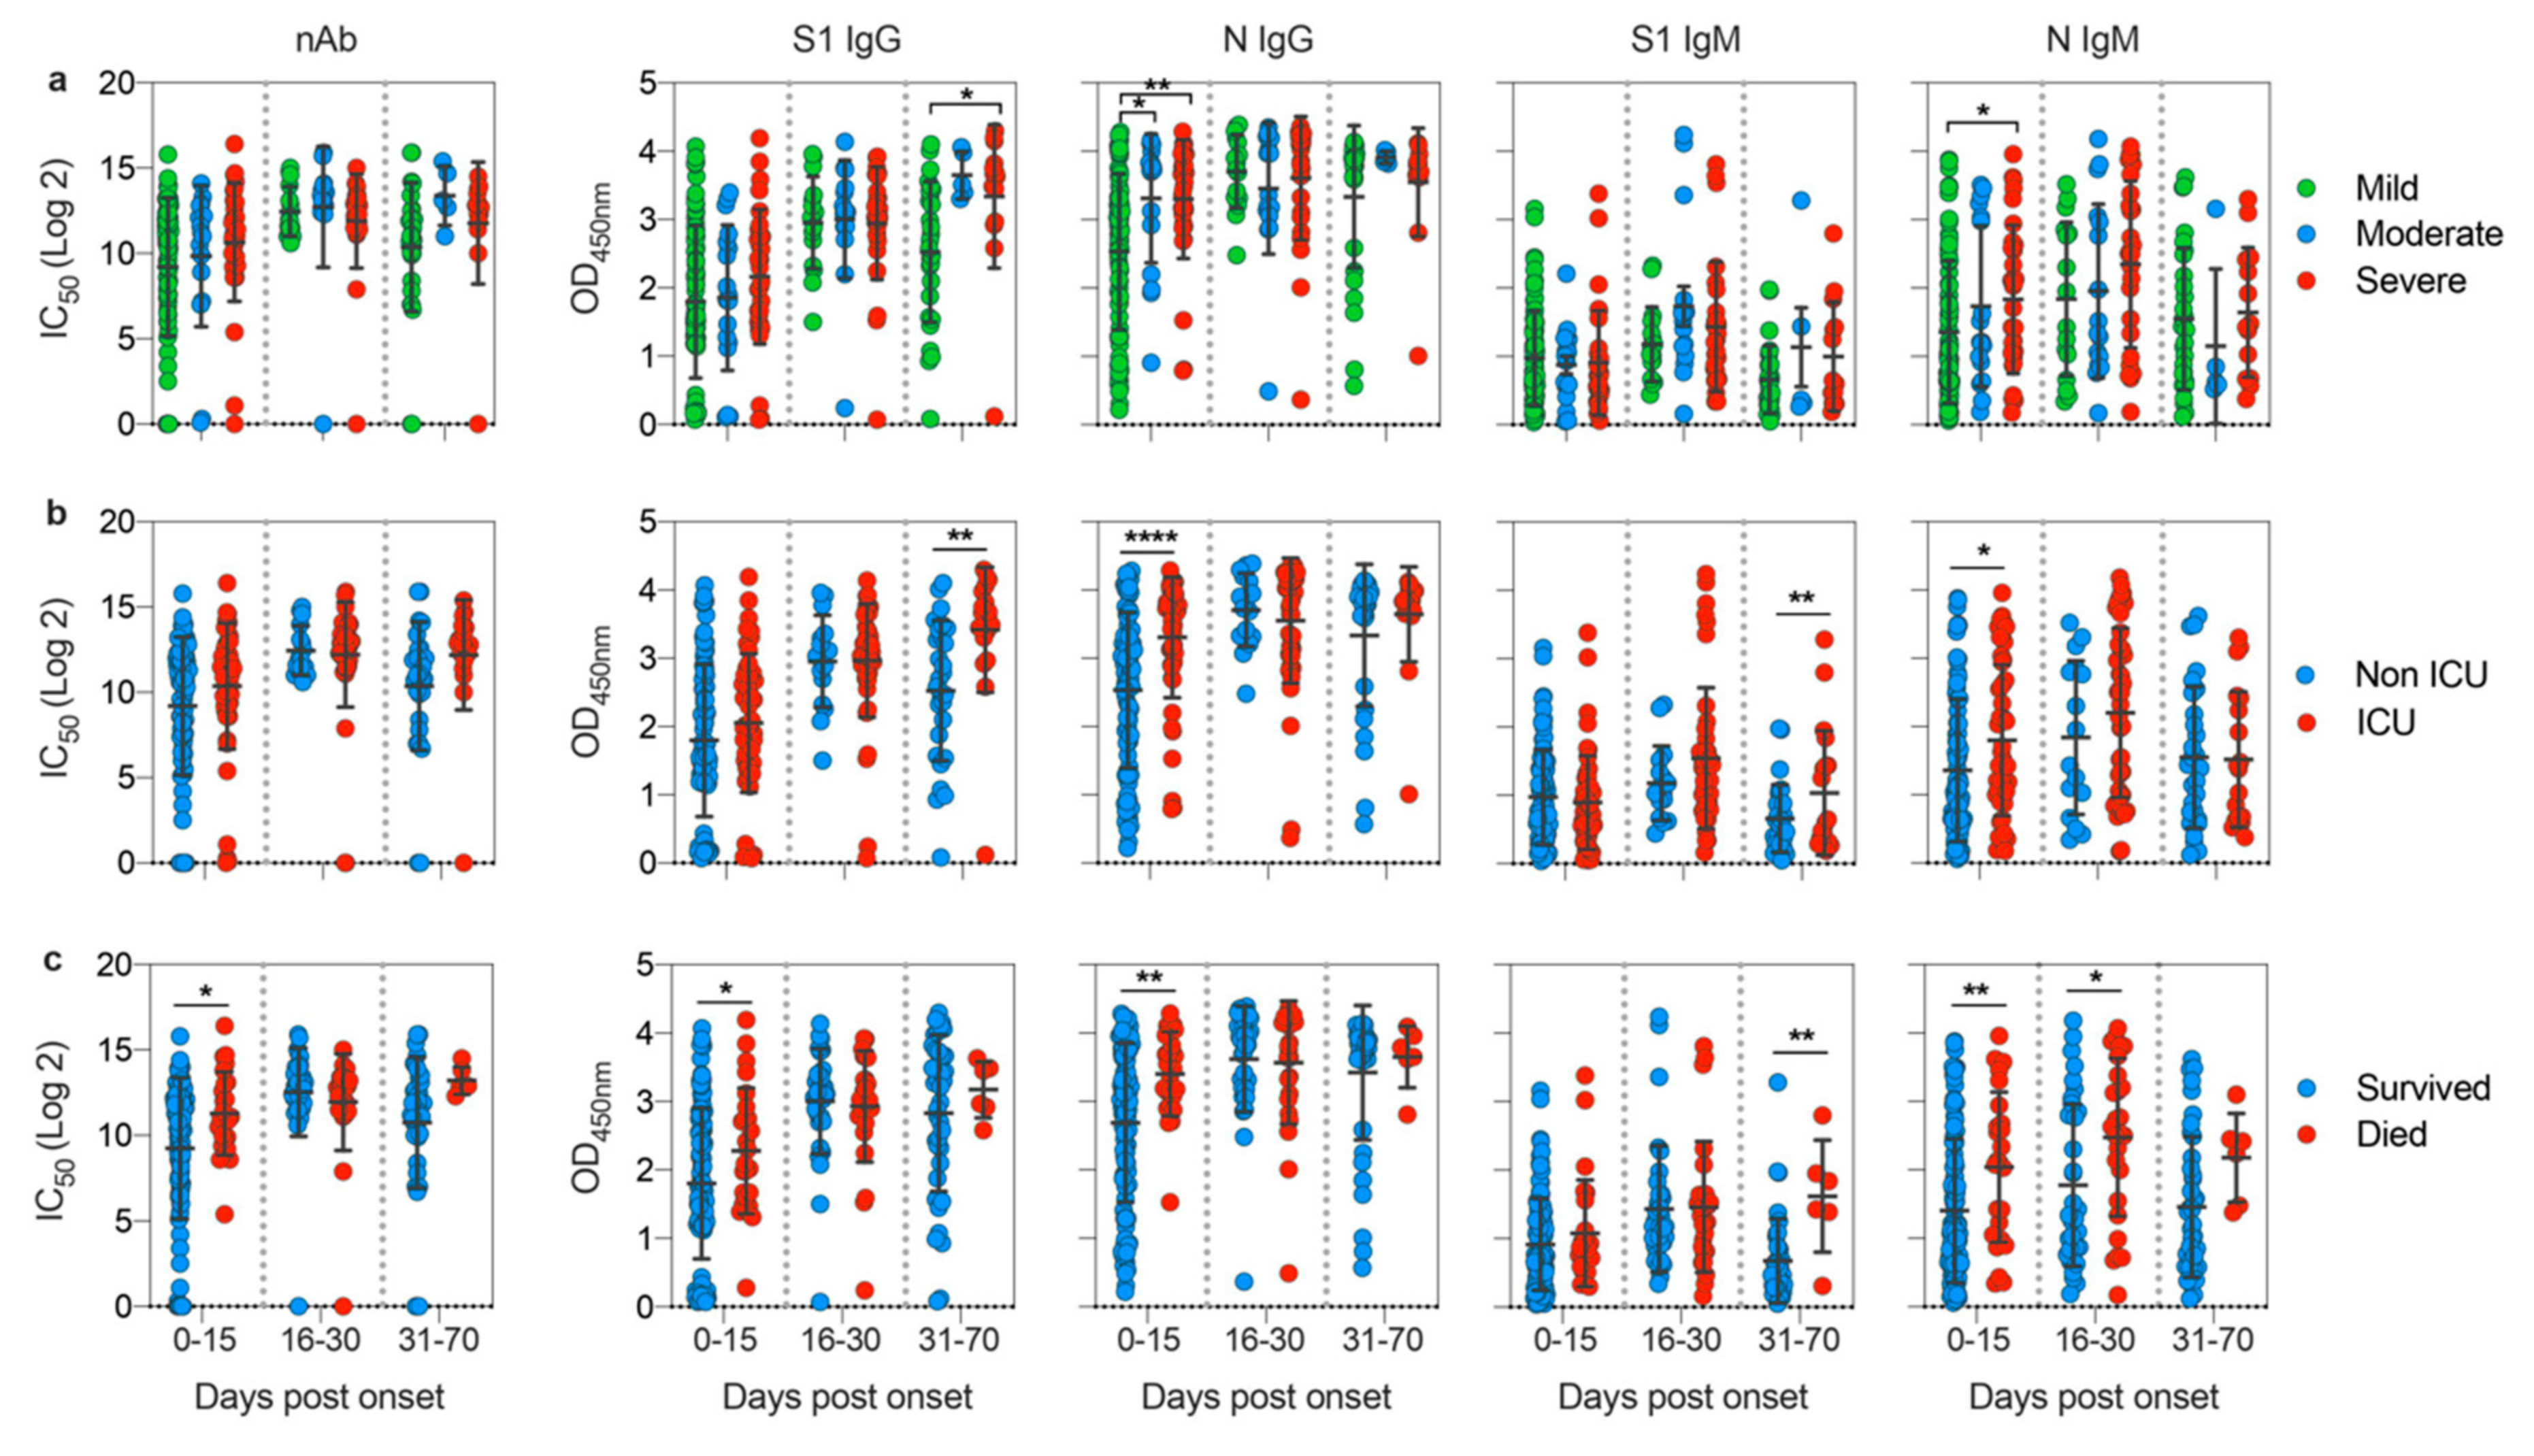
3.3. Disease Severity Impacts Antibody Responses against SARS-CoV-2
4. Discussion
Supplementary Materials
Author Contributions
Funding
Acknowledgments
Conflicts of Interest
References
- Zhu, N.; Zhang, D.; Wang, W.; Li, X.; Yang, B.; Song, J.; Zhao, X.; Huang, B.; Shi, W.; Lu, R.; et al. A Novel Coronavirus from Patients with Pneumonia in China, 2019. N. Engl. J. Med. 2020, 382, 727–733. [Google Scholar] [CrossRef]
- Lu, R.; Zhao, X.; Li, J.; Niu, P.; Yang, B.; Wu, H.; Wang, W.; Song, H.; Huang, B.; Zhu, N.; et al. Genomic characterisation and epidemiology of 2019 novel coronavirus: Implications for virus origins and receptor binding. Lancet 2020, 395, 565–574. [Google Scholar] [CrossRef] [Green Version]
- Wu, F.; Zhao, S.; Yu, B.; Chen, Y.M.; Wang, W.; Song, Z.G.; Hu, Y.; Tao, Z.W.; Tian, J.H.; Pei, Y.Y.; et al. A new coronavirus associated with human respiratory disease in China. Nature 2020, 579, 265–269. [Google Scholar] [CrossRef] [PubMed] [Green Version]
- Cui, J.; Li, F.; Shi, Z.L. Origin and evolution of pathogenic coronaviruses. Nat. Rev. Genet. 2019, 17, 181–192. [Google Scholar] [CrossRef] [PubMed] [Green Version]
- Rodriguez-Morales, A.J.; Cardona-Ospina, J.A.; Gutiérrez-Ocampo, E.; Villamizar-Peña, R.; Holguin-Rivera, Y.; Escalera-Antezana, J.P.; Alvarado-Arnez, L.E.; Bonilla-Aldana, D.K.; Franco-Paredes, C.; Henao-Martinez, A.F.; et al. Clinical, laboratory and imaging features of COVID-19: A systematic review and meta-analysis. Travel Med. Infect. Dis. 2020, 34, 101623. [Google Scholar] [CrossRef] [PubMed]
- Wang, Y.; Liu, Y.; Liu, L.; Wang, X.; Luo, N.; Li, L. Clinical Outcomes in 55 Patients With Severe Acute Respiratory Syndrome Coronavirus 2 Who Were Asymptomatic at Hospital Admission in Shenzhen, China. J. Infect. Dis. 2020, 221, 1770–1774. [Google Scholar] [CrossRef]
- Jin, Y.; Yang, H.; Ji, W.; Wu, W.D.; Chen, S.; Zhang, W.; Duan, G.C. Virology, Epidemiology, Pathogenesis, and Control of COVID-19. Viruses 2020, 12, 372. [Google Scholar] [CrossRef] [Green Version]
- Englmeier, L. A theory on SARS-COV-2 susceptibility: Reduced TLR7-activity as a mechanistic link between men, obese and elderly. J. Biol. Regul. Homeost. Agents 2020, 34. [Google Scholar] [CrossRef]
- Castagnoli, R.; Votto, M.; Licari, A.; Brambilla, I.; Bruno, R.; Perlini, S.; Rovida, F.; Baldanti, F.; Marseglia, G.L. Severe Acute Respiratory Syndrome Coronavirus 2 (SARS-CoV-2) Infection in Children and Adolescents: A Systematic Review. JAMA Pediatr. 2020, 174, 882–889. [Google Scholar] [CrossRef] [Green Version]
- Cai, H. Sex difference and smoking predisposition in patients with COVID-19. Lancet Respir. Med. 2020, 8, 20. [Google Scholar] [CrossRef]
- Tomaras, G.D.; Haynes, B.F. HIV-1-specific antibody responses during acute and chronic HIV-1 infection. Curr. Opin. HIV AIDS 2009, 4, 373–379. [Google Scholar] [CrossRef] [PubMed] [Green Version]
- Cobey, S.; Hensley, S.E. Immune history and influenza virus susceptibility. Curr. Opin. Virol. 2017, 22, 105–111. [Google Scholar] [CrossRef] [PubMed] [Green Version]
- Saphire, E.O.; Schendel, S.L.; Gunn, B.M.; Milligan, J.C.; Alter, G. Antibody-mediated protection against Ebola virus. Nat. Immunol. 2018, 19, 1169–1178. [Google Scholar] [CrossRef] [PubMed]
- Yan, R.; Zhang, Y.; Li, Y.; Xia, L.; Guo, Y.; Zhou, Q. Structural basis for the recognition of SARS-CoV-2 by full-length human ACE2. Science 2020, 367, 1444–1448. [Google Scholar] [CrossRef] [Green Version]
- Du, L.; He, Y.; Zhou, Y.; Liu, S.; Zheng, B.J.; Jiang, S. The spike protein of SARS-CoV—A target for vaccine and therapeutic development. Nat. Rev. Genet. 2009, 7, 226–236. [Google Scholar] [CrossRef]
- Sun, B.; Feng, Y.; Mo, X.; Zheng, P.; Wang, Q.; Li, P.; Peng, P.; Liu, X.; Chen, Z.; Huang, H.; et al. Kinetics of SARS-CoV-2 specific IgM and IgG responses in COVID-19 patients. Emerg. Microbes Infect. 2020, 9, 940–948. [Google Scholar] [CrossRef]
- Trivedi, S.; Miao, C.; Al-Abdallat, M.M.; Haddadin, A.; Alqasrawi, S.; Iblan, I.; Nsour, M.A.; Alsanouri, T.; Ali, S.S.; Rha, B.; et al. Inclusion of MERS-spike protein ELISA in algorithm to determine serologic evidence of MERS-CoV infection. J. Med. Virol. 2018, 90, 367–371. [Google Scholar] [CrossRef] [Green Version]
- Algaissi, A.; Alfaleh, A.A.; Hala, S.; Abujamel, T.S.; Alamri, S.S.; Almahboub, S.A.; Alluhaybi, K.A.; Hobani, H.I.; Asulaiman, R.M.; AlHarbi, R.H.; et al. SARS-CoV-2 S1 and N-Based Serological Assays Reveal Rapid Seroconversion and Induction of Specific Antibody Response in COVID-19 Patients. Sci. Rep 2020, in press. [Google Scholar] [CrossRef]
- Deming, D.; Sheahan, T.; Heise, M.; Yount, B.; Davis, N.; Sims, A.; Suthar, M.; Harkema, J.; Whitmore, A.; Pickles, R.; et al. Vaccine Efficacy in Senescent Mice Challenged with Recombinant SARS-CoV Bearing Epidemic and Zoonotic Spike Variants. PLoS Med. 2006, 3, 525. [Google Scholar] [CrossRef] [Green Version]
- Lou, B.; Li, T.D.; Zheng, S.F.; Su, Y.Y.; Li, Z.Y.; Liu, W.; Yu, F.; Ge, S.; Zou, Q.D.; Yuan, Q.; et al. Serology characteristics of SARS-CoV-2 infection after exposure and post-symptom onset. Eur. Respir. J. 2020, 56, 2000763. [Google Scholar] [CrossRef]
- Yongchen, Z.; Shen, H.; Wang, X.; Shi, X.; Li, Y.; Yan, J.; Chen, Y.; Gu, B. Different longitudinal patterns of nucleic acid and serology testing results based on disease severity of COVID-19 patients. Emerg. Microbes Infect. 2020, 9, 833–836. [Google Scholar] [CrossRef] [PubMed] [Green Version]
- Yong, S.E.F.; Anderson, D.E.; E Wei, W.; Pang, J.; Ni Chia, W.; Tan, C.W.; Teoh, Y.L.; Rajendram, P.; Toh, M.P.H.S.; Poh, C.; et al. Connecting clusters of COVID-19: An epidemiological and serological investigation. Lancet Infect. Dis. 2020, 20, 809–815. [Google Scholar] [CrossRef]
- Xu, Y.; Xiao, M.; Liu, X.; Xu, S.; Du, T.; Xu, J.; Yang, Q.; Xu, Y.; Han, Y.; Li, T.; et al. Significance of serology testing to assist timely diagnosis of SARS-CoV-2 infections: Implication from a family cluster. Emerg. Microbes Infect. 2020, 9, 924–927. [Google Scholar] [CrossRef] [PubMed] [Green Version]
- Iyer, A.S.; Jones, F.K.; Nodoushani, A.; Kelly, M.; Becker, M.; Slater, D.; Mills, R.; Teng, E.; Kamruzzaman, M.; Garcia-Beltran, W.F.; et al. Dynamics and significance of the antibody response to SARS-CoV-2 infection. medRxiv 2020. [Google Scholar] [CrossRef]
- Almahboub, S.A.; Algaissi, A.; AlFaleh, M.A.; ElAssouli, M.Z.; Hashem, A.M. Evaluation of Neutralizing Antibodies Against Highly Pathogenic Coronaviruses: A Detailed Protocol for a Rapid Evaluation of Neutralizing Antibodies Using Vesicular Stomatitis Virus Pseudovirus-Based Assay. Front. Microbiol. 2020, 11. [Google Scholar] [CrossRef]
- Long, Q.; Liu, B.Z.; Deng, H.J.; Wu, G.C.; Deng, K.; Chen, Y.K.; Liao, P.; Qiu, J.F.; Lin, Y.; Cai, X.F.; et al. Antibody responses to SARS-CoV-2 in patients with COVID-19. Nat. Med. 2020, 26, 845–848. [Google Scholar] [CrossRef]
- Wajnberg, A.; Amanat, F.; Firpo, A.; Altman, D.; Bailey, M.; Mansour, M.; McMahon, M.; Meade, P.; Mendu, D.R.; Muellers, K.; et al. SARS-CoV-2 infection induces robust, neutralizing antibody responses that are stable for at least three months. medRxiv 2020. [Google Scholar] [CrossRef]
- Rodda, L.B.; Netland, J.; Shehata, L.; Pruner, K.B.; Morawski, P.A.; Thouvenel, C.D.; Takehara, K.K.; Eggenberger, J.; Hemman, E.A.; Waterman, H.R.; et al. Functional SARS-CoV-2-specific immune memory persists after mild COVID-19. medRxiv 2020. [Google Scholar] [CrossRef]
- Tian, X.; Li, C.; Huang, A.; Xia, S.; Lu, S.; Shi, Z.L.; Lu, L.; Jiang, S.; Yang, Z.; Wu, Y.; et al. Potent binding of 2019 novel coronavirus spike protein by a SARS coronavirus-specific human monoclonal antibody. Emerg. Microbes Infect 2020, 9, 382–385. [Google Scholar] [CrossRef] [Green Version]
- Zhao, J.; Yuan, Q.; Wang, H.; Liu, W.; Liao, X.; Su, Y.; Wang, X.; Yuan, J.; Li, T.; Li, J.; et al. Antibody Responses to SARS-CoV-2 in Patients With Novel Coronavirus Disease 2019. Clin. Infect. Dis. 2020, 344. [Google Scholar] [CrossRef]
- Wu, J.; Liang, B.; Chen, C.; Wang, H.; Fang, Y.; Shen, S.; Yang, X.; Wang, B.; Chen, L.; Chen, Q.; et al. SARS-CoV-2 infection induces sustained humoral immune responses in convalescent patients following symptomatic COVID-19. medRxiv 2020. [Google Scholar] [CrossRef]
- Hohdatsu, T.; Yamada, M.; Tominaga, R.; Makino, K.; Kida, K.; Koyama, H. Antibody-Dependent Enhancement of Feline Infectious Peritonitis Virus Infection in Feline Alveolar Macrophages and Human Monocyte Cell Line U937 by Serum of Cats Experimentally or Naturally Infected with Feline Coronavirus. J. Vet. Med. Sci. 1998, 60, 49–55. [Google Scholar] [CrossRef] [PubMed] [Green Version]
- Liu, L.; Wei, Q.; Lin, Q.; Fang, J.; Wang, H.; Kwok, H.; Tang, H.; Nishiura, K.; Peng, J.; Tan, Z.; et al. Anti–spike IgG causes severe acute lung injury by skewing macrophage responses during acute SARS-CoV infection. JCI Insight 2019, 4, 123158. [Google Scholar] [CrossRef] [PubMed]
- Yip, M.S.; Leung, H.L.; Li, P.H.; Cheung, C.Y.; Dutry, I.; Li, D.; Daëron, M.; Bruzzone, R.; Peiris, J.S.; Jaume, M. Antibody-dependent enhancement of SARS coronavirus infection and its role in the pathogenesis of SARS. Hong Kong Med. J. 2016, 22, 25–31. [Google Scholar] [CrossRef] [Green Version]


Publisher’s Note: MDPI stays neutral with regard to jurisdictional claims in published maps and institutional affiliations. |
© 2020 by the authors. Licensee MDPI, Basel, Switzerland. This article is an open access article distributed under the terms and conditions of the Creative Commons Attribution (CC BY) license (http://creativecommons.org/licenses/by/4.0/).
Share and Cite
Hashem, A.M.; Algaissi, A.; Almahboub, S.A.; Alfaleh, M.A.; Abujamel, T.S.; Alamri, S.S.; Alluhaybi, K.A.; Hobani, H.I.; AlHarbi, R.H.; Alsulaiman, R.M.; et al. Early Humoral Response Correlates with Disease Severity and Outcomes in COVID-19 Patients. Viruses 2020, 12, 1390. https://0-doi-org.brum.beds.ac.uk/10.3390/v12121390
Hashem AM, Algaissi A, Almahboub SA, Alfaleh MA, Abujamel TS, Alamri SS, Alluhaybi KA, Hobani HI, AlHarbi RH, Alsulaiman RM, et al. Early Humoral Response Correlates with Disease Severity and Outcomes in COVID-19 Patients. Viruses. 2020; 12(12):1390. https://0-doi-org.brum.beds.ac.uk/10.3390/v12121390
Chicago/Turabian StyleHashem, Anwar M., Abdullah Algaissi, Sarah A. Almahboub, Mohamed A. Alfaleh, Turki S. Abujamel, Sawsan S. Alamri, Khalid A. Alluhaybi, Haya I. Hobani, Rahaf H. AlHarbi, Reem M. Alsulaiman, and et al. 2020. "Early Humoral Response Correlates with Disease Severity and Outcomes in COVID-19 Patients" Viruses 12, no. 12: 1390. https://0-doi-org.brum.beds.ac.uk/10.3390/v12121390