Substantial Antigenic Drift in the Hemagglutinin Protein of Swine Influenza A Viruses

 , ,
, ,
Abstract
:1. Introduction
2. Materials and Methods
2.1. Herd Description
2.2. Study Design
2.3. Sampling
2.4. Coughing Index
2.5. Pooling and RNA Extraction
2.6. Real-Time RT PCR
2.7. Viral Isolation and NGS
2.8. HA and NA Amplification and Sanger Sequencing
2.9. Consensus Sequence Generation
2.10. Characterization of the Herd swIAV Strain
2.11. Molecular Clock Analysis and Positively Selected Sites
2.12. Statistics
3. Results
3.1. Presence of Enzootic IAV
3.2. Correlation between IAV and the Coughing Index
3.3. Herd Strain Characterization
3.4. Phylogenetic Analysis and Substitution Rates
3.5. Positive Selection
4. Discussion
5. Conclusions
Author Contributions
Funding
Acknowledgments
Conflicts of Interest
References
- Webster, R.G.; Laver, W.G.; Air, G.M.; Schild, G.C. Molecular mechanisms of variation in influenza viruses. Nature 1982, 296, 115–121. [Google Scholar] [CrossRef] [PubMed]
- Kim, H.; Webster, R.G.; Webby, R.J. Influenza Virus: Dealing with a Drifting and Shifting Pathogen. Viral Immunol. 2018, 31, 174–183. [Google Scholar] [CrossRef] [PubMed]
- Yoon, S.-W.; Webby, R.J.; Webster, R.G. Evolution and Ecology of Influenza A Viruses. Curr. Top. Microbiol. Immunol. 2014, 385, 359–375. [Google Scholar] [PubMed] [Green Version]
- Parvin, J.D.; Moscona, A.; Pan, W.T.; Leider, J.M.; Palesel, P. Measurement of the Mutation Rates of Animal Viruses: Influenza A Virus and Poliovirus Type 1. J. Virol. 1986, 59, 377–383. [Google Scholar] [CrossRef] [Green Version]
- Rudneva, I.; Ignatieva, A.; Timofeeva, T.; Shilov, A.; Kushch, A.; Masalova, O.; Klimova, R.; Bovin, N.; Mochalova, L.; Kaverin, N. Escape mutants of pandemic influenza A/H1N1 2009 virus: Variations in antigenic specificity and receptor affinity of the hemagglutinin. Virus Res. 2012, 166, 61–67. [Google Scholar] [CrossRef]
- Matsuzaki, Y.; Sugawara, K.; Nakauchi, M.; Takahashi, Y.; Onodera, T.; Tsunetsugu-Yokota, Y.; Matsumura, T.; Ato, M.; Kobayashi, K.; Shimotai, Y.; et al. Epitope Mapping of the Hemagglutinin Molecule of A/(H1N1)pdm09 Influenza Virus by Using Monoclonal Antibody Escape Mutants. J. Virol. 2014, 88, 12364–12373. [Google Scholar] [CrossRef] [Green Version]
- Gerhard, W.; Yewdell, J.; Frankel, M.E.; Webster, R. Antigenic structure of influenza virus haemagglutinin defined by hybridoma antibodies. Nature 1981, 290, 713–717. [Google Scholar] [CrossRef]
- Caton, A.J.; Brownlee, G.G.; Yewdell, J.W.; Gerhard, W. The antigenic structure of the influenza virus A/PR/8/34 hemagglutinin (H1 subtype). Cell 1982, 31, 417–427. [Google Scholar] [CrossRef]
- Luoh, S. Hemaglutinin mutations related to antigenic variation in H1 swine influenza- viruses. J. Virol. 1992, 66, 1066–1073. [Google Scholar] [CrossRef] [Green Version]
- Skehel, J.J.; Wiley, D.C. Receptor Binding and Membrane Fusion in Virus Entry: The Influenza Hemagglutinin. Annu. Rev. Biochem. 2000, 69, 531–569. [Google Scholar] [CrossRef]
- Furuse, Y.; Shimabukuro, K.; Odagiri, T.; Sawayama, R.; Okada, T.; Khandaker, I.; Suzuki, A.; Oshitani, H. Comparison of selection pressures on the HA gene of pandemic (2009) and seasonal human and swine influenza A H1 subtype viruses. Virology 2010, 405, 314–321. [Google Scholar] [CrossRef] [PubMed] [Green Version]
- Li, W.; Shi, W.; Qiao, H.; Ho, S.Y.; Luo, A.; Zhang, Y.; Zhu, C. Positive selection on hemagglutinin and neuraminidase genes of H1N1 influenza viruses. Virol. J. 2011, 8, 183. [Google Scholar] [CrossRef] [PubMed] [Green Version]
- Shen, J.; Ma, J.; Wang, Q. Evolutionary Trends of A(H1N1) Influenza Virus Hemagglutinin Since 1918. PLoS ONE 2009, 4, e7789. [Google Scholar] [CrossRef] [PubMed] [Green Version]
- Suzuki, Y. Positive selection operates continuously on hemagglutinin during evolution of H3N2 human influenza A virus. Gene 2008, 427, 111–116. [Google Scholar] [CrossRef] [PubMed]
- Petrie, J.G.; Parkhouse, K.; Ohmit, S.E.; Malosh, R.E.; Monto, A.S.; Hensley, S.E. Antibodies Against the Current Influenza A(H1N1) Vaccine Strain Do Not Protect Some Individuals From Infection With Contemporary Circulating Influenza A(H1N1) Virus Strains. J. Infect. Dis. 2016, 214, 1947–1951. [Google Scholar] [CrossRef] [PubMed]
- Petrova, V.N.; Russell, C.A. The evolution of seasonal influenza viruses. Nat. Rev. Microbiol. 2018, 16, 47–60. [Google Scholar] [CrossRef]
- Boni, M.F. Vaccination and antigenic drift in influenza. Vaccine 2008, 26, C8–C14. [Google Scholar] [CrossRef] [Green Version]
- Van Reeth, K.; Labarque, G.; De Clercq, S.; Pensaert, M. Efficacy of vaccination of pigs with different H1N1 swine influenza viruses using a recent challenge strain and different parameters of protection. Vaccine 2001, 19, 4479–4486. [Google Scholar] [CrossRef]
- Abente, E.J.; Rajao, D.S.; Santos, J.; Kaplan, B.S.; Nicholson, T.L.; Brockmeier, S.L.; Gauger, P.C.; Perez, D.R.; Vincent, A.L. Comparison of adjuvanted-whole inactivated virus and live-attenuated virus vaccines against challenge with contemporary, antigenically distinct swine H3N2 influenza A viruses. J. Virol. 2018. [Google Scholar] [CrossRef] [Green Version]
- McCauley, J.W.; Alexander, D.J.; Brown, I.H.; Olsen, C.W.; Ludwig, S.; Hannoun, C.; Strong, I.; Scholtissek, C.; Hinshaw, V.S.; Harris, P.A. Antigenic and genetic analyses of H1N1 influenza A viruses from European pigs. J. Gen. Virol. 1997, 78, 553–562. [Google Scholar]
- Campitelli, L.; Donatelli, I.; Foni, E.; Castrucci, M.R.; Fabiani, C.; Kawaoka, Y.; Krauss, S.; Webster, R.G. Continued Evolution of H1N1 and H3N2 Influenza Viruses in Pigs in Italy. Virology 1997, 232, 310–318. [Google Scholar] [CrossRef] [PubMed] [Green Version]
- de Jong, J.C.; Smith, D.J.; Lapedes, A.S.; Donatelli, I.; Campitelli, L.; Barigazzi, G.; Van Reeth, K.; Jones, T.C.; Rimmelzwaan, G.F.; Osterhaus, A.D.M.E.; et al. Antigenic and Genetic Evolution of Swine Influenza A (H3N2) Viruses in Europe. J. Virol. 2007, 81, 4315–4322. [Google Scholar] [CrossRef] [PubMed] [Green Version]
- O’Neill, K.C.; Shen, H.G.; Lin, K.; Hemann, M.; Beach, N.M.; Meng, X.J.; Halbur, P.G.; Opriessnig, T. Studies on Porcine Circovirus Type 2 Vaccination of 5-Day-Old Piglets. Clin. Vaccine Immunol. 2011, 18, 1865–1871. [Google Scholar] [CrossRef] [PubMed] [Green Version]
- Trebbien, R.; Bragstad, K.; Larsen, L.; Nielsen, J.; Bøtner, A.; Heegaard, P.M.; Fomsgaard, A.; Viuff, B.; Hjulsager, C. Genetic and biological characterisation of an avian-like H1N2 swine influenza virus generated by reassortment of circulating avian-like H1N1 and H3N2 subtypes in Denmark. Virol. J. 2013, 10, 290. [Google Scholar] [CrossRef] [PubMed]
- Watson, S.J.; Langat, P.; Reid, S.M.; Lam, T.T.-Y.; Cotten, M.; Kelly, M.; Van Reeth, K.; Qiu, Y.; Simon, G.; Bonin, E.; et al. Molecular Epidemiology and Evolution of Influenza Viruses Circulating within European Swine between 2009 and 2013. J. Virol. 2015, 89, 9920–9931. [Google Scholar] [CrossRef] [PubMed] [Green Version]
- Kuntz-Simon, G.; Madec, F. Genetic and Antigenic Evolution of Swine Influenza Viruses in Europe and Evaluation of Their Zoonotic Potential. Zoonoses Public Health 2009, 56, 310–325. [Google Scholar] [CrossRef]
- Rajao, D.S.; Anderson, T.K.; Kitikoon, P.; Stratton, J.; Lewis, N.S.; Vincent, A.L. Antigenic and genetic evolution of contemporary swine H1 influenza viruses in the United States. Virology 2018, 518, 45–54. [Google Scholar] [CrossRef]
- Simon, G.; Larsen, L.E.; Dürrwald, R.; Foni, E.; Harder, T.; Van Reeth, K.; Markowska-Daniel, I.; Reid, S.M.; Dan, A.; Maldonado, J.; et al. European Surveillance Network for Influenza in Pigs: Surveillance Programs, Diagnostic Tools and Swine Influenza Virus Subtypes Identified in 14 European Countries from 2010 to 2013. PLoS ONE 2014, 9, e115815. [Google Scholar] [CrossRef]
- Lewis, N.S.; Russell, C.A.; Langat, P.; Anderson, T.K.; Berger, K.; Bielejec, F.; Burke, D.F.; Dudas, G.; Fonville, J.M.; Fouchier, R.A.; et al. The global antigenic diversity of swine influenza A viruses. Elife 2016, 5. [Google Scholar] [CrossRef] [Green Version]
- Moreno, A.; Gabanelli, E.; Sozzi, E.; Lelli, D.; Chiapponi, C.; Ciccozzi, M.; Zehender, G.; Cordioli, P. Different evolutionary trends of swine H1N2 influenza viruses in Italy compared to European viruses. Vet. Res. 2013, 44, 112. [Google Scholar] [CrossRef] [Green Version]
- Aymard, M.; Cameron, K.; Hay, A.; Marozin, S.; Barigazzi, G.; Foni, E.; Bennett, M.; Gregory, V.; Lin, Y.; Valette, M. Antigenic and genetic diversity among swine influenza A H1N1 and H1N2 viruses in Europe. J. Gen. Virol. 2002, 83, 735–745. [Google Scholar]
- Lam, T.-Y.; Hon, C.-C.; Wang, Z.; Hui, R.K.-H.; Zeng, F.; Leung, F.C.-C. Evolutionary analyses of European H1N2 swine influenza A virus by placing timestamps on the multiple reassortment events. Virus Res. 2008, 131, 271–278. [Google Scholar] [CrossRef] [PubMed]
- Chastagner, A.; Hervé, S.; Bonin, E.; Quéguiner, S.; Hirchaud, E.; Henritzi, D.; Béven, V.; Gorin, S.; Barbier, N.; Blanchard, Y.; et al. Spatiotemporal Distribution and Evolution of the A/H1N1 2009 Pandemic Influenza Virus in Pigs in France from 2009 to 2017: Identification of a Potential Swine-Specific Lineage. J. Virol. 2018, 92. [Google Scholar] [CrossRef] [PubMed] [Green Version]
- Lewis, N.S.; Anderson, T.K.; Kitikoon, P.; Skepner, E.; Burke, D.F.; Vincent, A.L. Substitutions near the Hemagglutinin Receptor-Binding Site Determine the Antigenic Evolution of Influenza A H3N2 Viruses in U.S. Swine. J. Virol. 2014, 88, 4752–4763. [Google Scholar] [CrossRef] [PubMed] [Green Version]
- Sugita, S.; Yoshioka, Y.; Itamura, S.; Kanegae, Y.; Oguchi, K.; Gojobori, T.; Nerome, K.; Oya, A. Molecular evolution of hemagglutinin genes of H1N1 swine and human influenza A viruses. J. Mol. Evol. 1991. [Google Scholar] [CrossRef] [PubMed]
- Xu, Z.; Zhou, R.; Jin, M.; Chen, H. Selection pressure on the hemagglutinin gene of Influenza A (H1N1) virus: adaptation to human and swine hosts in Asia. Acta Virol. 2010, 54, 113–118. [Google Scholar] [CrossRef]
- Zell, R.; Groth, M.; Krumbholz, A.; Lange, J.; Philipps, A.; Dürrwald, R. Displacement of the Gent/1999 human-like swine H1N2 influenza A virus lineage by novel H1N2 reassortants in Germany. Arch. Virol. 2020. [Google Scholar] [CrossRef]
- Reynolds, J.J.H.; Torremorell, M.; Craft, M.E. Mathematical Modeling of Influenza A Virus Dynamics within Swine Farms and the Effects of Vaccination. PLoS ONE 2014, 9, e106177. [Google Scholar] [CrossRef]
- Chamba Pardo, F.O.; Alba-Casals, A.; Nerem, J.; Morrison, R.B.; Puig, P.; Torremorell, M. Influenza Herd-Level Prevalence and Seasonality in Breed-to-Wean Pig Farms in the Midwestern United States. Front. Vet. Sci. 2017, 4. [Google Scholar] [CrossRef] [Green Version]
- Allerson, M.W.; Davies, P.R.; Gramer, M.R.; Torremorell, M. Infection Dynamics of Pandemic 2009 H1N1 Influenza Virus in a Two-Site Swine Herd. Transbound. Emerg. Dis. 2014, 61, 490–499. [Google Scholar] [CrossRef]
- Simon-Grifé, M.; Martín-Valls, G.E.; Vilar, M.J.; Busquets, N.; Mora-Salvatierra, M.; Bestebroer, T.M.; Fouchier, R.A.; Martín, M.; Mateu, E.; Casal, J. Swine influenza virus infection dynamics in two pig farms; results of a longitudinal assessment. Vet. Res. 2012, 43, 24. [Google Scholar] [CrossRef] [PubMed] [Green Version]
- Cador, C.; Rose, N.; Willem, L.; Andraud, M. Maternally Derived Immunity Extends Swine Influenza A Virus Persistence within Farrow-to-Finish Pig Farms: Insights from a Stochastic Event-Driven Metapopulation Model. PLoS One 2016, 11, e0163672. [Google Scholar] [CrossRef] [PubMed]
- Cador, C.; Andraud, M.; Willem, L.; Rose, N. Control of endemic swine flu persistence in farrow-to-finish pig farms: a stochastic metapopulation modeling assessment. Vet. Res. 2017, 48, 58. [Google Scholar] [CrossRef] [PubMed] [Green Version]
- Rose, N.; Hervé, S.; Eveno, E.; Barbier, N.; Eono, F.; Dorenlor, V.; Andraud, M.; Camsusou, C.; Madec, F.; Simon, G. Dynamics of influenza A virus infections in permanently infected pig farms: evidence of recurrent infections, circulation of several swine influenza viruses and reassortment events. Vet. Res. 2013, 44, 72. [Google Scholar] [CrossRef] [Green Version]
- Ryt-Hansen, P.; Larsen, I.; Kristensen, C.S.; Krog, J.S.; Wacheck, S.; Larsen, L.E. Longitudinal field studies reveal early infection and persistence of influenza A virus in piglets despite the presence of maternally derived antibodies. Vet. Res. 2019, 50, 36. [Google Scholar] [CrossRef] [Green Version]
- Pitzer, V.E.; Aguas, R.; Riley, S.; Loeffen, W.L.A.; Wood, J.L.N.; Grenfell, B.T. High turnover drives prolonged persistence of influenza in managed pig herds. J. R. Soc. Interface 2016, 13, 20160138. [Google Scholar] [CrossRef]
- Brown, I.H. The epidemiology and evolution of influenza viruses in pigs. Vet. Microbiol. 2000, 74, 29–46. [Google Scholar] [CrossRef]
- Bolton, M.J.; Abente, E.J.; Venkatesh, D.; Stratton, J.A.; Zeller, M.; Anderson, T.K.; Lewis, N.S.; Vincent, A.L. Antigenic evolution of H3N2 influenza A viruses in swine in the United States from 2012 to 2016. Influenza Other Respi. Viruses 2019, 13, 83–90. [Google Scholar] [CrossRef]
- Ryt-Hansen, P.; Hjulsager, C.K.; Larsen, L.E. Overvågning af Influenza A virus i svin. Available online: https://www.vet.dtu.dk/raadgivning/aarsrapporter/aarsrapport-svineinfluenza (accessed on 1 July 2019).
- Svineproduktion, S. SPF Sundhedsstyringen a part of Landbrug & Fødevarer. Available online: http://spfsus.dk/en (accessed on 1 October 2017).
- Nagy, A.; Vostinakova, V.; Pirchanova, Z.; Cernikova, L.; Dirbakova, Z.; Mojzis, M.; Jirincova, H.; Havlickova, M.; Dan, A.; Ursu, K.; et al. Development and evaluation of a one-step real-time RT-PCR assay for universal detection of influenza A viruses from avian and mammal species. Arch. Virol. 2010, 155, 665–673. [Google Scholar] [CrossRef]
- Goecke, N.B.; Krog, J.S.; Hjulsager, C.K.; Skovgaard, K.; Harder, T.C.; Breum, S.Ø.; Larsen, L.E. Subtyping of Swine Influenza Viruses Using a High-Throughput Real-Time PCR Platform. Front. Cell. Infect. Microbiol. 2018, 8. [Google Scholar] [CrossRef]
- Ryt-Hansen, P.; Larsen, I.; Kristensen, C.S.; Krog, J.S.; Larsen, L.E. Limited impact of influenza A virus vaccination of piglets in an enzootic infected sow herd. Res. Vet. Sci. 2019, 127, 47–56. [Google Scholar] [CrossRef] [PubMed]
- Edgar, R.C. MUSCLE: multiple sequence alignment with high accuracy and high throughput. Nucleic Acids Res. 2004, 32, 1792–1797. [Google Scholar] [CrossRef] [PubMed] [Green Version]
- Yang, H.; Qiao, C.; Tang, X.; Chen, Y.; Xin, X.; Chen, H. Human Infection from Avian-like Influenza A (H1N1) Viruses in Pigs, China. Emerg. Infect. Dis. 2012, 18, 1144–1146. [Google Scholar] [CrossRef] [PubMed]
- Manicassamy, B.; Medina, R.A.; Hai, R.; Tsibane, T.; Stertz, S.; Nistal-Villán, E.; Palese, P.; Basler, C.F.; García-Sastre, A. Protection of Mice against Lethal Challenge with 2009 H1N1 Influenza A Virus by 1918-Like and Classical Swine H1N1 Based Vaccines. PLoS Pathog. 2010, 6, e1000745. [Google Scholar] [CrossRef] [PubMed] [Green Version]
- Deem, M.W. The epitope regions of H1-subtype influenza A, with application to vaccine efficacy. Protein Eng 2009, 22, 543–546. [Google Scholar] [CrossRef] [PubMed] [Green Version]
- Wang, Z.; Huang, B.; Thomas, M.; Sreenivasan, C.C.; Sheng, Z.; Yu, J.; Hause, B.M.; Wang, D.; Francis, D.H.; Kaushik, R.S.; et al. Detailed mapping of the linear B Cell epitopes of the hemagglutinin (HA) protein of swine influenza virus. Virology 2018. [Google Scholar] [CrossRef]
- Babon, J.A.B.; Cruz, J.; Orphin, L.; Pazoles, P.; Co, M.D.T.; Ennis, F.A.; Terajima, M. Genome-wide screening of human T-cell epitopes in influenza A virus reveals a broad spectrum of CD4+ T-cell responses to internal proteins, hemagglutinins, and neuraminidases. Hum. Immunol. 2009, 70, 711–721. [Google Scholar] [CrossRef] [Green Version]
- H Gutiérrez, A. In Vivo Validation of Predicted and Conserved T Cell Epitopes in a Swine Influenza Model. PLoS ONE 2019, 11, e0159237. [Google Scholar] [CrossRef] [Green Version]
- Pedersen, L.E.; Breum, S.Ø.; Riber, U.; Larsen, L.E.; Jungersen, G. Identification of swine influenza virus epitopes and analysis of multiple specificities expressed by cytotoxic T cell subsets. Virol. J. 2014, 11, 163. [Google Scholar] [CrossRef]
- Baratelli, M.; Pedersen, L.E.; Trebbien, R.; Larsen, L.E.; Jungersen, G.; Blanco, E.; Nielsen, J.; Montoya, M. Identification of cross-reacting T-cell epitopes in structural and non-structural proteins of swine and pandemic H1N1 influenza A virus strains in pigs. J. Gen. Virol. 2017, 98, 895–899. [Google Scholar] [CrossRef]
- Bioinformatics, D. NetNGlyc 1.0 Server. 2017. Available online: http://www.cbs.dtu.dk/services/NetNGlyc/ (accessed on 23 July 2019).
- Rambaut, A.; Lam, T.T.; Max Carvalho, L.; Pybus, O.G. Exploring the temporal structure of heterochronous sequences using TempEst (formerly Path-O-Gen). Virus Evol. 2016, 2, vew007. [Google Scholar] [CrossRef] [PubMed] [Green Version]
- Bouckaert, R.; Heled, J.; Kühnert, D.; Vaughan, T.; Wu, C.H.; Xie, D.; Suchard, M.A.; Rambaut, A.; Drummond, A.J. BEAST 2: A software platform for Bayesian evolutionary analysis. PLoS Comput. Biol. 2014, 10, e1003537. [Google Scholar] [CrossRef] [PubMed] [Green Version]
- Ryt-Hansen, P.; Pedersen, A.G.; Larsen, I.; Krog, J.S.; Kristensen, C.S.; Larsen, L.E. Acute Influenza A virus outbreak in an enzootic infected sow herd: Impact on viral dynamics, genetic and antigenic variability and effect of maternally derived antibodies and vaccination. PLoS ONE 2019. [Google Scholar] [CrossRef] [PubMed]
- Rambaut, A.; Drummond, A.J.; Xie, D.; Baele, G.; Suchard, M.A. Posterior Summarization in Bayesian Phylogenetics Using Tracer 1.7. Syst. Biol. 2018, 67, 901–904. [Google Scholar] [CrossRef] [Green Version]
- Yang, Z. PAML 4: Phylogenetic Analysis by Maximum Likelihood. Mol. Biol. Evol. 2007, 24, 1586–1591. [Google Scholar] [CrossRef] [Green Version]
- Yang, Z. Likelihood ratio tests for detecting positive selection and application to primate lysozyme evolution. Mol. Biol. Evol. 1998, 15, 568–573. [Google Scholar] [CrossRef]
- Burnham, K. Model Selection and Multimodel Inference; Burnham, K.P., Anderson, D.R., Eds.; Springer: New York, NY, USA, 2004; ISBN 978-0-387-95364-9. [Google Scholar]
- Ronquist, F.; Teslenko, M.; van der Mark, P.; Ayres, D.L.; Darling, A.; Höhna, S.; Larget, B.; Liu, L.; Suchard, M.A.; Huelsenbeck, J.P. MrBayes 3.2: efficient Bayesian phylogenetic inference and model choice across a large model space. Syst. Biol. 2012, 61, 539–542. [Google Scholar] [CrossRef] [Green Version]
- Rambaut, A. FigTree. Available online: http://tree.bio.ed.ac.uk/software/figtree/ (accessed on 6 June 2019).
- R Core Team (2019). R: A language and environment for statistical computing. R Foundation for Statistical Computing, Vienna, Austria. 2019. Available online: https://www.R-project.org/http:/ (accessed on 14 February 2020).
- Yu, G.; Smith, D.K.; Zhu, H.; Guan, Y.; Lam, T.T.Y. ggtree: an r package for visualization and annotation of phylogenetic trees with their covariates and other associated data. Methods Ecol. Evol. 2017. [Google Scholar] [CrossRef]
- Yu, G.; Lam, T.T.Y.; Zhu, H.; Guan, Y. Two methods for mapping and visualizing associated data on phylogeny using GGTree. Mol. Biol. Evol. 2018. [Google Scholar] [CrossRef]
- Wang, L.; Lam, T.T.; Xu, S.; Dai, Z.; Zhou, L.; Feng, T.; Guo, P.; Dunn, C.W.; Jones, B.R.; Bradley, T.; et al. treeio: An R package for phylogenetic tree input and output with richly annotated and associated data. Mol. Biol. Evol. 2020, 37, 599–603. [Google Scholar] [CrossRef]
- Wickham, H.; Averick, M.; Bryan, J.; Chang, W.; McGowan, L.D.; François, R.; Grolemund, G.; Hayes, A.; Henry, L.; Hester, J.; et al. Welcome to the tidyverse. J. Open Source Softw. 1686, 4. [Google Scholar] [CrossRef]
- GraphPad software. Available online: https://www.graphpad.com/quickcalcs/ (accessed on 6 June 2018).
- Pedersen, A.G. Chi-squared table. Available online: http://www.cbs.dtu.dk/dtucourse/cookbooks/gorm/phd.phylo.prob/chi-squared.html (accessed on 1 August 2019).
- Harder, T.C.; grosse Beilage, E.; Lange, E.; Meiners, C.; Dohring, S.; Pesch, S.; Noe, T.; Grund, C.; Beer, M.; Starick, E. Expanded Cocirculation of Stable Subtypes, Emerging Lineages, and New Sporadic Reassortants of Porcine Influenza Viruses in Swine Populations in Northwest Germany. J. Virol. 2013, 87, 10460–10476. [Google Scholar] [CrossRef] [PubMed] [Green Version]
- Diaz, A.; Marthaler, D.; Corzo, C.; Muñoz-Zanzi, C.; Sreevatsan, S.; Culhane, M.; Torremorell, M. Multiple Genome Constellations of Similar and Distinct Influenza A Viruses Co-Circulate in Pigs During Epidemic Events. Sci. Rep. 2017, 7, 11886. [Google Scholar] [CrossRef] [PubMed]
- Subcommittee, A. REPORT Control of porcine reproductive and respiratory syndrome (PRRS) virus. Swine Health Prod. 2014, 4. [Google Scholar]
- Nelson, M.I.; Holmes, E.C. The evolution of epidemic influenza. Nat. Rev. Genet. 2007, 8, 196–205. [Google Scholar] [CrossRef] [PubMed]
- Fitch, W.M.; Leiter, J.M.; Li, X.Q.; Palese, P. Positive Darwinian evolution in human influenza A viruses. Proc. Natl. Acad. Sci. 1991, 88, 4270–4274. [Google Scholar] [CrossRef] [PubMed] [Green Version]
- McHardy, A.C.; Adams, B. The Role of Genomics in Tracking the Evolution of Influenza A Virus. PLoS Pathog. 2009, 5, e1000566. [Google Scholar] [CrossRef] [PubMed] [Green Version]
- Wilson, I.A.; Cox, N.J. Structural Basis of Immune Recognition of Influenza Virus Hemagglutinin. Annu. Rev. Immunol. 1990, 8, 737–787. [Google Scholar] [CrossRef]
- Rejmanek, D.; Hosseini, P.R.; Mazet, J.A.K.; Daszak, P.; Goldstein, T. Evolutionary Dynamics and Global Diversity of Influenza A Virus. J. Virol. 2015, 89, 10993–11001. [Google Scholar]
- Aiewsakun, P.; Katzourakis, A. Time-Dependent Rate Phenomenon in Viruses. J. Virol. 2016, 90, 7184–7195. [Google Scholar]
- Meyer, A.G.; Spielman, S.J.; Bedford, T.; Wilke, C.O. Time dependence of evolutionary metrics during the 2009 pandemic influenza virus outbreak. Virus Evol. 2015, 1, vev006. [Google Scholar] [CrossRef]
- Ho, S.Y.W.; Lanfear, R.; Bromham, L.; Phillips, M.J.; Soubrier, J.; Rodrigo, A.G.; Cooper, A. Time-dependent rates of molecular evolution. Mol. Ecol. 2011, 20, 3087–3101. [Google Scholar] [CrossRef] [PubMed]
- Jenkins, G.M.; Rambaut, A.; Pybus, O.G.; Holmes, E.C. Rates of Molecular Evolution in RNA Viruses: A Quantitative Phylogenetic Analysis. J. Mol. Evol. 2002, 54, 156–165. [Google Scholar] [CrossRef] [PubMed]
- Bragstad, K.; Nielsen, L.P.; Fomsgaard, A. The evolution of human influenza A viruses from 1999 to 2006 - a complete genome study. Virol. J. 2008, 5, 40. [Google Scholar] [CrossRef] [PubMed] [Green Version]
- Garten, R.J.; Davis, C.T.; Russell, C.A.; Shu, B.; Lindstrom, S.; Balish, A.; Sessions, W.M.; Xu, X.; Skepner, E.; Deyde, V.; et al. Antigenic and Genetic Characteristics of Swine-Origin 2009 A(H1N1) Influenza Viruses Circulating in Humans. Science 2009, 325, 197–201. [Google Scholar] [CrossRef] [Green Version]
- Mena, I.; Nelson, M.I.; Quezada-Monroy, F.; Dutta, J.; Cortes-Fernández, R.; Lara-Puente, J.H.; Castro-Peralta, F.; Cunha, L.F.; Trovão, N.S.; Lozano-Dubernard, B.; et al. Origins of the 2009 H1N1 influenza pandemic in swine in Mexico. Elife 2016, 5. [Google Scholar] [CrossRef]
- Diaz, A.; Marthaler, D.; Culhane, M.; Sreevatsan, S.; Alkhamis, M.; Torremorell, M. Complete Genome Sequencing of Influenza A Viruses within Swine Farrow-to-Wean Farms Reveals the Emergence, Persistence, and Subsidence of Diverse Viral Genotypes. J. Virol. 2017, 91, e00745-17. [Google Scholar] [CrossRef] [Green Version]


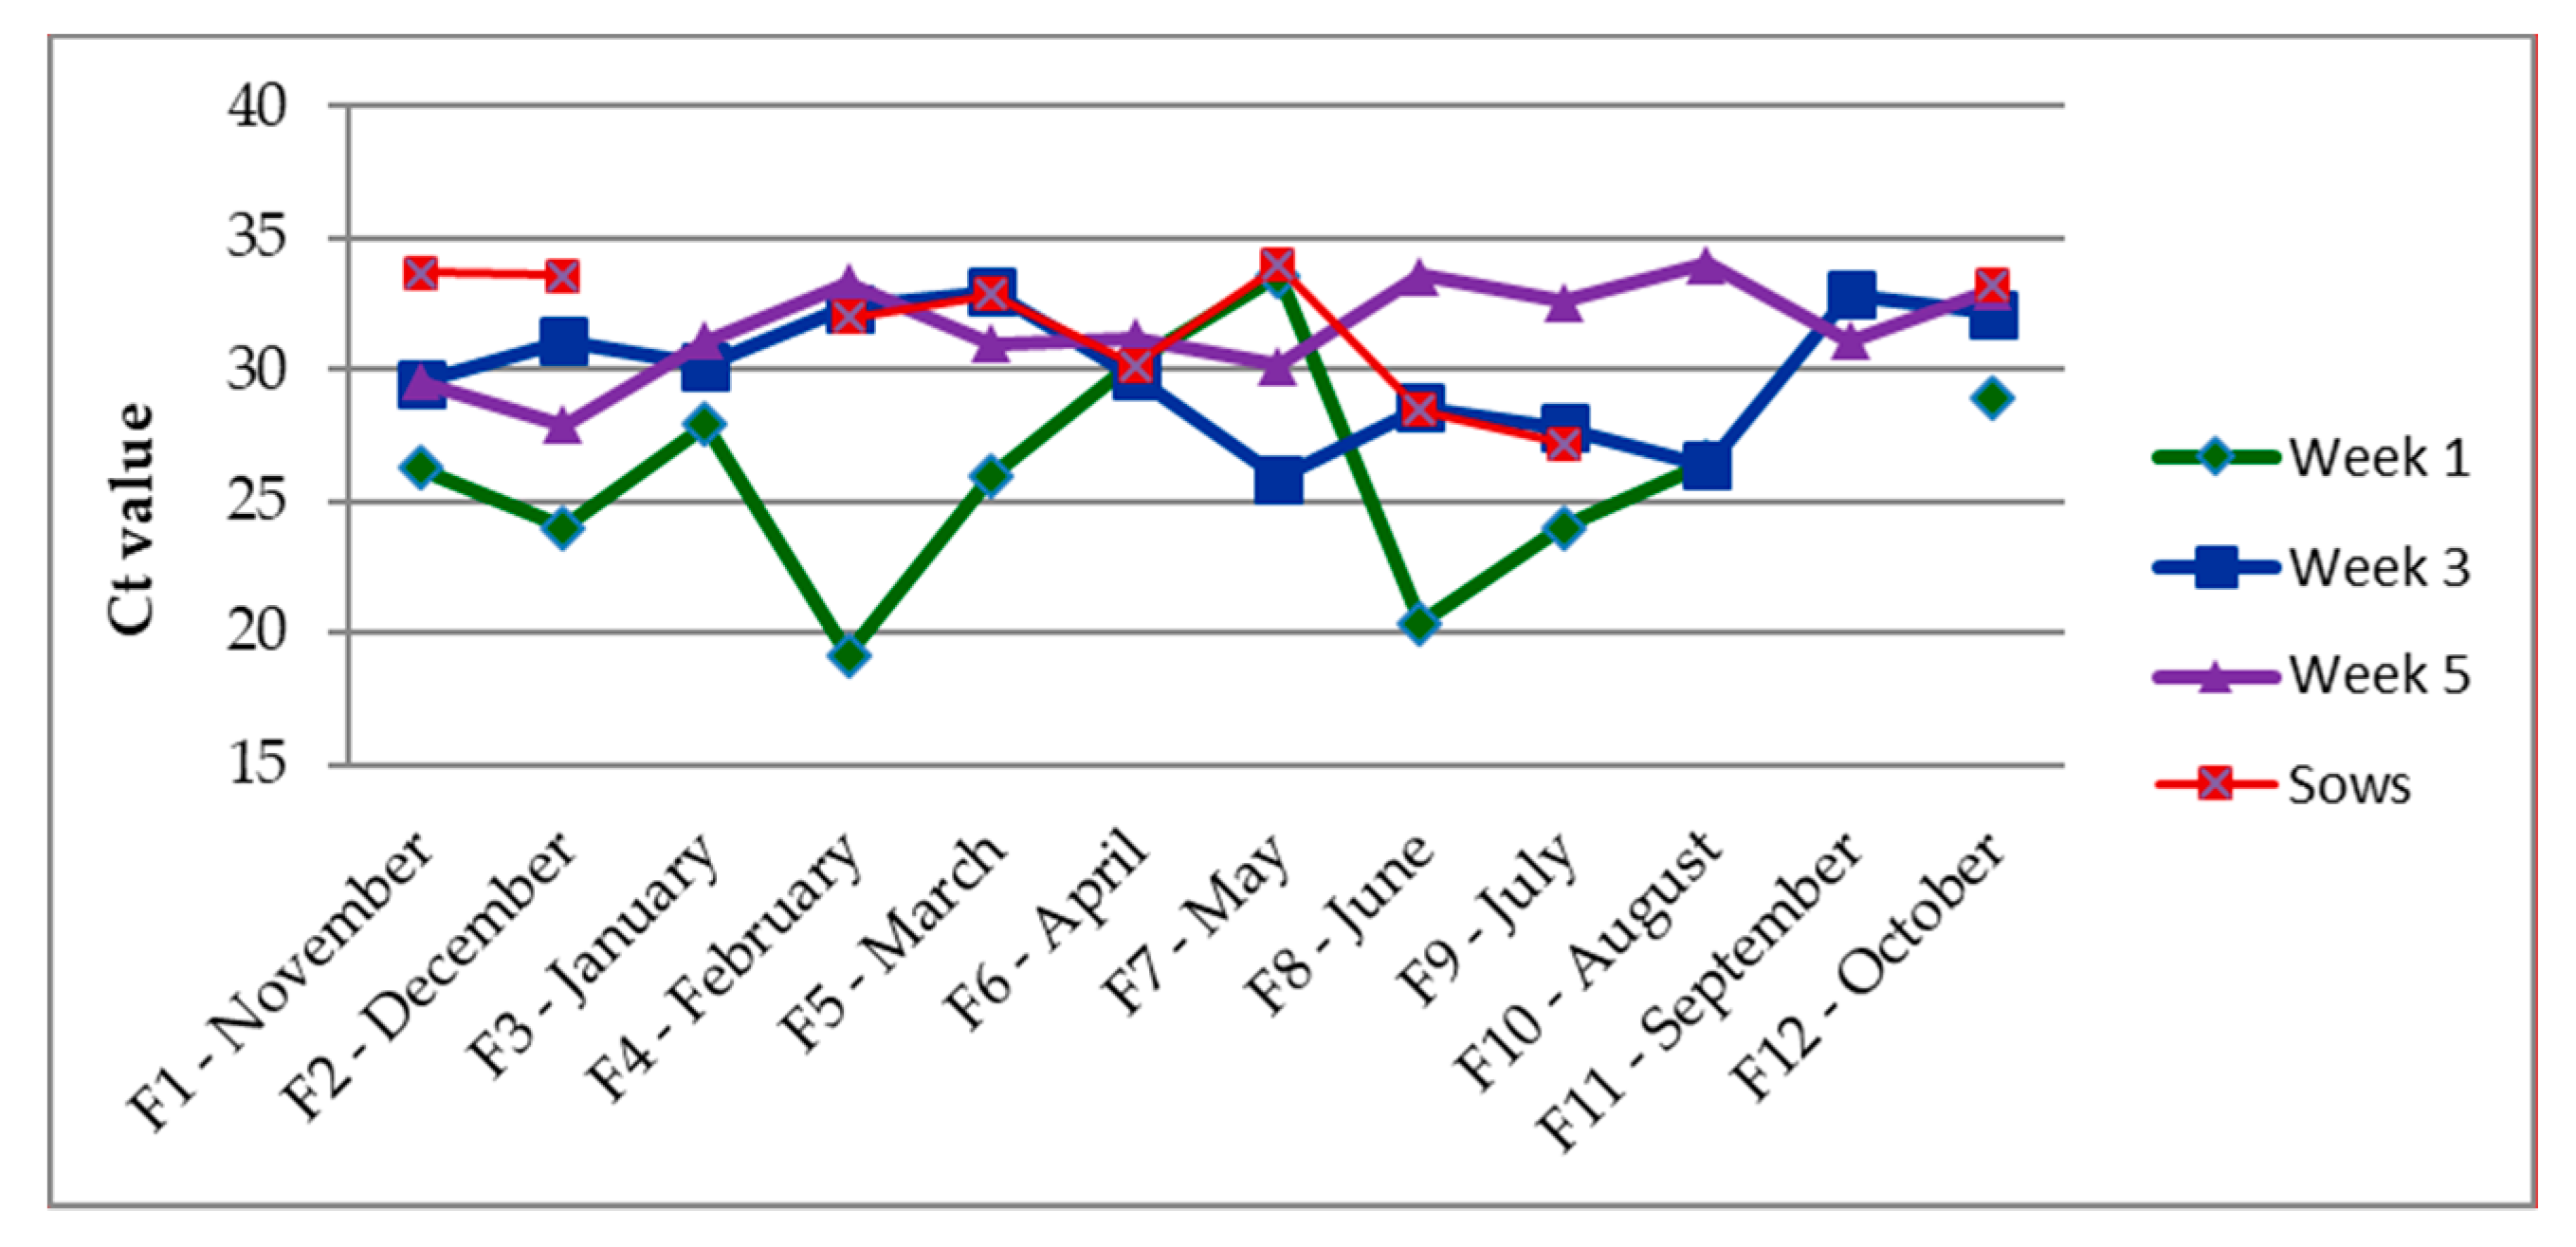
| Week 1 | Week 3 | Week 5 | Sows | |
|---|---|---|---|---|
| Nov | 75% (3/4) | 100% (4/4) | 75% (3/4) | 50% (2/4) |
| Dec | 75% (3/4) | 75% (3/4) | 25% (1/4) | 50% (2/4) |
| Jan | 100% (4/4) | 75% (3/4) | 100% (4/4) | 0% (0/4) |
| Feb | 75% (3/4) | 50% (2/4) | 100% (4/4) | 75% (3/4) |
| Mar | 75% (3/4) | 75% (3/4) | 50% (2/4) | 100% (4/4) |
| Apr | 50% (2/4) | 75% (3/4) | 75% (3/4) | 25% (1/4) |
| May | 100% (4/4) | 50% (2/4) | 75% (3/4) | 25% (1/4) |
| Jun | 25% (1/4) | 25% (1/4) | 25% (1/4) | 25% (1/4) |
| Jul | 25% (1/4) | 100% (4/4) | 75% (3/4) | 25% (1/4) |
| Aug | 50% (2/4) | 100% (4/4) | 50% (2/4) | 0% (0/4) |
| Sep | 0% (0/4) | 50% (2/4) | 50% (2/4) | 0% (0/4) |
| Oct | 75% (3/4) | 50% (2/4) | 25% (1/4) | 25% (1/4) |
| Total | 60.5% (29/48) | 70.8% (34/48) | 60.5% (29/48) | 33.3% (16/48) |
| Week 1 | Week 3 | Week 5 | Total | |
|---|---|---|---|---|
| IAV Positive | 0.12 (SD = 0.14) | 0.36 (SD = 0.27) | 0.09 (SD = 0.08) | 0.32 (SD = 0.23) |
| IAV Negative | 0.05 (SD = 0.08) | 0.30 (SD = 027) | 0.06 (SD = 0.04) | 0.12 (SD = 0.17) |
| p-value | 0.07 | 0.48 | 0.12 | 0.03 |
| M1a | M2a | Significant Difference | Correlation Coefficient | Substitution Rate | |||
|---|---|---|---|---|---|---|---|
| AIC | Akaike Weight | AIC | Akaike Weight | p-Value | |||
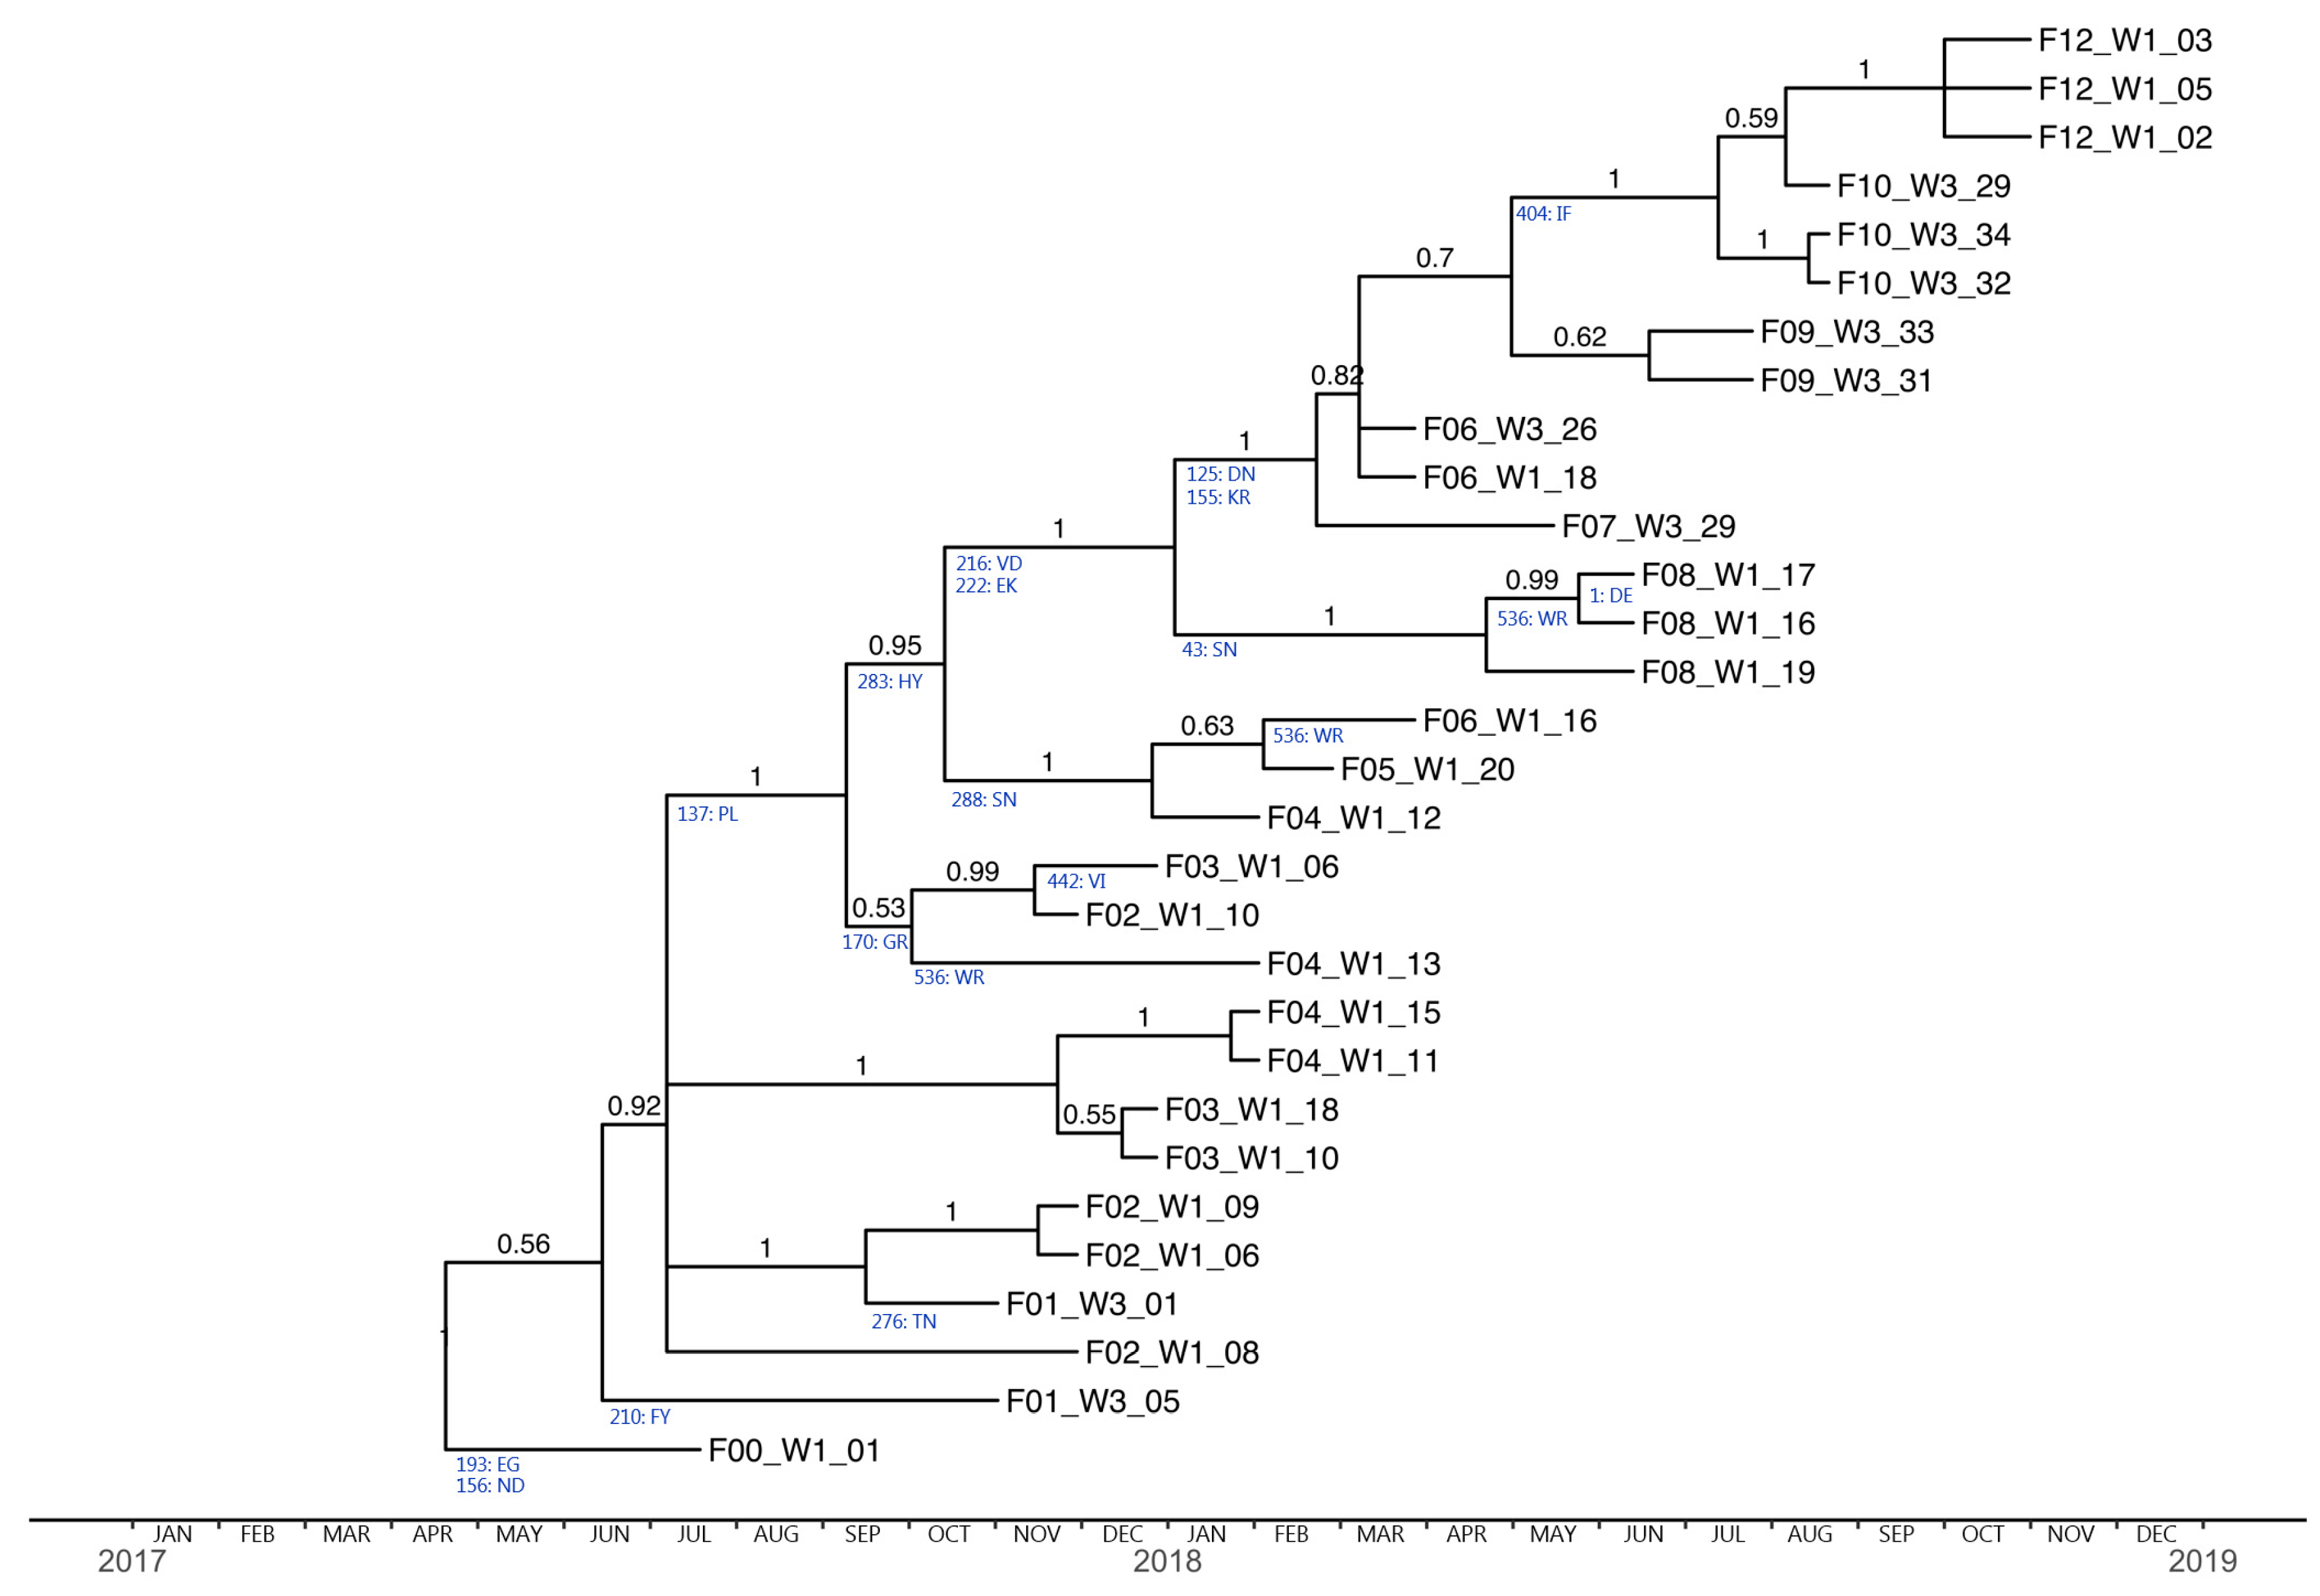
| HA | 5494.30 | 0.1143 | 5490.20 | 0.8857 | <0.05 | 0.95 | 7.6 × 10⁻³ |
| NA | 4203.24 | 0.9478 | 4209.06 | 0.0521 | >0.05 | 0.81 | 6.9 × 10⁻³ |
| M | 2866.58 | 0.8810 | 2870.58 | 0.1189 | >0.05 | 0.82 | 2.5 × 10⁻³ |
| NS | 2531.02 | 0.8810 | 2535.02 | 0.1189 | >0.05 | 0.68 | 5.7 × 10⁻³ |
| NP | 4310.14 | 0.8810 | 4314.14 | 0.1189 | >0.05 | 0.77 | 1.1 × 10⁻³ |
| PB1 | 6595.06 | 0.8810 | 6599.06 | 0.1189 | >0.05 | 0.86 | 2.47 × 10⁻³ |
| PB2 | 6459.84 | 0.8810 | 6463.84 | 0.1189 | >0.05 | 0.94 | 2.94 × 10⁻³ |
| PA | 6170.36 | 0.8810 | 6174.36 | 0.1189 | >0.05 | 0.60 | 2.13 × 10⁻³ |
| Position (from DTLC) | Mutation | dN/dS Ratio | PR+ | Sequences Showing the Mutation | Antigenic Site/Epitope/Glycosylation Site |
|---|---|---|---|---|---|
| 1 | D→E | 0.7982 | 0.2721 | 1/3 F8 | T-cell |
| 43 | S→N | 0.8255 | 0.2837 | 3/3 F8 | B-cell |
| 125 | D→N | 0.7816 | 0.2651 | 2/3 F6, 1/1 F7 and all F9-F12 | Sa |
| 137 | P→L | 0.8791 | 0.3065 | 1/4 F2, 1/3 F3, 2/4 F4 and all F5–F12 | Ca1 |
| 155 | K→R | 0.7672 | 0.2588 | 2/3 F6, 1/1 F7 and all F9–F12 | Sa |
| 156 | N→D | 0.7991 | 0.2725 | All F1-F12 | Ca1 |
| 170 | G→R | 0.8784 | 0.3062 | 1/4 F2 and 1/3 F3 | Ca1 |
| 193 | E→G | 0.8746 | 0.3046 | All F1–F12 | Sb |
| 210 | F→Y | 0.8215 | 0.2820 | 1/2 F1 | B-cell epitope |
| 216 | V→D | 0.8407 | 0.2903 | 2/3 F6 and all F7–F12 | B-cell epitope |
| 222 | E→K | 0.7717 | 0.2607 | 2/3 F6 and all F7–F12 | Ca2 |
| 276 | T→N | 0.8282 | 0.2849 | 1/2 F1 | Glyco |
| 283 | H→Y | 0.8402 | 0.2898 | 1/4 F4 and all F5–F12 | - |
| 288 | S→N | 0.8255 | 0.2838 | 1/4 F4, 1/1 F5 and 1/3 F6 | - |
| 404 | I→F | 0.8102 | 0.2773 | All F10–F12 | T-cell epitope |
| 442 | V→I | 0.8036 | 0.2745 | 1/3 F3 | T-cell epitope |
| 536 | W→R | 3.156 1.5882 | 0.879 0.6380 | 1/4 F4, 1/3 F6 and 2/3 F8 | B-cell and T-cell epitope |
© 2020 by the authors. Licensee MDPI, Basel, Switzerland. This article is an open access article distributed under the terms and conditions of the Creative Commons Attribution (CC BY) license (http://creativecommons.org/licenses/by/4.0/).
Share and Cite
Ryt-Hansen, P.; Pedersen, A.G.; Larsen, I.; Kristensen, C.S.; Krog, J.S.; Wacheck, S.; Larsen, L.E. Substantial Antigenic Drift in the Hemagglutinin Protein of Swine Influenza A Viruses. Viruses 2020, 12, 248. https://0-doi-org.brum.beds.ac.uk/10.3390/v12020248
Ryt-Hansen P, Pedersen AG, Larsen I, Kristensen CS, Krog JS, Wacheck S, Larsen LE. Substantial Antigenic Drift in the Hemagglutinin Protein of Swine Influenza A Viruses. Viruses. 2020; 12(2):248. https://0-doi-org.brum.beds.ac.uk/10.3390/v12020248
Chicago/Turabian StyleRyt-Hansen, Pia, Anders Gorm Pedersen, Inge Larsen, Charlotte Sonne Kristensen, Jesper Schak Krog, Silke Wacheck, and Lars Erik Larsen. 2020. "Substantial Antigenic Drift in the Hemagglutinin Protein of Swine Influenza A Viruses" Viruses 12, no. 2: 248. https://0-doi-org.brum.beds.ac.uk/10.3390/v12020248