A High-Throughput HIV-1 Drug Screening Platform, Based on Lentiviral Vectors and Compatible with Biosafety Level-1

 , , , and
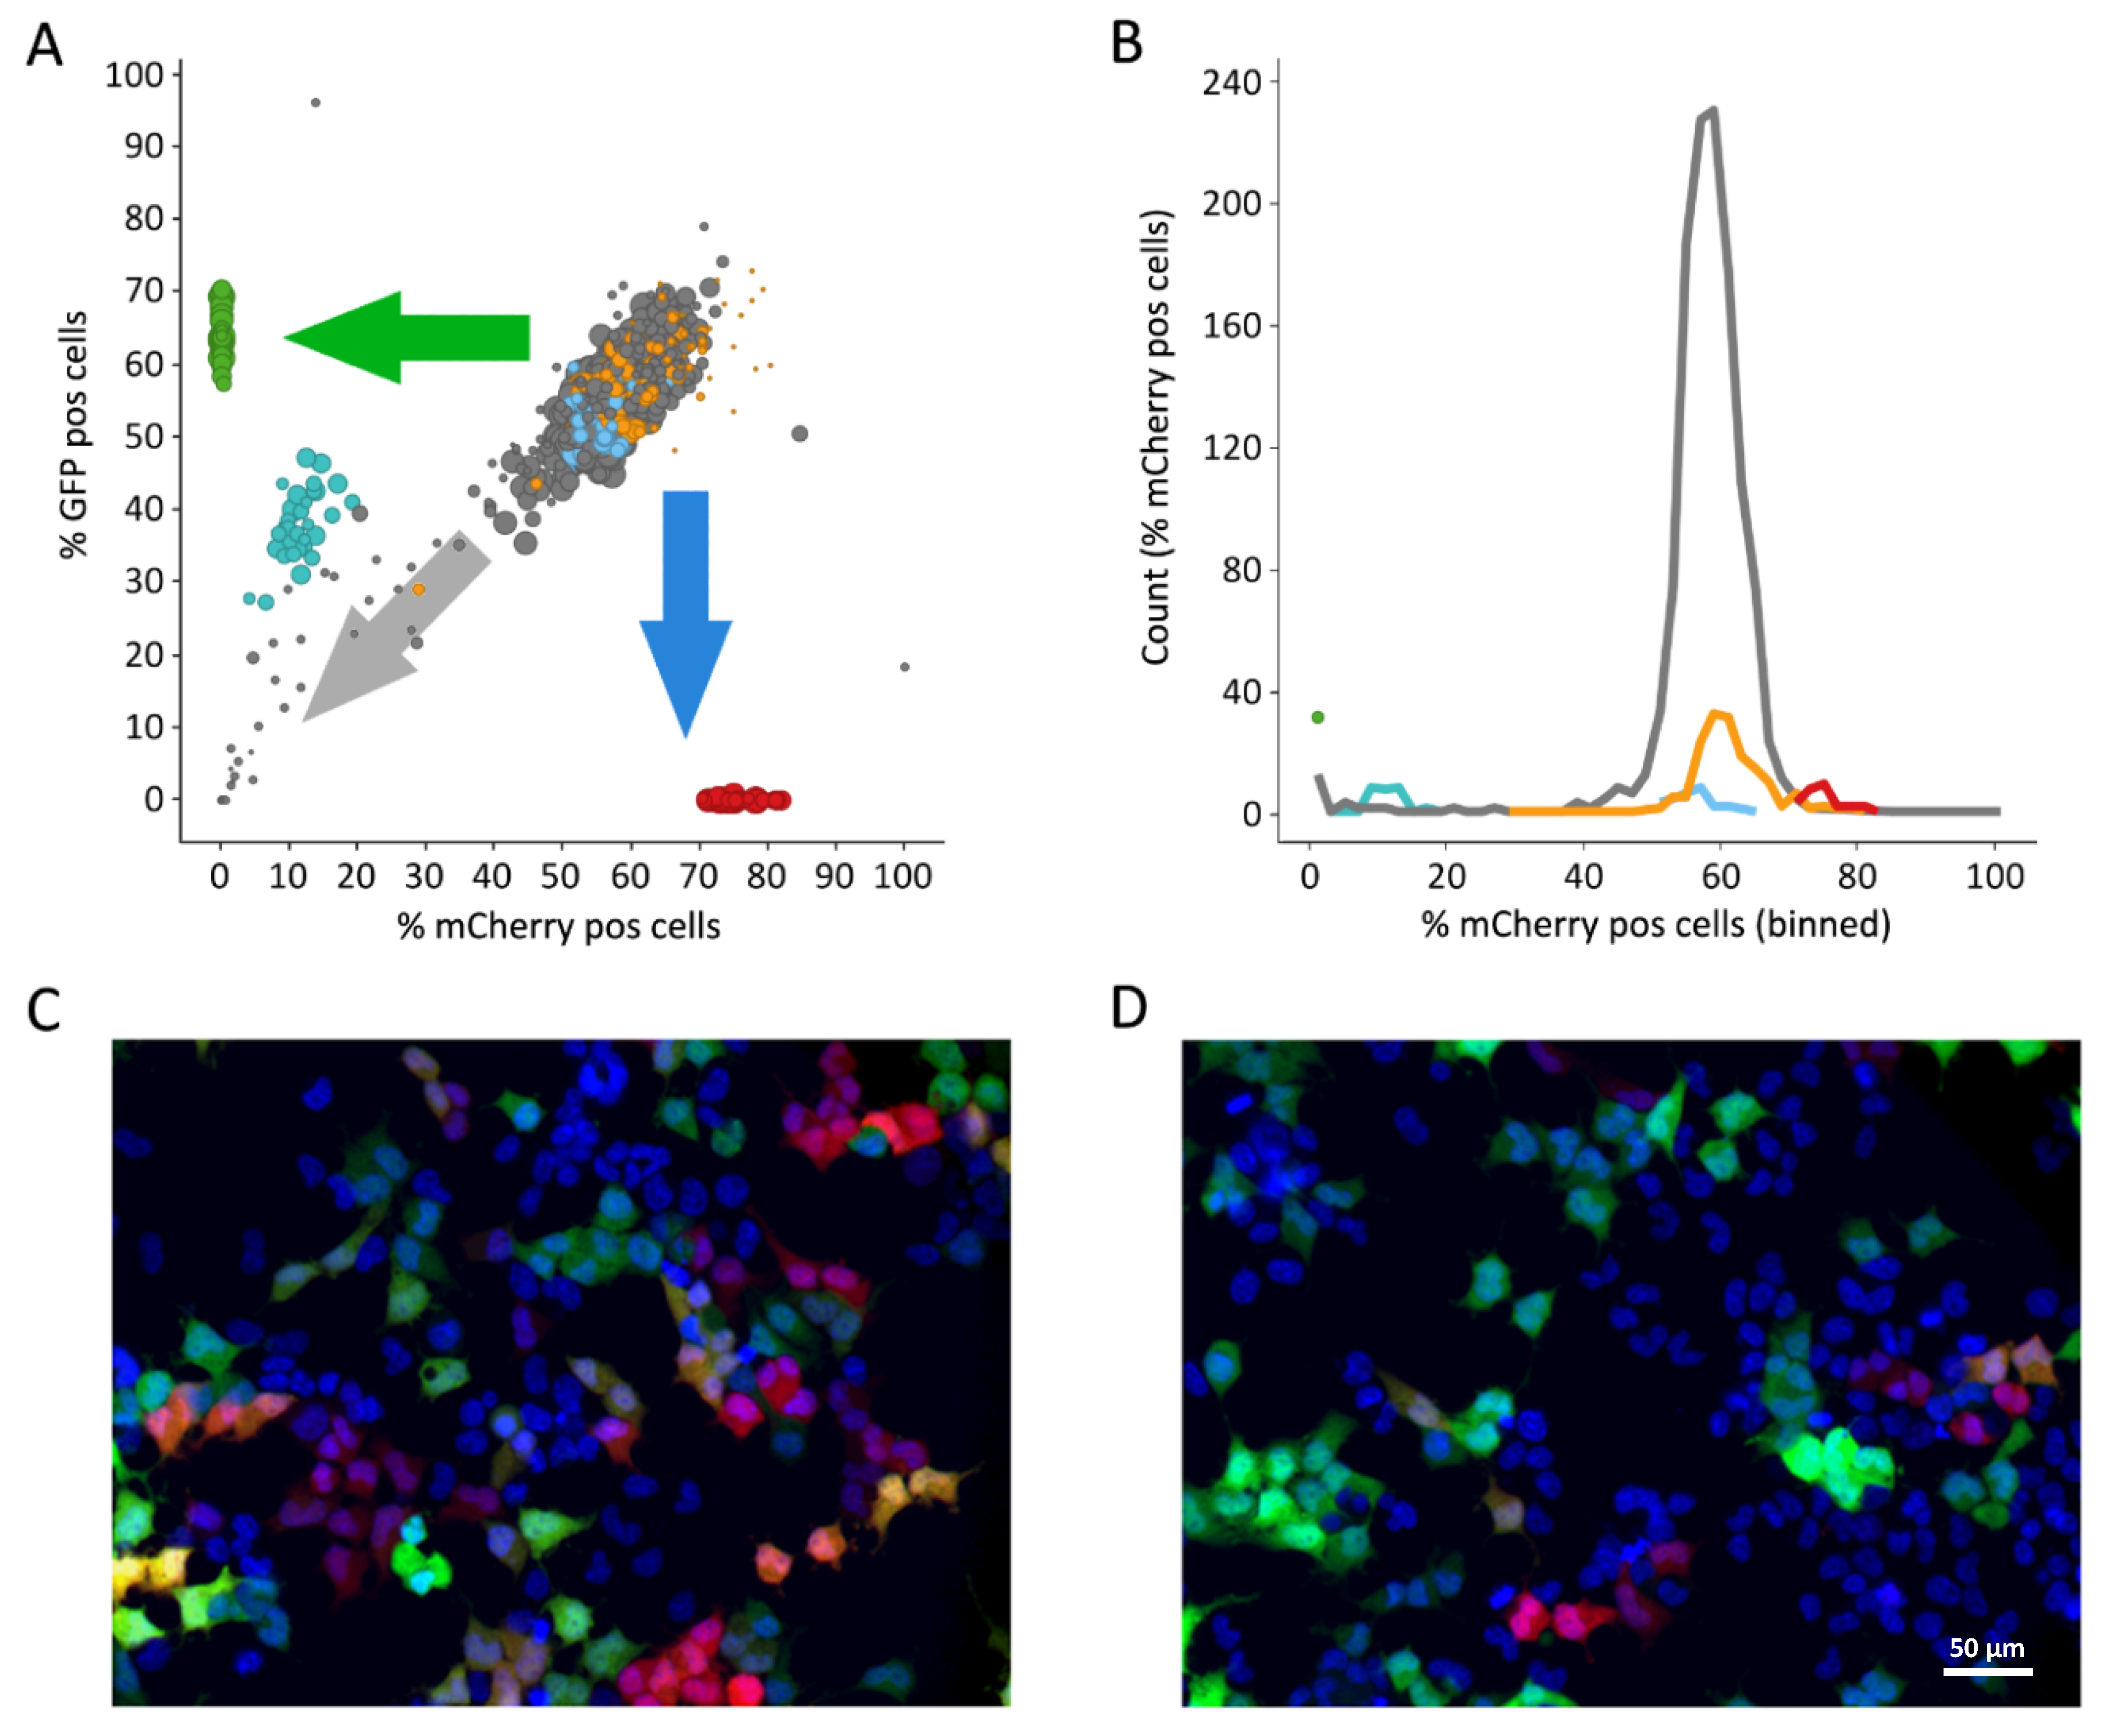
Abstract
:1. Introduction
2. Materials and Methods
2.1. Cultivation of HEK293T-mCat1 and PM1-mCat1 Cells
2.2. Cloning of Self-Inactivating Lentiviral Vectors Expressing Luciferase or mCat1
2.3. Production of Viral Particles
2.4. Generation of HEK293T-mCat1 and PM1-mCat1 Cells
2.5. Viral Screening Using Fluorescence-Based Vectors
2.6. Viral Screening Using Luciferase-Based Vectors
2.7. Flow-Cytometry Based Small-Molecule Inhibitor Analysis
2.8. Library Selection for High-Throughput Screening
2.9. High-Throughput Screening Using Luciferase-Based Vectors
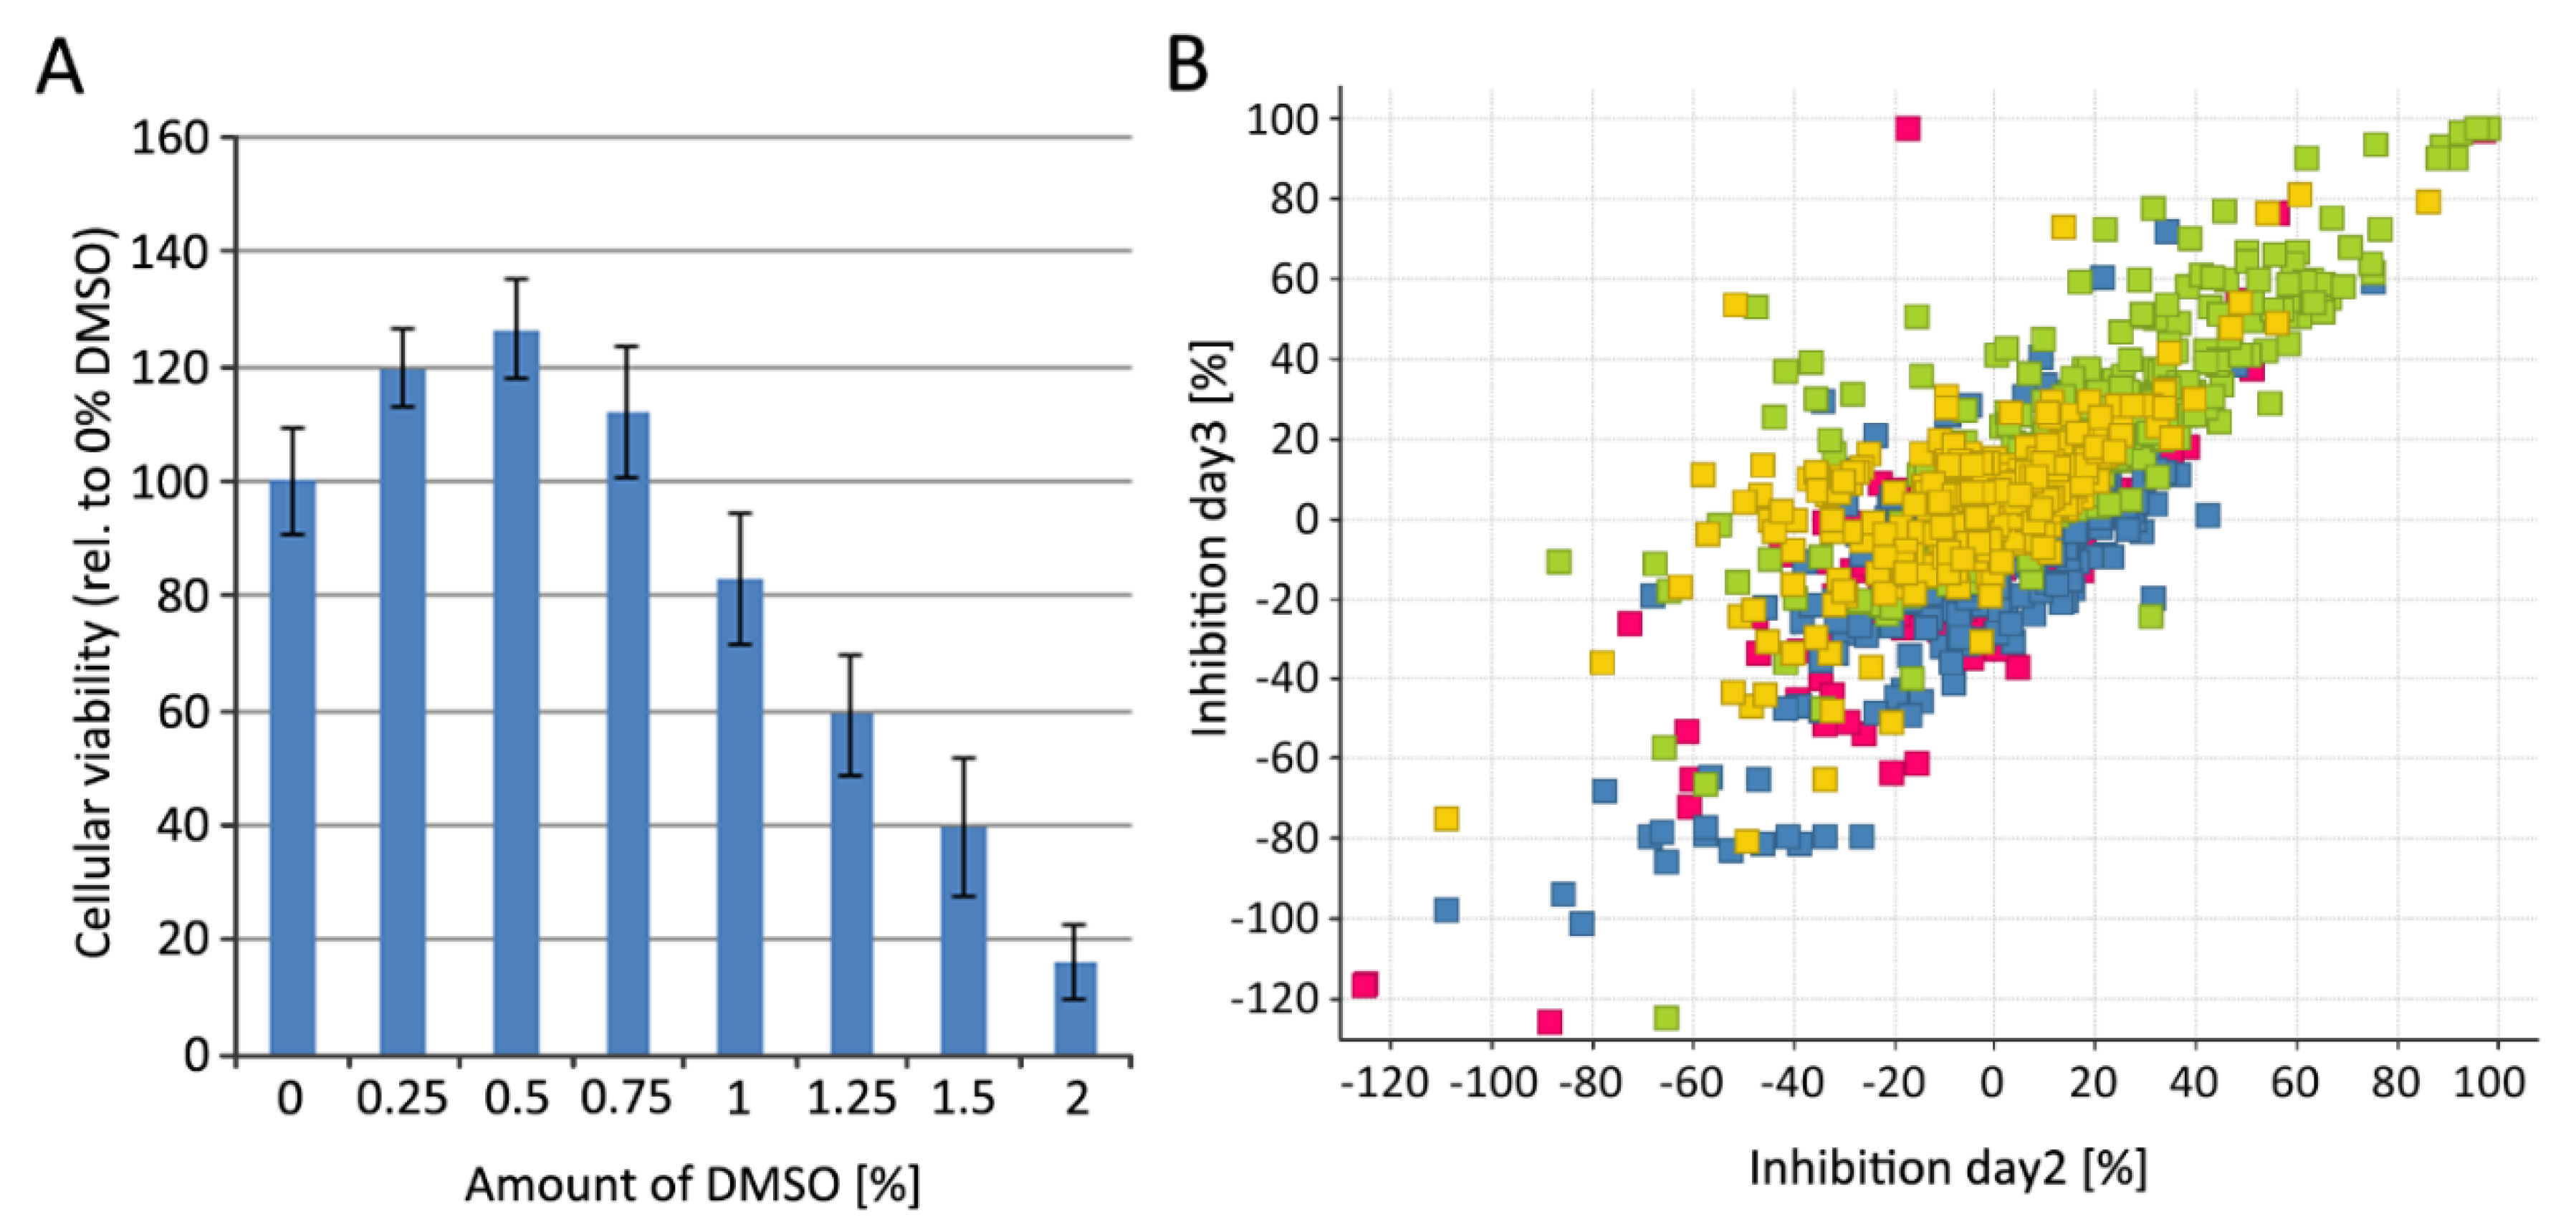
2.10. Cytotoxicity Determination Using HEK293T-mCat1 and PM1-mCat1 Cell Line
3. Results
3.1. Fluorescence-Based Proof-of-Concept Screen
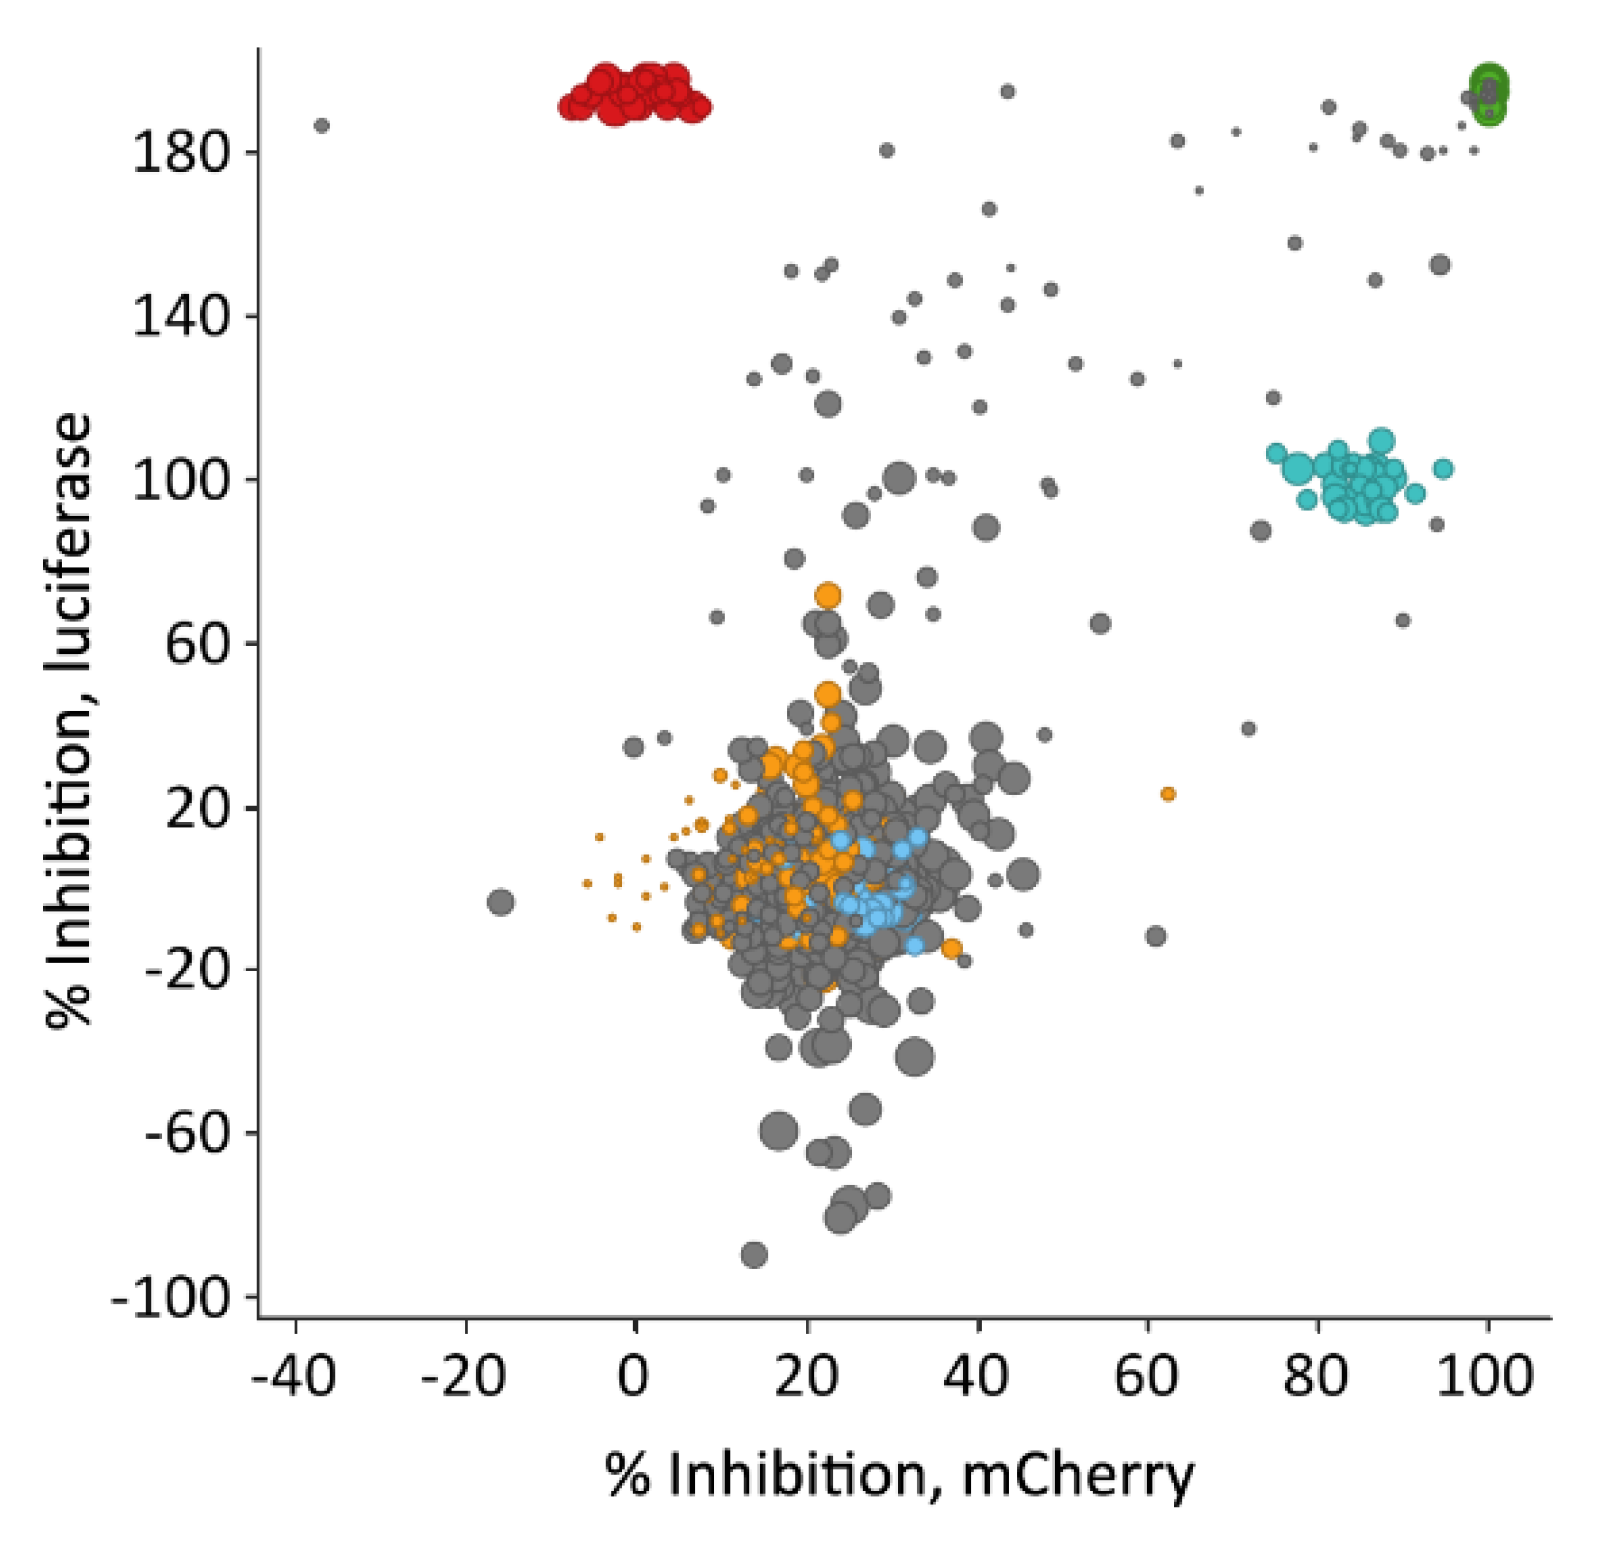
3.2. Luciferase-Based Screening Using HEK293T-mCat1 Cells
3.3. Development of a Luciferase-Based Screening Assay Using PM1-mCat1 Cells
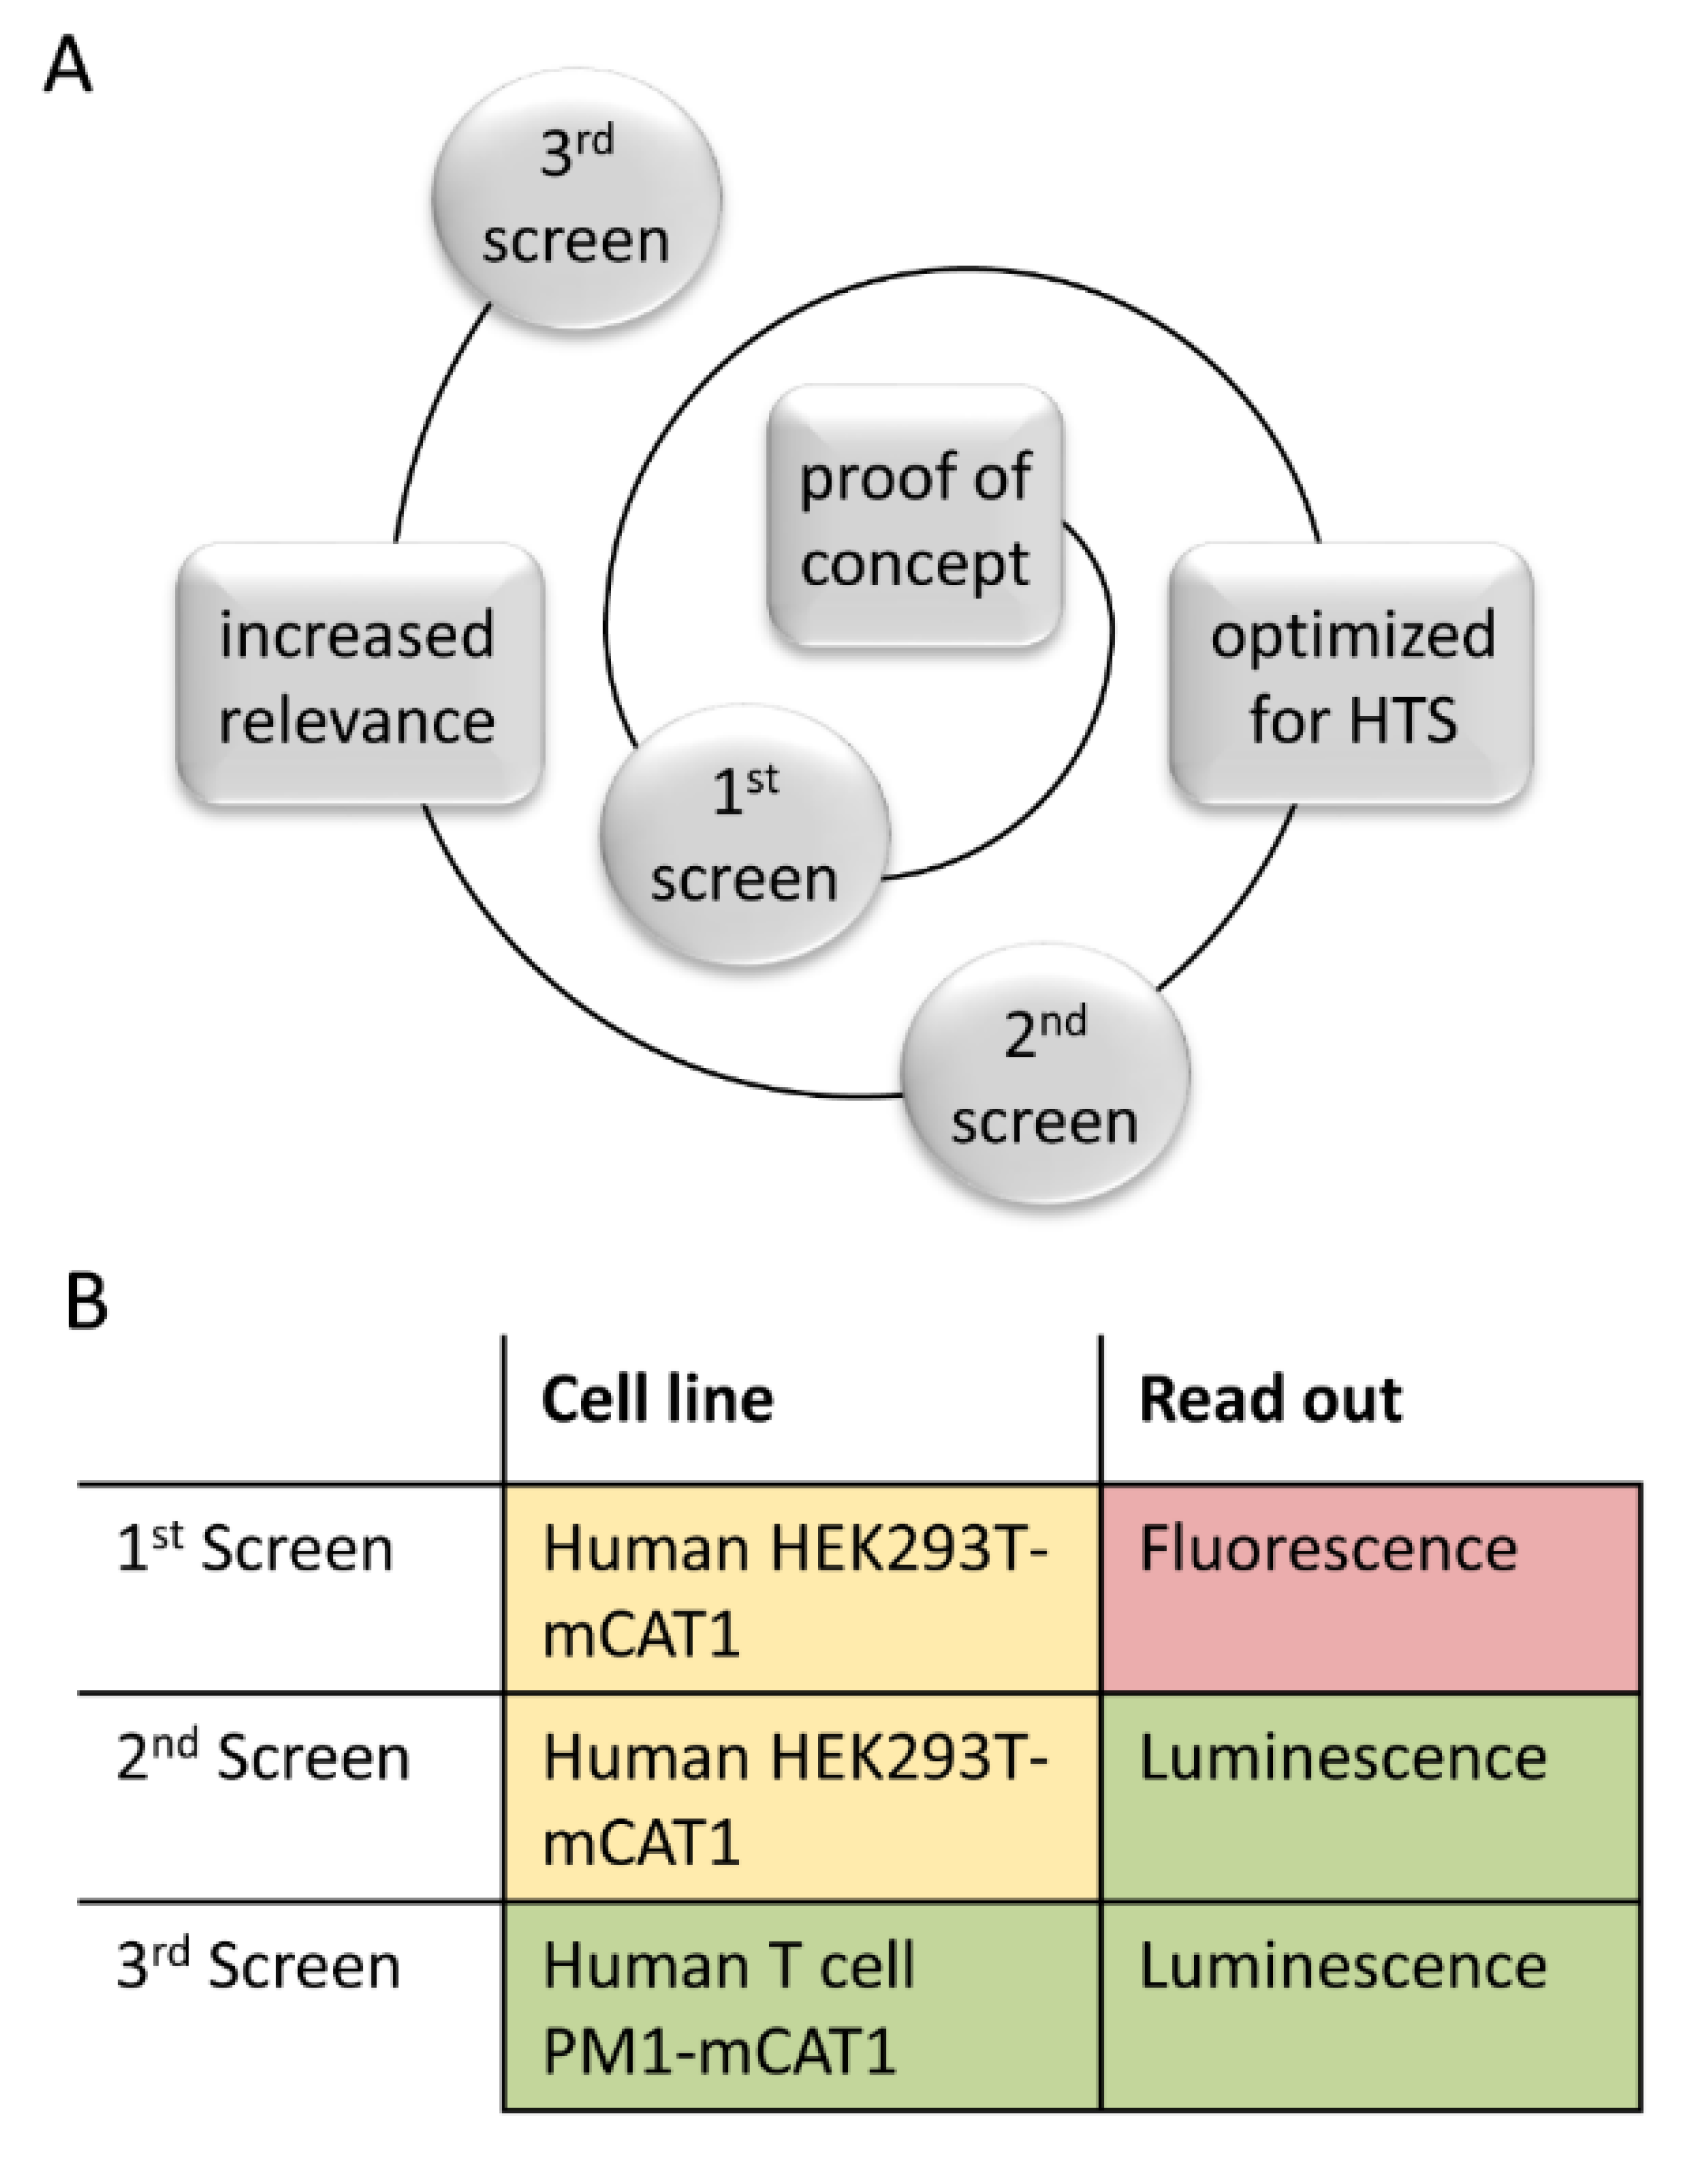
3.4. Step-Wise Establishment of a BSL-1 Compatible HTS Assay
3.5. Library Selection and Screening Using the PM1-mCat1-Based HTS Format
3.6. Hit Profiling
4. Discussion
Supplementary Materials
Author Contributions
Funding
Acknowledgments
Conflicts of Interest
References
- Ostertag, W.; Roesler, G.; Krieg, C.J.; Kind, J.; Cole, T.; Crozier, T.; Gaedicke, G.; Steinheider, G.; Kluge, N.; Dube, S. Induction of Endogenous Virus and of Thymidine Kinase by Bromodeoxyuridine in Cell Cultures Transformed by Friend Virus. Proc. Natl. Acad. Sci. USA 1974, 71, 4980–4985. [Google Scholar] [CrossRef] [PubMed] [Green Version]
- De Bethune, M.-P. Non-nucleoside reverse transcriptase inhibitors (NNRTIs), their discovery, development, and use in the treatment of HIV-1 infection: A review of the last 20 years (1989–2009). Antivir. Res. 2010, 85, 75–90. [Google Scholar] [CrossRef] [PubMed]
- Westby, M.; Nakayama, G.R.; Butler, S.L.; Blair, W.S. Cell-based and biochemical screening approaches for the discovery of novel HIV-1 inhibitors. Antivir. Res. 2005, 67, 121–140. [Google Scholar] [CrossRef] [PubMed]
- Farlow, A.; Long, H.; Arnoux, S.; Sung, W.; Doak, T.G.; Nordborg, M.; Lynch, M. The Spontaneous Mutation Rate in the Fission Yeast Schizosaccharomyces pombe. Genetics 2015, 201, 737–744. [Google Scholar] [CrossRef] [Green Version]
- Huang, K.J.; Wooley, D.P. A new cell-based assay for measuring the forward mutation rate of HIV-1. J. Virol. Methods 2005, 124, 95–104. [Google Scholar] [CrossRef]
- WHO. Global Action Plan on HIV Drug Resistance 2017–2021; World Health Organization: Geneva, Switzerland, 2017. [Google Scholar]
- UNAIDS. The Gap Report; Joint United Nations Programme on HIV/AIDS: Geneva, Switzerland, 2014. [Google Scholar]
- UNAIDS. 90-90-90 An Ambitious Treatment Target to Help end the AIDS Epidemic; Joint United Nations Programme on HIV/AIDS: Geneva, Switzerland, 2014. [Google Scholar]
- Fu, W.; Sanders-Beer, B.E.; Katz, K.S.; Maglott, D.R.; Pruitt, K.D.; Ptak, R.G. Human immunodeficiency virus type 1, human protein interaction database at NCBI. Nucleic Acids Res. 2009, 37, D417–D422. [Google Scholar] [CrossRef] [Green Version]
- Pinney, J.W.; Dickerson, J.E.; Fu, W.; Sanders-Beer, B.E.; Ptak, R.G.; Robertson, D.L. HIV-host interactions: A map of viral perturbation of the host system. AIDS 2009, 23, 549–554. [Google Scholar] [CrossRef]
- Ptak, R.G.; Fu, W.; Sanders-Beer, B.E.; Dickerson, J.E.; Pinney, J.W.; Robertson, D.L.; Rozanov, M.N.; Katz, K.S.; Maglott, D.R.; Pruitt, K.D.; et al. Cataloguing the HIV type 1 human protein interaction network. AIDS Res. Hum. Retrovir. 2008, 24, 1497–1502. [Google Scholar] [CrossRef] [Green Version]
- Vidalain, P.-O.; Tangy, F. Virus-host protein interactions in RNA viruses. Microbes Infect. 2010, 12, 1134–1143. [Google Scholar] [CrossRef] [Green Version]
- White, M.K.; Gorrill, T.S.; Khalili, K. Reciprocal transactivation between HIV-1 and other human viruses. Virology 2006, 352, 1–13. [Google Scholar] [CrossRef] [Green Version]
- Weber, K.; Bartsch, U.; Stocking, C.; Fehse, B. A multicolor panel of novel lentiviral "gene ontology" (LeGO) vectors for functional gene analysis. Mol. Ther. 2008, 16, 698–706. [Google Scholar] [CrossRef] [PubMed]
- Kim, J.W.; Closs, E.I.; Albritton, L.M.; Cunningham, J.M. Transport of cationic amino acids by the mouse ecotropic retrovirus receptor. Nature 1991, 352, 725–728. [Google Scholar] [CrossRef] [PubMed]
- Weber, K.; Mock, U.; Petrowitz, B.; Bartsch, U.; Fehse, B. Lentiviral gene ontology (LeGO) vectors equipped with novel drug-selectable fluorescent proteins: New building blocks for cell marking and multi-gene analysis. Gene Ther. 2010, 17, 511–520. [Google Scholar] [CrossRef] [PubMed] [Green Version]
- Prassolov, V.; Hein, S.; Ziegler, M.; Ivanov, D.; Münk, C.; Löhler, J.; Stocking, C. Mus cervicolor murine leukemia virus isolate M813 belongs to a unique receptor interference group. J. Virol. 2001, 75, 4490–4498. [Google Scholar] [CrossRef] [PubMed] [Green Version]
- Rogers, D.; Hahn, M. Extended-connectivity fingerprints. J. Chem. Inf. Model. 2010, 50, 742–754. [Google Scholar] [CrossRef]
- Prokofjeva, M.M.; Riecken, K.; Spirin, P.V.; Yanvarév, D.V.; Düsedau, A.; Ellinger, B.; Fehse, B.; Stocking, C.; Prassolov, V.S. A new system for parallel drug screening against multiple-resistant HIV mutants based on lentiviral self-inactivating (SIN) vectors and multi-colour analyses. AIDS Res. Ther. 2013, 10, 1. [Google Scholar] [CrossRef] [Green Version]
- Andrei, G.; Snoeck, R.; Vandeputte, M.; de Clercq, E. Activities of various compounds against murine and primate polyomaviruses. Antimicrob. Agents Chemother. 1997, 41, 587–593. [Google Scholar] [CrossRef] [Green Version]
- Gray, G.D.; Renis, H.E. A hypothesis relating lymphocyte phosphorylation and transport of ara-C (Cytarabine) to its antiviral activity. J. Theor. Biol. 1973, 39, 623–632. [Google Scholar] [CrossRef]
- Grenader, A.; Healy, D.P. Fenoldopam is a partial agonist at dopamine-1 (DA1) receptors in LLC-PK1 cells. J. Pharm. Exp. Ther. 1991, 258, 193–198. [Google Scholar]
- Oliver, W.C.; Nuttall, G.A.; Cherry, K.J.; Decker, P.A.; Bower, T.; Ereth, M.H. A comparison of fenoldopam with dopamine and sodium nitroprusside in patients undergoing cross-clamping of the abdominal aorta. Anesth. Analg. 2006, 103, 833–840. [Google Scholar] [CrossRef]
- Lusso, P.; Cocchi, F.; Balotta, C.; Markham, P.D.; Louie, A.; Farci, P.; Pal, R.; Gallo, R.C.; Reitz, M.S. Growth of macrophage-tropic and primary human immunodeficiency virus type 1 (HIV-1) isolates in a unique CD4+ T-cell clone (PM1): Failure to downregulate CD4 and to interfere with cell-line-tropic HIV-1. J. Virol. 1995, 69, 3712–3720. [Google Scholar] [CrossRef] [PubMed] [Green Version]
- Schambach, A.; Galla, M.; Modlich, U.; Will, E.; Chandra, S.; Reeves, L.; Colbert, M.; Williams, D.A.; von Kalle, C.; Baum, C. Lentiviral vectors pseudotyped with murine ecotropic envelope: Increased biosafety and convenience in preclinical research. Exp. Hematol. 2006, 34, 588–592. [Google Scholar] [CrossRef] [PubMed]
- Hasenkamp, S.; Sidaway, A.; Devine, O.; Roye, R.; Horrocks, P. Evaluation of bioluminescence-based assays of anti-malarial drug activity. Malar. J. 2013, 12, 58. [Google Scholar] [CrossRef] [PubMed] [Green Version]
- Olesen, C.E.M.; Yan, Y.-X.; Liu, B.; Martin, D.; D’Eon, B.; Judware, R.; Martin, C.; Voyta, J.C.; Bronstein, I. [13] Novel methods for chemiluminescent detection of reporter enzymes. In Applications of Chimeric Genes and Hybrid Proteins. Pt. A, Gene Expression and Protein Purification; Thorner, J.W., Emr, S., Abelson, J.N., Eds.; Academic Press: San Diego, CA, USA; London, UK, 2000; pp. 175–202. [Google Scholar]
- Kremb, S.; Helfer, M.; Heller, W.; Hoffmann, D.; Wolff, H.; Kleinschmidt, A.; Cepok, S.; Hemmer, B.; Durner, J.; Brack-Werner, R. EASY-HIT: HIV full-replication technology for broad discovery of multiple classes of HIV inhibitors. Antimicrob. Agents Chemother. 2010, 54, 5257–5268. [Google Scholar] [CrossRef] [PubMed] [Green Version]
- Yu, K.L.; Bronson, J.J.; Yang, H.; Patick, A.; Alam, M.; Brankovan, V.; Datema, R.; Hitchcock, M.J.; Martin, J.C. Synthesis and antiviral activity of 2’-substituted 9-2-(phosphonomethoxy)ethylguanine analogues. J. Med. Chem. 1993, 36, 2726–2738. [Google Scholar] [CrossRef]
- Canducci, F.; Marinozzi, M.C.; Sampaolo, M.; Boeri, E.; Spagnuolo, V.; Gianotti, N.; Castagna, A.; Paolucci, S.; Baldanti, F.; Lazzarin, A.; et al. Genotypic/phenotypic patterns of HIV-1 integrase resistance to raltegravir. J. Antimicrob. Chemother. 2010, 65, 425–433. [Google Scholar] [CrossRef]
- Temesgen, Z.; Siraj, D.S. Raltegravir: First in class HIV integrase inhibitor. Ther. Clin. Risk Manag. 2008, 4, 493–500. [Google Scholar] [CrossRef] [Green Version]
- Blair, W.S.; Isaacson, J.; Li, X.; Cao, J.; Peng, Q.; Kong, G.F.Z.; Patick, A.K. A novel HIV-1 antiviral high throughput screening approach for the discovery of HIV-1 inhibitors. Antivir. Res. 2005, 65, 107–116. [Google Scholar] [CrossRef]
- Cao, J.; Isaacson, J.; Patick, A.K.; Blair, W.S. High-throughput human immunodeficiency virus type 1 (HIV-1) full replication assay that includes HIV-1 Vif as an antiviral target. Antimicrob. Agents Chemother. 2005, 49, 3833–3841. [Google Scholar] [CrossRef] [Green Version]
- Garcia, J.-M.; Gao, A.; He, P.-L.; Choi, J.; Tang, W.; Bruzzone, R.; Schwartz, O.; Naya, H.; Nan, F.-J.; Li, J.; et al. High-throughput screening using pseudotyped lentiviral particles: A strategy for the identification of HIV-1 inhibitors in a cell-based assay. Antivir. Res. 2009, 81, 239–247. [Google Scholar] [CrossRef] [Green Version]
- Ochsenbauer-Jambor, C.; Jones, J.; Heil, M.; Zammit, K.P.; Kutsch, O. T-cell line for HIV drug screening using EGFP as a quantitative marker of HIV-1 replication. BioTechniques 2006, 40, 91–100. [Google Scholar] [CrossRef] [PubMed] [Green Version]
- Adelson, M.E.; Pacchia, A.L.; Kaul, M.; Rando, R.F.; Ron, Y.; Peltz, S.W.; Dougherty, J.P. Toward the development of a virus-cell-based assay for the discovery of novel compounds against human immunodeficiency virus type 1. Antimicrob. Agents Chemother. 2003, 47, 501–508. [Google Scholar] [CrossRef] [PubMed] [Green Version]
- Planelles, V.; Wolschendorf, F.; Kutsch, O. Facts and fiction: Cellular models for high throughput screening for HIV-1 reactivating drugs. Curr. HIV Res. 2011, 9, 568–578. [Google Scholar] [CrossRef] [PubMed] [Green Version]
- Johnston, J.M.; Denning, G.; Moot, R.; Whitehead, D.; Shields, J.; Le Doux, J.M.; Doering, C.B.; Spencer, H.T. High-throughput screening identifies compounds that enhance lentiviral transduction. Gene Ther. 2014, 21, 1008–1020. [Google Scholar] [CrossRef] [PubMed] [Green Version]
- Hütter, G.; Nowak, D.; Mossner, M.; Ganepola, S.; Müssig, A.; Allers, K.; Schneider, T.; Hofmann, J.; Kücherer, C.; Blau, O.; et al. Long-term control of HIV by CCR5 Delta32/Delta32 stem-cell transplantation. N. Engl. J. Med. 2009, 360, 692–698. [Google Scholar] [CrossRef] [PubMed] [Green Version]
- Carter, N.J.; Keating, G.M. Maraviroc. Drugs 2007, 67, 2277–2288, discussion 2289–2290. [Google Scholar] [CrossRef]
- Kuritzkes, D.R.; Jacobson, J.; Powderly, W.G.; Godofsky, E.; DeJesus, E.; Haas, F.; Reimann, K.A.; Larson, J.L.; Yarbough, P.O.; Curt, V.; et al. Antiretroviral activity of the anti-CD4 monoclonal antibody TNX-355 in patients infected with HIV type 1. J. Infect. Dis. 2004, 189, 286–291. [Google Scholar] [CrossRef]
- Carrington, M.; Bashirova, A.A.; McLaren, P.J. On stand by: Host genetics of HIV control. AIDS 2013, 27, 2831–2839. [Google Scholar] [CrossRef]
- Ammosova, T.; Platonov, M.; Yedavalli, V.R.K.; Obukhov, Y.; Gordeuk, V.R.; Jeang, K.-T.; Kovalskyy, D.; Nekhai, S. Small molecules targeted to a non-catalytic “RVxF” binding site of protein phosphatase-1 inhibit HIV-1. PLoS ONE 2012, 7, e39481. [Google Scholar] [CrossRef]
- Adamson, C.S.; Freed, E.O. Novel approaches to inhibiting HIV-1 replication. Antivir. Res. 2010, 85, 119–141. [Google Scholar] [CrossRef] [Green Version]
- Hou, Y.; McGuinness, D.E.; Prongay, A.J.; Feld, B.; Ingravallo, P.; Ogert, R.A.; Lunn, C.A.; Howe, J.A. Screening for antiviral inhibitors of the HIV integrase-LEDGF/p75 interaction using the AlphaScreen luminescent proximity assay. J. Biomol. Screen 2008, 13, 406–414. [Google Scholar] [CrossRef] [PubMed] [Green Version]
- Arhel, N.; Kirchhoff, F. Host proteins involved in HIV infection: New therapeutic targets. Biochim. Biophys. Acta 2010, 1802, 313–321. [Google Scholar] [CrossRef] [PubMed] [Green Version]


© 2020 by the authors. Licensee MDPI, Basel, Switzerland. This article is an open access article distributed under the terms and conditions of the Creative Commons Attribution (CC BY) license (http://creativecommons.org/licenses/by/4.0/).
Share and Cite
Ellinger, B.; Pohlmann, D.; Woens, J.; Jäkel, F.M.; Reinshagen, J.; Stocking, C.; Prassolov, V.S.; Fehse, B.; Riecken, K. A High-Throughput HIV-1 Drug Screening Platform, Based on Lentiviral Vectors and Compatible with Biosafety Level-1. Viruses 2020, 12, 580. https://0-doi-org.brum.beds.ac.uk/10.3390/v12050580
Ellinger B, Pohlmann D, Woens J, Jäkel FM, Reinshagen J, Stocking C, Prassolov VS, Fehse B, Riecken K. A High-Throughput HIV-1 Drug Screening Platform, Based on Lentiviral Vectors and Compatible with Biosafety Level-1. Viruses. 2020; 12(5):580. https://0-doi-org.brum.beds.ac.uk/10.3390/v12050580
Chicago/Turabian StyleEllinger, Bernhard, Daniel Pohlmann, Jannis Woens, Felix M. Jäkel, Jeanette Reinshagen, Carol Stocking, Vladimir S. Prassolov, Boris Fehse, and Kristoffer Riecken. 2020. "A High-Throughput HIV-1 Drug Screening Platform, Based on Lentiviral Vectors and Compatible with Biosafety Level-1" Viruses 12, no. 5: 580. https://0-doi-org.brum.beds.ac.uk/10.3390/v12050580