1. Introduction
In recent years, sequencing of genomes of large dsDNA viruses has been facilitated by the availability of whole genome sequencing techniques that allow deciphering of genomes in relatively short time with up to thousands-fold read depth [
1]. One of the most frequently applied methods is massive parallel sequencing techniques that are based on the fragmentation of genomic DNA, size selection of fragments and their amplification by PCR followed by massive parallel sequencing, resulting in millions of short sequenced fragments (reads) of a previously defined length. Nowadays, most dsDNA virus genome sequences published on GenBank have been determined by Illumina devices, in which read lengths can be set between 75 and 300 nt, and from which a consensus sequence can be assembled by bioinformatic workflows. One of the largest groups of dsDNA viruses are baculoviruses (family
Baculoviridae, [
2]), which are specific for insects from the orders Lepidoptera, Hymenoptera and Diptera. Their genomes are 80 to 180 kbp long and encode 100 to 200 open reading frames long [
2]. More than 200 baculovirus genomes have been sequenced [
3]. Since numerous baculoviruses are used as biological pest control agents, there is a considerable scientific and economic interest in the identification of isolates and the elucidation of genetic variability.
One applied technique to access genetic variation within sequenced baculovirus isolates or specimens is the detection of insertion and deletions (indels), as well as single nucleotide polymorphisms (SNP) [
1,
4,
5,
6]. In most cases, SNP positions are determined by using alignment of consensus sequences, previously generated from the same data [
5,
7], or the re-mapping of short-read sequencing data against their consensus sequence in order to evaluate intraspecific genetic variation within the sequenced baculovirus population [
8,
9].
More recent approaches used a combination of both methods, a determination of SNP specificities by consensus sequence alignments, and the use of those specific positions to quantify the presence of a certain isolate [
6] or even use a single consensus sequence to compare occurring SNP patterns to draw conclusions about the relatedness and similarity of sequenced isolates [
10]. However, very often the determination of SNP specificities by previously called consensus sequences can be considered as a bottleneck, since the establishment of a consensus sequence entails the risk of diminishing intraspecific variation at the first step. Although a consensus can indicate the presence of intraspecific variation by ambiguous nucleotides, the ratio of the present nucleotides in these positions remains hidden. The need to examine sequenced baculovirus samples for the presence of several genotypes was evident with the finding of clearly distinct but mixed genotypes. As an example, the Cydia pomonella granulovirus (CpGV) isolates 0006 (CpGV-0006) and R5 (CpGV-R5) can be named, which were found to be clearly distinguishable mixtures of two known and previously described isolates of CpGV with different biological characteristics [
6], a conclusion that cannot be drawn from a consensus sequence.
For that reason, this study focused on establishing an analysis method that (i) avoids creating a consensus sequence from the available data and yet (ii) allows the detection of previously known as well as unknown SNP positions. The only requirement is the choice of a reference sequence that should be closely related to the analyzed samples, e.g., from the same species. On the example of three isolates of the
Cydia pomonella granulovirus species (CpGV) (genus
Betabaculovirus) [
2], we describe how a consensus sequence free method can be used to detect isolate or specimen-specific SNPs positions and how those can be used to decipher the genotypic composition of isolates. The method follows a highly standardized workflow including a newly developed tool, termed bacsnp, written in R programming language, allowing the determination of SNP specificities across several sequenced isolates. For validation, the analysis was conducted independently with two CpGV reference sequences, one being closely related and one being more distantly related to the three analyzed samples in order to investigate the influence of the chosen reference sequence. In both cases, a mixed isolate composed of mainly two dominant genotypes was deciphered correctly. As demonstrated, the new tool bacsnp allows determining SNP specificities across several sequenced isolates, enabling insight into genetic variation at an intraspecific level.
3. Results
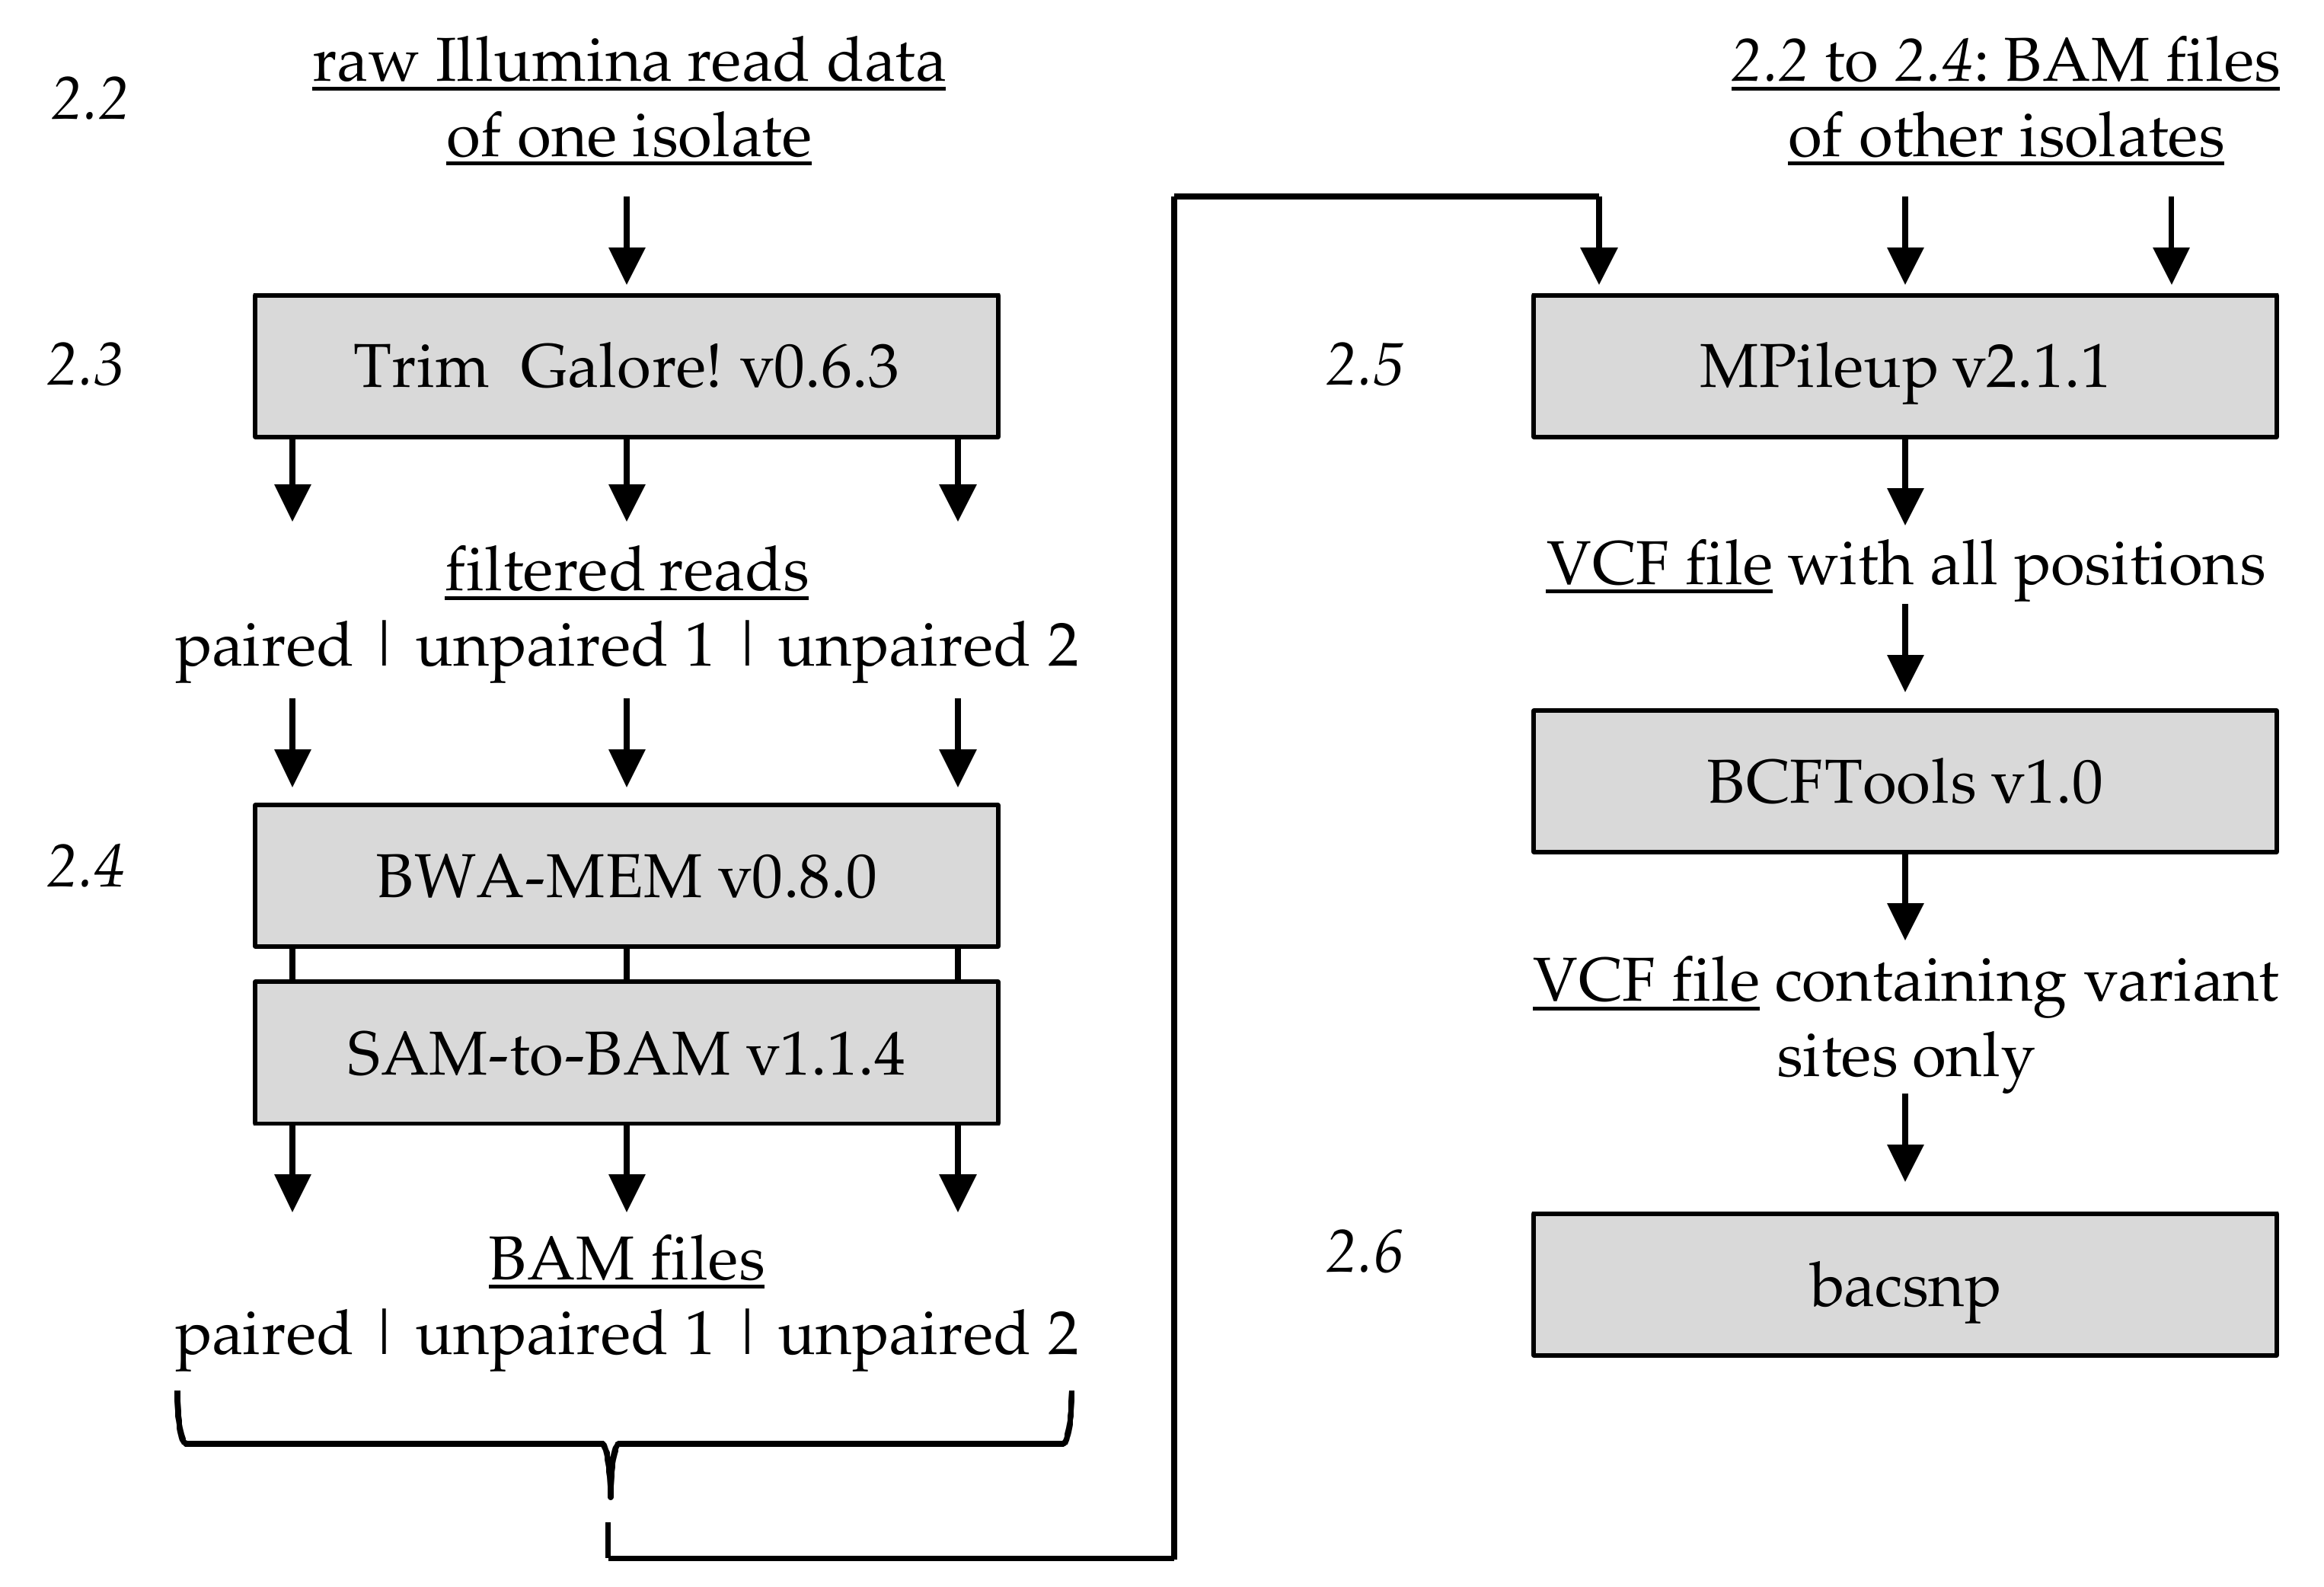
For the detection of variable positions in sequenced isolates CpGV-M, CpGV-S and CpGV-0006, their quality filtered reads were mapped in two separate analyses against either CpGV-M or CpGV-E2 as a common reference. After filtering, most of the reads were still paired, while the unpaired reads were only between 3.8% and 4.3% (
Table 1). Based on the paired reads alone, an entire coverage of the reference genome was given with read depths up to 3000 for CpGV-M and -S, which was ensured by the large proportion of reads that mapped to CpGV-M and CpGV-E2, respectively (
Table 1).
By a commonly used reference, SNP positions were linked between isolates and an overall number of 284 and 322 SNP positions were found in the unfiltered SNP dataset when using CpGV-M and CpGV-E2 as reference, respectively. For each SNP position, four frequencies were obtained: the reference and the three possible alternative nucleotides. To determine how frequent more than one alternative nucleotide occurred within detected SNP positions, the mean frequencies of the reference,
ƒref, and the three alternatives,
ƒalt1,
ƒalt2 and
ƒalt3, were calculated on the example of the 284 SNP positions that were found when CpGV-M was used as reference (
Table 2).
The mean frequency (
ƒref) of the reference nucleotide varied between 0.087 ± 0.252 and 0.97 ± 0.092 for CpGV-S and CpGV-M, respectively, whereas it was 0.394 ± 0.199 for CpGV-0006 (
Table 2). For the first alternative nucleotide, the average frequencies (
ƒalt1) were approximating 1 −
ƒref (
Table 2) and, therefore, both the frequencies of the reference and the first alternative (
ƒref +
ƒalt1) explained about 99.7% (CpGV-S) to 99.8% (CpGV-M and CpGV-0006) of the SNPs found (
Table 2). A second or third alternative nucleotide was found for all three sequenced isolates only at average frequencies (
ƒalt2/alt3) between
ƒalt2/alt3 = 0.002 and 0.003 (
Table 2). Since the occurrence and frequency of the second and third alternative appeared to contribute little to the entire data set, the assignment of SNP specificities was performed on the frequencies of the first alternative nucleotide only. When the above described average frequency analysis was performed for the unfiltered dataset using CpGV-E2 as reference, the sum of the average frequencies of the reference and the first alternative (
ƒref +
ƒalt1) explained 99.7% (CpGV-M) and 99.8% (CpGV-S and CpGV-0006), confirming to proceed with the SNP specificity determination with the first alternative.
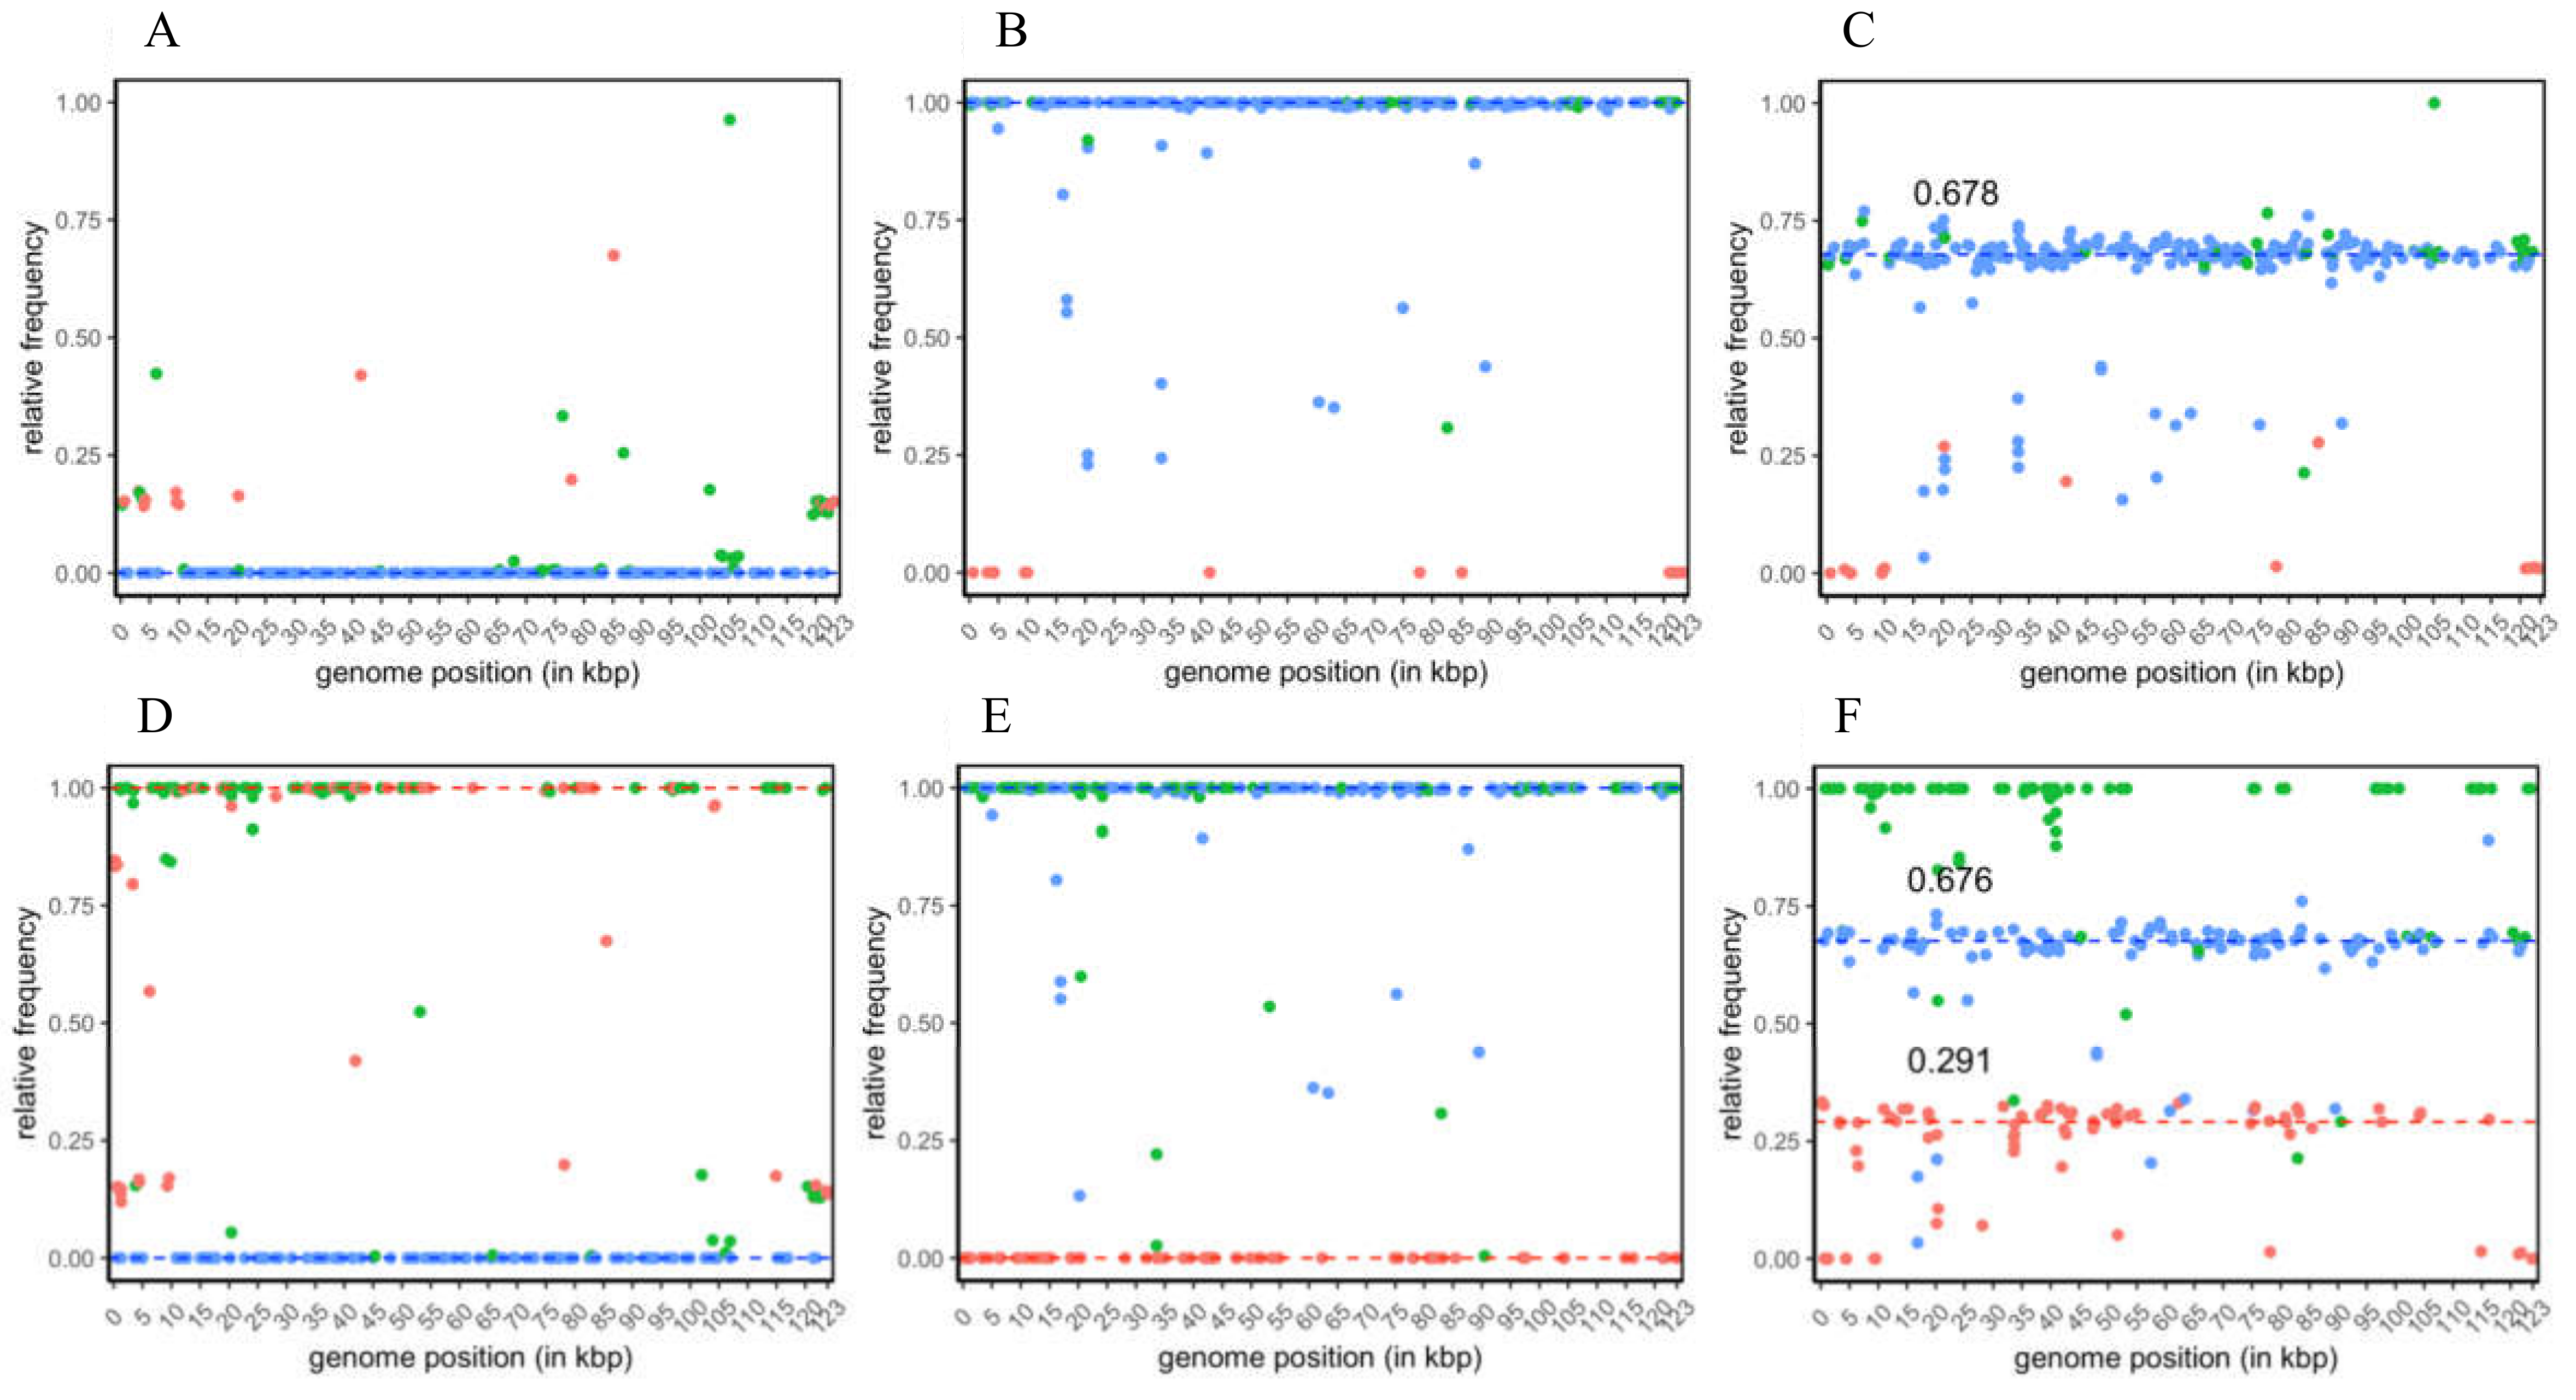
The raw SNP data sets were filtered to increase the stringency for further SNP specificity assignment and quantitative analysis. For the analysis based on CpGV-M and CpGV-E2 as references, the total number of SNP positions decreased to 277 and 300, respectively, of which most filtered SNP positions were only located in repeat regions of their reference. From the 277 SNP positions of the CpGV-M reference-based analysis, 223 were specific solely to CpGV-S, 15 were specific to CpGV-M, and 39 were group specific for both isolates (
Figure 2A–C). For the majority of CpGV-S-specific SNP positions, their relative frequencies (
ƒS) grouped around three medians in the three analyzed isolates: (i)
ƒS = 0 in CpGV-M (
Figure 2A), (ii)
ƒS = 1 in CpGV-S (
Figure 2B) and (iii)
ƒS = 0.678 in CpGV-0006 (
Figure 2C). In the sequenced isolates CpGV-S and CpGV-0006, the frequencies of a minority of CpGV-S specific SNPs scattered below the calculated median (
Figure 2B,C).
Interpretation of CpGV-M-specific SNPs in the three samples appears less obvious. Since the data of the re-sequenced CpGV-M sample was mapped against its own CpGV-M reference sequence (a previous consensus sequence) available at GenBank, only SNPs were expected that reflect either intraspecific variation within this isolate or sequencing errors in the reference sequence itself. From this self-mapping of CpGV-M reads, the relative frequencies of CpGV-M-specific SNP positions (
ƒM) ranged between
ƒM = 0.136 and
ƒM = 0.675 (
Figure 2A), indicating an absence of large genotypic variation within the CpGV-M sample. This finding was supported by the relative frequencies of the group-specific SNP positions (
ƒM+S) that varied between
ƒ = 0.004 and
ƒ = 0.962 (
Figure 2A). Based on the observations made by the self-mapping of CpGV-M against its own reference, its high homogeneity was assumed based on the following three assumptions: The (i) median frequency of the CpGV-S-specific SNP positions were
ƒS = 0 in CpGV-M, (ii) the CpGV-M-specific SNP positions could only reflect its own intraspecific variation, and (iii) any large genetic variation was not detected (only 15 CpGV-M-specific SNP positions and relative frequencies
ƒM < 0.675) (
Figure 2A).
For CpGV-S, a different situation arose since the reference sequence CpGV-M was more distantly related to the sequenced isolate. This led to the detection of the 223 CpGV-S-specific SNP positions, whose median frequency was
ƒS = 1 (
Figure 2B). SNPs that were below this median frequency were interpreted as intraspecific variation within this overall homogenous isolate (
Figure 2B). The homogeneity of CpGV-S was further confirmed by the absence of CpGV-M in CpGV-S, since all CpGV-M-specific SNPs had no frequencies (
ƒM = 1) (
Figure 2B).
In CpGV-0006, the frequencies of the CpGV-S-specific SNP positions were used in the same way to measure the presence of CpGV-S. Here, a ratio of about 67.8% CpGV-S was calculated based on the median frequencies of CpGV-S-specific SNPs (
Figure 2C). The difference of the CpGV-S-specific portion of
ƒS = 0.678 explained variability in CpGV-0006, which was considered as the hidden portion of CpGV-M, was calculated to be
ƒM = 1 −
ƒS = 0.322. Based on SNP frequency patterns and quantitative SNP analysis, CpGV-M and CpGV-S were considered highly homogenous isolates with minor possible internal genotypic variation represented by the scattering CpGV-M (
Figure 2A) and CpGV-S (
Figure 2B) specific SNP frequencies. In CpGV-0006, a ratio of about 67.8% CpGV-S was calculated based on the average frequencies of CpGV-S-specific SNPs (
Figure 2C). The purity of isolates CpGV-M and CpGV-S was confirmed by the SNP analysis using CpGV-E2 as a alternative reference (
Figure 2D–F). Here the 300 detected positions composed of 113 CpGV-S, 82 CpGV-M and 105 group-specific SNP positions (
Figure 2D–F). For isolate CpGV-M, the relative frequencies of the isolate and group-specific SNPs were
ƒM = 1,
ƒS = 0 and
ƒM+S = 1 (
Figure 2D), reflecting the presence of only CpGV-M within the sequenced sample. Furthermore, the purity of isolate CpGV-S was confirmed by mapping CpGV-S reads against reference CpGV-E2, which resulted in relative frequencies of
ƒM = 0,
ƒS = 1 and
ƒM+S = 1 (
Figure 2E). In CpGV-0006, the median SNP frequencies were calculated with
ƒM = 0.291,
ƒS = 0.676 and
ƒM+S = 1 (
Figure 2F). Thus, the medians of
ƒM and
ƒs explained 96.7% of the genetic composition and confirmed the presence of genotypes highly similar to CpGV-S (genome group E) and CpGV-M (genome group A) in CpGV-0006 in a ratio of about 2:1 (
Figure 2F).
4. Discussion
In this study, we present a newly developed approach in combination with the bacsnp tool to determine the specificity of SNPs positions across sequenced baculovirus samples. It allows determining the intraspecific genetic variability of a single baculovirus isolate and follows the hypothesis that SNP positions with similar frequencies represent genotypes of equal frequency, and therefore, can be used for determination and characterization of isolates homo- and heterogeneity [
1,
6]. As for the ultra-deep sequenced isolate Autographa californica multiple nucleopolyhedrovirus WP10, where a single sample was investigated thoroughly, SNP positions were grouped by k-mean clustering into four clusters representing a significant variability within this isolate; a rather non-clonal replication of a baculovirus isolate was underlined [
1]. Today, the mapping of reads against their own consensus sequence is a well-established method and allows the detection of intraspecific variation within sequenced baculovirus samples, such as Operophtera brumata nucleopolyhedrovirus [
9], Erinnyis ello granulovirus [
20] or Phthorimaea operculella granulovirus [
10]; the latter two compare the genetic variation between sequenced isolates. Overall, genetic variation within mainly homogenous isolates was described in these sequenced samples and was confirmed for CpGV-M and CpGV-S in this study. Especially, this was visible for CpGV-M, which appeared homogenous but with minor variation that could be recognized by the pattern of CpGV-M-specific SNP positions with frequencies below 75%. This internal variation reoccurred partially in the mapping of CpGV-M reads against CpGV-E2 as reference. A similar assumption could be made for CpGV-S, which appeared homogenous with minor internal variation. Although the reference sequence of CpGV-M was assembled and determined from sequencing data that allowed only an average read depth of 17.23 [
5], the sequence was considered as reliable and sufficiently reflected the majority of the viral population of CpGV-M. This was concluded since no SNP position was entirely different to the reference and therefore indicated no major sequencing or assembly errors at the date of consensus sequence creation.
The approach of self-mapping of reads against their own consensus sequence was impeded for isolate CpGV-0006 in downstream analyses when CpGV-0006 was initially found to be a distinct mixture of about two-thirds CpGV-S and one-third CpGV-M [
6]. Here, the need for a method that omits the generation of a consensus sequence, which could render the genetic composition of CpGV-0006 only with ambiguous nucleotides but could not reflect any mixed ratios, became obvious. When applying the new bacsnp method, the assembly of reference sequences was not performed and instead reference sequences obtained from GenBank were used, irrespective of their correctness and completeness. Specificities of SNPs were called according to their frequencies only and allowed the calculation of the same ratio of CpGV-M and CpGV-S based on 277 or 300 SNP positions. From the set of 277 SNP positions found by the de novo approach, 233 positions were re-identified from those found by aligning consensuses of five different CpGV isolates, including CpGV-M and CpGV-S [
5]. The remaining 42 positions that were not identified previously are part of the internal variations of these two isolates that were not reflected by their consensus sequences [
5].
By analyzing SNP data with the bacsnp tool, it can be chosen if the analysis should be conducted on the frequencies of the first, second or third nucleotide alternative, which can be relevant in case more than two nucleotides were occurring at SNP positions. Based on the CpGV example of this study, only two nucleotides were identified at each SNP position after filtering the SNP frequency data. This finding is supported by the alignment of CpGV-M, CpGV-S and CpGV-E2 that did not exceed the presence of two different nucleotides at each found SNP position [
5].
The deciphering and differentiation of two or multiple dominant genotypes within a sequenced baculovirus sample, as it was the case for CpGV-0006, is not always possible, because some isolates have been found to be highly variable in their genotype composition [
12]. This was also the case for CpGV-E2, whose composition in genotypes was described to be highly heterogenous and complex and whose SNPs do not allow a clear differentiation [
12]. However, the strength and the aim of bacsnp and its related workflow is the evaluation of a sequenced baculovirus population’s heterogeneity that genotype population studies or the analysis of biological functions of relevant individual SNPs can build on. For the correct detection of occurring SNPs, the choice of the reference sequence is a relevant and sometimes crucial factor that needs to be decided before the analysis is carried out. A closely related reference sequence at the species level is a prerequisite to prevent mismatching of reads during the assembly and detection of only true SNP positions. The forced mapping of reads to an unrelated reference sequence would not make any biological sense and would allocate numerous false variable nucleotide positions. A similar problem occurred in the repeat regions of this study when read mapping was ambiguous. In order to avoid any read mapping and assembly-related problems, the reference sequence for conducting the de novo detection of SNPs needs to be closely related (same baculovirus species) to the analyzed sample, as this was the case for CpGV-M and CpGV-E2, both being more than 98% identical in their nucleotide sequence and both belonging to the
Cydia pomonella granulovirus species [
5].
For CpGV-M and CpGV-E2 that belong to different genome groups (A and B, respectively) within their species, the independence of the reference sequence on the species level was underlined. Since the reference CpGV-M was part of the sequenced samples of CpGV-M and CpGV-0006, its presence cannot be interpreted intuitively from the analysis since its specific SNPs are missing in the plots. However, the proportion of CpGV-M in CpGV-0006 was determined by calculation as 32%, since it represented the missing part to the 68% that were explained by CpGV-S.
In case of using CpGV-E2 as a mapping reference, which is neither part of CpGV-M, CpGV-S nor CpGV-006, both the CpGV-M- and CpGV-S-specific SNP positions were clearly visible and interpretable. Most importantly indeed, both analyses resulted in very similar calculated ratios of CpGV-M and CpGV-S in the CpGV-M, CpGV-S and CpGV-006, independently from the used reference.
With the consensus sequence free method and newly developed bacsnp tool programmed in R, a rapid and easy-to-use downstream protocol is provided to evaluate the heterogeneity or homogeneity of sequenced baculovirus isolates. Furthermore, this method was developed to work for at least two to several isolates and allows cross-evaluating the presence of certain genotypes in each analyzed sample. The decision of whether a consensus sequence should be assembled from sequencing data of a given isolate is recommended to be done when the homogeneity and the absence of a mixture have been confirmed.


