Article

In Vitro Characterization and In Vivo Efficacy Assessment in Galleria mellonella Larvae of Newly Isolated Bacteriophages against Escherichia coli K1

1
Bacteriology Laboratory, Department of Infectious and Parasitic Diseases, FARAH and Faculty of Veterinary Medicine, University of Liège, 4000 Liège, Belgium
2
Food Science Department, FARAH and Faculty of Veterinary Medicine, ULiège, 4000 Liège, Belgium
3
Vésale Bioscience, Vésale Pharmaceutica, 5310 Noville-sur-Mehaigne, Belgium
4
Genalyse Partner SA, En Hayeneux 62, 4040 Herstal, Belgium
*
Author to whom correspondence should be addressed.
These authors equally supervised the work.
Submission received: 31 August 2021 / Revised: 16 September 2021 / Accepted: 21 September 2021 / Published: 6 October 2021
(This article belongs to the Special Issue Advances in Bacteriophage Biology)

Abstract

:
Extra-intestinal Escherichia coli express several virulence factors that increase their ability to colonize and survive in different localizations. The K1 capsular type is involved in several infections, including meningitis, urinary tract, and bloodstream infections. The aims of this work were to isolate, characterize, and assess the in vivo efficacy of phages targeting avian pathogenic E. coli (APEC) O18:K1, which shares many similarities with the human strains responsible for neonatal meningitis. Eleven phages were isolated against APEC O18:K1, and four of them presenting a narrow spectrum targeting E. coli K1 strains were further studied. The newly isolated phages vB_EcoS_K1-ULINTec2 were similar to the Siphoviridae family, and vB_EcoP_K1-ULINTec4, vB_EcoP_K1-ULINTec6, and vB_EcoP_K1-ULINTec7 to the Autographiviridae family. They are capsular type (K1) dependent and present several advantages characteristic of lytic phages, such as a short adsorption time and latent period. vB_EcoP_K1-ULINTec7 is able to target both K1 and K5 strains. This study shows that these phages replicate efficiently, both in vitro and in vivo in the Galleria mellonella model. Phage treatment increases the larvae survival rates, even though none of the phages were able to eliminate the bacterial load.

1. Introduction

Extra-intestinal Escherichia coli (ExPEC) is a pathotype that encompasses a great diversity of strains, and in which antibiotic resistance increases over the years. ExPEC can be normal inhabitants of the gut microbiota but can also express several virulence factors that allow them to colonize and survive in different localizations [1]. Among these factors, capsular type K1 is involved in ExPEC infections such as neonatal meningitis, urinary tract, and bloodstream infections [2,3,4,5]. E. coli is a leading cause of neonatal early-onset sepsis and meningitis in newborns, with a high proportion (approximately 80%) of strains expressing K1 capsule and frequently associated to a limited number of serotypes: O1, O7, O16, O18, and O45 [5]. The polysaccharidic structure of the K1 capsule allows E. coli to escape phagocytosis and thus survive and multiply outside the intestinal tract, as observed in neonatal meningitis, where it constitutes a determining virulence factor for the bacterial survival in the serum and for passage through the blood–brain barrier [6,7]. The recommended treatment in neonatal meningitis is based on empiric administration of antibiotics (ampicillin and gentamicin) [8]. Resistance to ampicillin is quite common, and, moreover, extended-spectrum beta-lactamase and multi-drug resistant strains have been described in several studies [9,10,11,12].
The presence of K1 capsulated E. coli has been demonstrated in humans but also in animals such as poultry, cows, and dogs, with several studies highlighting their zoonotic potential due to strong genetic and pathogenic similarities [13,14,15,16,17]. Avian pathogenic E. coli (APEC) isolates such as ST95 and ST131 or the O1, O2, and O18 serogroups might induce human extra-intestinal infections, although further investigation is needed to provide clear evidence of their zoonotic transmission to humans [18,19]. APEC isolates have the ability to produce clinical signs associated with human infections (sepsis, meningitis, and urinary tract infections) in rodents models and conversely, human strains causing neonatal meningitis are capable of inducing colibacillosis in poultry [19,20,21]. In addition, studies have shown that avian-associated plasmids ColV specific to APEC strains were also found in human isolates, again reinforcing the hypothesis of the zoonotic potential of APEC [19,22,23]. Antibiotic resistance in APEC is of concern and has been observed for all classes of antibiotics, except carbapenem; with prevalent resistances against ampicillin, tetracycline, trimethoprim, sulfamethoxazole, and streptomycin [18].
The antibiotic resistance of pathogenic bacteria is a real threat worldwide, in both humans and animals, and alternatives such as phage therapy have therefore been proposed to treat various infections. Phage therapy is not a new concept and was applied at the beginning of the 20th century after the discovery of bacteriophages in 1915 by Frederick Twort and in 1917 by Felix d’Herelle. However, the technique was rapidly supplanted with the advent of antibiotics outside of the former Soviet Union and allied states. With the emergence of multidrug resistant (MDR) bacteria and the need to find alternatives to antibiotics, phage therapy has gained renewed attention in western countries [24]. Indeed, phages present many advantages: they only infect bacterial cells and are highly specific; they have advantageous pharmacokinetics, due to self-replication at the infection site; and they have the ability to adapt to the development of resistance in targeted bacteria [24]. Nevertheless, phage-resistance has been demonstrated in studies assessing phage therapy, both in vitro and in vivo [25]. Several phages targeting E. coli K1 have been isolated and characterized since 1977 [26,27,28,29]. Considering their potential for phage therapy for treatment of diseases associated with E.coli K1, these phages were assessed in animal models and showed in vivo efficacy [27,29,30]. The applied phage treatments produced better results when using phages specifically targeting the K1 encapsulated E. coli, rather than non-specific phages [27,29,30].
Animal models are widely used in research on infectious diseases, the most widely used being vertebrates. The in vivo Galleria mellonella larvae (also called Greater wax moth larva) model has received attention given its low cost, ease of implementation, and being more ethically acceptable [31,32,33]. This model has the main advantage of having an innate immune system quite similar to humans, with humoral and cellular components, but it lacks an acquired immune system [34,35,36]. Several publications have already shown the advantages of this model in the preliminary evaluation of phages targeting antibiotic resistant bacteria in both humans and animals [37,38,39,40]. Moreover, one study investigating the use of bacteriophages targeting E. coli in G. mellonella larvae showed effectiveness with this model [41].
The aim of this work was to isolate and assess phages targeting avian pathogenic E. coli (APEC) O18:K1, a strain that shares many similarities with neonatal meningitis E. coli (NMEC) O18:K1. These phages were sequenced and characterized in vitro, and their potential in phage therapy was assessed in vivo in the G. mellonella larvae model.

2. Materials and Methods

2.1. Bacterial Strains

Ten APEC isolated from poultry in Belgium, France, and Spain between 1995 and 1999 were used. These isolates were responsible for clinical signs of colibacillosis and produced a lethality of 100% in 1-day-old chickens [14]. An E. coli serogroup collection of 179 strains previously characterized by seroagglutination was used for the host range, as well as Uropathogenic E. coli (UPEC), Enterohemorrhagic E. coli (EHEC), and Enteropathogenic E. coli (EPEC) strains (Tables S1 and S2). The capsular type K1 (neuC) was determined by PCR for all strains and capsular type K5 (kfib) for 3 strains (O10, O12, and UPEC 151.1). APEC isolates were also characterized by PCR to confirm their serogroup (O18) and the presence of the virulence gene ibeA involved in the passage of the blood–brain barrier. All bacteria were grown in LB Lennox broth at 37 °C. All primers used for bacterial characterization are listed in Table S3 and PCR results in Tables S1 and S2.

2.2. Phage Isolation and Propagation

Wastewater samples used for isolation were collected in 2020 in wastewater treatment plants in Liège and Brussels and from one hospital (Ghent University Hospital). APEC 45 was selected for isolation and propagation. Phages were isolated by the enrichment method [42]. The waste water samples were centrifuged for 10 min at 9500× g and filtered at 0.2 µm. Then, the filtrate was added to an equivalent volume of LB Lennox (1 mM CaCl2, 1 mM MgSO4, Sigma-Aldrich, Saint-Louis, MO, USA) concentrated twice (LB2X), as well as 100 µL of bacterial culture at an optical density (OD) between 0.2 and 0.3 (~108 CFU/mL). A sterility control, aiming to check the sterility of the filtrated water and a growth control were included. All tubes were incubated for 6 h at 37 °C until lysis was observed (Figure 1). The lysis tube and the growth control were then centrifuged at 9500× g and filtered at 0.2 μm. Between 2 and 20 μL of the 2 filtrates, as well as a 10× dilution of the lysis tube in TN buffer (Sigma-Aldrich, Saint-Louis, MO, USA), were spread on LB Lennox agar, covered with a bacterial overlay (OD: 0.2–0.3), and incubated at 37 °C until lysis plaques were visualized. These plaques were subcultured on LB Lennox agar 3 times. After plaque purification, lysates were made with 100 μL of the isolated phage and 20 μL of bacterial culture (OD: 0.2–0.3) in 5 mL of LB Lennox (1 mM CaCl2, 1 mM MgSO4). After centrifugation and filtration, the lysates were stored at 4 °C, −20 °C, and −80 °C. The phages were propagated by adding 20 mL of a new lysate to 400 mL of bacterial culture (OD: 0.2–0.3). After overnight incubation at 37 °C, 20 mL of chloroform was added to the culture and incubated for 10 min at 37 °C to release intracellular phages. The supernatant was then centrifuged for 1 h at 5000× g and filtered using a filtration unit (Nalgene, Thermo Fischer Scientific, Waltham, MA, USA) in which two filters of 0.45 µm and 0.2 µm (Whatman, GE healthcare, Maidstone, UK) were superimposed. The filtrates were then stored at 4 °C.

2.3. Host Range and Efficiency of Plating

The host ranges were performed using 4 µL spot tests in triplicate on LB Lennox agar (1 mM CaCl2, 1 mM MgSO4) covered with a bacterial overlay (OD: 0.2–0.3). Plates were then incubated at 37 °C overnight. The level of lysis was assessed using the scoring: clear lysis; opaque lysis; highly opaque lysis; non confluent plaques; and no lysis. Eleven phages were tested against a collection of 201 E. coli strains (Tables S1 and S2). For the efficiency of plating (EoP), 20 μL of each phage was serially diluted in 180 μL of PBS in a 96-well plate in triplicate. Drops of the dilutions (2 µL) were plated on an LB Lennox agar (1 mM CaCl2, 1 mM MgSO4) covered with a bacterial overlay (OD: 0.2–0.3). Plates were then incubated at 37 °C overnight. In order to obtain efficiency of plating, the titers on the tested strains were divided by the titer obtained on the propagation strain APEC 45.

2.4. Transmission Electron Microscopy

The purification method used was cesium chloride (CsCl) gradient ultracentrifugation followed by dialysis. Four densities were obtained by diluting CsCl (Cesium chloride ReagentPlus® 99.9%, Sigma-Aldrich, Saint-Louis, MO, USA) in phage buffer (10 mM Tris, 10 mM MgSO4, 150 mM NaCl, Sigma-Aldrich, Saint-Louis, MO, USA): 1.33 g/cm3, 1.45 g/cm3, 1.5 g/cm3, and 1.7 g/cm3. A volume of each density was added successively, from the lowest to the highest density, in an ultracentrifuge tube (Ultra clear tubes 344058, Beckmann, Brea, CA, USA) using a Pasteur pipette. CsCl was added to a suspension of phage at a concentration of 1010 plaque-forming units (PFU)/mL and deposited on top of the gradient. The tube was then ultracentrifuged at 133,900× g for 3 h at 4 °C. The bands of purified and concentrated phages were collected and dialyzed at 4 °C with dialysis cassettes, following the manufacturer’s instructions (Slide-A-Lyzer ™ G2 Dialysis Cassettes, 10K MWCO, 3 mL, Thermo Fischer Scientific, Waltham, MA, USA). The dialyzed phages were stored at 4 °C.
The purified phages were negatively stained and analyzed by transmission electron microscopy (TEM) by the Electron Microscopy unit (Sciensano, Bruxelles, Belgique), as described by Mast and Demeestere, 2009 [43]. The grid was pre-treated with Alcian blue to increase hydrophilicity. The sample was placed on the grid using the grid-on-drop method. The grids were washed five times with distilled water and stained with 2% uranyl acetate (Agar Scientific, Standsted, UK). The TEM specimens were examined using a Tecnai Spirit microscope (FEI, Eindhoven, The Netherlands) operating at 120 kV.

2.5. DNA Sequencing and Phage Genome Annotation

DNA of purified phages was extracted using a DNA extraction kit MagCore® Viral Nucleic Acid Kit with 60 μL elution volume (Atrida, NL), DNeasy Blood & Tissue kit (Qiagen, Crawley, UK) following the manufacturer’s instructions. Sequencing libraries were constructed using an Illumina Nextera XT DNA sample preparation kit and subsequently sequenced on an Illumina MiSeq instrument (Illumina, San Diego, CA, USA).
The phage genomes were assembled into single contigs using CLC Genomics Workbench v21.0.4 (using default parameters, https://digitalinsights.qiagen.com/, accessed on 31 August 2021). CDS calls were initially made based on analyses with RAST [44], while protein functions predicted by RAST were then reanalyzed using searches for conserved domains with InterPro v86.0 [45] and HHpred v57c8707149031cc9f8edceba362c71a3762bdbf8 [46]. Closely related phages deposited in GenBank were identified using BLASTn analysis. Figures comparing phage genomes were generated using Easyfig v2.2.5 [47].

2.6. Adsorption Time and Low MOI Phage Kinetics

The adsorption time and low MOI phage kinetics were performed following Merabishvili et al. [48], with adaptations. For the adsorption time, each phage (20 µL) was mixed with 5 mL of APEC 45 (OD: 0.25) at a multiplicity of infection (MOI) of 0.001 and incubated at 37 °C. Samples of 500 µL were removed after 3, 5, 8, 10, and 15 min and diluted 10 times in 4 mL LB broth and 0.5 mL chloroform. After 30 min of incubation at room temperature, the number of unadsorbed phages was titrated in triplicate. The adsorption time was determined as the time when the ratio of non-adsorbed phage over the initial phage number was under 0.1. For the low MOI phage kinetic experiment, 1 mL of 108 CFU/mL of APEC 45 was exposed to each phage at a MOI of 0.001. The adsorption process was allowed to occur for 8 min at 37 °C. The culture was centrifuged at 13,000× g for 1 min, resuspended in 10 mL of LB Lennox and incubated for 100 min at 37 °C. Samples were removed every 5 min and titrated in triplicate. The latent period was the time between phage adsorption and the beginning of phage release.

2.7. Temperature and pH Stability

Temperature stability was assessed by incubating 1 mL of 108 PFU/mL phage samples at different temperatures (25 °C, 37 °C, 45 °C, and 60 °C). For pH stability, 100 µL of 109 PFU/mL phage samples were diluted in 900 µL of PBS at different pH (2, 4, 6, 8, 10, and 12). All samples were incubated for 1 h and subsequently titrated in biological triplicate. Long term stability was evaluated by titrating before and after 8 months of storage at 4 °C, −20 °C, and −80 °C. For conservation, glycerol (15% v/v, Fisher chemical, Pittsburgh, PA, USA) was added to phage lysates, according to González-Menéndez et al. [49].

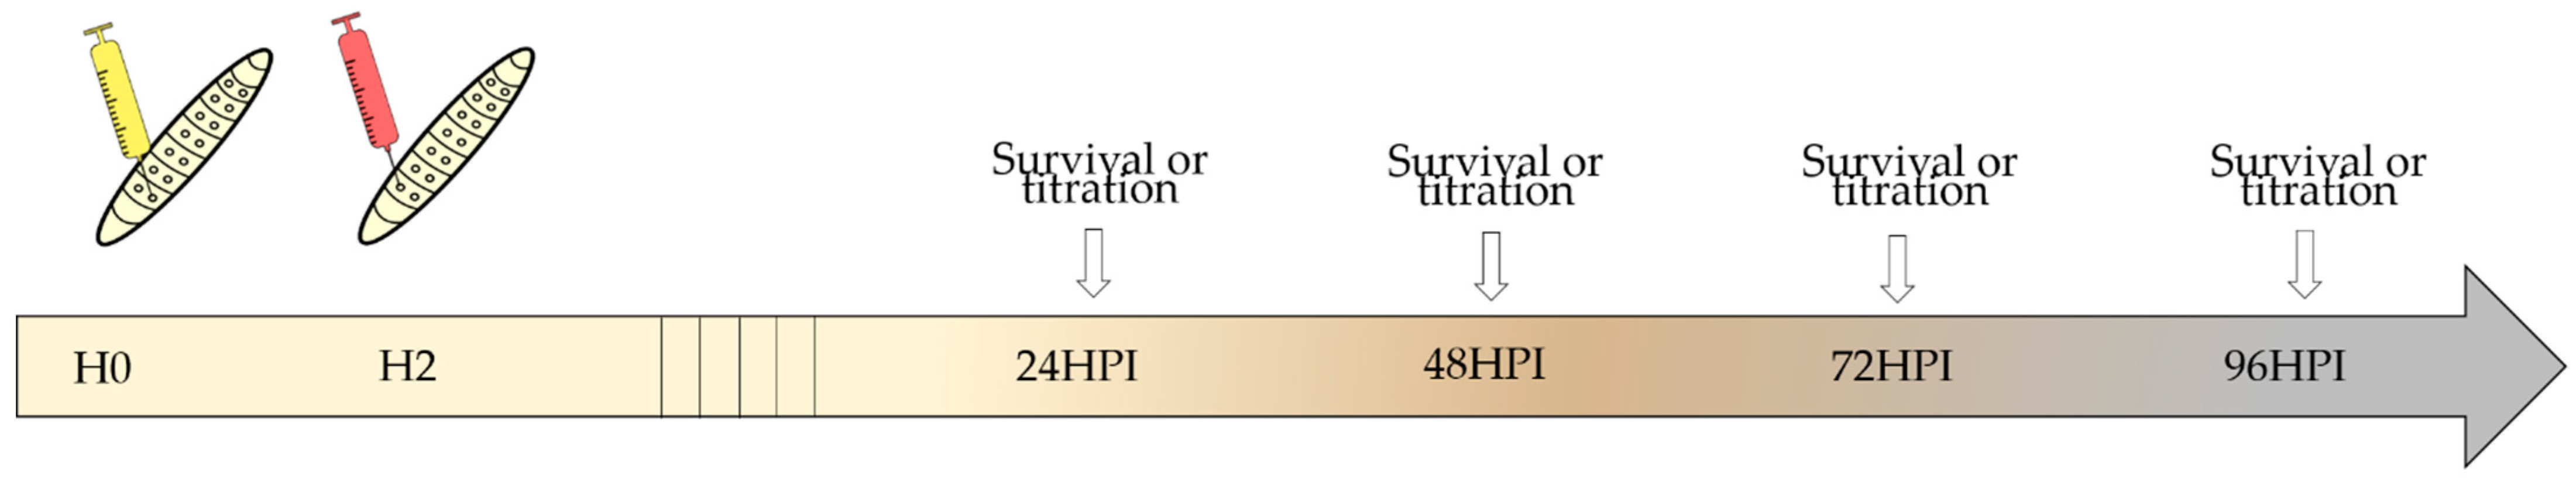
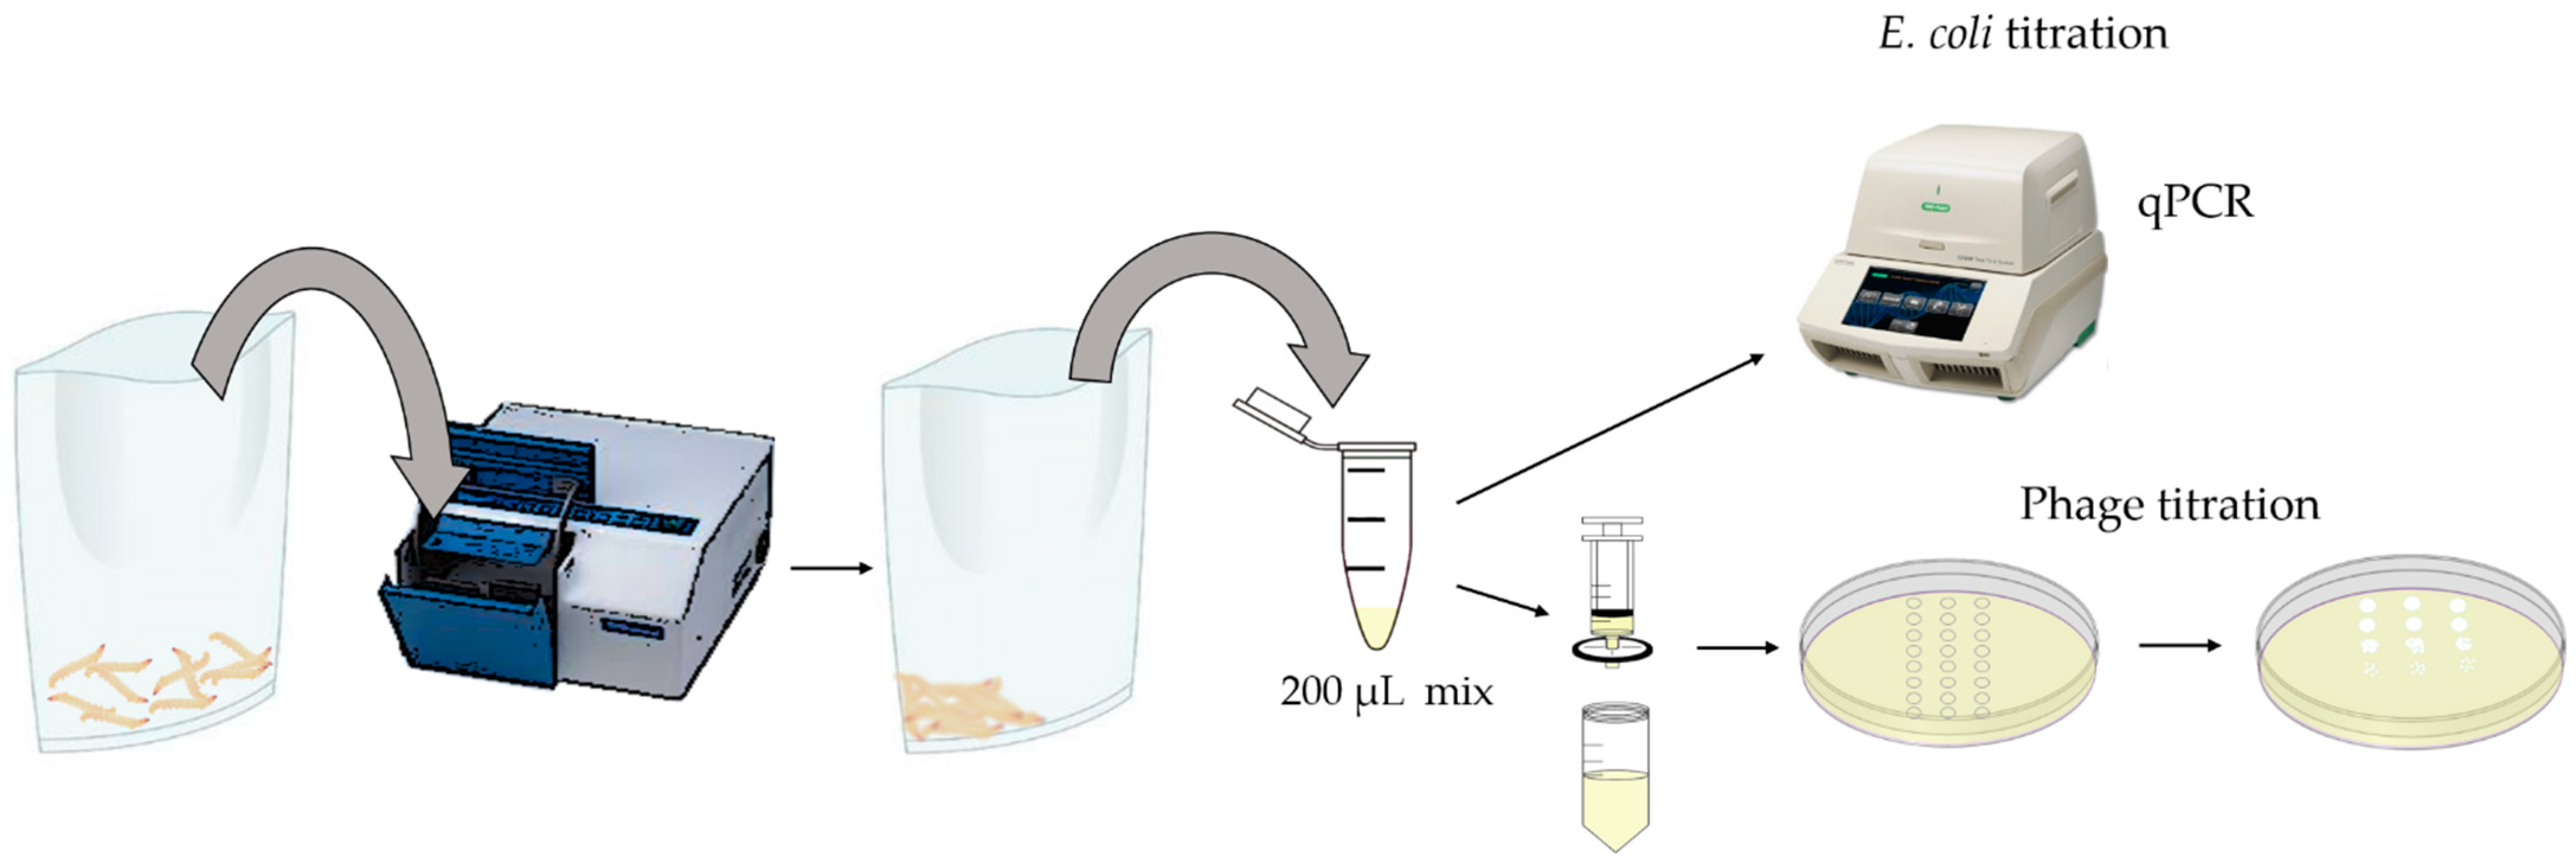
2.8. In Vivo Assay: Galleria Mellonella

To determine the optimal inoculation dose, 6 groups of 10 G. mellonella larvae (Nusect, Deerlijk, Belgium) were inoculated using an automatic injector (Cole Parmer, Vernon Hills, IL, USA) with 10 µL of APEC 134 at 6 different concentrations, ranging from 10 CFU/10 µL to 106 CFU/10 µL. Each larva was inoculated in the last left proleg with a BD Plastipak™ 1 mL sterile syringe (Becton-Dickinson, Franklin Lakes, NJ, USA) and a sterile 30-gauge needle (Terumo corporation, Tokyo, Japan). The optimal inoculation dose was expected to cause a lethality of between 90 and 100% after 4 days.
Four experiments were carried out in order to evaluate the individual efficacy of 4 phages (vB_EcoS_K1-ULINTec2, vB_EcoP_K1-ULINTec4, vB_EcoP_K1-ULINTec6 and vB_EcoP_K1-ULINTec7) on the survival of G. mellonella larvae. For each experiment, 150 larvae were divided into 5 groups (Table 1). Each larva was inoculated using an automatic injector (Cole Parmer, Vernon Hills, IL, USA) in the last left proleg for the first injection followed by a second injection 2 h later in the last right proleg. Injections were performed using BD Plastipak™ 1 mL sterile syringes (Becton-Dickinson, Franklin Lakes, NJ, USA) and sterile 30-gauge needles (Terumo corporation, Tokyo, Japan). The larvae were incubated at 37 °C and mortality was evaluated every 24 h (Figure 1). Kaplan-Meier survival curves were generated to assess the survival of the different groups using R-commander (Rcmdr v2.6-0) [50]. Logrank tests were performed to highlight any significant difference in survival rates between the groups (p ≤ 0.05).
To assess bacterial and phage titer evolutions, 600 larvae were divided into 5 groups. They were inoculated following the same protocol used for the survival experiment. The titrations of APEC 134 and phages were performed every 24 h for 96 h in biological triplicate, with larvae grinded in a homogenizer (Stomacher) in groups of 10 individuals. The mix (200 µL) was immediately diluted in PBS and weighed. Half of the sample was filtered with a 0.2 µm sterile syringe filter (ref.514-0073, VWR, Leicestershire, UK). The filtrate was titrated in triplicate with 10-fold serial dilutions and plated on LB Lennox agar (1 mM CaCl2, 1 mM MgSO4) with a bacterial overlay (OD: 0.2–0.3). Plates were incubated at 37 °C for 16 to 18 h before counting. For APEC 134 titrations, samples were pre-treated with DNaseI (1 mg/mL, Sigma-Aldrich, Saint-Louis, MO, USA) and RNaseA (100 mg/mL, Sigma-Aldrich, Saint-Louis, MO, USA). DNA was then extracted using a DNeasy® Blood & Tissue kit (Qiagen, Hilden, Germany), following the manufacturer instructions. Bacterial titrations were performed using a qPCR targeting the neuB virulence gene using the primer pair neuB-F: 5′-ATGTTTCAGTTCATCAGGTTCTATTGA-3′ and neuB-R: 5′-TCTGATCATTCTAGCGGGTTTTTATG-3′ and probe neuBK1: 5′-[6FAM]-TTATTCCATAAGGCACCGCCGCAA-[BHQ1]-3′ [51]. Real-time PCR assays were performed with a CFX96 Touch Real-Time PCR Detection System (Biorad, Hercules, CA, USA), according to the manufacturer’s recommendations in 20 µL reaction volume. The enzyme used was the FastGene® Probe 2 × qPCR Universal Mix (Nippon genetics, Tokyo, Japan). The primers and probe (Eurogentec, Seraing, Belgium) were used at a final concentration of 400 nM and 200 nm, respectively. The following steps were applied: enzyme activation at 95 °C for 3 min followed by 40 cycles of denaturation at 95 °C for 5 s and annealing at 60 °C for 30 s. All negatives samples were also checked by qPCR using the universal prokaryotes (16 S rRNA) primer pair (500 nM final concentration) 926F: 5′-AAACTCAAAKGAATTGACGG and 1062R: 5′-CTCACRRCACGAGCTGAC-3′ [52] and the enzyme Takyon™ No ROX SYBR 2X MasterMix blue dTTP (Eurogentec, Seraing, Belgium). The following steps were applied: enzyme activation at 95 °C for 5 min, followed by 35 cycles of denaturation at 95 °C for 15 s, annealing at 61.5 °C for 15 s, elongation at 72 °C for 30 s. The phage and bacterial processes are illustrated in Figure 2. Kruskall–Wallis and Mann–Whitney tests were performed using R-commander (Rcmdr v2.6-0) [50] to statistically assess the efficacy of the phages.

3. Results

3.1. Phage Isolation

Eleven phages were isolated against APEC 45. All were propagated and were able to reach high titers (>109 PFU/mL) in liquid culture. Four phages specific of the K1 capsular type (K1-dependent) were named according to the nomenclature and studied more extensively: vB_EcoS_K1-ULINTec2, vB_EcoP_K1-ULINTec4, vB_EcoP_K1-ULINTec6, and vB_EcoP_K1-ULINTec7.

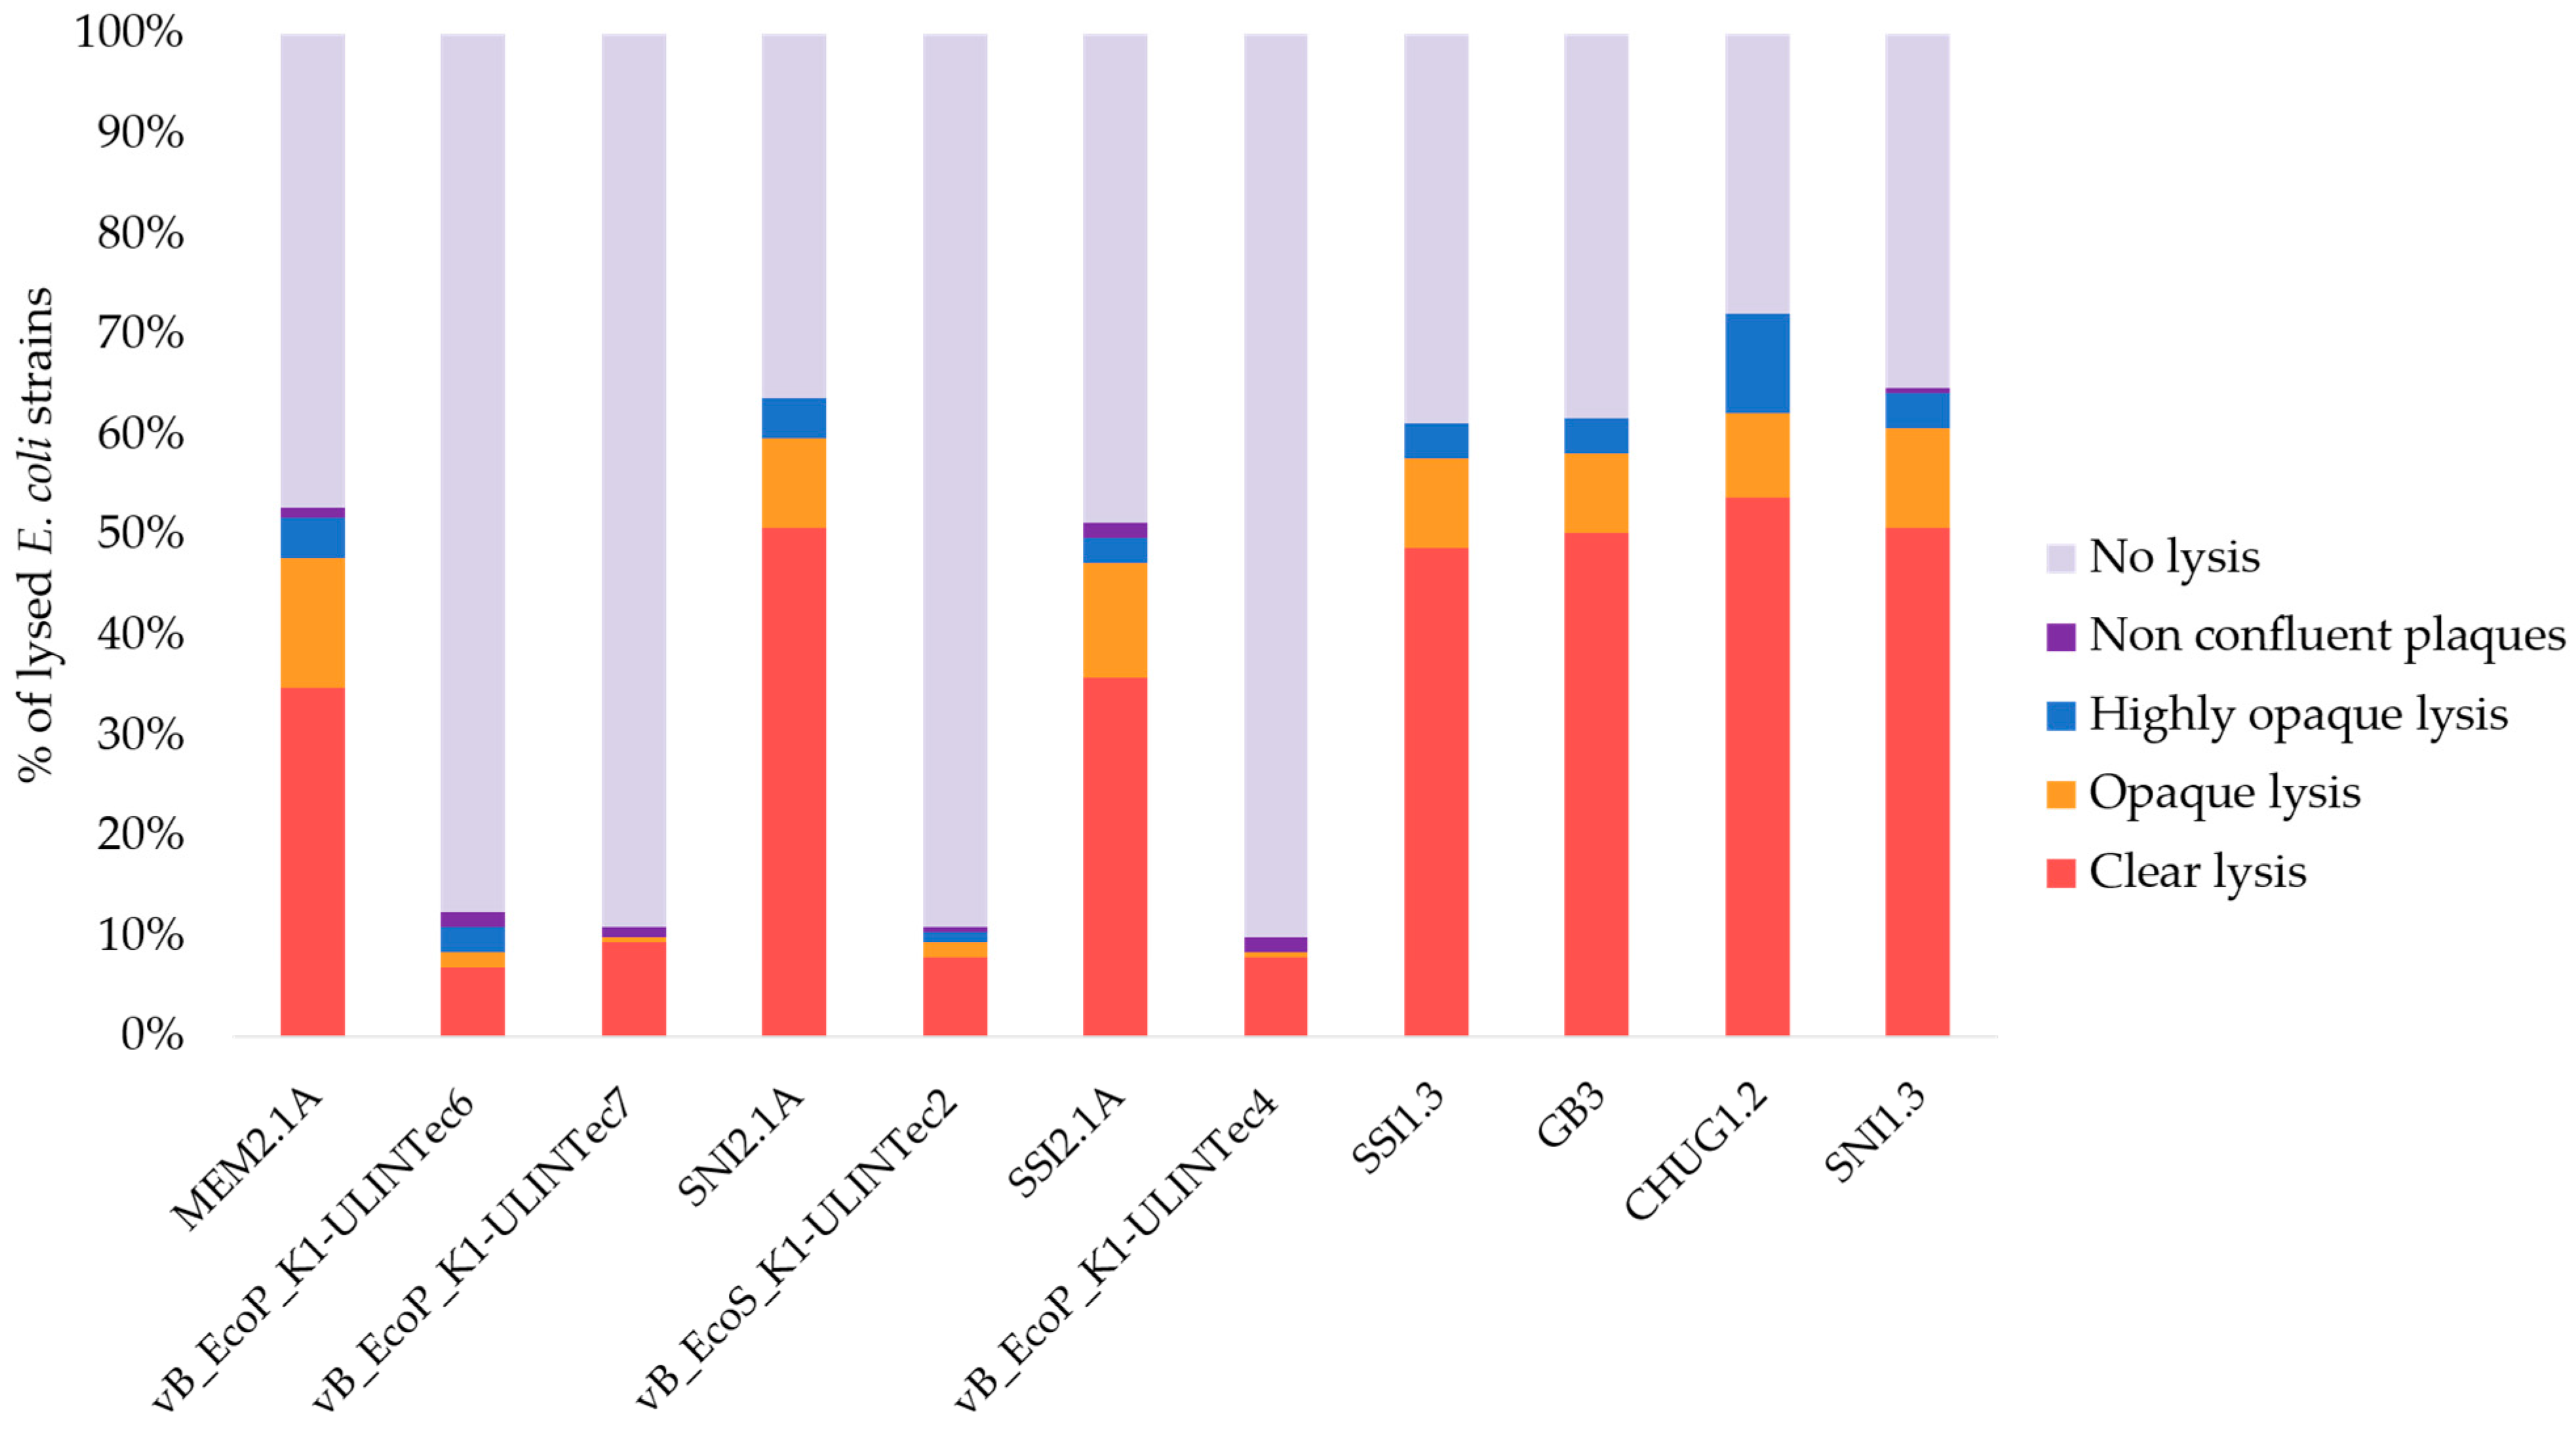
3.2. Host Range and Efficiency of Plating

The host range was evaluated for all phages isolated against E. coli O18:K1 (APEC 45). The results are summarized in Figure 3. Four phages showed a narrow spectrum (vB_EcoS_K1-ULINTec2, vB_EcoP_K1-ULINTec4, vB_EcoP_K1-ULINTec6, and vB_EcoP_K1-ULINTec7) that includes O18:K1 and other K1 strains. Several serogroups, as well as two UPEC strains lysed by these four phages, were associated with the K1 capsular type, except serogroups O10, O12, and UPEC strain 151.1 that encode the kfib virulence gene associated with capsular type K5 (Table S1). These three strains were only lysed by vB_EcoP_K1-ULINTec7 and not by the three other narrow spectrum phages.
Since the host range spots tests tended to overestimate the virulence of the phages tested, EoP was performed for the four phages (vB_EcoS_K1-ULINTec2, vB_EcoP_K1-ULINTec4, vB_EcoP_K1-ULINTec6, and vB_EcoP_K1-ULINTec7) and suggested abortive infection (non-productive phage infection that kill bacteria) in some cases. No phage could effectively lyse all of the K1 strains tested. vB_EcoS_K1-ULINTec2 showed the narrowest spectrum but reached good EoP values on the lysed strains. vB_EcoP_K1-ULINTec7 have the largest spectrum for K1 strains and can lyse K5 strains. The results of the EoP are detailed in Table 2.

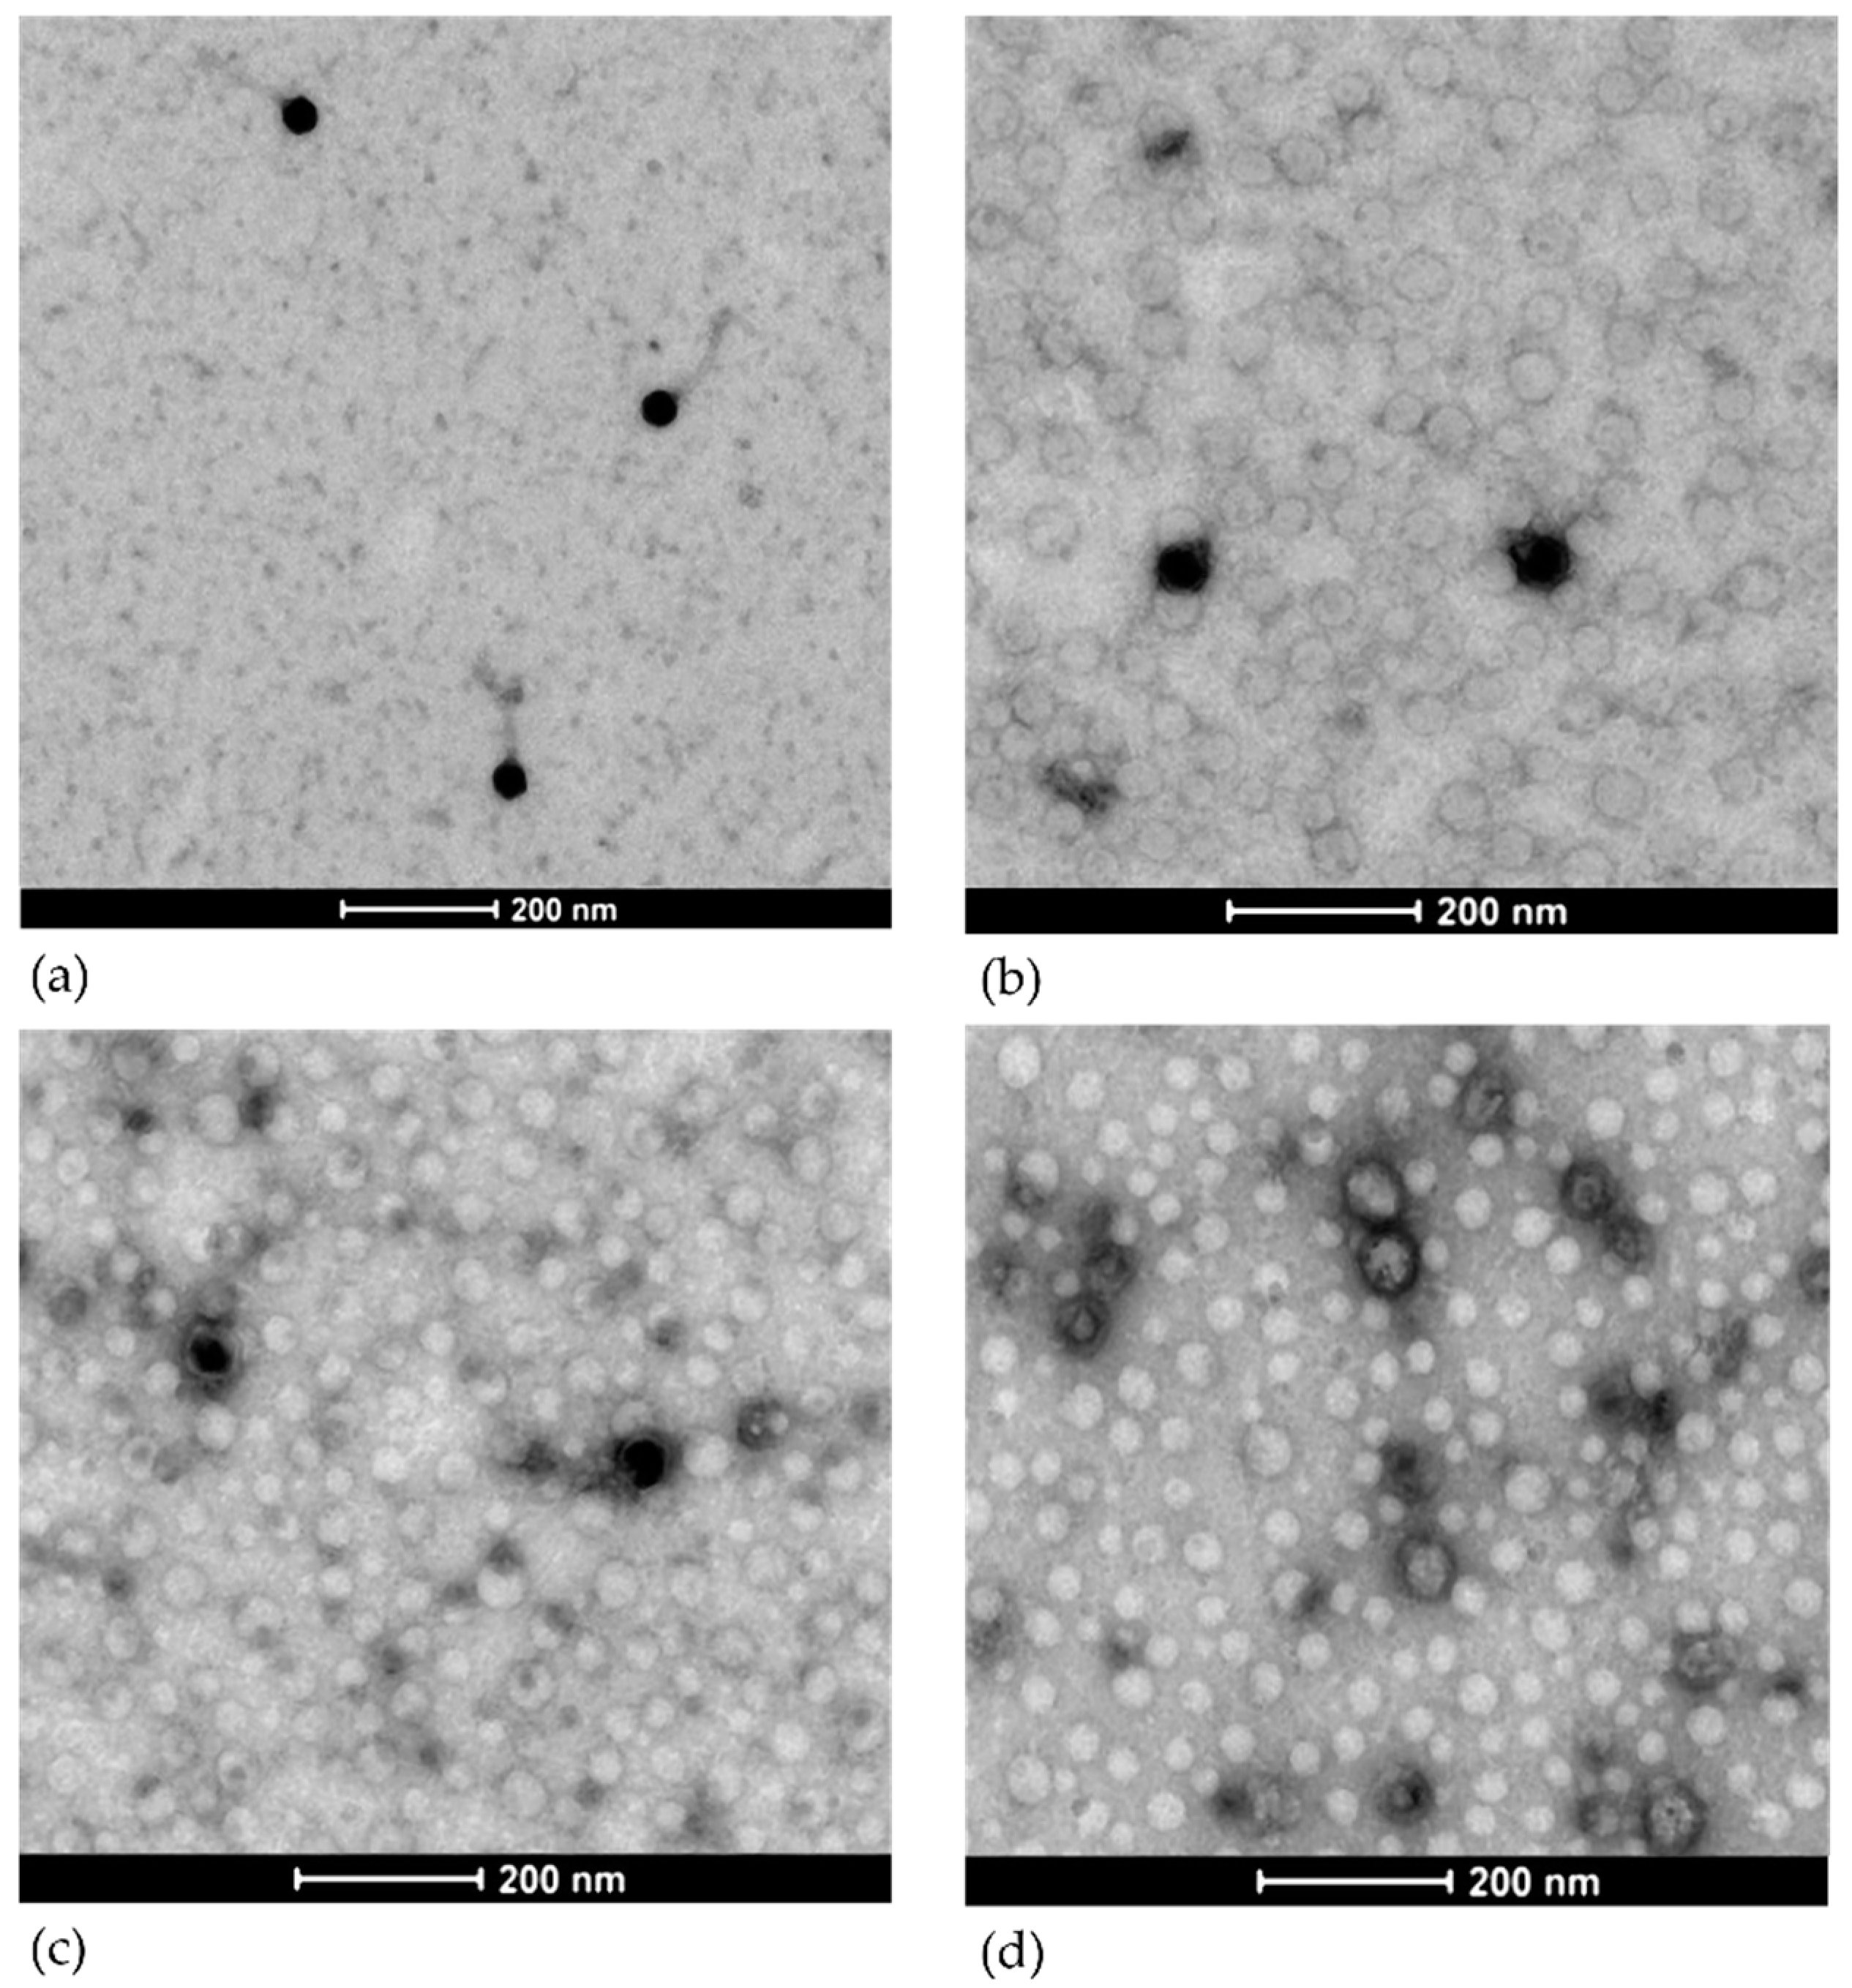
3.3. Transmission Electron Microscopy

Electron microscopy analyses showed that the four phages can be assigned to the order of Caudovirales. vB_EcoS_K1-ULINTec2 is characterized by an icosahedral symmetric non-enveloped head, with a diameter of approximately 50 nm, and a flexible, non-contractile tail approximately 150 nm in length, and is attributed to the Siphoviridae family (Figure 4a). vB_EcoP_K1-ULINTec4 is characterized by an icosahedral symmetric non-enveloped head, with a diameter of approximately 50 nm, and a very short tail, and is attributed to the Podoviridae family (Figure 4b). vB_EcoP_K1-ULINTec6 is characterized by an icosahedral symmetric non-enveloped head, with a diameter of approximately 60 nm, and a very short tail, and is attributed to the Podoviridae family (Figure 4c). vB_EcoP_K1-ULINTec7 is characterized by an icosahedral symmetric non-enveloped head, with a diameter of approximately 55 nm, and a very short tail, and is attributed to the Podoviridae family (Figure 4d).

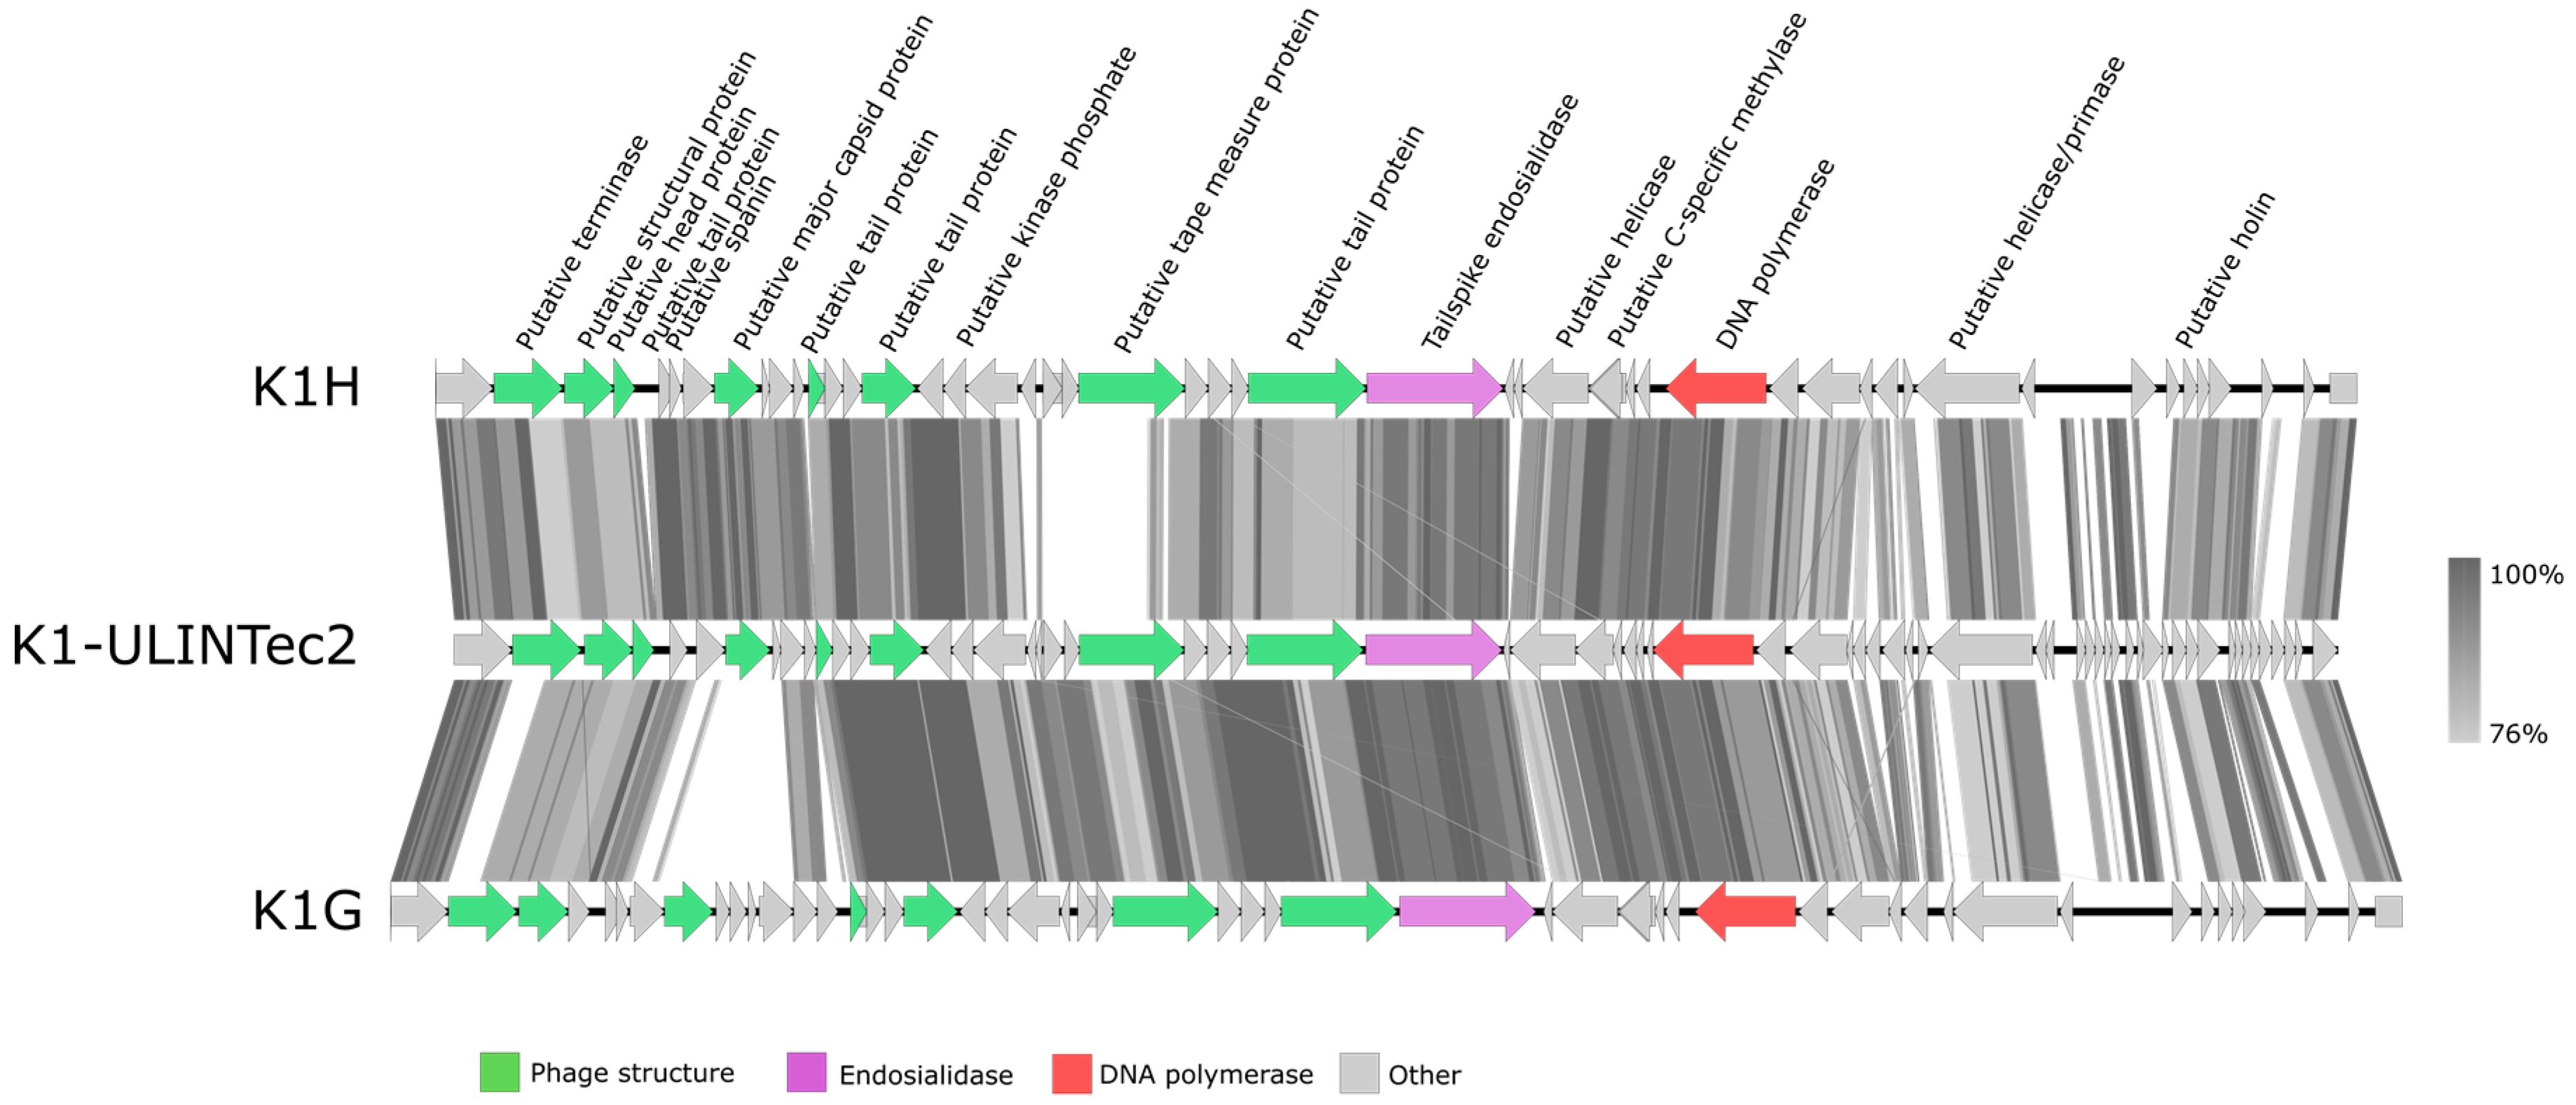
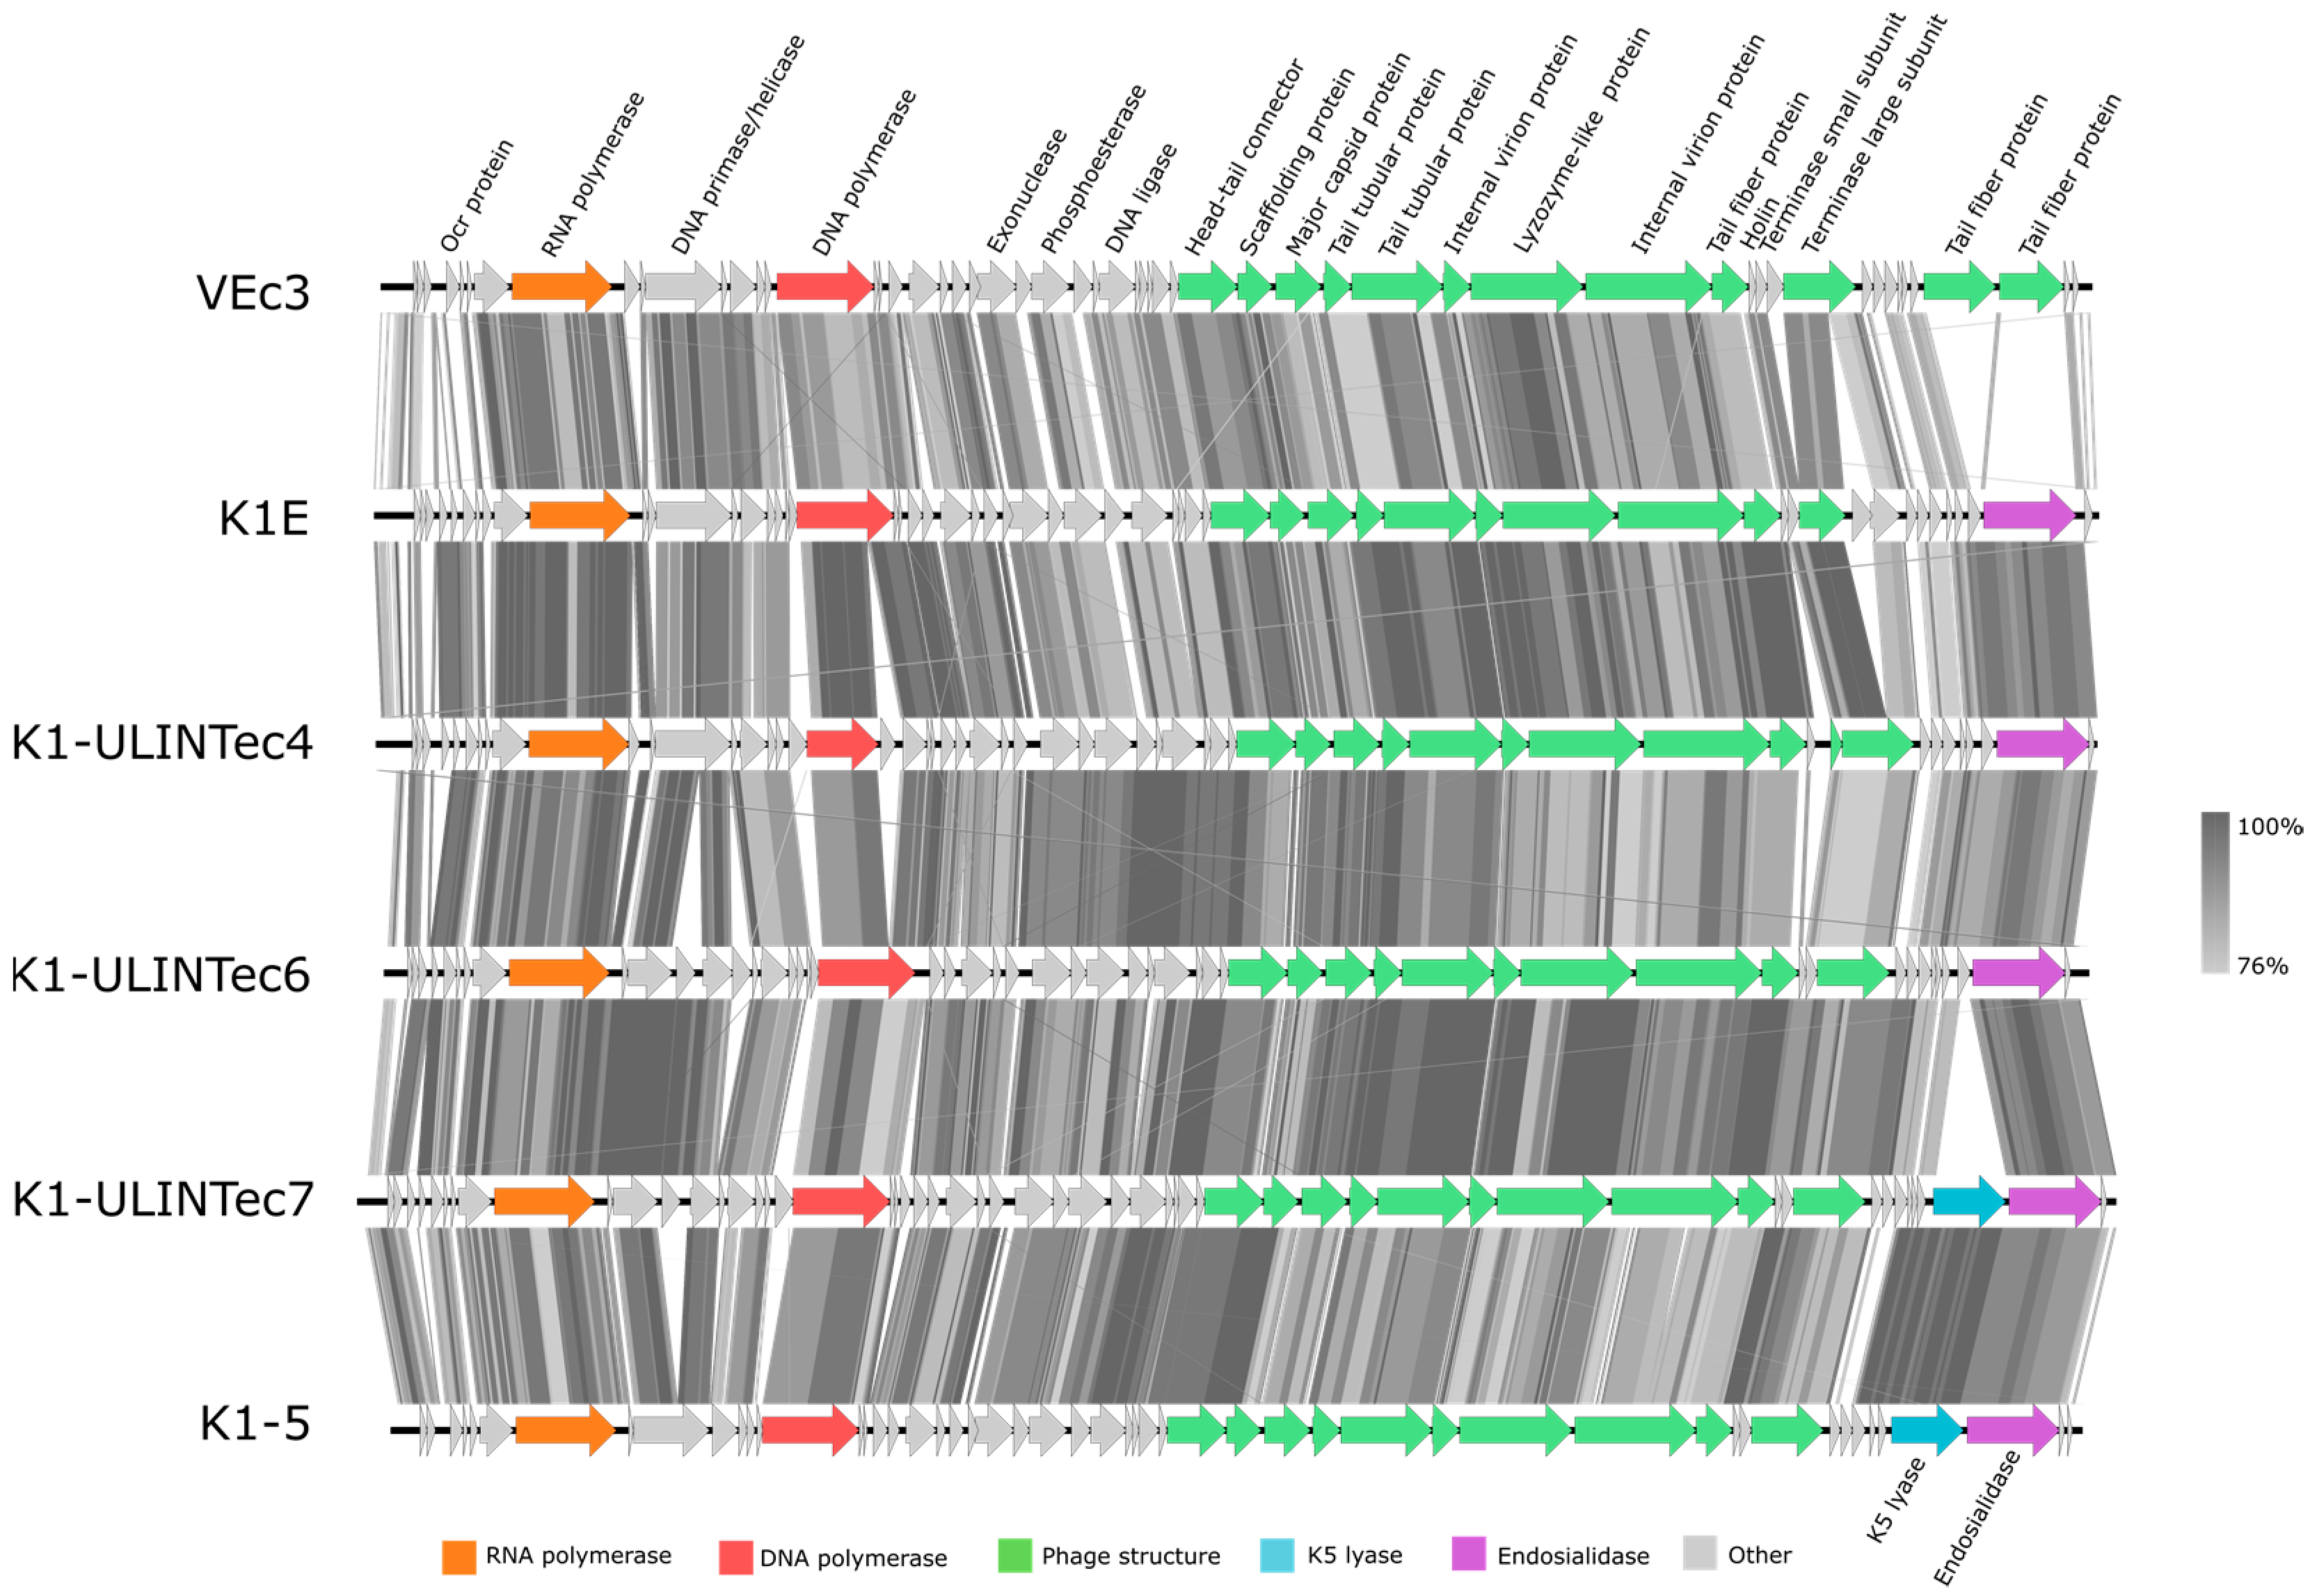
3.4. DNA Sequencing and Phage Genome Annotation

Phage genome analysis showed that the four phages belong to the Caudovirales order. Phage vB_EcoS_K1-ULINTec2 (40,815 bp) is a siphovirus related to the Kagunavirus genus. It shares 96% and 94% identity with phages K1G and K1H, respectively. Phages vB_EcoP_K1-ULINTec4 (45,159 bp), vB_EcoP_K1-ULINTec6 (44,728 bp), and vB_EcoP_K1-ULINTec7 (46,142 bp) belong to the Autographiviridae family and to the Vectrevirus genus. K1E shares the strongest identity with vB_EcoP_K1-ULINTec4 (97%), followed by both vB_EcoP_K1-ULINTec6 and vB_EcoP_K1-ULINTec7 (94%). Phage VEc3 shares between 94 and 96% identity with the three Vectrevirus, and phage K1-5 showed 92% identity with vB_EcoP_K1-ULINTec7. Homology detection and structure prediction by HMM-HMM analysis HHpred [53] revealed that all phages encode a putative endosialidase, and that vB_EcoP_K1-ULINTec7 additionally encodes a K5 lyase not present in the three other phages isolated. No gene related to lysogeny or virulence was revealed, suggesting the strictly lytic characteristics of these phages. Comparisons of phage genomes are shown in Figure 5 (Kagunavirus) and Figure 6 (Vectrevirus). Sequencing was submitted as NCBI BioProject SUB10289878. GenBank accession numbers are MZ997838 (vB_EcoS_K1-ULINTec2), MZ997839 (vB_EcoP_K1-ULINTec4), MZ997840 (vB_EcoP_K1-ULINTec6), and MZ997841 (vB_EcoP_K1-ULINTec7).

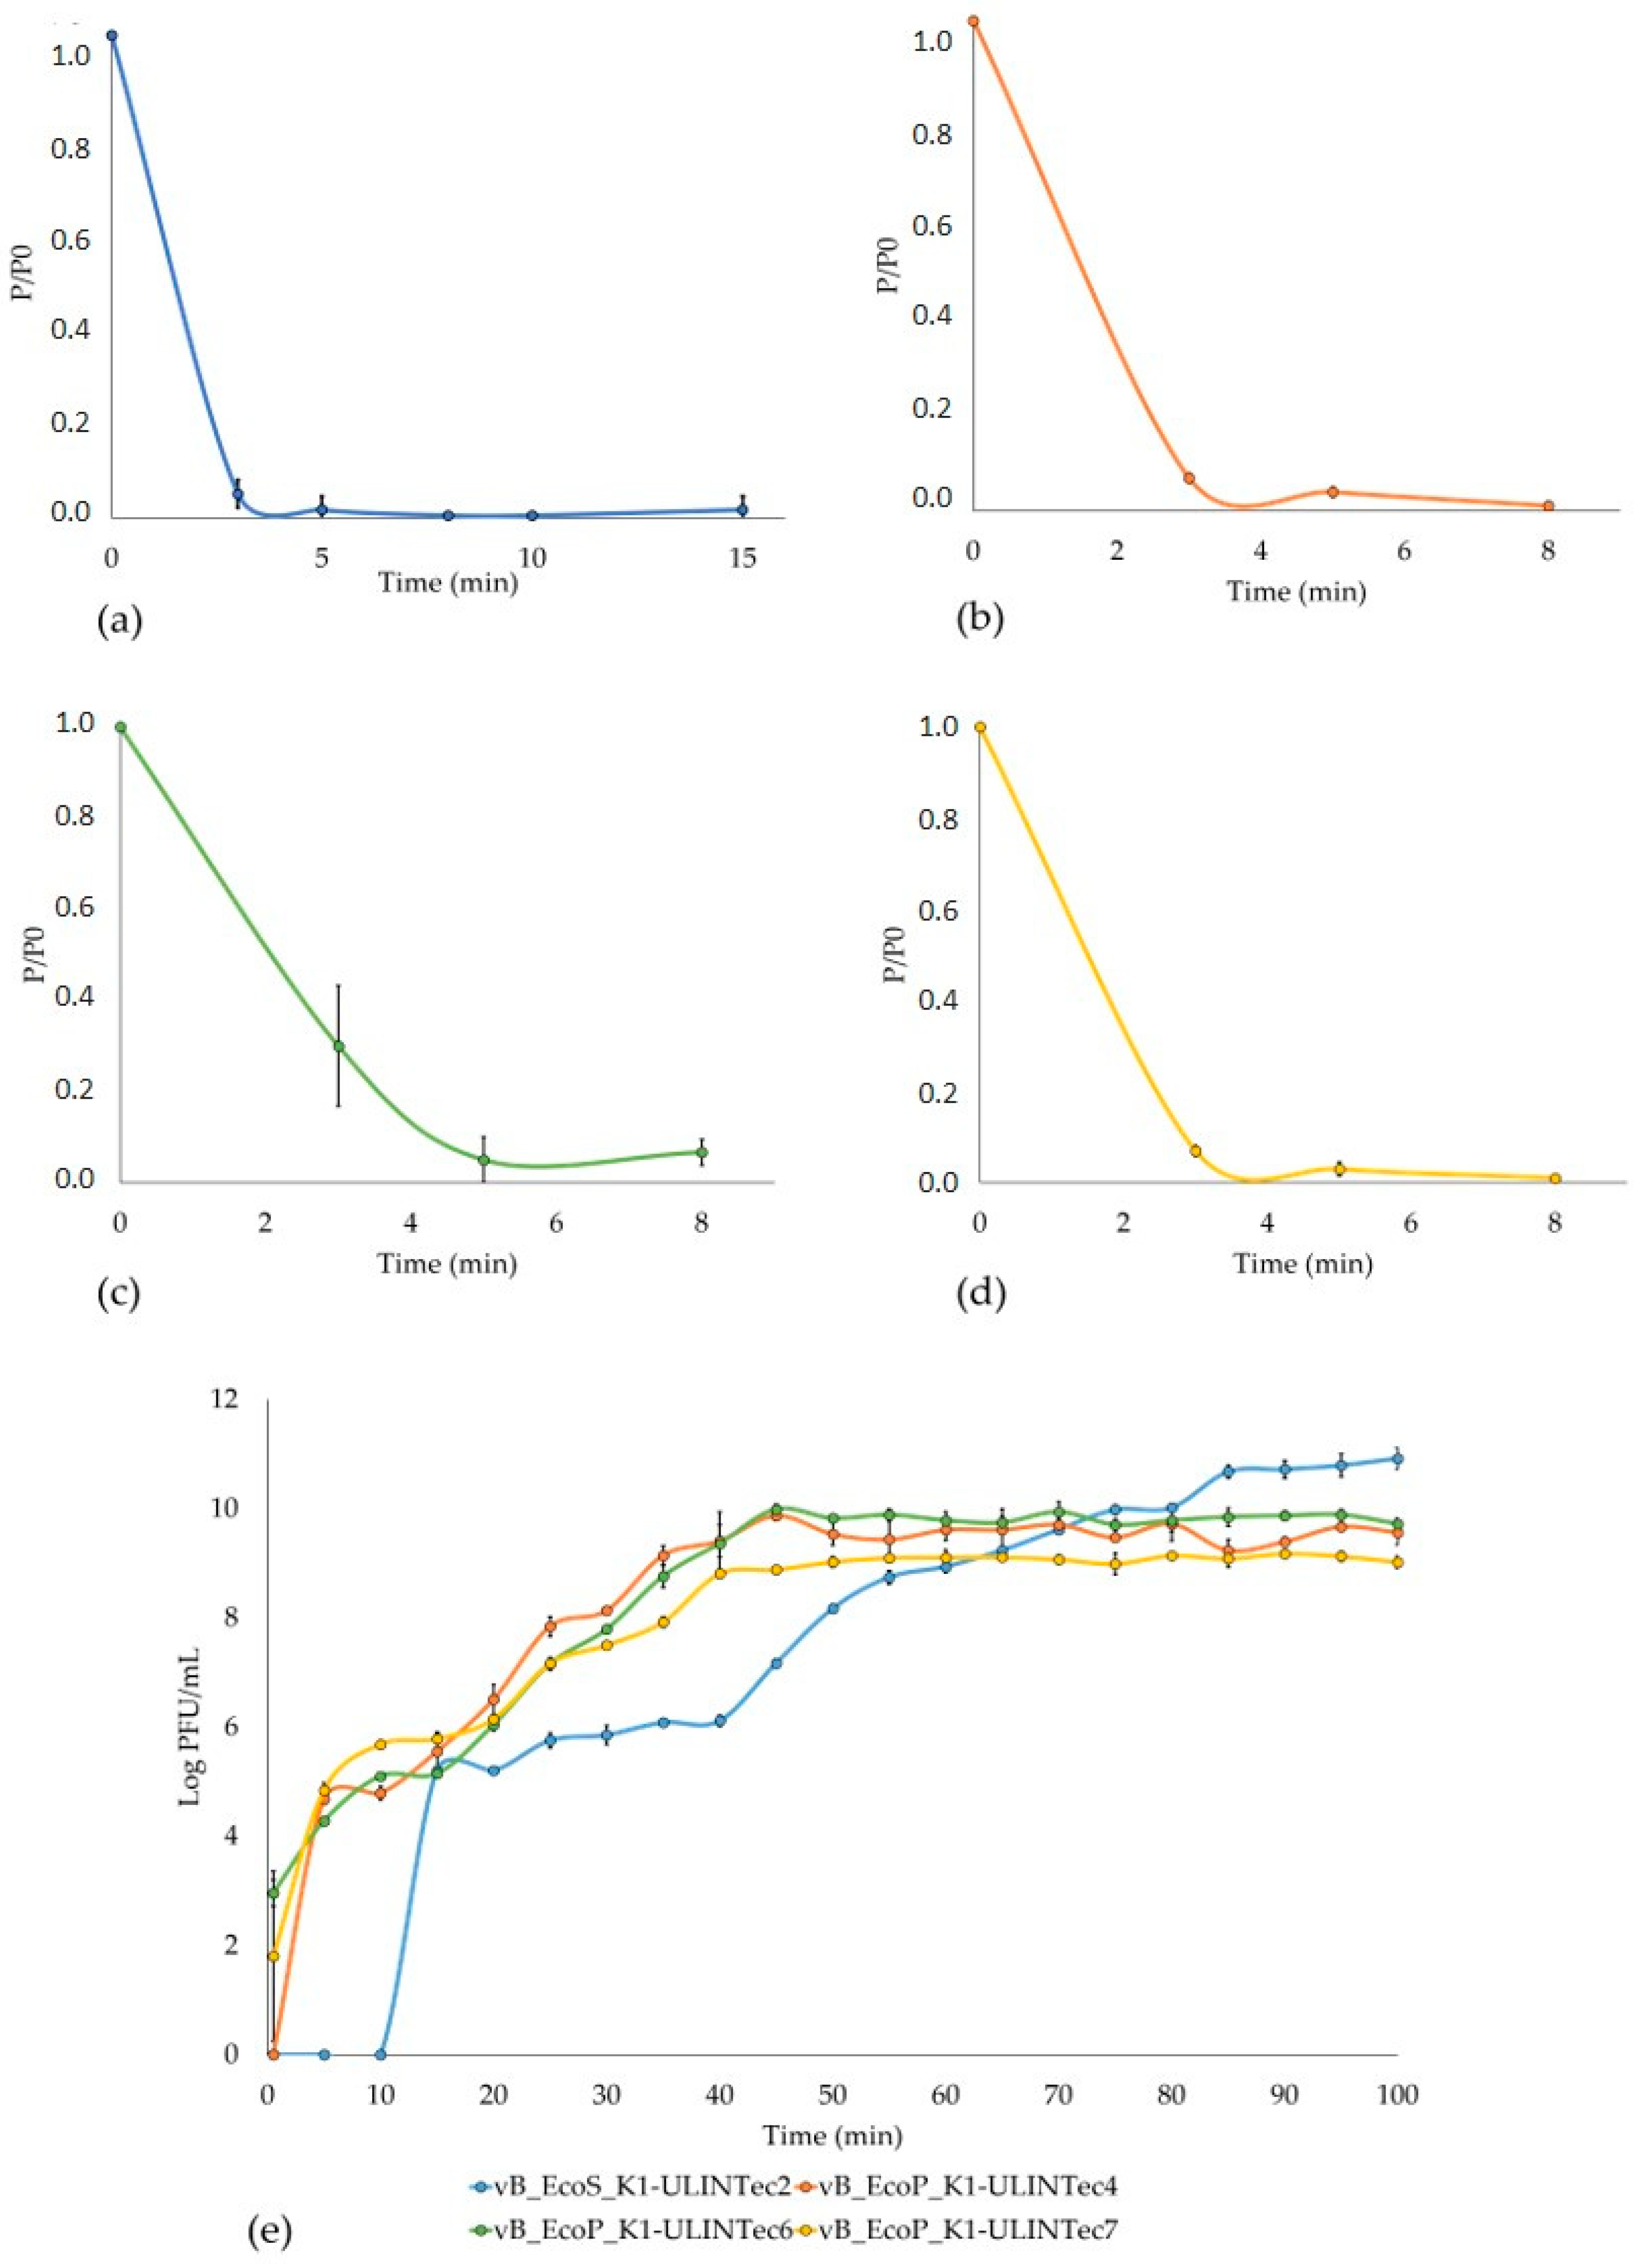
3.5. Adsorption Time and Low MOI Phage Kinetics

In order to obtain more information about the infection cycle of these phages, the adsorption time and the phage production at low MOI were assessed. The respective adsorption times of vB_EcoS_K1-ULINTec2, vB_EcoP_K1-ULINTec4, vB_EcoP_K1-ULINTec6, and vB_EcoP_K1-ULINTec7 were <3 min, <3 min, 5 min, and <3 min (Figure 7 a–d). The latency periods, respectively, lasted 10–15 min, <5 min, <5 min, and <5 min (Figure 7e). The highest phage production was reached in 80 min by vB_EcoS_K1-ULINTec2, with a titer of 6 × 10¹⁰ PFU/mL, followed by the three Vectrevirus that reached the stationary phase after 45 min. The respective phage productions of vB_EcoP_K1-ULINTec4, vB_EcoP_K1-ULINTec6, and vB_EcoP_K1-ULINTec7 were 3.7 × 10⁹ PFU/mL, 6.7 × 10⁹ PFU/mL, and 1.2 × 10⁹ PFU/mL (Figure 7e).

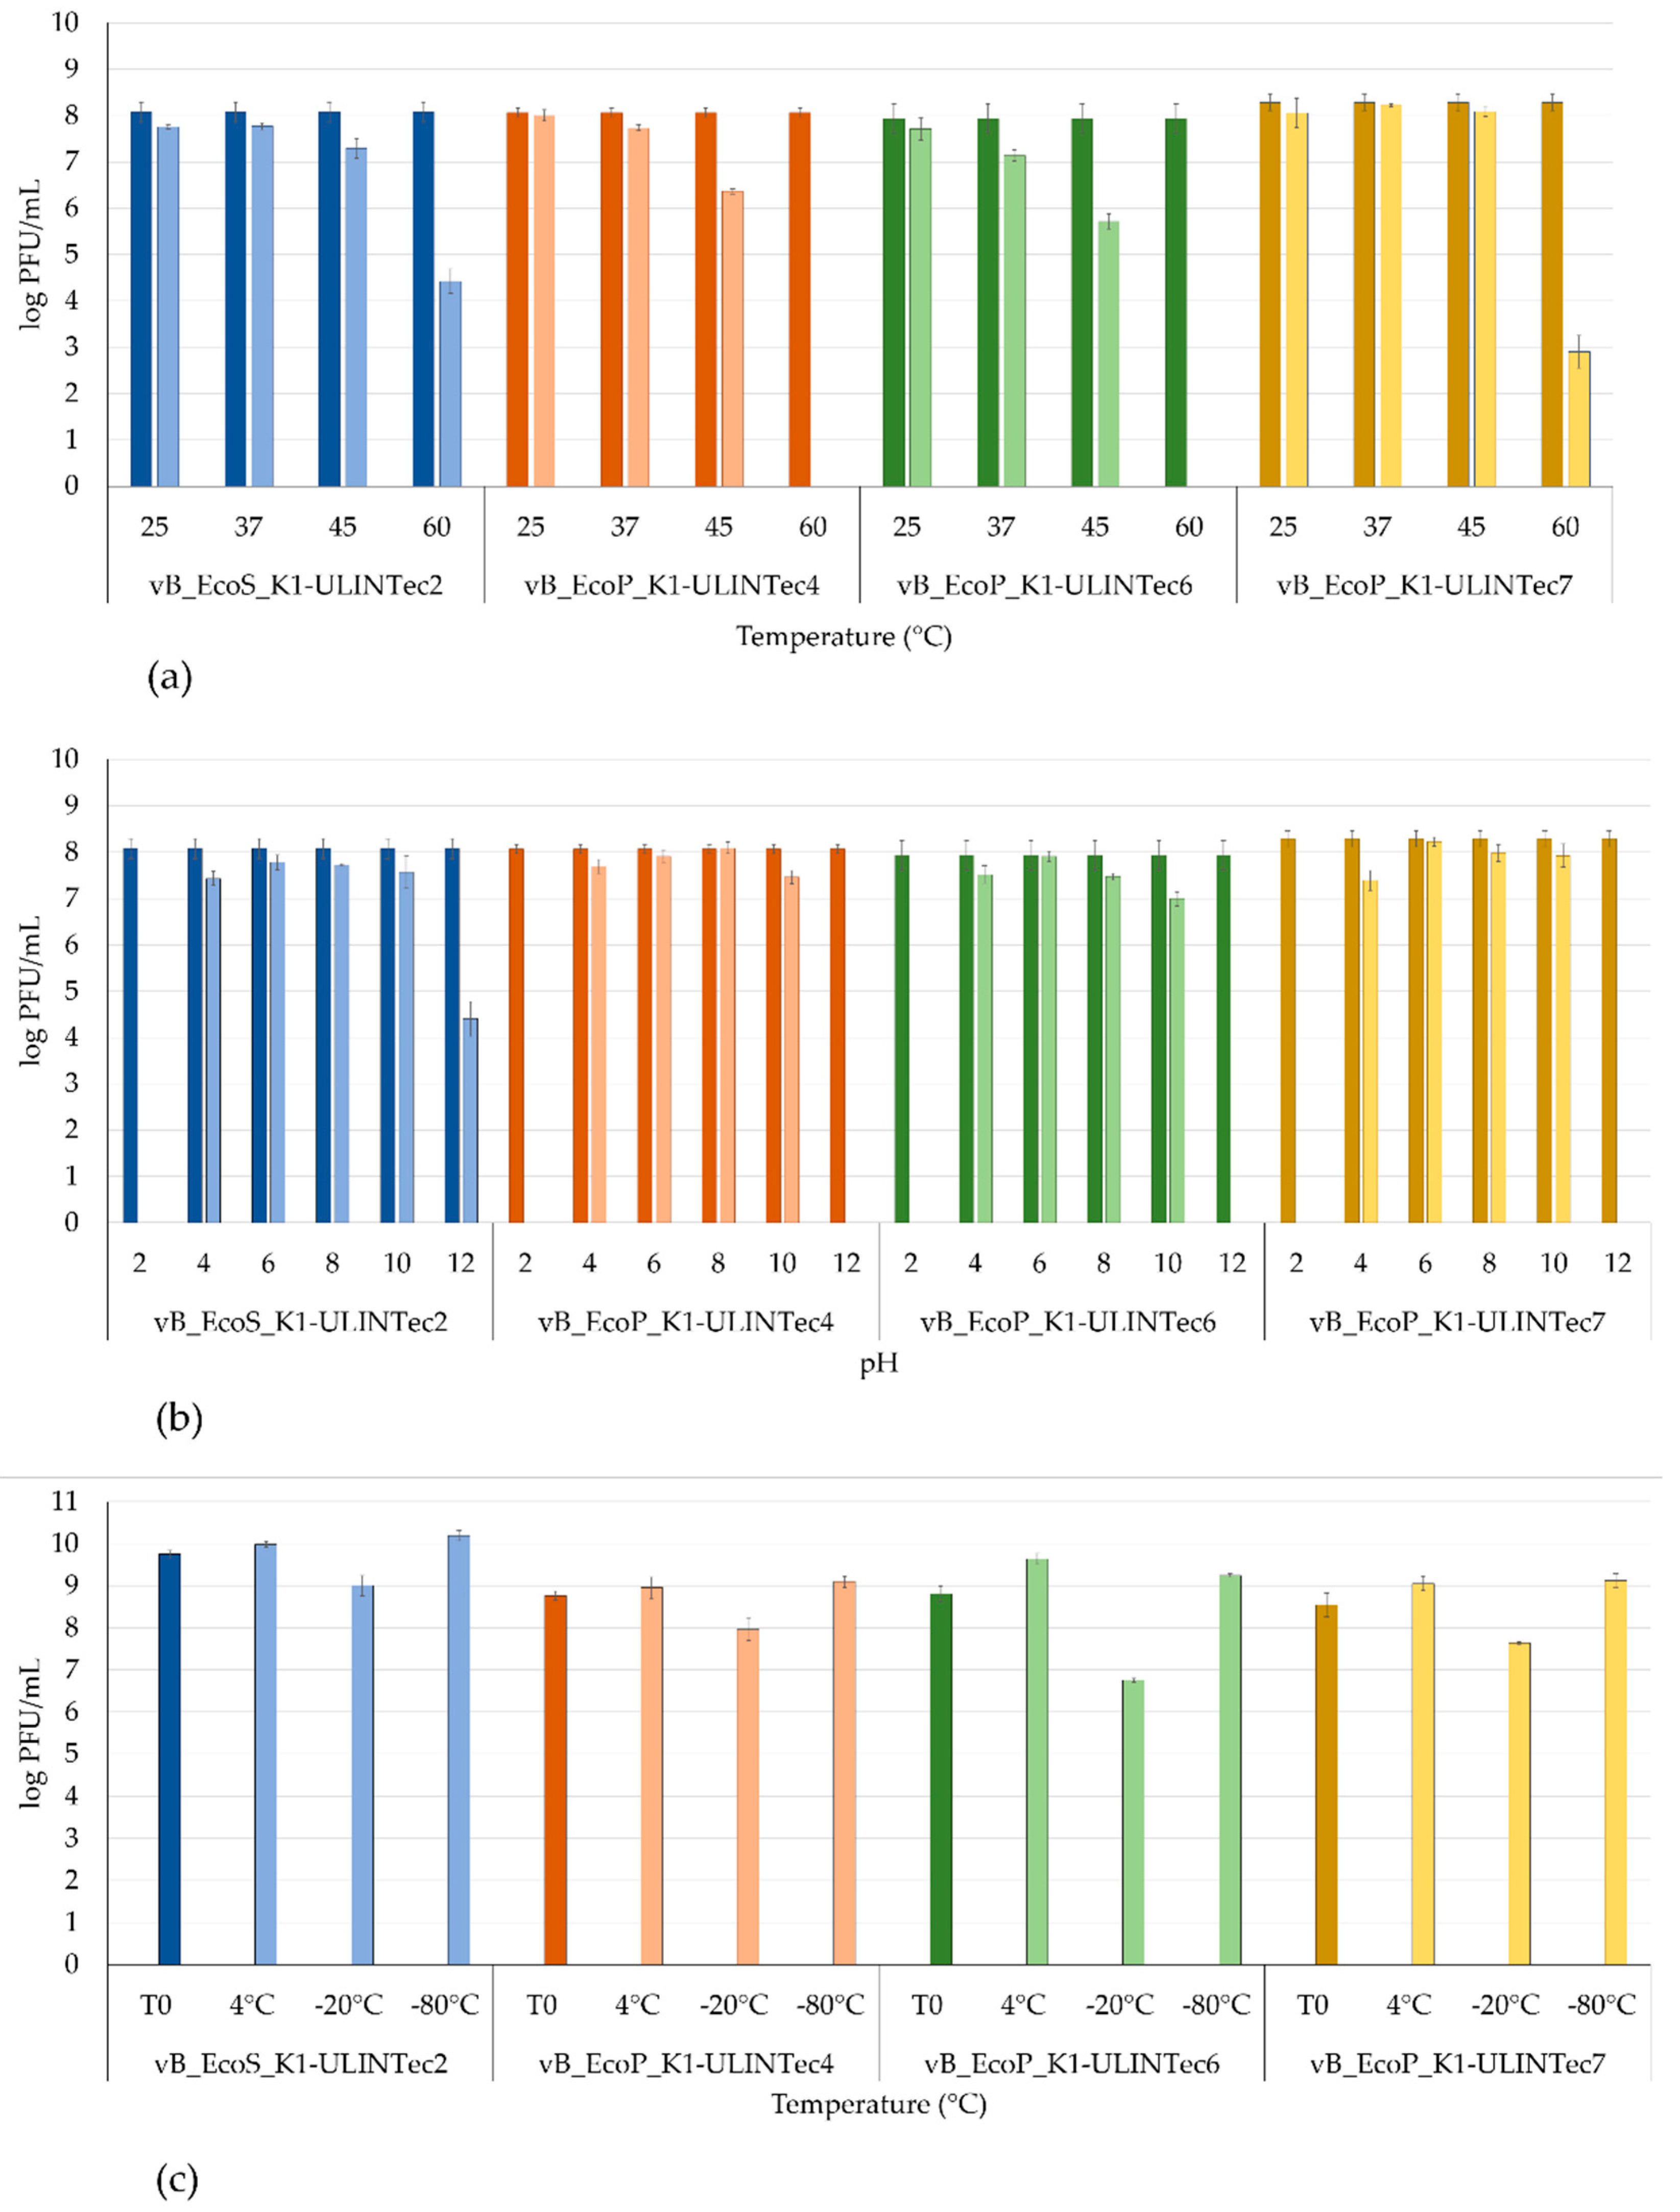
3.6. Temperature and pH Stability

All phages remained stable (<1 log PFU/mL reduction) at temperatures of 25 °C and 37 °C, and phages vB_EcoS_K1-ULINTec2 and vB_EcoP_K1-ULINTec7 were also stable at 45 °C (Figure 8a). At 60 °C, phages vB_EcoP_K1-ULINTec4 and vB_EcoP_K1-ULINTec6 were not detectable, while the loss of titer of vB_EcoS_K1-ULINTec2 and vB_EcoP_K1-ULINTec7 was about 4 log PFU/mL and 5 log PFU/mL, respectively (Figure 8a). Regarding the pH stability, the four phages remained stable between pH 4 and pH 10, but none of them were detected at pH 2, and only vB_EcoS_K1-ULINTec2 was titrated at pH 12 with a loss of 4 log PFU/mL (Figure 8b). The 8 months storage at 4 °C and −80 °C allowed maintaining the titers of all phages, unlike the −20 °C storage, which led to a decrease in phage titer of approximatively 0.5 and 1.5 log PFU/mL (Figure 8c).

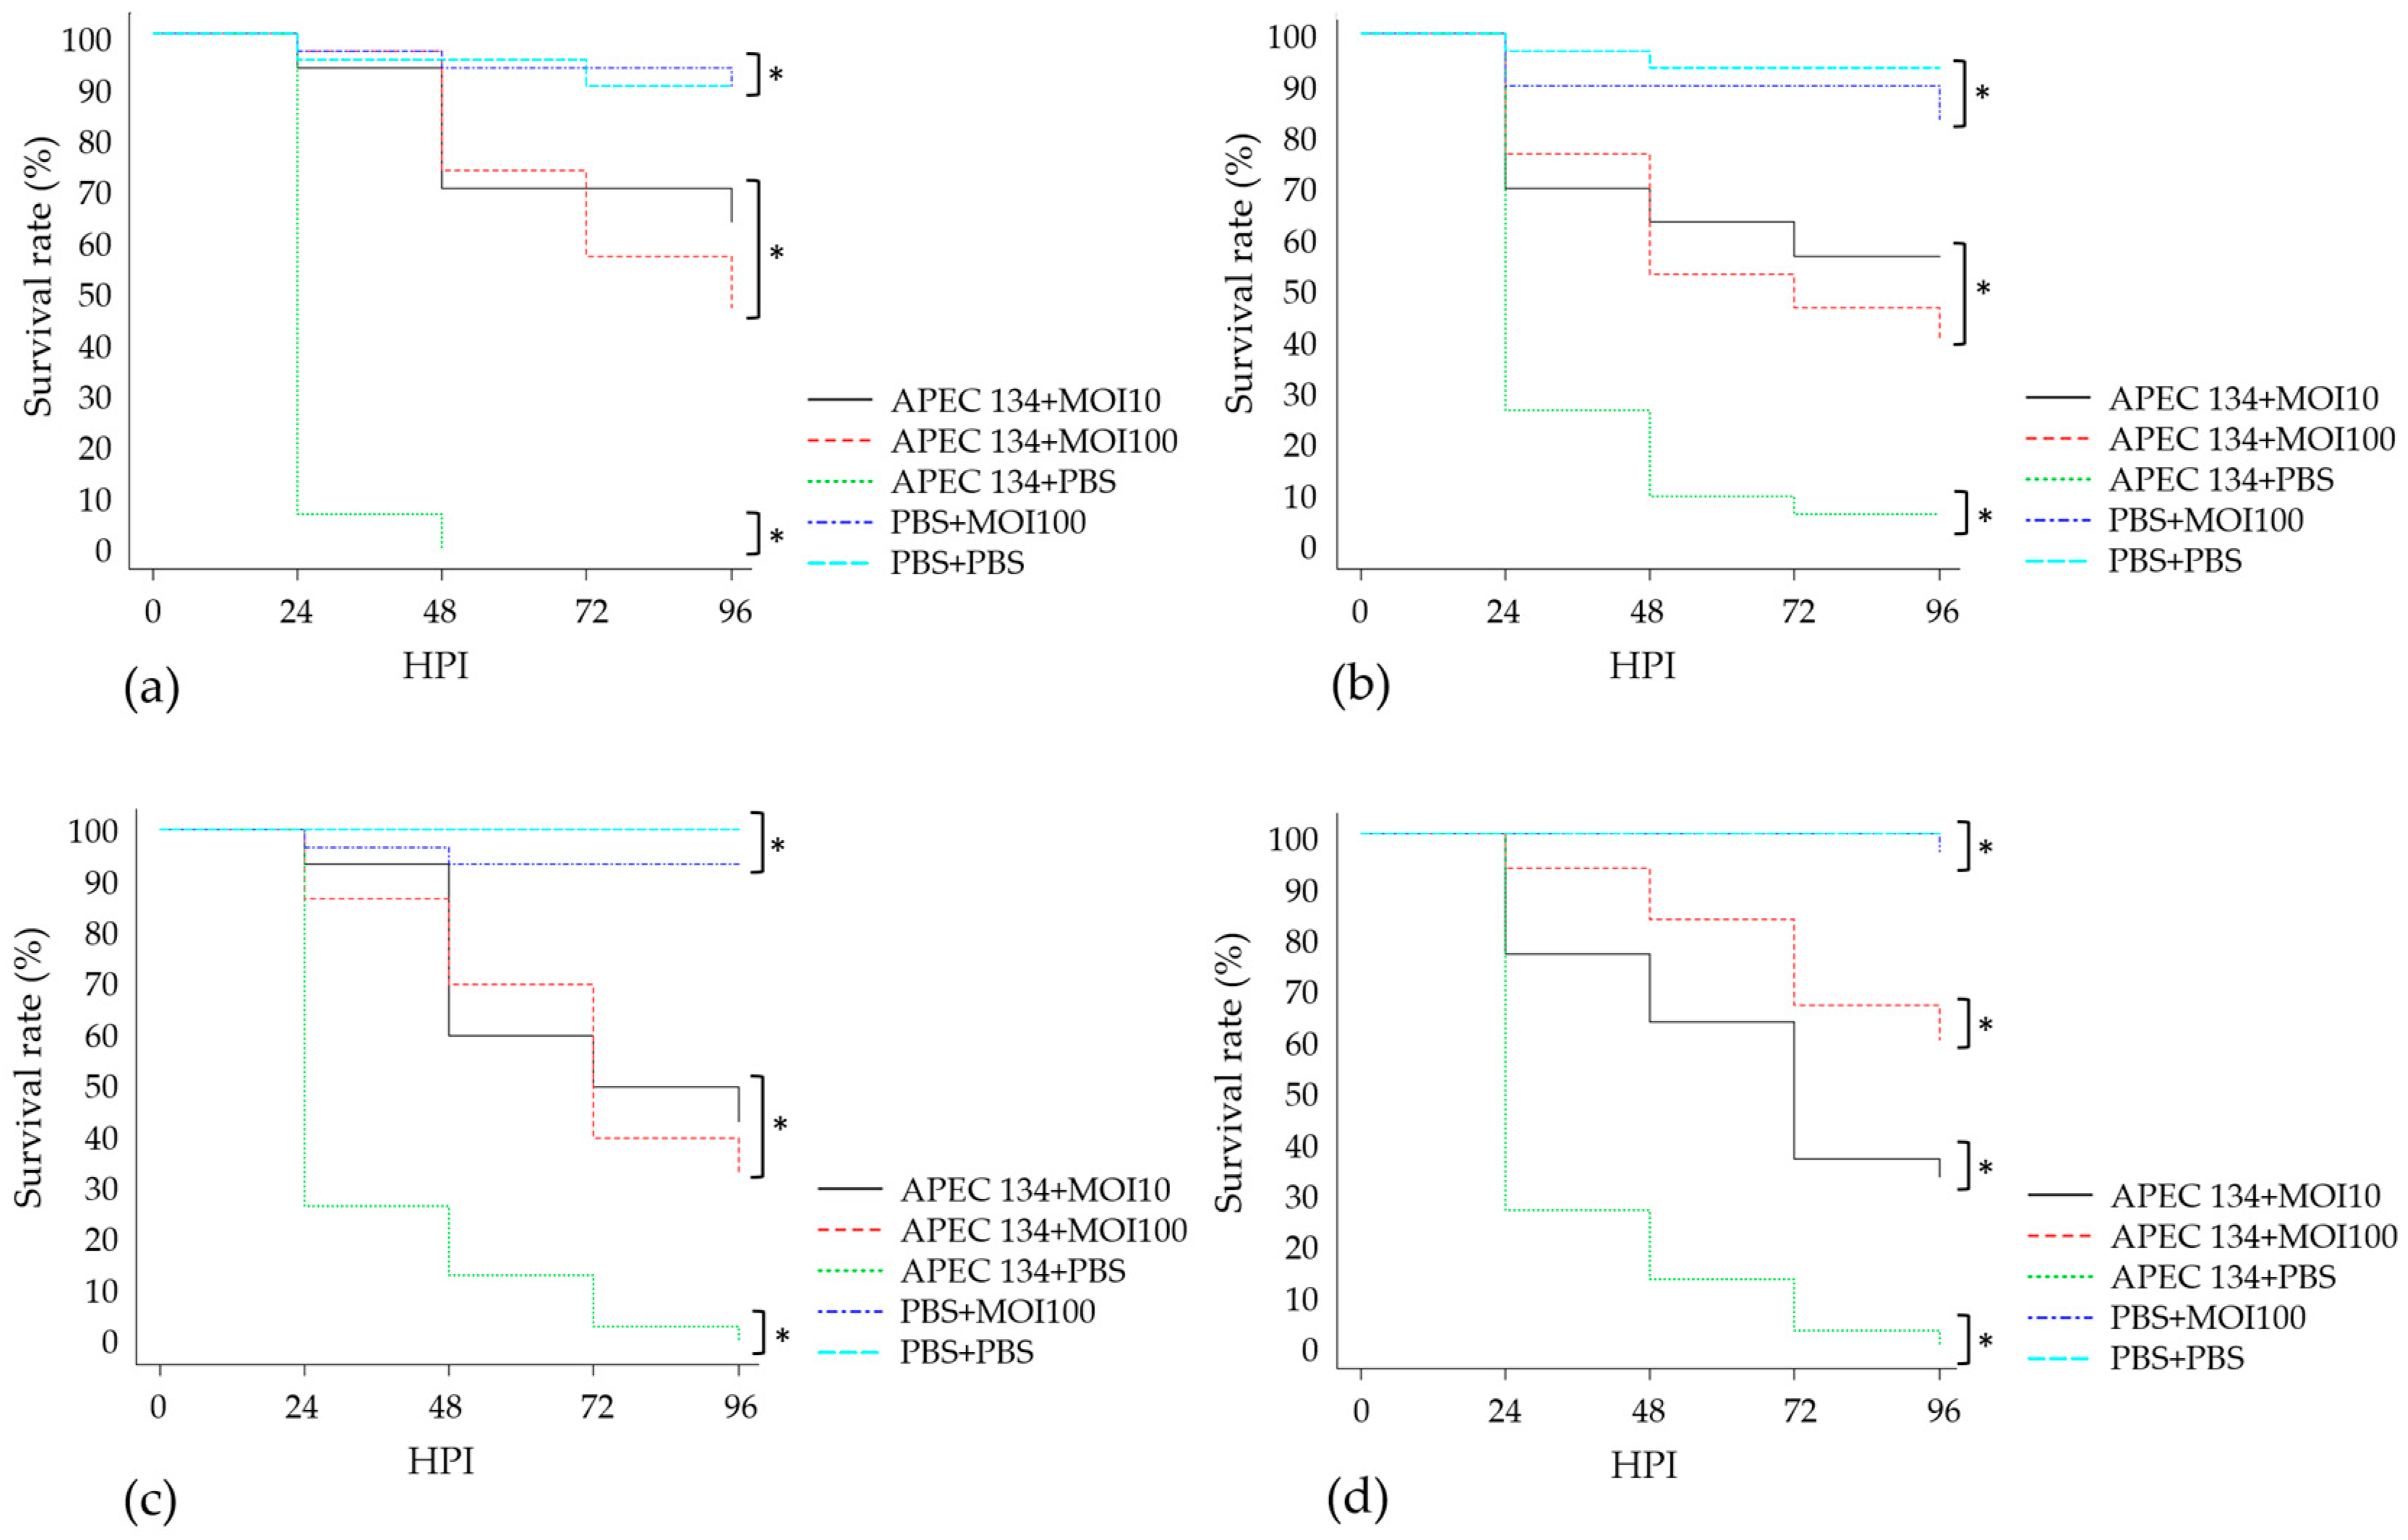
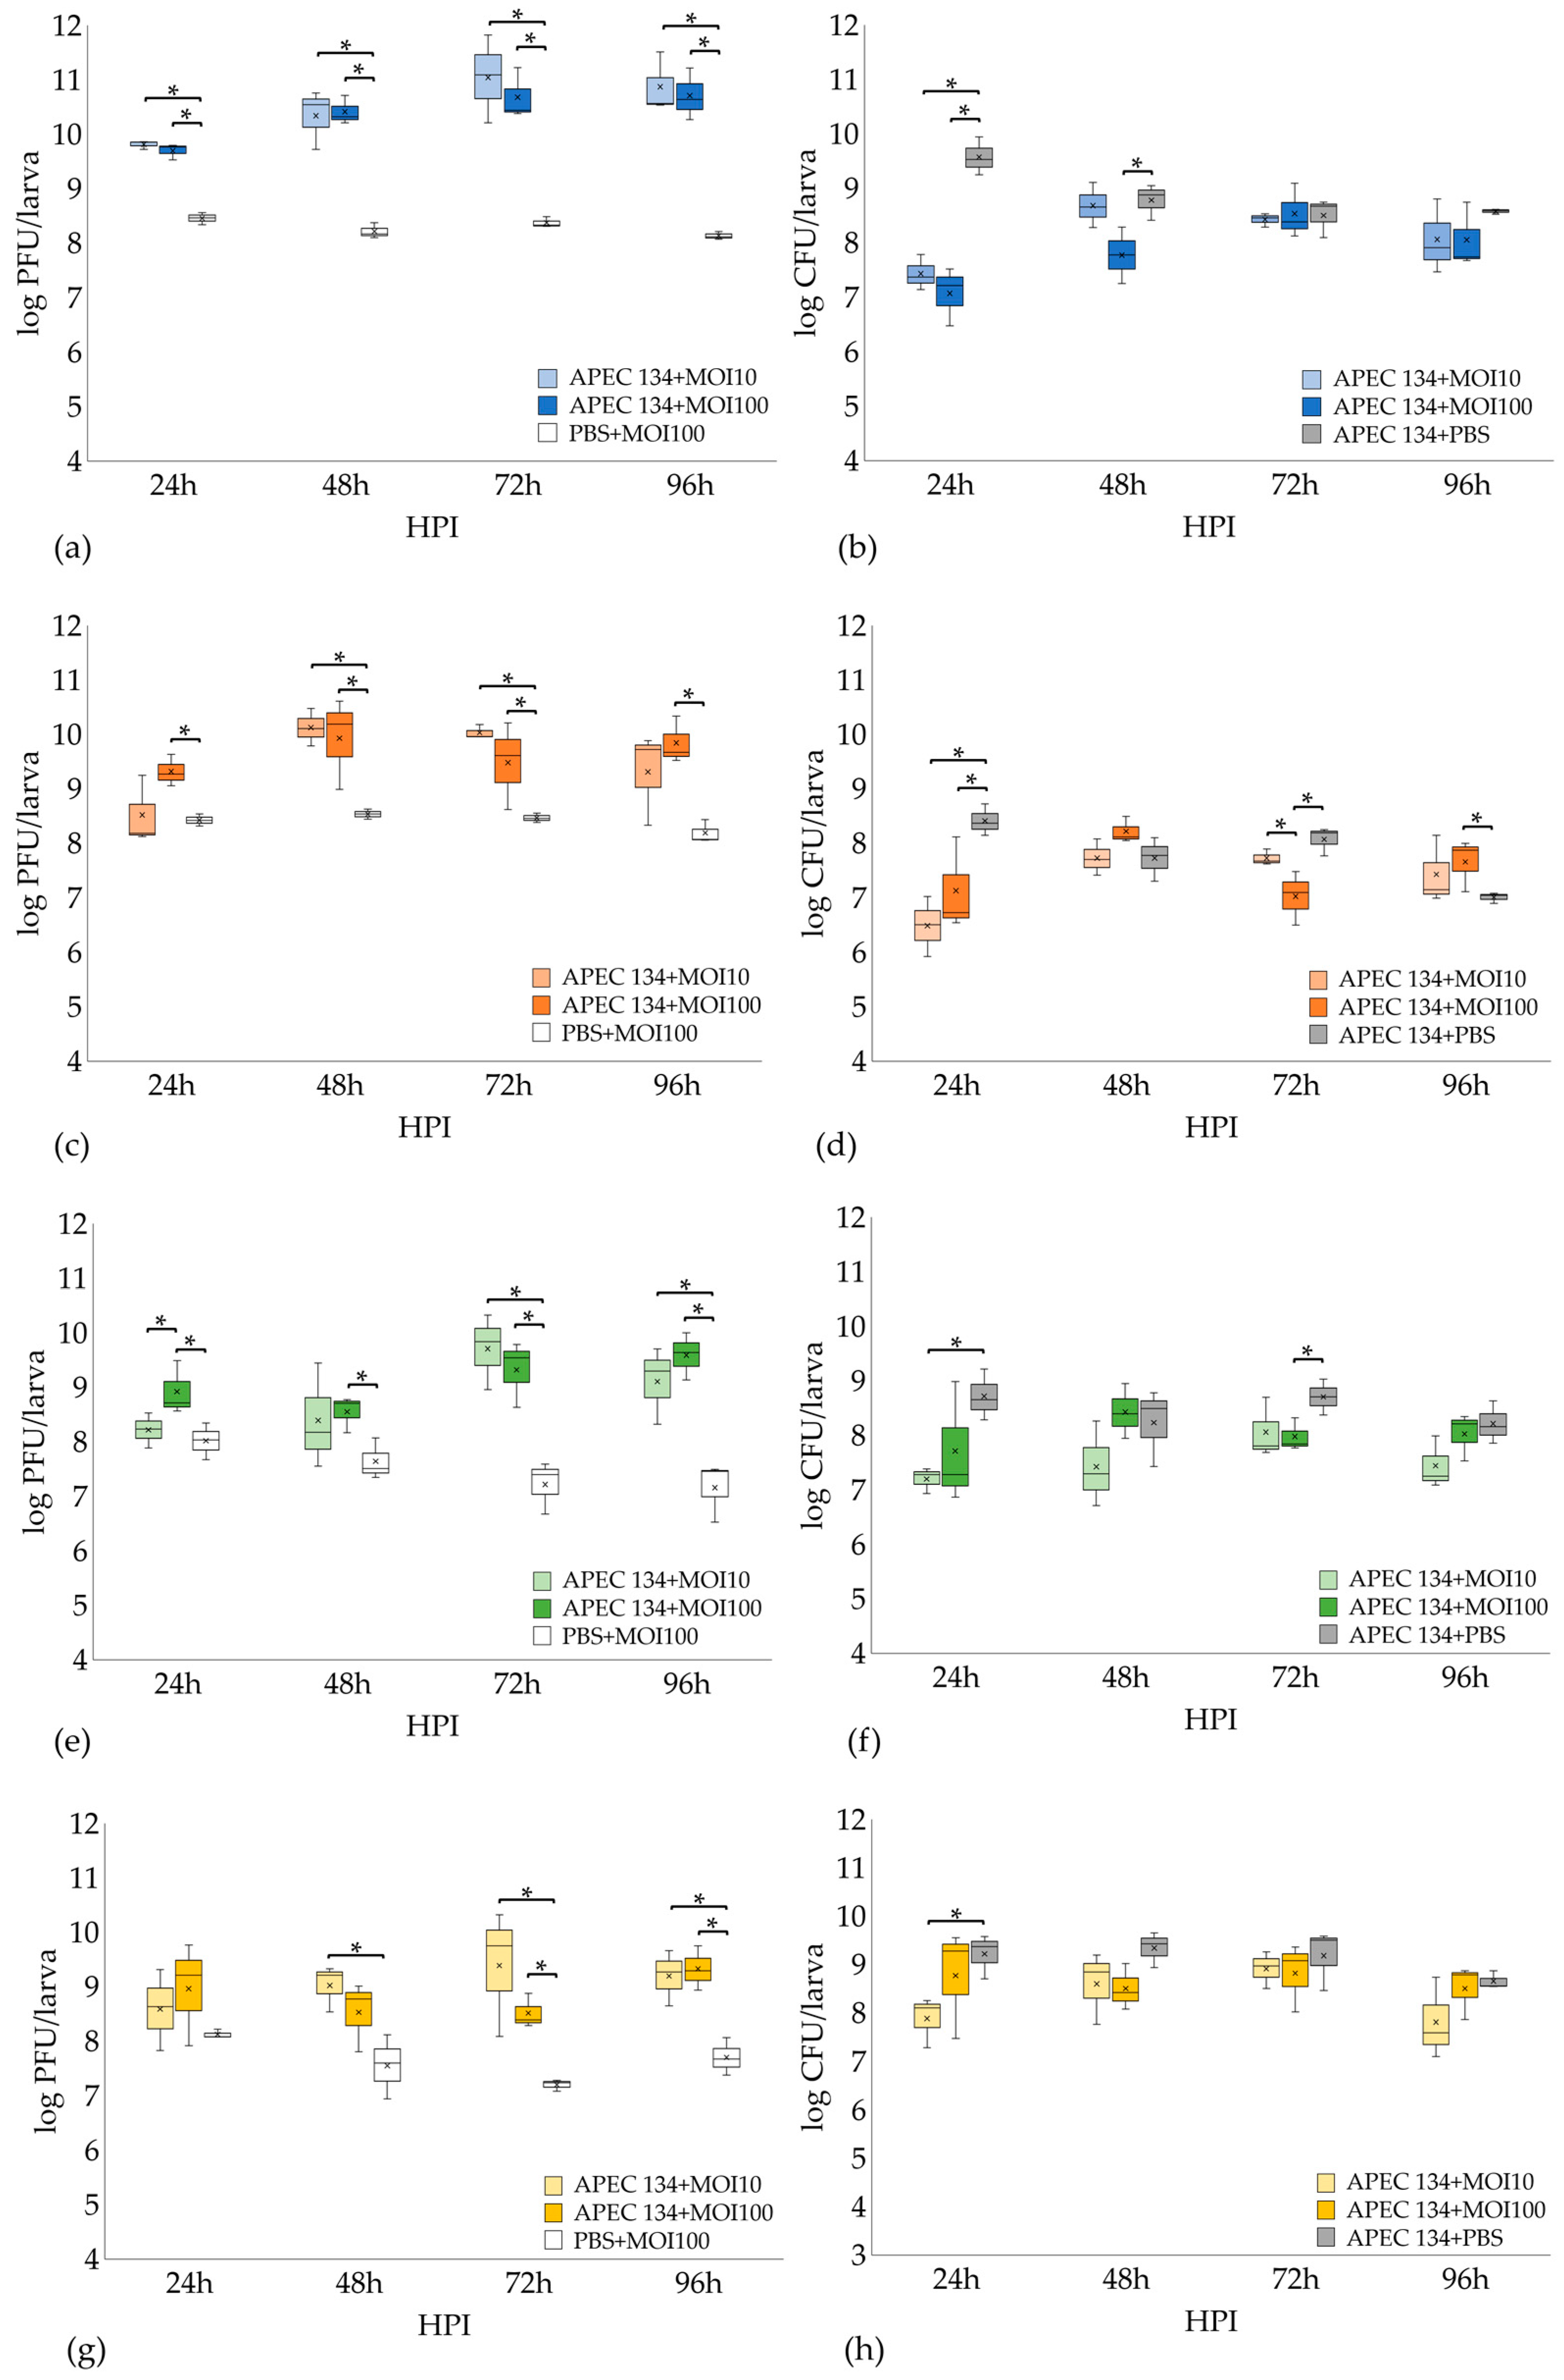
3.7. In Vivo Assay: Galleria Mellonella

Groups treated with phage vB_EcoS_K1-ULINTec2 showed better survival rates than the infected untreated control (APEC 134 + PBS). The larvae survival rates of the phage treated groups were nevertheless lower than the uninfected controls (PBS + PBS and PBS + phage) (50–60% vs. 90% of survival 96 HPI). The larvae survival rates of the groups treated with a MOI of 10 or 100 were not significantly different. Quite similar results were obtained for the phages vB_EcoP_K1-ULINTec4 and vB_EcoP_K1-ULINTec6, for which an increased survival was observed after the phage treatment. Larvae treated with vB_EcoP_K1-ULINTec7 showed better survival rates than the infected untreated control (APEC 134 + PBS). The larvae survival rates of the groups treated with these phages were nevertheless lower than the uninfected controls. This phage allowed a better larvae survival rate in the group treated at a MOI of 100 (60% of survival), in comparison with a MOI of 10 (35% of survival). The Kaplan–Meier survival curves are shown in Figure 9.
In order to deeply assess the efficacy of these phages, bacterial and phage concentrations were measured every 24 h for 96 h. In the vB_EcoS_K1-ULINTec2 experiment, phage titers significantly increased in the infected treated groups (MOI 10 and MOI 100) compared to the phage control group at each titration. In the phage control group, the dose inoculated at H0 remained stable over the 4 days (Figure 10a). After 24 HPI, bacterial concentrations were significantly lower in the treated infected groups (MOI 10 and 100) compared to the untreated infected control. At 48 HPI post inoculation, only the group treated with a MOI of 100 produced a lower concentration. Bacterial titers were not significantly different at 72 HPI and 96 HPI (Figure 10b).
Larvae treated with phage vB_EcoP_K1-ULINTec4 at a MOI of 100 showed significantly higher phage concentrations than the phage control group. The group treated with a MOI of 10 was not significantly different from the control but still showed an increase in titer compared to H0 (107 PFU/larva). It was at 48 HPI that larvae treated with a MOI of 10 and 100 both become significantly higher than the phage control group. Phage titers were still significantly higher at both 72 HPI and 96 HPI in larvae treated with an MOI of 100, and only at 72 HPI with a MOI of 10. In the phage control group, the dose inoculated at H0 remained stable for the 4 days of titration (Figure 10c). Bacterial concentrations were significantly lower in the infected treated groups (MOI 10 and MOI 100); 24 HPI compared to the untreated infected control. After 48 HPI the bacterial titers were no longer significantly different from each other. At 72 HPI, larvae treated with a MOI of 100 showed lower bacterial concentrations than the MOI 10 and untreated infected groups. The bacterial titer of the MOI 100 treated group was significantly higher than the untreated group, at 96 HPI (Figure 10d).
Groups treated with vB_EcoP_K1-ULINTec6 with a MOI of 100 showed a concentration significantly higher than the groups treated with a MOI of 10 and higher than the phage control group at 24 HPI. At 48 HPI, 72 HPI, and 96 HPI, phage concentrations in larvae treated with a MOI of 100 were significantly higher than the phage control group, while larvae treated with a MOI of 10 led to significantly higher concentrations at 72 HPI and 96 HPI (Figure 10e). For bacterial titers, larvae treated with a MOI of 10 showed a significantly lower titer than the untreated infected control at 24 HPI. Groups treated with a MOI of 100 were significantly lower than the infected untreated groups (Figure 10f).
The titration experiment performed with vB_EcoP_K1-ULINTec7 showed that phage titers were not significantly different between the infected treated groups and the phage control group at 24 HPI. The phage concentration was significantly higher in the MOI 10 treated group compared to the phage control group at 48 HPI. At 72 HPI and 96 HPI the two infected treated groups (MOI 10 and MOI 100) showed significantly higher phage concentrations than the phage control group (Figure 10g). The bacterial concentration measured in the MOI 10 treated group was significantly lower than in the untreated group at 24-h post-inoculation, which was not the case for the MOI 100 treated group. At 48, 72, and 96 h post-inoculation, the bacterial titers were not significantly different between the groups (Figure 10h).

4. Discussion

Among the 11 phages isolated against the avian strain O18:K1 (APEC 45), four had a narrow host spectrum specific to the capsular type K1: vB_EcoS_K1-ULINTec2, vB_EcoP_K1-ULINTec4, vB_EcoP_K1-ULINTec6, and vB_EcoP_K1-ULINTec7. This specificity represents an advantage for phage therapy, as it allows a precise targeting of specific bacteria, in contrast to antibiotic treatments, which affect a wider range of species, thus disrupting the microbiota.
The efficiency of plating showed that the host spectrum of these phages was even narrower than observed for the host range. Some strains were very weakly, or not at all, lysed. Some lysis reactions showed that the phages were not able to replicate in these strains, but still produced lytic zones at the highest concentrations. This lysis may have been due to a phenomenon called abortive infection, which describes a non-productive phage infection that kills bacteria [54], or to the presence of an enzyme degrading the polysialic acid of the K1 capsule. Several phages described in the literature, indeed, possess endosialidases that allow them to degrade the K1 capsule of E. coli [27,55,56]. Phages able to infect E. coli K1 were divided into two categories, according to the essentiality of the presence of the K1 capsule for infection: K1-dependent (K1-dep) and K1-independent (K1-ind). The results obtained in vitro and in vivo demonstrated the superiority in terms of efficacy of K1-dep phages compared to K1-ind phages [27,30,55]. The phage genomic analysis of vB_EcoS_K1-ULINTec2, vB_EcoP_K1-ULINTec4, vB_EcoP_K1-ULINTec6, and vB_EcoP_K1-ULINTec7 showed that these phages appear to encode the same endosialidase activity, allowing them to target the E. coli K1 capsule. The host range and efficiency of plating experiments also showed that the phage vB_EcoP_K1-ULINTec7 was able to replicate, not only on K1 strains, but also on K5 strains. These results are consistent with the genomic analysis of this phage and with the existence of other phages encoding two types of enzymes, one degrading the K1 capsule (endosialidase) and the other degrading the K5 capsule (K5 lyase); these capsules being chemically different [28,57,58]. These enzymes are organized into a multiprotein complex attached via an adapter protein to the virus portal vertex, through which the DNA is ejected during infection [58].
At a morphological and taxonomic level, the electron microscopy images assigned the phage vB_EcoS_K1-ULINTec2 to the Siphoviridae family and the other three phages (vB_EcoP_K1-ULINTec4, vB_EcoP_K1-ULINTec6, and vB_EcoP_K1-ULINTec7) to the Podoviridae family. This was also the case for the K1-dep phages isolated in other publications [30,55,56]. The phage vB_EcoP_K1-ULINTec7 is a Podoviridae, as is the phage K1-5, which is also able to lyse both K1 and K5 strains [28,57]. At a genomic level, vB_EcoS_K1-ULINTec2 has significant similarity to the Kagunavirus genus (Siphoviridae family) and vB_EcoP_K1-ULINTec4, vB_EcoP_K1-ULINTec6, and vB_EcoP_K1-ULINTec7 each have similarity to the Vectrevirus genus (Autographiviridae family). Autographiviridae was previously a subfamily of Podoviridae but since 2019 has had a family of its own in the Caudovirales order.
The results observed during the in vitro kinetic experiments (adsorption time and low MOI phage kinetics) demonstrate the productive infection of these phages. The adsorption times and latent periods were very short, except for the vB_EcoS_K1-ULINTec2 phage, whose latent period was longer than for the other phages (10–15 min).
In vivo experiments with G. mellonella larvae showed increased survival rates in larvae treated with phages vB_EcoS_K1-ULINTec2, vB_EcoP_K1-ULINTec4, vB_EcoP_K1-ULINTec6, or vB_EcoP_K1-ULINTec7 at a MOI of 10 or 100. The survival rates of these larvae were not as good as the PBS and phage control groups, but this could be explained by the 2-h interval applied in the present study. Indeed, only a few hours after inoculation of APEC 134 into the larvae, some of them already showed visible signs of infection (decreased activity, melanization). A 1-h interval might have further increased survival, but the present experiment showed a significant effect despite the fast deterioration of the larvae.
Inoculated phages seem to replicate well in the model, as shown by the phage counts measured in the larvae over 96 h. Nevertheless, the bacterial counts were also rather high. Significant effects on these counts can be observed, mainly at 24 and 48 HPI. After this time, the phage-treated groups showed bacterial titers equivalent to the infected control, which led to a decrease in larvae survival after 24 h. One hypothesis could be that the bacteria detected by qPCR no longer express their K1 capsule, thus decreasing or suppressing phage replication, but also decreasing the virulence of the inoculated bacteria. This effect has already been observed by other researchers, who have shown that the use of endosialidase selectively degrades the PSA capsule on the surface of E. coli K1 strains, thus modifying its phenotype and reducing bacteremia and mortality in rats [59]. Moreover, qPCR bacterial titers may partially reflect the presence of dead cells, even if a DNase pre-treatment is applied. The bacterial dose used (106 CFU/larva) resulted in a very high mortality in the 24 h following inoculation in the infected group. When determining the optimal inoculation dose, an inoculum of 105 CFU/larva resulted in a mortality of about 30%. This highlights the acute aspect of infection by this strain with a concentration of 106 CFU/larva. Other experiments conducted on mice showed that a dose of 108 CFU/mouse injected intravenously resulted in 100% mortality within 24–48 HPI, while a dose of 107 CFU/mouse had little impact on mortality [60]. The better survival of G. mellonella larvae could therefore also be attributed to a rapid and transient decrease in bacterial titer during the 24 h following inoculation.
In conclusion, four newly isolated K1-dependent phages (vB_EcoS_K1-ULINTec2, vB_EcoP_K1-ULINTec4, vB_EcoP_K1-ULINTec6, and vB_EcoP_K1-ULINTec7) demonstrated their efficacy in vitro by showing their ability to lyse K1 strains, even though none of them could be effectively active on all the strains. They were also able to increase the survival of G. mellonella larvae infected with E. coli K1, even if this did not result in a complete elimination of the inoculated bacteria.

Supplementary Materials

The following are available online at https://0-www-mdpi-com.brum.beds.ac.uk/article/10.3390/v13102005/s1, Table S1: General characteristics of the Escherichia coli strains used in this study. Table S2: Escherichia coli serogroup collection and characteristics. Table S3: Primers used for PCR amplifications.

Author Contributions

Conceptualization, D.T., V.D. and C.A.; methodology, D.T., V.D., J.M. and C.A.; manipulations, C.A., F.L. and J.-N.D.; genomic analysis: B.B., A.F. and C.A.; writing—original draft preparation, C.A., D.T., V.D.; writing—review and editing, All authors; supervision, D.T., V.D. All authors have read and agreed to the published version of the manuscript.

Funding

This research was funded by the Walloon Public Service, BIOWIN project: Inteliphages.

Institutional Review Board Statement

Not applicable.

Informed Consent Statement

Not applicable.

Data Availability Statement

Sequencing was submitted as NCBI BioProject SUB10289878. GenBank accession numbers are MZ997838 (vB_EcoS_K1-ULINTec2), MZ997839 (vB_EcoP_K1-ULINTec4), MZ997840 (vB_EcoP_K1-ULINTec6), and MZ997841 (vB_EcoP_K1-ULINTec7).

Acknowledgments

We thank Aquiris S.A., Brussels Water Management Company (SBGE-BMWB) and the Brussels sewer museum for providing wastewater samples.

Conflicts of Interest

The authors declare no conflict of interest. This work was performed in the context of a regionally funded project dedicated to the commercial development of bacteriophages as human medicines. B.B. is employed by Vésale Biosciences, who coordinated this project. A.F. is employed by Genalyse Partner, who participated to this project.

References

  1. Dale, A.P.; Woodford, N. Extra-Intestinal Pathogenic Escherichia coli (ExPEC): Disease, Carriage and Clones. J. Infect. 2015, 71, 615–626. [Google Scholar] [CrossRef] [PubMed] [Green Version]
  2. Johnson, J.R.; Delavari, P.; O’Bryan, T.T. Escherichia coli O18:K1:H7 Isolates from Patients with Acute Cystitis and Neonatal Meningitis Exhibit Common Phylogenetic Origins and Virulence Factor Profiles. J. Infect. Dis. 2001, 183, 425–434. [Google Scholar] [CrossRef] [Green Version]
  3. Simonsen, K.A.; Anderson-Berry, A.L.; Delair, S.F.; Davies, H.D. Early-Onset Neonatal Sepsis. Clin. Microbiol. Rev. 2014, 27, 21–47. [Google Scholar] [CrossRef] [Green Version]
  4. King, J.E.; Aal Owaif, H.A.; Jia, J.; Roberts, I.S. Phenotypic Heterogeneity in Expression of the K1 Polysaccharide Capsule of Uropathogenic Escherichia coli and Downregulation of the Capsule Genes during Growth in Urine. Infect. Immun. 2015, 83, 2605–2613. [Google Scholar] [CrossRef] [PubMed] [Green Version]
  5. Kim, K.S. Human Meningitis-Associated Escherichia coli. Physiol. Behav. 2017, 176, 139–148. [Google Scholar] [CrossRef] [Green Version]
  6. Kim, K.J.; Elliott, S.J.; Cello, F.D.; Stins, M.F.; Kim, K.S. The K1 Capsule Modulates Trafficking of E. coli-Containing Vacuoles and Enhances Intracellular Bacterial Survival in Human Brain Microvascular Endothelial Cells. Cell. Microbiol. 2003, 5, 245–252. [Google Scholar] [CrossRef]
  7. Xie, Y.; Kim, K.J.; Kim, K.S. Current Concepts on Escherichia coli K1 Translocation of the Blood–Brain Barrier. FEMS Immunol. Med. Microbiol. 2004, 42, 271–279. [Google Scholar] [CrossRef] [PubMed]
  8. Sivanandan, S.; Soraisham, A.S.; Swarnam, K. Choice and Duration of Antimicrobial Therapy for Neonatal Sepsis and Meningitis. Int. J. Pediatr. 2011, 2011, 712150. [Google Scholar] [CrossRef] [Green Version]
  9. Iqbal, J.; Dufendach, K.R.; Wellons, J.C.; Kuba, M.G.; Nickols, H.H.; Gómez-Duarte, O.G.; Wynn, J.L. Lethal Neonatal Meningoencephalitis Caused by Multi-Drug Resistant, Highly Virulent Escherichia coli. Infect. Dis. Lond. Engl. 2016, 48, 461–466. [Google Scholar] [CrossRef] [Green Version]
  10. Zhu, M.; Jin, Y.; Duan, Y.; He, M.; Lin, Z.; Lin, J. Multi-Drug Resistant Escherichia Coli Causing Early-Onset Neonatal Sepsis—A Single Center Experience from China. Infect. Drug Resist. 2019, 12, 3695–3702. [Google Scholar] [CrossRef] [PubMed] [Green Version]
  11. Erickson, T.A.; Munoz, F.M.; Troisi, C.L.; Nolan, M.S.; Hasbun, R.; Brown, E.L.; Murray, K.O. The Epidemiology of Meningitis in Infants under 90 Days of Age in a Large Pediatric Hospital. Microorganisms 2021, 9, 526. [Google Scholar] [CrossRef] [PubMed]
  12. Wu, D.; Ding, Y.; Yao, K.; Gao, W.; Wang, Y. Antimicrobial Resistance Analysis of Clinical Escherichia coli Isolates in Neonatal Ward. Front. Pediatr. 2021, 9, 670470. [Google Scholar] [CrossRef]
  13. Johnson, J.R.; Stell, A.L.; Delavari, P. Canine Feces as a Reservoir of Extraintestinal Pathogenic Escherichia coli. Infect. Immun. 2001, 69, 1306–1314. [Google Scholar] [CrossRef] [Green Version]
  14. Moulin-Schouleur, M.; Schouler, C.; Tailliez, P.; Kao, M.R.; Brée, A.; Germon, P.; Oswald, E.; Mainil, J.; Blanco, M.; Blanco, J. Common Virulence Factors and Genetic Relationships between O18:K1:H7 Escherichia coli Isolates of Human and Avian Origin. J. Clin. Microbiol. 2006, 44, 3484–3492. [Google Scholar] [CrossRef] [PubMed] [Green Version]
  15. Kassé, F.N.; Fairbrother, J.M.; Dubuc, J. Relationship between Escherichia coli Virulence Factors and Postpartum Metritis in Dairy Cows. J. Dairy Sci. 2016, 99, 4656–4667. [Google Scholar] [CrossRef] [PubMed] [Green Version]
  16. Mageiros, L.; Méric, G.; Bayliss, S.C.; Pensar, J.; Pascoe, B.; Mourkas, E.; Calland, J.K.; Yahara, K.; Murray, S.; Wilkinson, T.S.; et al. Genome Evolution and the Emergence of Pathogenicity in Avian Escherichia coli. Nat. Commun. 2021, 12, 765. [Google Scholar] [CrossRef]
  17. Sun, M.; Gao, X.; Zhao, K.; Ma, J.; Yao, H.; Pan, Z. Insight into the Virulence Related Secretion Systems, Fimbriae, and Toxins in O2:K1 Escherichia coli Isolated from Bovine Mastitis. Front. Vet. Sci. 2021, 8, 18. [Google Scholar] [CrossRef]
  18. Kathayat, D.; Lokesh, D.; Ranjit, S.; Rajashekara, G. Avian Pathogenic Escherichia coli (APEC): An Overview of Virulence and Pathogenesis Factors, Zoonotic Potential, and Control Strategies. Pathog. Basel Switz. 2021, 10, 467. [Google Scholar] [CrossRef]
  19. Zhuge, X.; Zhou, Z.; Jiang, M.; Wang, Z.; Sun, Y.; Tang, F.; Xue, F.; Ren, J.; Dai, J. Chicken-Source Escherichia coli within Phylogroup F Shares Virulence Genotypes and Is Closely Related to Extraintestinal Pathogenic E. coli Causing Human Infections. Transbound. Emerg. Dis. 2021, 68, 880–895. [Google Scholar] [CrossRef]
  20. Tivendale, K.A.; Logue, C.M.; Kariyawasam, S.; Jordan, D.; Hussein, A.; Li, G.; Wannemuehler, Y.; Nolan, L.K. Avian-Pathogenic Escherichia coli Strains Are Similar to Neonatal Meningitis E. coli Strains and Are Able to Cause Meningitis in the Rat Model of Human Disease. Infect. Immun. 2010, 78, 3412–3419. [Google Scholar] [CrossRef] [Green Version]
  21. Mellata, M.; Johnson, J.R.; Curtiss, R. Escherichia coli Isolates from Commercial Chicken Meat and Eggs Cause Sepsis, Meningitis and Urinary Tract Infection in Rodent Models of Human Infections. Zoonoses Public Health 2018, 65, 103–113. [Google Scholar] [CrossRef]
  22. Liu, C.M.; Stegger, M.; Aziz, M.; Johnson, T.J.; Waits, K.; Nordstrom, L.; Gauld, L.; Weaver, B.; Rolland, D.; Statham, S.; et al. Escherichia coli ST131-H22 as a Foodborne Uropathogen. mBio 2018, 9, e00470-18. [Google Scholar] [CrossRef] [Green Version]
  23. Jørgensen, S.L.; Stegger, M.; Kudirkiene, E.; Lilje, B.; Poulsen, L.L.; Ronco, T.; Pires Dos Santos, T.; Kiil, K.; Bisgaard, M.; Pedersen, K.; et al. Diversity and Population Overlap between Avian and Human Escherichia coli Belonging to Sequence Type 95. mSphere 2019, 4, e00333-18. [Google Scholar] [CrossRef] [Green Version]
  24. Kortright, K.E.; Chan, B.K.; Koff, J.L.; Turner, P.E. Phage Therapy: A Renewed Approach to Combat Antibiotic-Resistant Bacteria. Cell Host Microbe 2019, 25, 219–232. [Google Scholar] [CrossRef] [PubMed] [Green Version]
  25. Oechslin, F. Resistance Development to Bacteriophages Occurring during Bacteriophage Therapy. Viruses 2018, 10, 351. [Google Scholar] [CrossRef] [Green Version]
  26. Gross, R.J.; Cheasty, T.; Rowe, B. Isolation of Bacteriophages Specific for the K1 Polysaccharide Antigen of Escherichia coli. J. Clin. Microbiol. 1977, 6, 548–550. [Google Scholar] [CrossRef]
  27. Smith, H.W.; Huggins, M.B. Successful Treatment of Experimental Escherichia coli Infections in Mice Using Phage: Its General Superiority over Antibiotics. J. Gen. Microbiol. 1982, 128, 307–318. [Google Scholar] [CrossRef] [Green Version]
  28. Scholl, D.; Rogers, S.; Adhya, S.; Merril, C.R. Bacteriophage K1-5 Encodes Two Different Tail Fiber Proteins, Allowing It to Infect and Replicate on Both K1 and K5 Strains of Escherichia coli. J. Virol. 2001, 75, 2509–2515. [Google Scholar] [CrossRef] [PubMed] [Green Version]
  29. Bull, J.J.; Levin, B.R.; DeRouin, T.; Walker, N.; Bloch, C.A. Dynamics of Success and Failure in Phage and Antibiotic Therapy in Experimental Infections. BMC Microbiol. 2002, 2, 35. [Google Scholar] [CrossRef] [PubMed]
  30. Bull, J.J.; Otto, G.; Molineux, I.J. In Vivo Growth Rates Are Poorly Correlated with Phage Therapy Success in a Mouse Infection Model. Antimicrob. Agents Chemother. 2012, 56, 949–954. [Google Scholar] [CrossRef] [Green Version]
  31. Desbois, A.P.; Coote, P.J. Utility of Greater Wax Moth Larva (Galleria Mellonella) for Evaluating the Toxicity and Efficacy of New Antimicrobial Agents. Adv. Appl. Microbiol. 2012, 78, 25–53. [Google Scholar] [CrossRef]
  32. Cutuli, M.A.; Petronio Petronio, G.; Vergalito, F.; Magnifico, I.; Pietrangelo, L.; Venditti, N.; Di Marco, R. Galleria Mellonella as a Consolidated In Vivo Model Hosts: New Developments in Antibacterial Strategies and Novel Drug Testing. Virulence 2019, 10, 527–541. [Google Scholar] [CrossRef] [PubMed] [Green Version]
  33. Kling, J. Get a Look at Galleria. Lab Anim. 2020, 49, 65–67. [Google Scholar] [CrossRef] [PubMed]
  34. Lavine, M.D.; Strand, M.R. Insect Hemocytes and Their Role in Immunity. Insect Immunol. 2002, 32, 25–47. [Google Scholar] [CrossRef]
  35. Casanova-Torres, Á.M.; Goodrich-Blair, H. Immune Signaling and Antimicrobial Peptide Expression in Lepidoptera. Insects 2013, 4, 320–338. [Google Scholar] [CrossRef] [Green Version]
  36. Wojda, I. Immunity of the Greater Wax Moth Galleria Mellonella. Insect Sci. 2017, 24, 342–357. [Google Scholar] [CrossRef] [PubMed]
  37. Jeon, J.; Dongeun, Y. Two Novel Bacteriophages Improve Survival in Galleria Mellonella Infection and Mouse Acute Pneumonia Models Infected with Extensively Drug-Resistant Pseudomonas Aeruginosa. Appl. Environ. Microbiol. 2019, 85, 1–16. [Google Scholar] [CrossRef] [Green Version]
  38. Thiry, D.; Passet, V.; Danis-Wlodarczyk, K.; Lood, C.; Wagemans, J.; De Sordi, L.; van Noort, V.; Dufour, N.; Debarbieux, L.; Mainil, J.G.; et al. New Bacteriophages against Emerging Lineages ST23 and ST258 of Klebsiella Pneumoniae and Efficacy Assessment in Galleria Mellonella Larvae. Viruses 2019, 11, 411. [Google Scholar] [CrossRef] [Green Version]
  39. Antoine, C.; Laforêt, F.; Blasdel, B.; Glonti, T.; Kutter, E.; Pirnay, J.P.; Mainil, J.; Delcenserie, V.; Thiry, D. Efficacy Assessment of PEV2 Phage on Galleria Mellonella Larvae Infected with a Pseudomonas Aeruginosa Dog Otitis Isolate. Res. Vet. Sci. 2021, 136, 598–601. [Google Scholar] [CrossRef]
  40. Ngassam-Tchamba, C.; Duprez, J.N.; Fergestad, M.; De Visscher, A.; L’Abee-Lund, T.; De Vliegher, S.; Wasteson, Y.; Touzain, F.; Blanchard, Y.; Lavigne, R.; et al. In Vitro and In Vivo Assessment of Phage Therapy against Staphylococcus Aureus Causing Bovine Mastitis. J. Glob. Antimicrob. Resist. 2020, 22, 762–770. [Google Scholar] [CrossRef]
  41. Manohar, P.; Nachimuthu, R.; Lopes, B.S. The Therapeutic Potential of Bacteriophages Targeting Gram-Negative Bacteria Using Galleria Mellonella Infection Model. BMC Microbiol. 2018, 18, 97. [Google Scholar] [CrossRef] [Green Version]
  42. Van Twest, R.; Kropinski, A.M. Bacteriophage Enrichment from Water and Soil. Methods Mol. Biol. Clifton NJ 2009, 501, 15–21. [Google Scholar] [CrossRef]
  43. Mast, J.; Demeestere, L. Electron Tomography of Negatively Stained Complex Viruses: Application in Their Diagnosis. Diagn. Pathol. 2009, 4, 5. [Google Scholar] [CrossRef] [Green Version]
  44. Brettin, T.; Davis, J.J.; Disz, T.; Edwards, R.A.; Gerdes, S.; Olsen, G.J.; Olson, R.; Overbeek, R.; Parrello, B.; Pusch, G.D.; et al. RASTtk: A Modular and Extensible Implementation of the RAST Algorithm for Building Custom Annotation Pipelines and Annotating Batches of Genomes. Sci. Rep. 2015, 5, 8365. [Google Scholar] [CrossRef] [Green Version]
  45. Blum, M.; Chang, H.-Y.; Chuguransky, S.; Grego, T.; Kandasaamy, S.; Mitchell, A.; Nuka, G.; Paysan-Lafosse, T.; Qureshi, M.; Raj, S.; et al. The InterPro Protein Families and Domains Database: 20 Years on. Nucleic Acids Res. 2021, 49, D344–D354. [Google Scholar] [CrossRef]
  46. Meier, A.; Söding, J. Automatic Prediction of Protein 3D Structures by Probabilistic Multi-Template Homology Modeling. PLoS Comput. Biol. 2015, 11, e1004343. [Google Scholar] [CrossRef]
  47. Sullivan, M.J.; Petty, N.K.; Beatson, S.A. Easyfig: A Genome Comparison Visualizer. Bioinformatics 2011, 27, 1009–1010. [Google Scholar] [CrossRef] [PubMed]
  48. Merabishvili, M.; Vandenheuvel, D.; Kropinski, A.M.; Mast, J.; Vos, D.D.; Verbeken, G.; Noben, J.-P.; Lavigne, R.; Vaneechoutte, M.; Pirnay, J.-P. Characterization of Newly Isolated Lytic Bacteriophages Active against Acinetobacter Baumannii. PLoS ONE 2014, 9, e104853. [Google Scholar] [CrossRef] [PubMed] [Green Version]
  49. González-Menéndez, E.; Fernández, L.; Gutiérrez, D.; Rodríguez, A.; Martínez, B.; García, P. Comparative Analysis of Different Preservation Techniques for the Storage of Staphylococcus Phages Aimed for the Industrial Development of Phage-Based Antimicrobial Products. PLoS ONE 2018, 13, e0205728. [Google Scholar] [CrossRef]
  50. Using the R Commander. Available online: https://socialsciences.mcmaster.ca/jfox/Books/RCommander/ (accessed on 23 August 2021).
  51. Delannoy, S.; Beutin, L.; Mariani-Kurkdjian, P.; Fleiss, A.; Bonacorsi, S.; Fach, P. The Escherichia coli Serogroup O1 and O2 Lipopolysaccharides Are Encoded by Multiple O-Antigen Gene Clusters. Front. Cell. Infect. Microbiol. 2017, 7, 1–13. [Google Scholar] [CrossRef] [Green Version]
  52. Bacchetti De Gregoris, T.; Aldred, N.; Clare, A.S.; Burgess, J.G. Improvement of Phylum- and Class-Specific Primers for Real-Time PCR Quantification of Bacterial Taxa. J. Microbiol. Methods 2011, 86, 351–356. [Google Scholar] [CrossRef] [PubMed]
  53. Zimmermann, L.; Stephens, A.; Nam, S.-Z.; Rau, D.; Kübler, J.; Lozajic, M.; Gabler, F.; Söding, J.; Lupas, A.N.; Alva, V. A Completely Reimplemented MPI Bioinformatics Toolkit with a New HHpred Server at Its Core. J. Mol. Biol. 2018, 430, 2237–2243. [Google Scholar] [CrossRef] [PubMed]
  54. Abedon, S.T. Lysis from without. Bacteriophage 2011, 1, 46–49. [Google Scholar] [CrossRef]
  55. Bull, J.J.; Vimr, E.R.; Molineux, I.J. A Tale of Tails: Sialidase Is Key to Success in a Model of Phage Therapy against K1-Capsulated Escherichia coli. Virology 2010, 398, 79–86. [Google Scholar] [CrossRef] [PubMed] [Green Version]
  56. Baig, A.; Colom, J.; Barrow, P.; Schouler, C.; Moodley, A.; Lavigne, R.; Atterbury, R.; Atterbury, R.; Barrow, P.; Baig, A.; et al. Biology and Genomics of an Historic Therapeutic Escherichia coli Bacteriophage Collection. Front. Microbiol. 2017, 8, 1652. [Google Scholar] [CrossRef] [PubMed]
  57. Scholl, D.; Adhya, S.; Merril, C. Escherichia coli K1′s Capsule Is a Barrier to Bacteriophage T7. Appl. Environ. Microbiol. 2005, 71, 4872–4874. [Google Scholar] [CrossRef] [Green Version]
  58. Leiman, P.G.; Battisti, A.J.; Bowman, V.D.; Stummeyer, K.; Mühlenhoff, M.; Gerardy-Schahn, R.; Scholl, D.; Molineux, I.J. The Structures of Bacteriophages K1E and K1-5 Explain Processive Degradation of Polysaccharide Capsules and Evolution of New Host Specificities. J. Mol. Biol. 2007, 371, 836–849. [Google Scholar] [CrossRef]
  59. Mushtaq, N.; Redpath, M.B.; Luzio, J.P.; Taylor, P.W. Prevention and Cure of Systemic Escherichia coli K1 Infection by Modification of the Bacterial Phenotype. Antimicrob. Agents Chemother. 2004, 48, 1503–1508. [Google Scholar] [CrossRef] [Green Version]
  60. Schneider, G.; Szentes, N.; Horváth, M.; Dorn, Á.; Cox, A.; Nagy, G.; Doffkay, Z.; Maróti, G.; Rákhely, G.; Kovács, T. Kinetics of Targeted Phage Rescue in a Mouse Model of Systemic Escherichia coli K1. BioMed Res. Int. 2018, 2018, 7569645. [Google Scholar] [CrossRef] [Green Version]
Figure 1. Representation of the survival and titration experiments of Galleria mellonella larvae. Larvae were inoculated at 2-h intervals. Survival assessment and phage: bacterial titrations were performed every 24 h for 96 h. HPI: hours post inoculation.
Viruses 13 02005 g001
Figure 2. Representation of the titration process of bacteria and phages contained in the G. mellonella larvae.
Viruses 13 02005 g002
Figure 3. Percentage of lysed strains and degree of lysis of the 11 phages isolated against E. coli O18:K1.
Viruses 13 02005 g003
Figure 4. Negative staining transmission electron microscopic images of (a) vB_EcoS_K1-ULINTec2, Siphoviridae. (b) vB_EcoP_K1-ULINTec4, Podoviridae. (c) vB_EcoP_K1-ULINTec6, Podoviridae. (d) vB_EcoP_K1-ULINTec7, Podoviridae.
Viruses 13 02005 g004
Figure 5. Comparative genomics of phages vB_EcoS_K1-ULINTec2 (K1-ULINTec2), K1H and K1G.
Viruses 13 02005 g005
Figure 6. Comparative genomics of phages vB_EcoP_K1-ULINTec4 (K1-ULINTec4), vB_EcoP_K1-ULINTec6 (K1-ULINTec6), vB_EcoP_K1-ULINTec7 (K1-ULINTec7), and VEc3, K1E and K1-5.
Viruses 13 02005 g006
Figure 7. Adsorption time of (a) vB_EcoS_K1-ULINTec2, (b) vB_EcoP_K1-ULINTec4, (c) vB_EcoP_K1-ULINTec6, (d) vB_EcoP_K1-ULINTec7, and low MOI phage kinetics (e). P0: initial phage concentration. P: number of free phages. The results are the mean value of three titrations.
Viruses 13 02005 g007
Figure 8. Temperature (a), pH (b), and storage (c) stability results of phages vB_EcoS_K1-ULINTec2, vB_EcoP_K1-ULINTec4, vB_EcoP_K1-ULINTec6, and vB_EcoP_K1-ULINTec7. The results are the mean value of three titrations. Dark bars represent the concentration measured before testing.
Viruses 13 02005 g008
Figure 9. Kaplan–Meier survival curves of the experiments with G. mellonella larvae inoculated with E. coli O18:K1 (APEC 134) or PBS and treated with phages (a) vB_EcoS_K1-ULINTec2, (b) vB_EcoP_K1-ULINTec4, (c) vB_EcoP_K1-ULINTec6, (d) vB_EcoP_K1-ULINTec7, or PBS two hours later. Each group contained 30 larvae separated in 3 groups of 10 larvae. MOI: multiplicity of infection. HPI: hours post inoculation. p-value (*) < 0.05.
Viruses 13 02005 g009
Figure 10. Phage vB_EcoS_K1-ULINTec2 (a), vB_EcoP_K1-ULINTec4 (c), vB_EcoP_K1-ULINTec6 (e), vB_EcoP_K1-ULINTec7 (g), and bacterial vB_EcoS_K1-ULINTec2 (b), vB_EcoP_K1-ULINTec4 (d), vB_EcoP_K1-ULINTec6 (f), and vB_EcoP_K1-ULINTec7 (h) concentrations measured during the titration experiments using the G. mellonella model. Titrations were performed every 24 h for 96 h. The results present data from 3 independent experiments. p-value (*) < 0.05. MOI: multiplicity of infection. HPI: hours post inoculation.
Viruses 13 02005 g010
Table 1. Summary table of the groups of G. mellonella larvae inoculated for the survival and titration experiments.
Groups1st Injection2nd Injection
1APEC 134 + phage 1 MOI 100APEC 134: 106 CFU/10 µLPhage 1: 108 PFU/10 µL
2APEC 134 + phage 1 MOI 10APEC 134: 106 CFU/10 µLPhage 1: 107 PFU/10 µL
3APEC 134 + PBSAPEC 134: 106 CFU/10 µLPBS: 10 µL
4PBS + phage 1 MOI 100PBS: 10 µLPhage 1: 108 PFU/10 µL
5PBS + PBSPBS: 10 µLPBS: 10 µL
1: vB_EcoS_K1-ULINTec2, vB_EcoP_K1-ULINTec4, vB_EcoP_K1-ULINTec6 or vB_EcoP_K1-ULINTec7. MOI: multiplicity of infection.
Table 2. Efficiency of plating (EoP) values for phages vB_EcoS_K1-ULINTec2, vB_EcoP_K1-ULINTec4, vB_EcoP_K1-ULINTec6, and vB_EcoP_K1-ULINTec7.
Phages
vB_EcoS_K1-ULINTec2vB_EcoP_K1-ULINTec4vB_EcoP_K1-ULINTec6vB_EcoP_K1-ULINTec7
E. coli strains45 *1.0001.0001.0001.000
30 *0.9710.8861.1030.838
79 *NPNP/NP
134 *0.7651.1431.2052.137
161 *0.535<0.001<0.001NP
486 *1.059NPNPNP
591 *NP0.8290.6920.906
592 *NP1.0000.4051.086
1073 *NP0.1200.0240.044
1343 *NPNP0.641NP
151.1 **///1.145
143.1 *NP1.1430.4870.350
O1 *NP0.343NP0.256
O2 *NP0.629/0.197
O7 *NP0.9431.9230.855
O10 **///0.940
O12 **///1.453
O16 *NP0.005NPNP
O45 *NP<0.0010.5642.821
O166 *NP0.111NPNP
* K1 (neuC) positive strains, ** K5 (kfib) positive strains. EoP ≥ 0.5: high production (green); 0.5 ≥ EoP ≥ 0.1: medium production (yellow); 0.1 ≥ EoP ≥ 0.001: low production (red); EoP ≤ 0.001: no production (red); NP: no plaques.
Publisher’s Note: MDPI stays neutral with regard to jurisdictional claims in published maps and institutional affiliations.

