
Modeling Mongoose Rabies in the Caribbean: A Model-Guided Fieldwork Approach to Identify Research Priorities

 ,
,
Abstract
:1. Introduction
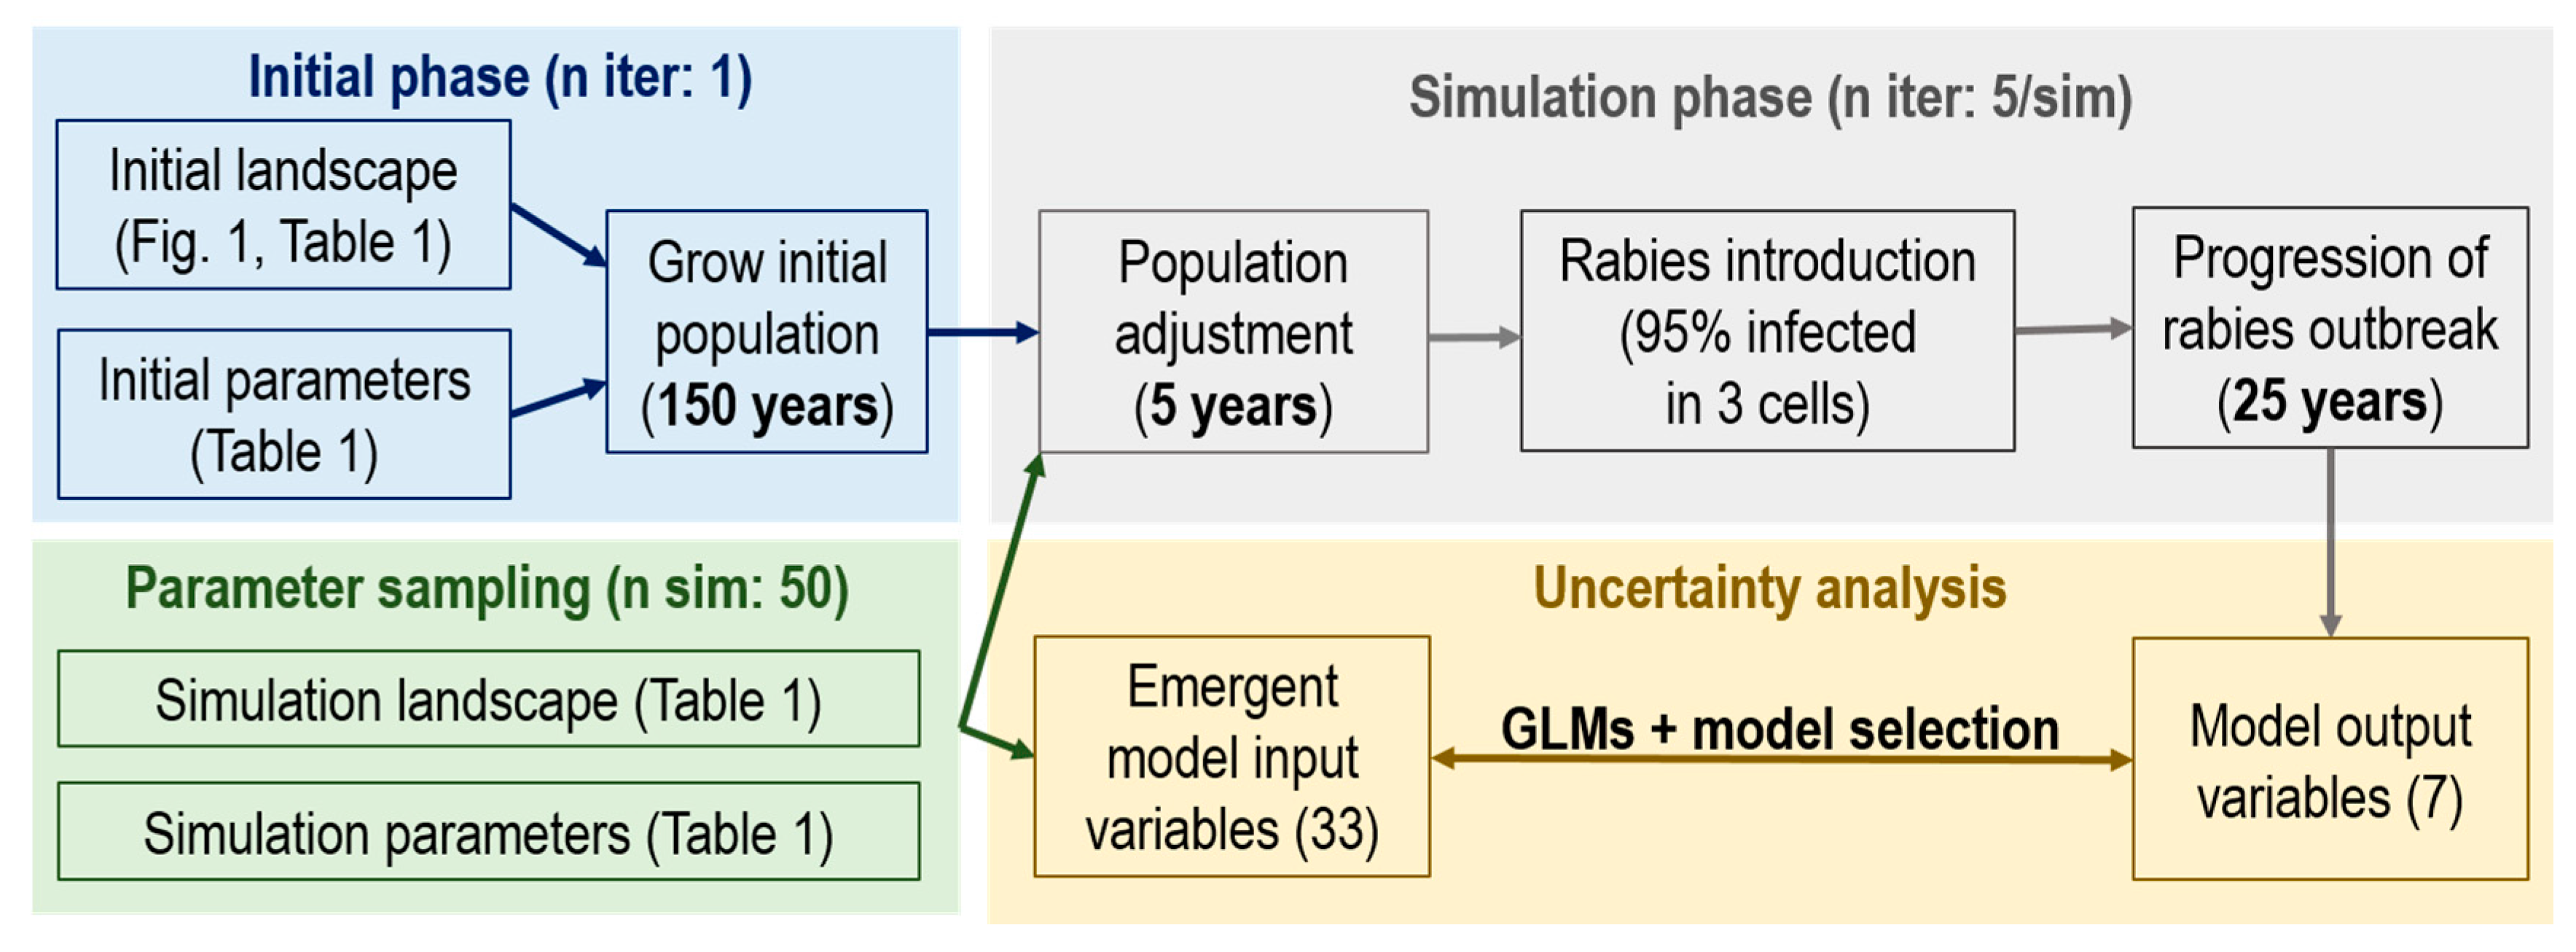
2. Materials and Methods
2.1. The Ontario Rabies Model (ORM)
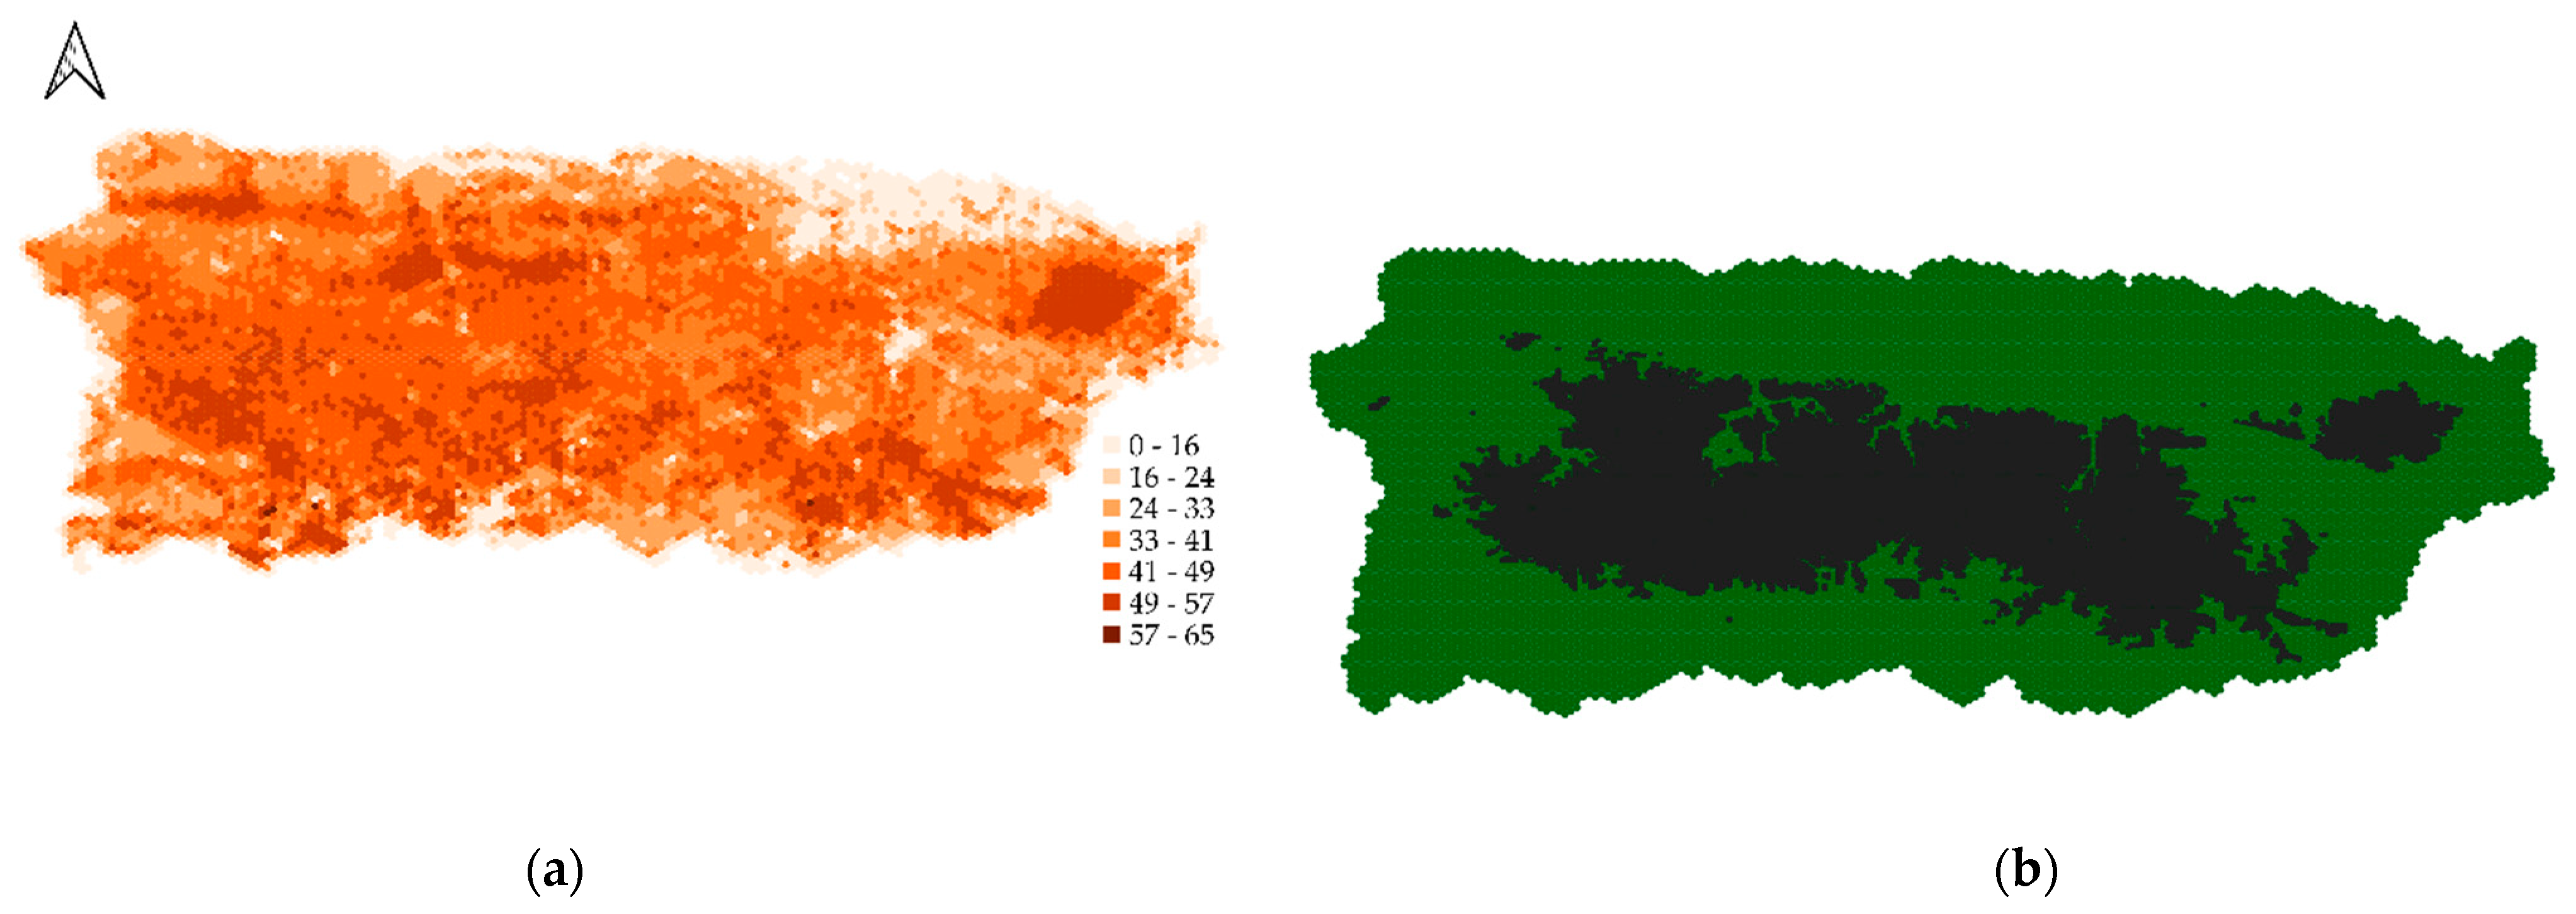
2.1.1. Landscape
2.1.2. Initial Population
2.1.3. Input Parameters
2.1.4. Parameter Value Sampling
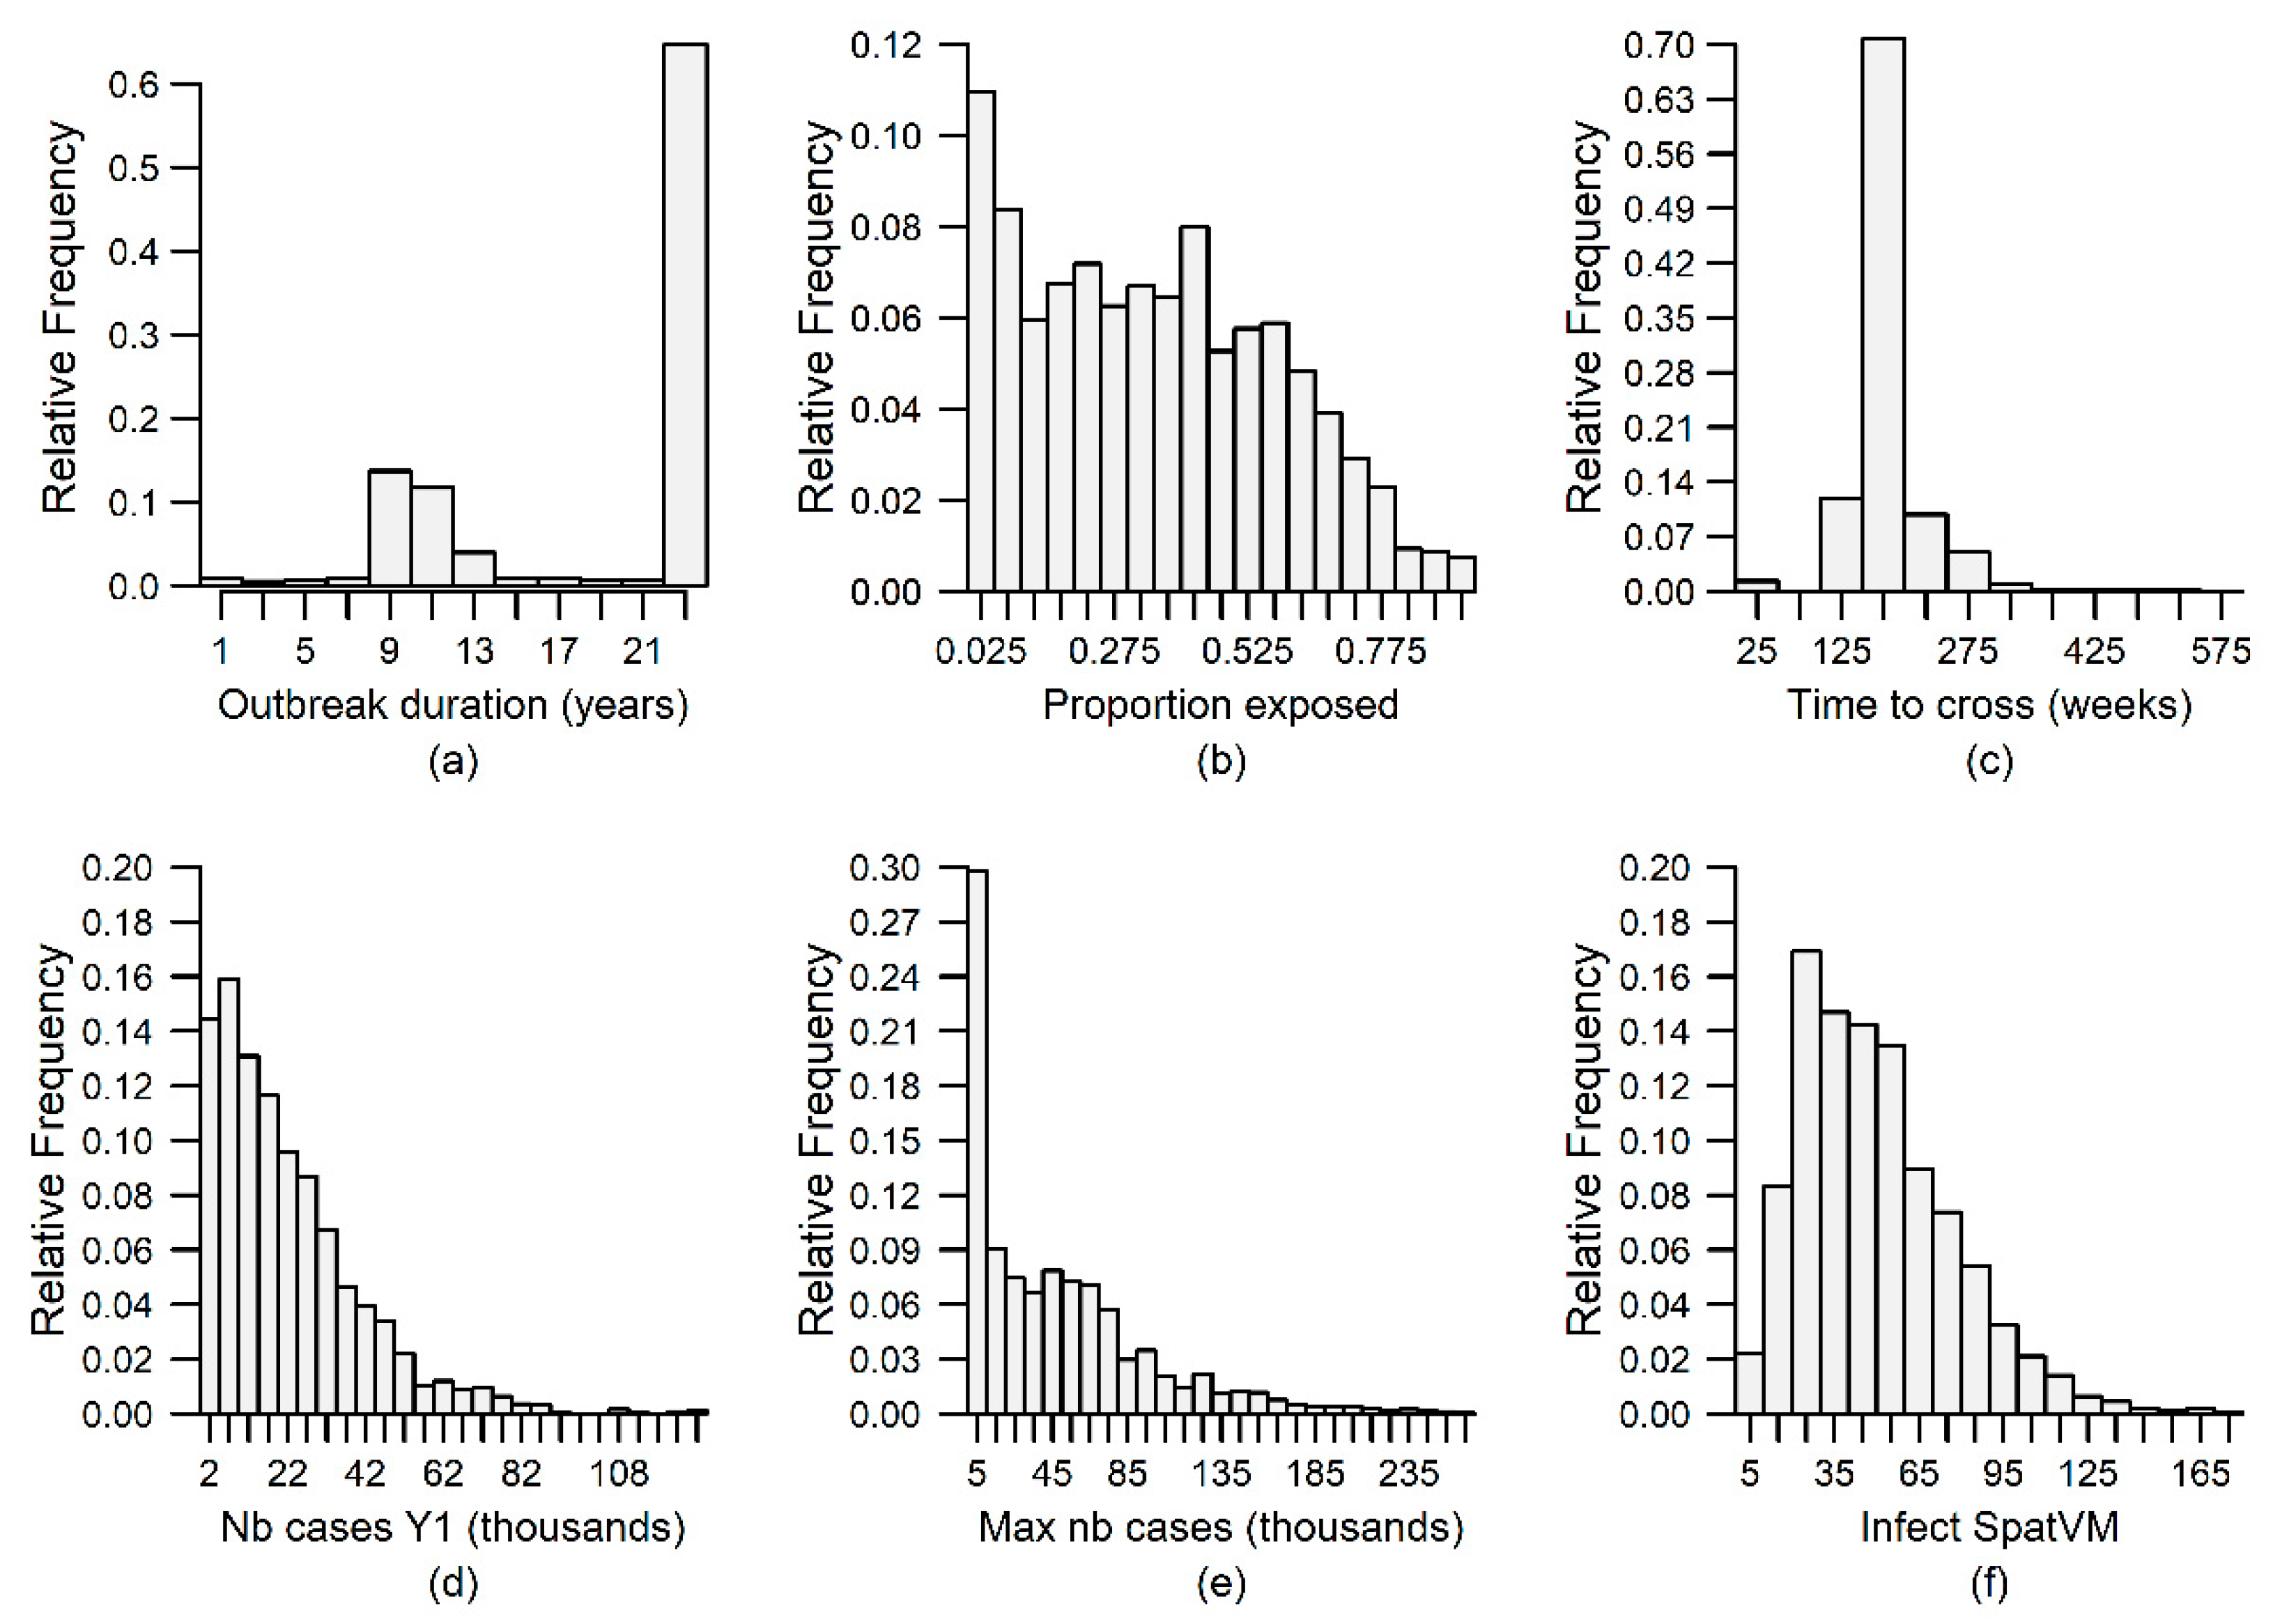
2.1.5. Output Variables
2.2. Uncertainty Analysis
Model Selection
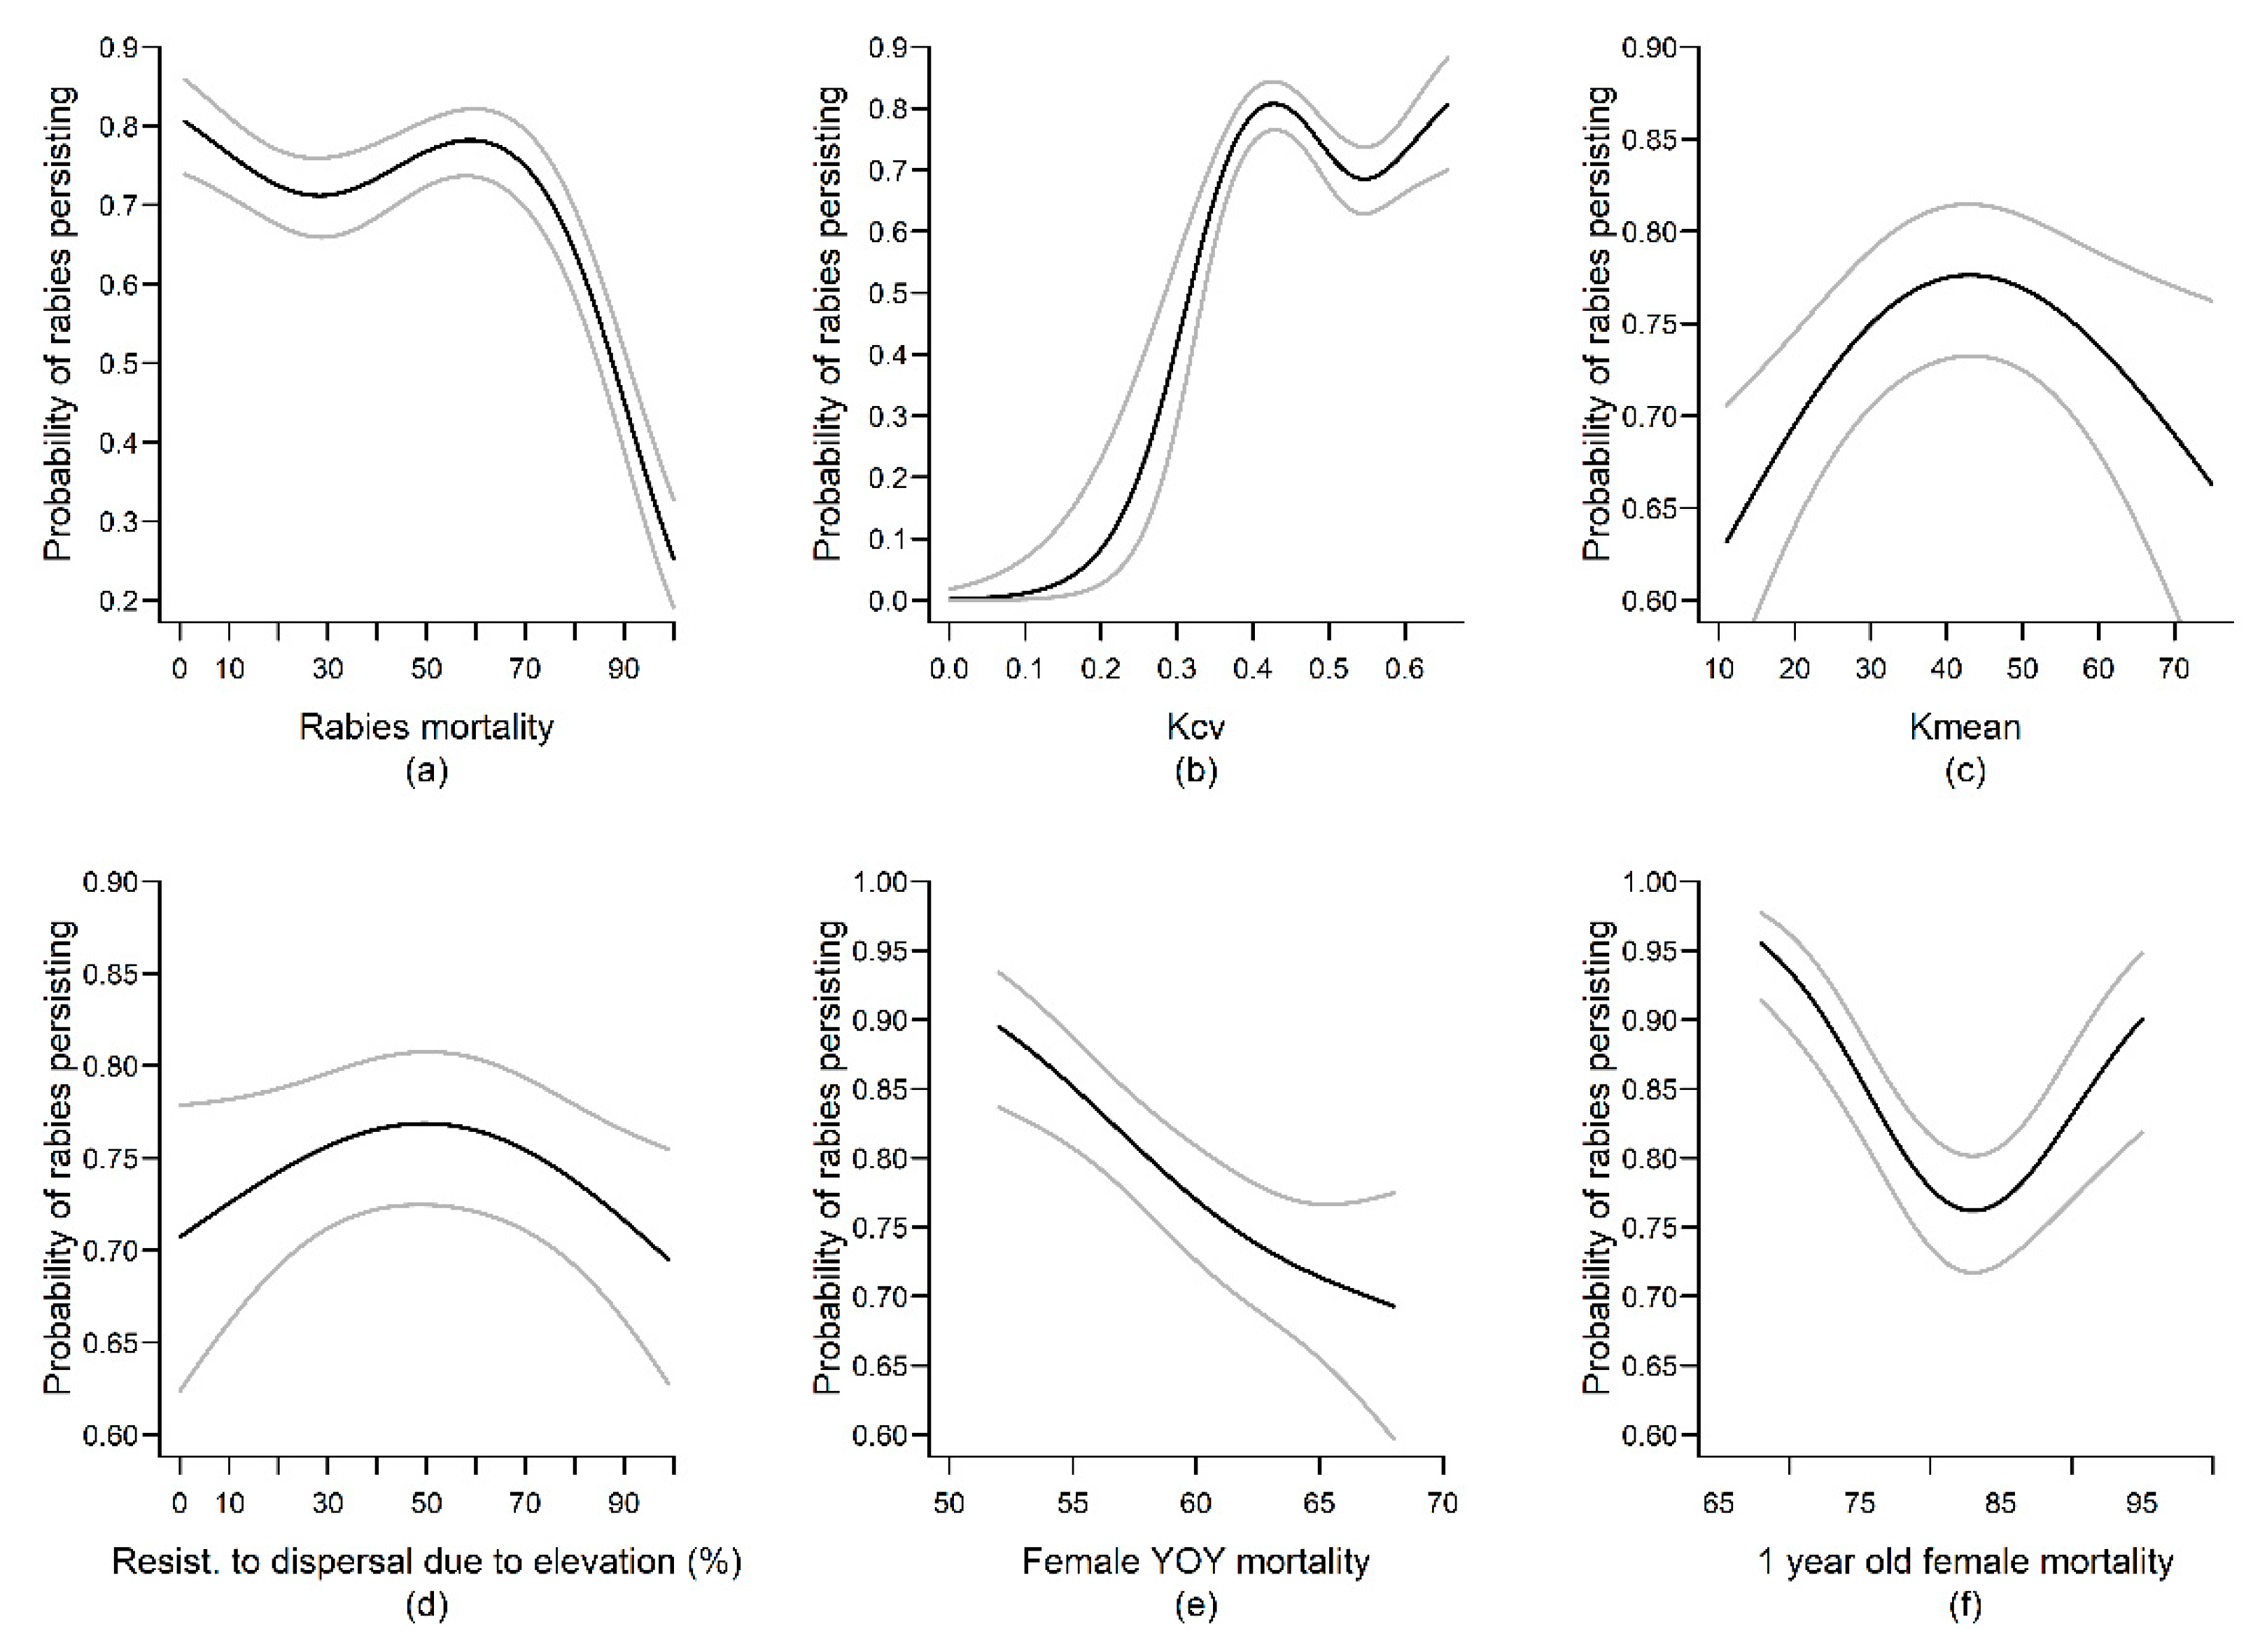
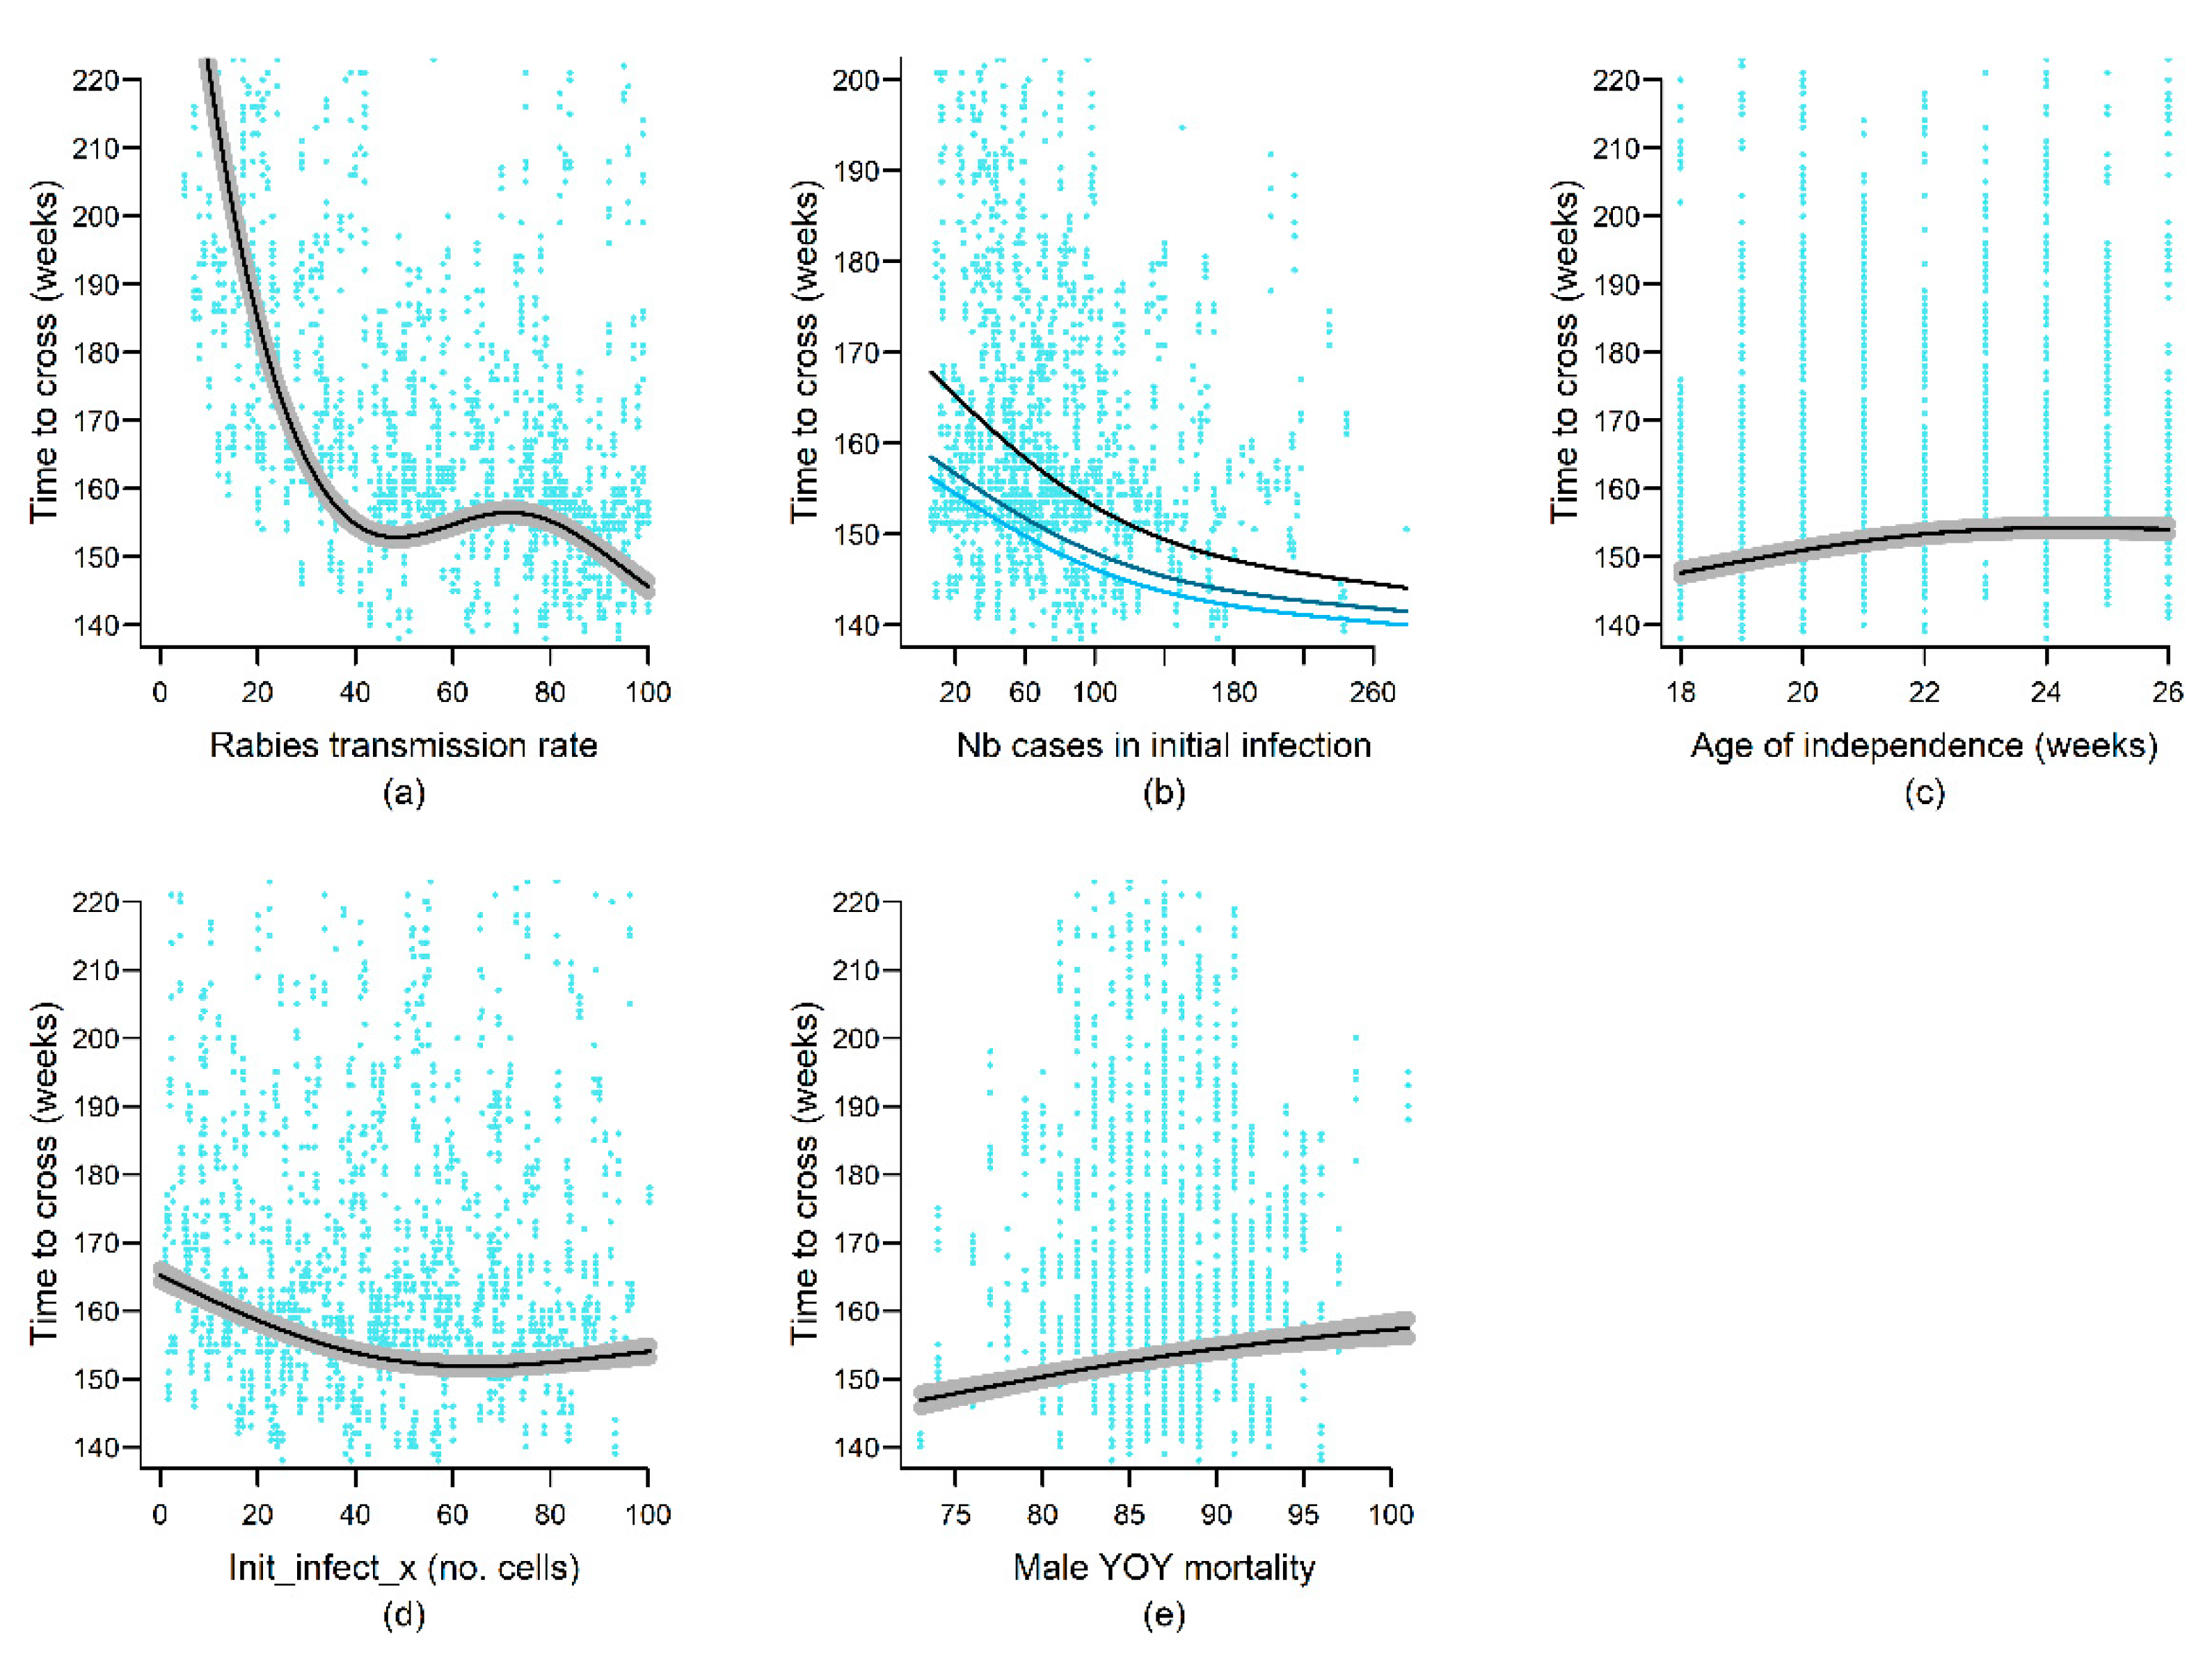
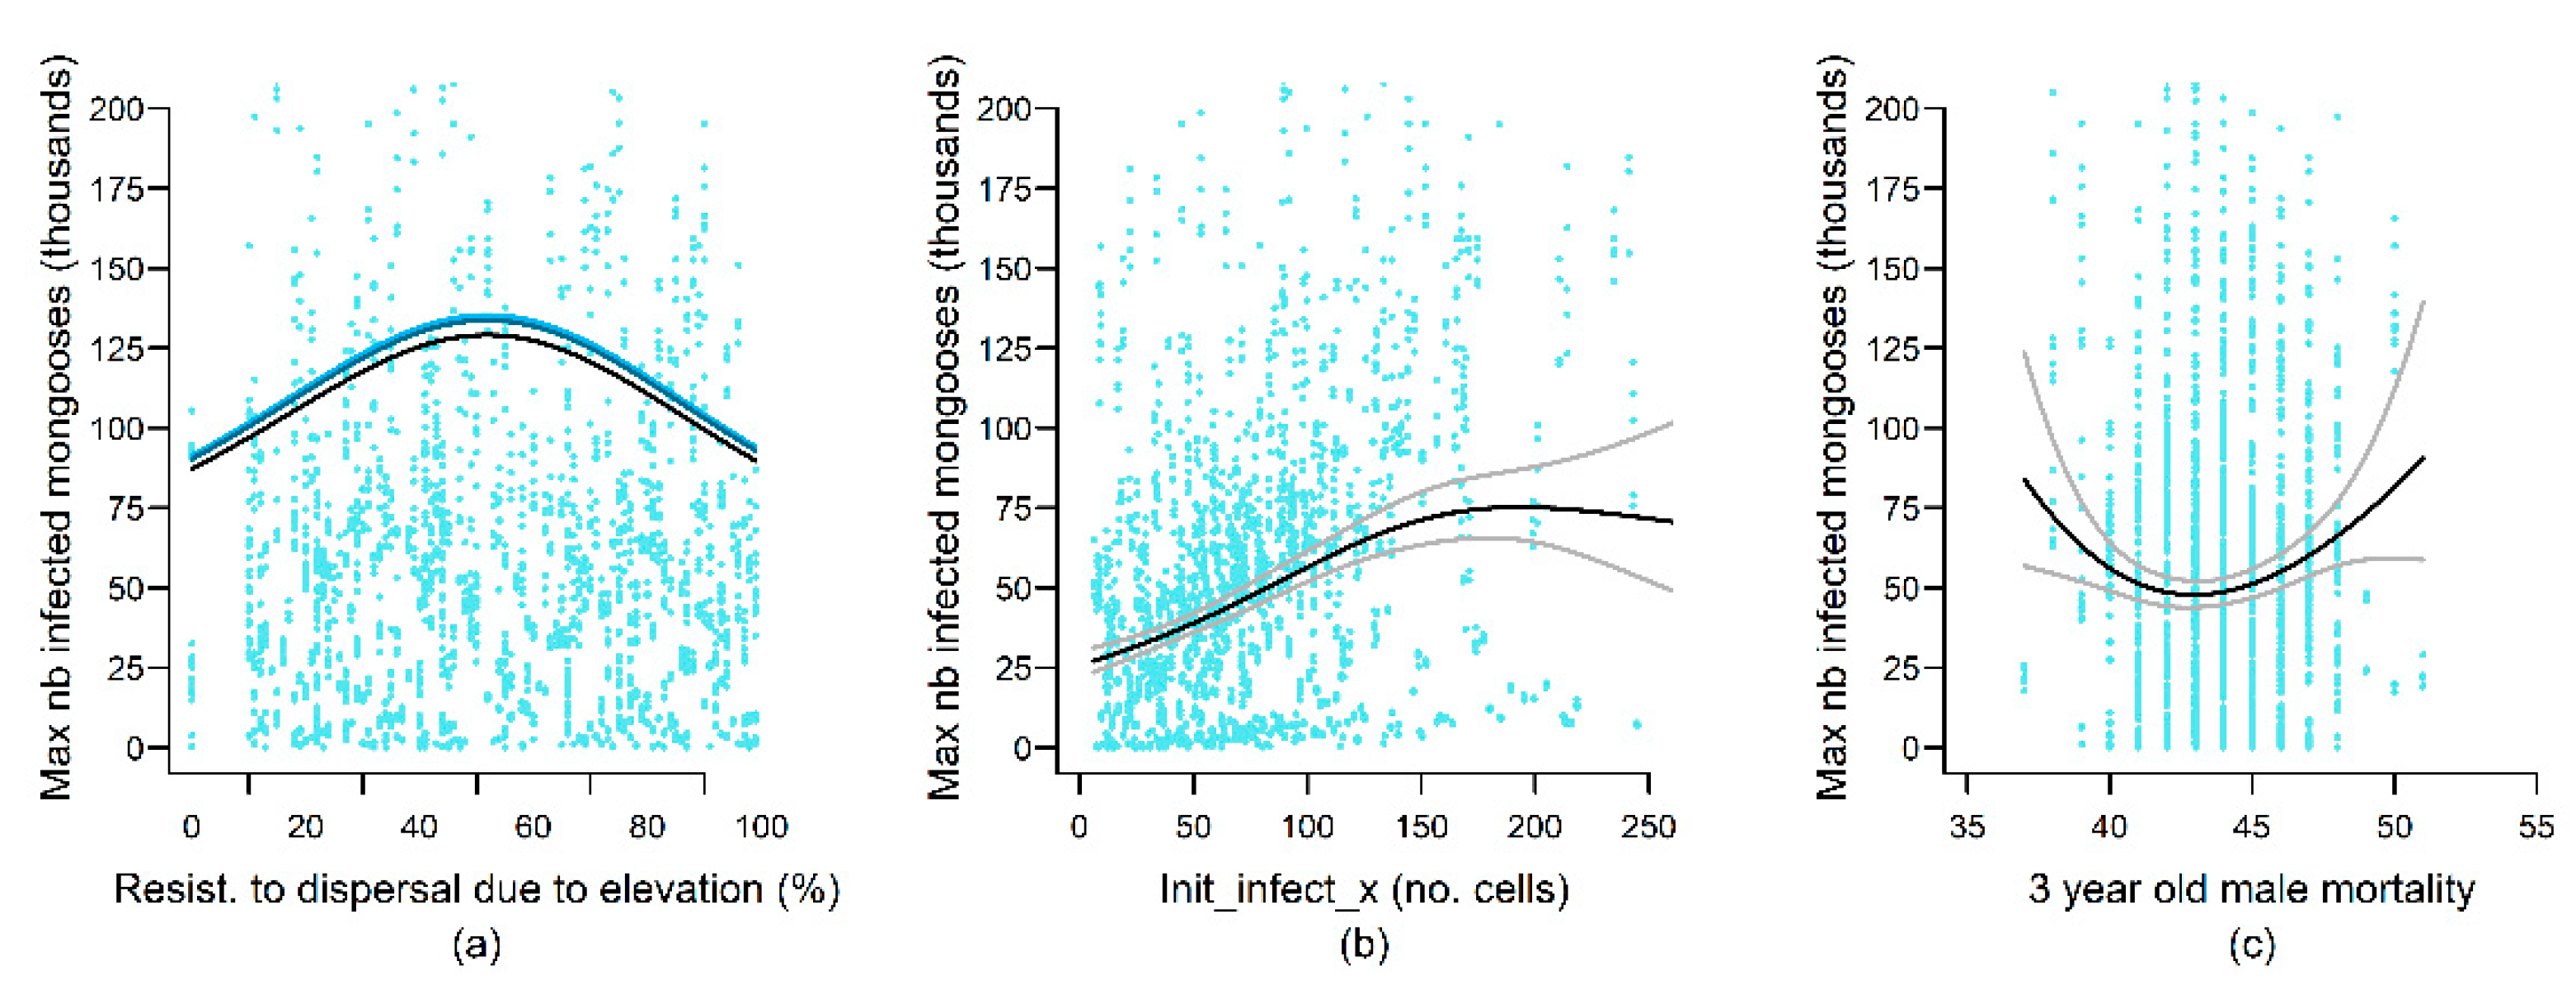
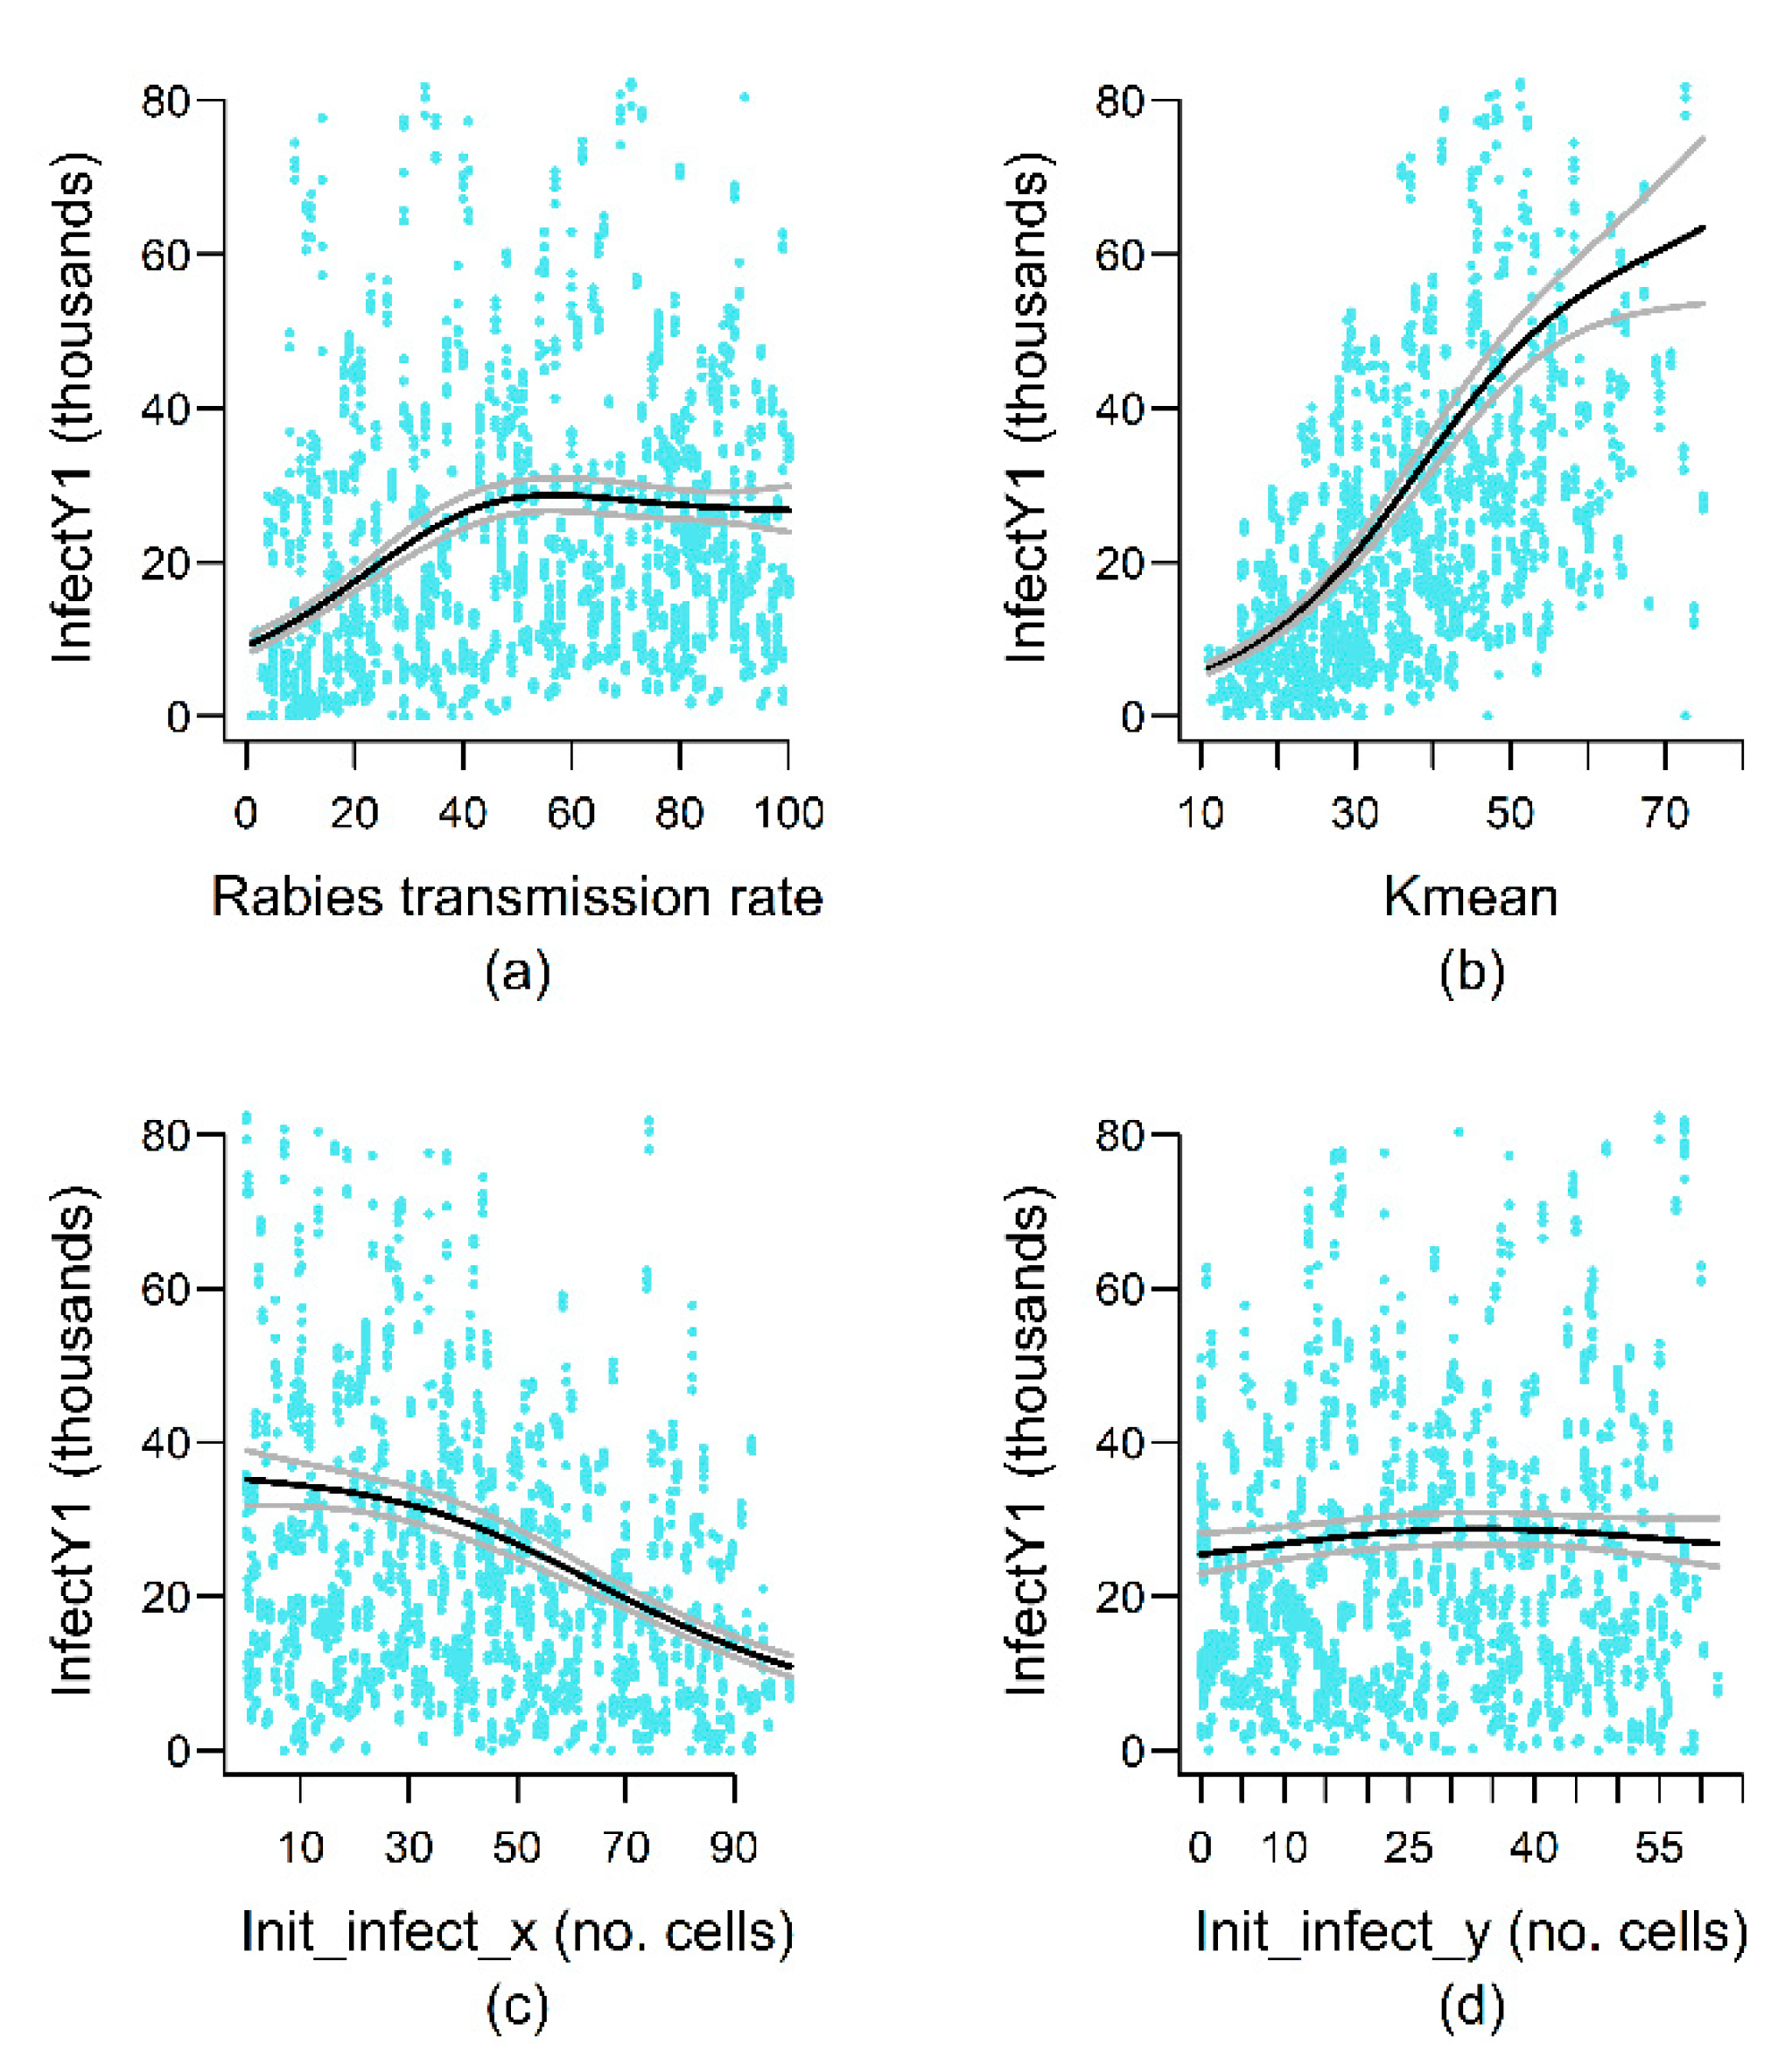
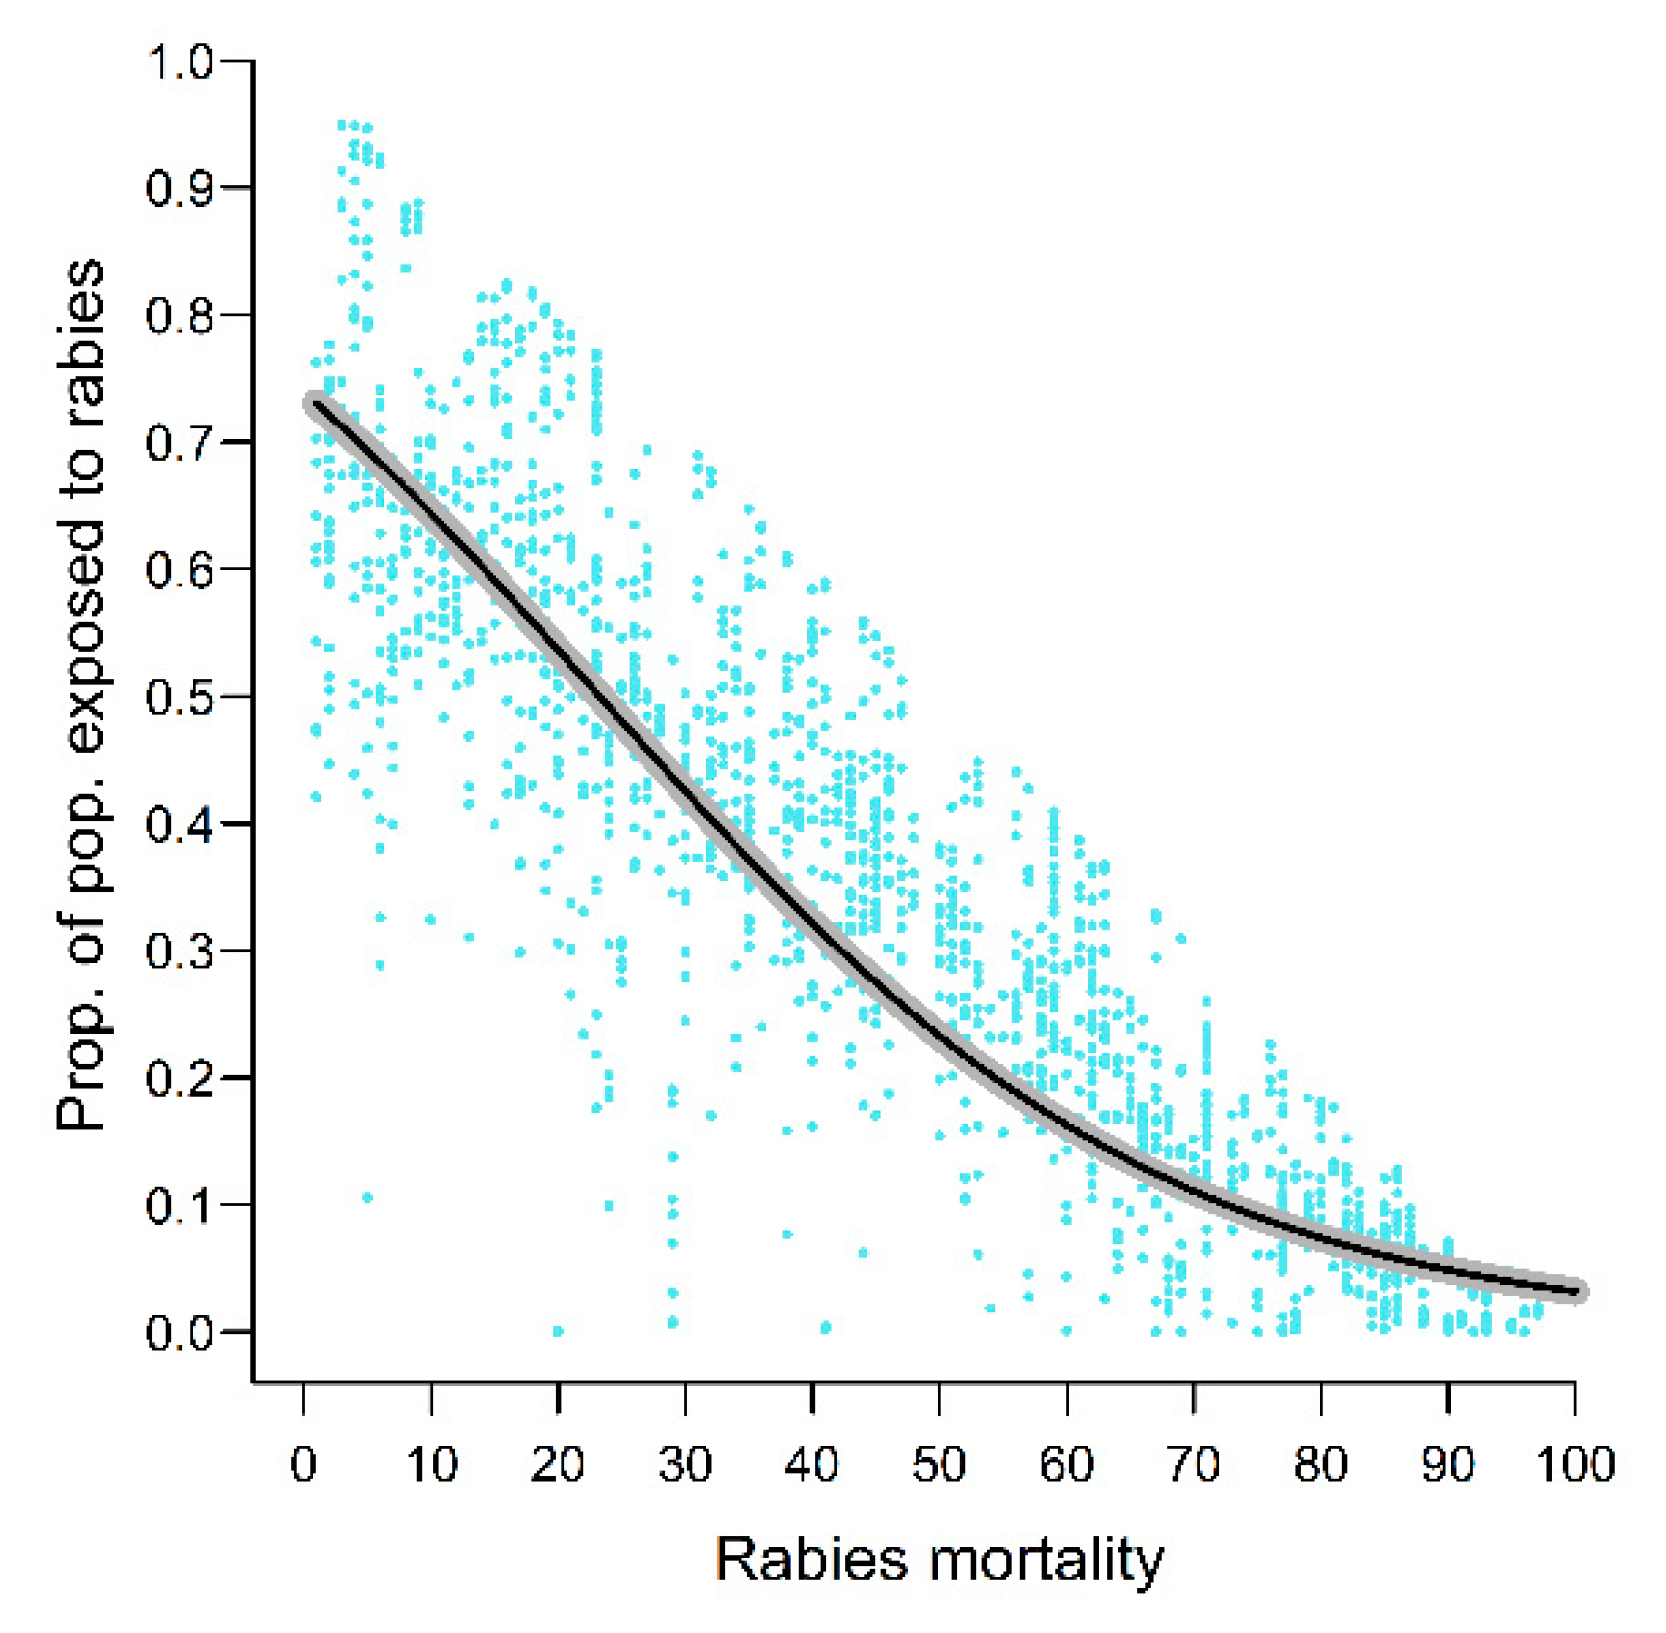
3. Results
4. Discussion
4.1. Landscape Variables
4.2. Movement Variables
4.3. Demographic Variables
4.4. Epidemiological Variables
4.5. Study Limitations
5. Conclusions
Author Contributions
Funding
Institutional Review Board Statement
Informed Consent Statement
Acknowledgments
Conflicts of Interest
Appendix A

| Habitat Type | Pixel Codes Used in Resampling | Proportion of Puerto Rico Main Island (%) |
|---|---|---|
| Semi-wooden | 52. Shrub/scrub | 2.21 |
| Heavily wooden | 42. Evergreen forest | 37.80 |
| Open grass | 21. Developed, open space 22. Developed, low intensity 71. Grassland/herbaceous 81. Pasture/hay 82. Cultivated crops | 36.4 |
| Wetlands | 90. Woody wetlands 95. Emergent herbaceous wetlands | 2.32 |
| Developed or barren land | 23. Developed, medium intensity 24. Developed, high intensity 31. Barren land (rock/sand/clay) 11. Open water | 21.24 |
Appendix B
| Response Variable | Predictors | AIC |
|---|---|---|
| Persistence | s(Kmean) + s(Kcv) + YOY_mvt_90pc + Adult_mvt_25pc + Age_ind + s(YOYF_mortality) + s(1yrF_mortality) +s(4yrF_mortality) + s(Rab_mortality) + Rab_spread + Init_infect_y + s(Resistance_in/out) | 2946.73 |
| %exposed | YOY_Max_mvt + te(YOY_mvt_90pc, Age_ind) + Adult_mvt_75pc + Adult_mvt_90pc + Prob_OHR_M + Prob_OHR_F + Nb_birth_peaks + YOYM_mortality + s(1yrM_mortality) + 3yrM_mortality + 3yrF_mortality + te(4yrM_mortality, YOYF_mortality, 1yrF_mortality, Rab_mortality) + Rab_spread_rate + N_init_infect | 19542698 |
| TimeToCross | YOY_Max_Mvt + s(Age_ind) + s(1yrM_mortality) + s(Rab_spread_rate) + s(N_init_infect, by = Prob_OHR_F) + s(Init_infect_x) | 6250585815 |
| MaxInfect | YOY_mvt_90pc + Adult_mvt_25pc + Age_ind + Nb_birth_peaks + s(3yrM_mortality) + YOYF_mortality + 1yrF_mortality + s(N_init_infect) + s(Resistance_in/out, by= Adult_mvt_75pc) + YOY_mvt_90pc* Age_ind | 58277 |
| InfectY1 | s(Kmean) + s(Init_infect_y) + s(Init_infect_x) + Age_Ind + s(Rab_spread_rate) + YOYF_mortality + Adult_mvt_25pc | 53425 |
| InfectSpatVM | te(Kmean, Rab_spread_rate) + Kcv + s(Age_ind) + Nb_birth_peaks + YOYM_mortality | 11968 |
Appendix C
| Response Variable (Model Output Variables) | Fixed Effects (Model Input Variables) | β (Linear terms) or Edf (Smooth Terms) | β SE (Linear Terms) | Z Value (Linear Terms) or χ2 (Smooth Terms) | p-Value |
|---|---|---|---|---|---|
| Time to cross | s(Rab_spread_rate) | 2.995 | - | 12143.8 | <0.0001 |
| s(N_init_infect, by = Prob_OHR_F) | 2.942 | - | 912.1 | <0.0001 | |
| s(Init_infect_x) | 1.959 | - | 510.5 | <0.0001 | |
| s(Age_ind) | 1.889 | - | 219.6 | <0.0001 | |
| s(M_motality_1yr) | 1.452 | - | 139.2 | <0.0001 | |
| YOYF_Max_mvt | 4.39e-5 | 0.0000 | 19.18 | <0.0001 | |
| Intercept | 0.015 | 0.0005 | 28.39 | <0.0001 | |
| Persistence | s(Rab_mortality) | 2.970 | - | 165.240 | <0.0001 |
| s(Kcv) | 2.946 | - | 41.836 | <0.0001 | |
| s(F_mortality_1yr) | 1.964 | - | 29.173 | <0.0001 | |
| s(Kmean) | 1.919 | - | 16.715 | 0.0004 | |
| s(YOYF_mortality) | 1.656 | - | 23.476 | <0.0001 | |
| ADLF_mvt_25pc | 1.015 | 0.3148 | 3.213 | 0.0013 | |
| Age_ind | -0.061 | 0.0184 | −3.329 | 0.0009 | |
| YOYF_movt_90pc | -0.045 | 0.0104 | −4.326 | <0.0001 | |
| Init_infect_x | 0.010 | 0.0027 | 3.592 | 0.0003 | |
| F_mortality_4yrs | -0.007 | 0.0029 | −2.341 | 0.0192 | |
| Rab_prop_spread | -0.005 | 0.0016 | −2.897 | 0.0038 | |
| Intercept | 2.824 | 0.4918 | 5.741 | <0.0001 | |
| %exposed | te(4yrM_mortality, YOYF_mortality, 1yrF_mortality, Rab_mortality) | 190.982 | - | 94435503 | <0.0001 |
| te(YOY_mvt_90pc, Age_ind) | 23.998 | - | 994543 | <0.0001 | |
| s(Rab_prop_spread) | 3.000 | - | 947939 | <0.0001 | |
| s(M_mortality_1yr) | 1.998 | - | 138348 | <0.0001 | |
| YOYF_max_movt | 0.025 | 0.0001 | 251.84 | <0.0001 | |
| ADLF_mvt_75pc | 0.110 | 0.0005 | 201.12 | <0.0001 | |
| ADLF_mvt_90pc | 0.023 | 0.0004 | 53.49 | <0.0001 | |
| Prob_OHR_M | −0.007 | 0.0001 | −67.27 | <0.0001 | |
| Prob_OHR_F | 0.037 | 0.0003 | 148.62 | <0.0001 | |
| Nb_birth_peaks | 0.400 | 0.0010 | 397.74 | <0.0001 | |
| YOYM_mortality | −0.013 | 0.0009 | −135.04 | <0.0001 | |
| 3yrM_mortality | 0.009 | 0.0000 | 95.49 | <0.0001 | |
| 3yrF_mortality | 0.001 | 0.0000 | 59.22 | <0.0001 | |
| N_init_infect | 0.001 | 0.0000 | 154.22 | <0.0001 | |
| Intercept | −3.947 | 0.0195 | −202.36 | <0.0001 | |
| MaxInfect | s(3yrM_mortality) | 2.605 | - | 20.16 | <0.0001 |
| s(N_init_infect) | 2.556 | - | 161.05 | <0.0001 | |
| s(Resistance_in/out, by= Adult_mvt_75pc) | 2.971 | - | 37.70 | <0.0001 | |
| Nb_birth_peaks | 0.319 | 0.0780 | 4.087 | <0.0001 | |
| ADL_mvt_25pc | 0.314 | 0.1292 | 2.433 | 0.0150 | |
| YOYF_movt_90pc | 0.080 | 0.0435 | 1.844 | 0.0651 | |
| YOYM_mortality | −0.036 | 0.0076 | −4.650 | <0.0001 | |
| F_motality_1yr | −0.013 | 0.0055 | −2.388 | 0.0169 | |
| YOY_mvt_90pc* Age_ind | −0.004 | 0.0020 | −2.141 | 0.0322 | |
| Age_ind | –0.002 | 0.0243 | –0.101 | 0.9195 | |
| Intercept | 13.589 | 0.8470 | 16.045 | <0.0001 | |
| InfectY1 | Rab_spread_rate | 2.924 | - | 383.830 | <0.0001 |
| s(Kmean) | 1.991 | - | 1537.866 | <0.0001 | |
| s(Init_infect_y) | 1.972 | - | 383.033 | <0.0001 | |
| s(Init_infect_x) | 1.805 | - | 6.834 | 0.051 | |
| ADL_mvt_25pc | 0.241 | 0.0864 | 2.793 | 0.0052 | |
| Age_Ind | 0.0906 | 0.0061 | 14.813 | <0.0001 | |
| YOYF_mortality | –0.0224 | 0.0052 | –4.332 | <0.0001 | |
| Intercept | 9.116 | 0.3450 | 26.422 | <0.0001 | |
| SpatMV | te(Kmean, Rab_spread_rate) | 8.941 | - | 578.3 | <0.0001 |
| s(Age_Ind) | 2.949 | - | 466.8 | <0.0001 | |
| Kcv | 1.195 | 0.0745 | 16.033 | <0.0001 | |
| Nb_birth_peaks | –0.138 | 0.0331 | –4.175 | <0.0001 | |
| YOYM_motality | –0.007 | 0.0029 | –2.457 | 0.0141 | |
| Intercept | 3.634 | 0.1213 | 29.960 | <0.0001 |
References
- Barun, A.; Hanson, C.C.; Campell, K.J.; Simberloff, D. A review of small Indian mongoose management and eradications on islands. In Proceedings of the International Conference on Island Invasives: Eradication and Management, Auckland, New Zealand, 8–12 February 2010; pp. 17–25. [Google Scholar]
- Hinton, H.E.; Dunn, A.M.S. Mongooses, Their Natural History and Behaviour; University of California Press: Berkeley, CA, USA, 1967; 144p. [Google Scholar] [CrossRef]
- Berentsen, A.R.R.; Pitt, W.C.; Sugihara, R.T. Ecology of the small Indian mongoose (Herpestes auropunctatus) in North America. In Ecology and Management of Terrestrial Vertebrate Invasive Species in the United States; Pitt, C.W., Beasley, C.J., Witmer, W.G., Eds.; CRC Press: Boca Raton, FL, USA, 2018; pp. 251–267. [Google Scholar] [CrossRef]
- Everard, C.O.R.; Everard, J.D. Mongoose rabies in the Caribbean. Ann. N. Y. Acad. Sci. 1992, 16, 356–366. [Google Scholar] [CrossRef] [PubMed]
- Zieger, U.; Marston, D.A.; Sharma, R.; Chikweto, A.; Tiwari, K.; Sayyid, M.; Louison, B.; Goharriz, H.; Voller, K.; Breed, A.C.; et al. The phylogeography of rabies in Grenada, West Indies, and implications for control. PLoS Negl. Trop. Dis. 2014, 8, e3251. [Google Scholar] [CrossRef] [PubMed]
- Berentsen, A.R.; Johnson, S.R.; Gilbert, A.T.; VerCauteren, K.C. Exposure to rabies in small Indian mongooses (Herpestes auropunctatus) from two regions in Puerto Rico. J. Wildl. Dis. 2015, 51, 896–900. [Google Scholar] [CrossRef] [PubMed] [Green Version]
- Tierkel, E.S.; Arbona, G.; Rivera, A.; de Juan, A. Mongoose rabies in Puerto Rico. Public Health Rep. 1952, 67, 274–278. [Google Scholar] [CrossRef] [PubMed] [Green Version]
- Ma, X.; Monroe, B.P.; Cleaton, J.M.; Orciari, L.A.; Li, Y.; Kirby, J.D.; Chipman, R.B.; Petersen, B.W.; Wallace, R.M.; Blanton, J.D. Rabies surveillance in the United States during 2017. J. Am. Vet. Med Assoc. 2018, 253, 1555–1568. [Google Scholar] [CrossRef] [Green Version]
- Rivera-García, B. Profile of mongoose inflicted bite injuries and PEP referral in Puerto Rico during fiscal years 2005–2008. In Proceedings of the Rabies in the Americas XX Conference, Québec, QC, Canada, 18–23 October 2009. [Google Scholar]
- Nadin-Davis, S.A.; Torres, G.; Ribas, M.; Guzman, M.; Cruz de la Paz, R.; Morales, M.; Wandeler, A.I.E. A molecular epidemiological study of rabies in Cuba. Epidemiol. Infect. 2006, 134, 1313–1324. [Google Scholar] [CrossRef] [PubMed]
- Nadin-Davis, S.A.; Velez, J.; Malaga, C.; Wandeler, A.I. A molecular epidemiological study of rabies in Puerto Rico. Virus Res. 2008, 131, 8–15. [Google Scholar] [CrossRef]
- Velasco-Villa, A.; Mauldin, M.R.; Shi, M.; Escobar, L.E.; Gallardo-Romero, N.F.; Damon, I.; Olson, V.A.; Streicker, D.G.; Emerson, G. The history of rabies in the Western Hemisphere. Antivir. Res. 2017, 146, 221–232. [Google Scholar] [CrossRef]
- Everard, C.O.R.; Everard, J.D. Mongoose rabies in Grenada. In Population Dynamics of Rabies in Wildlife; Bacon, J.P., Ed.; National Academies Press: London, UK, 1985; pp. 43–69. [Google Scholar]
- Smith, K.F.; Dobson, A.P.; McKenzie, F.E.; Real, L.A.; Smith, D.L.; Wilson, M.L. Ecological theory to enhance infectious disease control and public health policy. Front. Ecol. Environ. 2005, 3, 29–37. [Google Scholar] [CrossRef]
- Murray, J.D. Mathematical Biology: I. an Introduction, 3rd ed.; Springer: New York, NY, USA, 2002. [Google Scholar] [CrossRef]
- Riley, S. Large-scale spatial-transmission models of infectious disease. Science 2007, 316, 1298–1301. [Google Scholar] [CrossRef] [PubMed] [Green Version]
- Keeling, M.J.; Danon, L. Mathematical modelling of infectious diseases. Br. Med. Bull. 2009, 92, 33–42. [Google Scholar] [CrossRef] [PubMed]
- Rees, E.E.; Pond, B.A.; Tinline, R.R.; Bélanger, D. Modelling the effect of landscape heterogeneity on the efficacy of vaccination for wildlife infectious disease control. J. Appl. Ecol. 2013, 50, 881–891. [Google Scholar] [CrossRef]
- McClure, K.M.; Gilbert, A.T.; Chipman, R.B.; Rees, E.E.; Pepin, K.M. Variation in host home range size decreases rabies vaccination effectiveness by increasing the spatial spread of rabies virus. J. Anim. Ecol. 2020, 89, 1375–1386. [Google Scholar] [CrossRef] [PubMed] [Green Version]
- Myers, M.F.; Rogers, D.J.; Cox, J.; Flahault, A.; Hay, S.I. Forecasting disease risk for increased epidemic preparedness in public health. Adv. Parasit. 2000, 47, 309–330. [Google Scholar] [CrossRef] [Green Version]
- Cullinghan, C.I.; Kyle, C.J.; Pond, B.A.; Rees, E.E.; White, B.N. Differential permeability of rivers to raccoon gene flow corresponds to rabies incidence in Ontario, Canada. Mol. Ecol. 2009, 18, 43–53. [Google Scholar] [CrossRef]
- Russell, C.A.; Real, L.A.; Smith, D.L. Spatial control of rabies on heterogeneous landscapes. PLoS ONE 2006, 1, e27. [Google Scholar] [CrossRef]
- Lloyd, A.L.; May, R.M. Spatial heterogeneity in epidemic models. J. Theor. Biol. 1996, 179. [Google Scholar] [CrossRef] [PubMed]
- Rees, E.E.; Pond, B.A.; Cullingham, C.I.; Tinline, R.; Ball, D.; Kyle, C.J.; White, B.N. Assessing a landscape barrier using genetic simulation modelling: Implications for raccoon rabies management. Prev. Vet. Med. 2008, 86, 107–123. [Google Scholar] [CrossRef] [PubMed]
- Rees, E.E.; Pond, B.A.; Tinline, R.R.; Bélanger, D. Understanding effects of barriers on the spread and control of rabies. In Advances in Virus Research; Elsevier: Amsterdam, The Netherlands, 2011; Volume 79, pp. 421–447. [Google Scholar] [CrossRef]
- Nsoesie, E.O.; Beckman, R.J.; Marathe, M.V. Sensitivity analysis of an individual-based model for simulation of influenza epidemics. PLoS ONE 2012, 7, e45414. [Google Scholar] [CrossRef]
- Parry, H.R.; Topping, C.J.; Kennedy, M.C.; Boatman, N.D.; Murray, A.W.A. A Bayesian sensitivity analysis applied to an Agent-based model of bird population response to landscape change. Environ. Modell. Softw. 2013, 45, 104–115. [Google Scholar] [CrossRef]
- Restif, O.; Hayman, D.T.; Pulliam, J.R.; Plowright, R.K.; George, D.B.; Luis, A.D.; Cunningham, A.A.; Bowen, R.A.; Fooks, A.R.; O’Shea, T.J.; et al. Model-guided fieldwork: Practical guidelines for multidisciplinary research on wildlife ecological and epidemiological dynamics. Ecol. Lett. 2012, 15, 1083–1094. [Google Scholar] [CrossRef] [PubMed] [Green Version]
- Marino, S.; Hogue, I.B.; Ray, C.J.; Kirschner, D.E. A methodology for performing global uncertainty and sensitivity analysis in systems biology. J. Theor. Biol. 2008, 254, 178–196. [Google Scholar] [CrossRef] [PubMed] [Green Version]
- Martien, K.K.; Taylor, B.L.; Slooten, E.; Dawson, S. A sensitivity analysis to guide research and management for Hector’s dolphin. Biol. Conserv. 1999, 90, 183–191. [Google Scholar] [CrossRef]
- Ellis, A.M.; Garcia, A.J.; Focks, D.A.; Morrison, A.C.; Scott, T.W. Parameterization and sensitivity analysis of a complex simulation model for mosquito population dynamics, dengue transmission, and their control. Am. J. Trop. Med. Hyg. 2011, 85, 257–264. [Google Scholar] [CrossRef] [PubMed] [Green Version]
- Horst, G.R.; Hoagland, D.B.; Kilpatrick, C.W. The mongoose in the West Indies: The biogeography and population biology of an introduced species. In Biogeography of the West Indies: Patterns and Perspectives; Woods, C.A., Sergile, F.E., Eds.; CRC Press: Boca Raton, FL, USA, 2001; pp. 409–424. [Google Scholar]
- Johnson, S.R.; Berentsen, A.R.; Ellis, C.; Davis, A.; Vercauteren, K.C. Estimates of small Indian mongoose densities: Implications for rabies management. J. Wildl. Manag. 2016, 80, 37–47. [Google Scholar] [CrossRef]
- Berentsen, A.R.; Rivera-Rodriguez, M.J.; McClure, K.M.; Torres-Toledo, F.B.; Garcia-Cancel, J.G.; Gilbert, A.T. Home range estimates for small Indian mongooses (Urva auropunctata) in Southwestern Puerto Rico. Caribb. J. Sci. 2020, 50, 225–235. [Google Scholar] [CrossRef]
- Blanton, J.D.; Meadows, A.; Murphy, S.M.; Manangan, J.; Hanlon, C.A.; Faber, M.-L.; Dietzschold, B.; Rupprecht, C.E. Vaccination of small Asian mongoose (Herpestes javanicus) against rabies. J. Wildl. Dis. 2006, 42, 663–666. [Google Scholar] [CrossRef] [PubMed] [Green Version]
- Vos, A.; Kretzschmar, A.; Ortmann, S.; Lojkic, I.; Habla, C.; Müller, T.; Kaiser, C.; Hundt, B.; Schuster, P. Oral vaccination of captive small Indian mongoose (Herpestes auropunctatus) against rabies. J. Wildl. Dis. 2013, 49, 1033–1036. [Google Scholar] [CrossRef] [PubMed]
- Linhart, S.B.; Creekmore, T.E.; Corn, J.L.; Whitney, M.D.; Snyder, B.D. Evaluation of baits for oral rabies vaccination of mongooses: Pilot field trials in Antigua, West Indies. J. Wildl. Dis. 1993, 29, 290–294. [Google Scholar] [CrossRef]
- Creekmore, T.E.; Linhart, S.B.; Corn, J.L.; Whitney, M.D.; Snyder, B.D.; Nettles, V.F. Field evaluation of baits and baiting strategies for delivering oral vaccine to mongooses in Antigua, West Indies. J. Wildl. Dis. 1994, 30, 497–505. [Google Scholar] [CrossRef]
- Berentsen, A.R.; Chipman, R.B.; Nelson, K.M.; Gruver, K.S.; Boyd, F.; Volker, S.F.; Davis, A.J.; Vos, A.; Ortmann, S.; Gilbert, A.T. Placebo oral rabies vaccine bait uptake by small Indian mongooses (Herpestes auropunctatus) in Southwestern Puerto Rico. J. Wildl. Dis. 2020, 56, 452–456. [Google Scholar] [CrossRef] [PubMed]
- Rees, E.E. Genetic Spatial Simulation Modelling of Raccoon Rabies. Ph.D. Thesis, Trent University, Peterborough, ON, USA, 2008. [Google Scholar]
- Ludwig, A.; Berthiaume, P.; Richer, J.; Tinline, R.; Bigras-Poulin, M. A simple geometric validation approach to assess the basic behaviour of space- and time- distributed models of epidemic spread: An example using the Ontario rabies model. Transbound. Emerg. Dis. 2014, 61, 147–155. [Google Scholar] [CrossRef]
- Tinline, R.; Ball, D.; Broadfoot, J.; Pond, B.A. The Ontario Rabies Model; Wildlife Reasearch and Development Section, Ontario Ministry of Natural Resources: Peterborough, ON, Canada, 2007; p. 45. [Google Scholar]
- Jennings, A.P.; Veron, G. Predicted distributions and ecological niches of 8 civet and mongoose species in Southeast Asia. J. Mammal. 2011, 92, 316–327. [Google Scholar] [CrossRef]
- Nellis, D.W.; Everard, C.O.R. The biology of the mongoose in the Caribbean. Stud. Fauna Curaçao Other Caribb. Isl. 1983, 64, 1–162. [Google Scholar]
- Hays, W.S.; Conant, S. Biology and impacts of Pacific Islands invasive species. 1. a worldwide review of effects of the small Indian mongoose, Herpestes javanicus (Carnivora: Herpestidae). Pac. Sci. 2007, 61, 3–16. [Google Scholar] [CrossRef]
- Asdell, S.A. Patterns of Mammalian Reproduction, 2nd ed.; Cornell University Press: New York, NY, USA, 1964. [Google Scholar]
- Pearson, O.P.; Baldwin, P.H. Reproduction and age structure of a mongoose population in Hawaii. J. Mammal. 1953, 34, 436–447. [Google Scholar] [CrossRef]
- Pimentel, D. Biology of the Indian mongoose in Puerto Rico. J. Mammal. 1955, 36, 62–68. [Google Scholar] [CrossRef]
- Hays, W.S. Annual dispersal cycle of the small Indian mongoose (Herpestes auropunctatus) (Carnivora: Herpestidae) in Hawai’i. Pac. Sci. 1999, 53, 252–256. [Google Scholar]
- Gorman, M. Dispersion and foraging of the small Indian mongoose, Herpestes auropunctatus (Carnivora: Viverridae) relative to the evolution of social viverrids. J. Zool. 1979, 187, 65–73. [Google Scholar] [CrossRef]
- Pitt, W.C.; Sugihara, R.T.; Berentsen, A.R. Effect of travel distance, home range, and bait on the management of small Indian mongooses, Herpestes auropunctatus. Biol. Invasions 2015, 17, 1743–1759. [Google Scholar] [CrossRef] [Green Version]
- Qgis.org Geographic Information System. Open Source Geospatial Foundation Project. Available online: https://www.qgis.org/en/site/ (accessed on 16 February 2021).
- Homer, C.G.; Huang, C.; Yang, L.; Wylie, B.; Coan, M. Development of a 2001 national landcover database for the United States. Photogramm. Eng. Rem. S 2004, 70, 829–840. [Google Scholar] [CrossRef] [Green Version]
- Venables, W.N.; Ripley, B.D. Modern Applied Statistics with S, 4th ed.; Springer Science+Business Media: New York, NY, USA, 2002; p. Xii + 498. [Google Scholar] [CrossRef]
- Wood, S.N. Generalized Additive Models: An Introduction with R, 2nd ed.; Chapman & Hall/CRC: Boca Raton, FL, USA, 2017. [Google Scholar]
- Grosbois, V.; Gimenez, O.; Gaillard, J.M.; Pradel, R.; Barbraud, C.; Clobert, J.; Møller, A.; Weimerskirch, H. Assessing the impact of climate variation on survival in vertebrate populations. Biol. Rev. 2008, 83, 357–399. [Google Scholar] [CrossRef]
- Draper, N.R.; Smith, H. Applied Regression Analysis; John Wiley and Sons: New York, NY, USA, 1998. [Google Scholar] [CrossRef]
- Graham, M.H. Confronting multicolinearity in ecological multiple regression. Ecology 2003, 84, 2809–2815. [Google Scholar] [CrossRef] [Green Version]
- Neter, J.; Kutner, M.H.; Nachtsheim, C.J.; Wasserman, W. Applied Linear Statistical Models, 4th ed.; Irwin: Chicago, IL, USA, 1996. [Google Scholar]
- Burnham, K.; Anderson, D. Model Selection and Multi-Model Inference: A Practical Information-Theoretic Approach, 2nd ed.; Springer: New York, NY, USA, 2002. [Google Scholar] [CrossRef]
- Arnold, T.W. Uninformative parameters and model selection using Akaike’s information criterion. J. Wildl. Manag. 2010, 74, 1175–1178. [Google Scholar] [CrossRef]
- R Core Team. R: A Language and Environment for Statistical Computing; R Foundation for Statistical Computing: Vienna, Austria, 2019. [Google Scholar]
- Velez, J.V. Presencia de Anticuerpos Antirabicos y Diagnostico de la Rabia en Mangostas (Herpestes auropunctatus) Capturadas en El Bosque Nacional del Caribe (El Yunque). Master’s Thesis, University of Puerto Rico, San Juan, PR, USA, 1998. [Google Scholar]
- Quinn, J.H.; Whisson, D.A. The effects of anthropogenic food on the spatial behaviour of small Indian mongooses (Herpestes javanicus) in a subtropical rainforest. J. Zool. 2005, 267, 339–350. [Google Scholar] [CrossRef]
- Hudson, M.A. Optimizing Monitoring and Control Strategies for Invasive Alien Mammals: The Small Indian Mongoose in St. Lucia; University of Bath: Bath, UK, 2010. [Google Scholar]
- Vilella, F.J. Biology of the mongoose (Herpestes javanicus) in a rain forest of Puerto Rico. Biotropica 1998, 30, 120–125. [Google Scholar] [CrossRef]
- Guzmán-Colón, D.; Roloff, G.J. Mongoose in the rainforest: Analyzing population estimates and habitat attributes to support management in El Yunque National Forest, Puerto Rico. Caribb. Nat. 2014, 19. [Google Scholar] [CrossRef]
- Sauvé, C.C.; Berentsen, A.R.R.; Conan, A.; Cruz-Martinez, L.; Gilbert, A.T.; Rees, E.E.; Leighton, P.A. Standardized habitat-specific small Indian mongoose density estimates: Implications for rabies control. In Proceedings of the Rabies in the Americans XXXth Annual Conference, Kansas, MI, USA, 27 October–1 November 2019. [Google Scholar]
- Seetahal, J.F.R.; Vokaty, A.; Vigilato, M.A.N.; Carrington, C.V.F.; Pradel, J.; Louison, B.; Sauers, A.V.; Roopnarine, R.; Arrebato, J.C.G.; Millien, M.F.; et al. Rabies in the Caribbean: A situational analysis and historic review. Trop. Med. Infect. Dis. 2018, 3, 89. [Google Scholar] [CrossRef] [PubMed] [Green Version]
- Coolman, A. Finding Effective Bait for Trapping Small Indian Mongoose in Haiti. Honors Bachelor’s Thesis, Ball State University, Muncie, IN, USA, 2016. [Google Scholar]
- Schneider, T.C.; Kappeler, P.M. Social systems and life-history characteristics of mongooses. Biol. Rev. Camb. Philos. 2014, 89, 173–198. [Google Scholar] [CrossRef] [PubMed]
- Rood, J.P. Dispersal and intergroup transfer in the dwarf mongoose. In Mammalian Dispersal Patterns: The Effects of Social Structure on Population Genetics; Chepko-Sade, B.D., Halpin, Z.T., Eds.; University of Chicago Press: Chicago, IL, USA, 1987; pp. 85–103. [Google Scholar]
- Cant, M.A.; Otali, E.; Mwanguhya, F. Eviction and dispersal in co-operatively breeding banded mongooses (Mungos mungo). J. Zool. 2001, 254, 155–162. [Google Scholar] [CrossRef]
- Streicker, D.G.; Winternitz, J.C.; Satterfield, D.A.; Condori-Condori, R.E.; Broos, A.; Tello, C.; Recuenco, S.; Velasco-Villa, A.; Altizer, S.; Valderrama, W. Host-pathogen evolutionary signatures reveal dynamics and future invasions of vampire bat rabies. Proc. Natl. Acad. Sci. USA 2016, 113, 10926–10931. [Google Scholar] [CrossRef] [PubMed] [Green Version]
- Nellis, D.W. Herpestes auropunctatus. Mamm. Species 1989, 342. [Google Scholar] [CrossRef]
- Edwards, R. Habitat Selection of the Introduced Small Indian Mongoose (Herpestes javanicus), Using Radio Telemetry and Mark-Recapture Techniques on St. Lucia. Master’s Thesis, University of Exeter, Exeter, UK, 2006. [Google Scholar]
- Peel, A.J.; Pulliam, J.R.C.; Luis, A.D.; Plowright, R.K.; O’Shea, T.J.; Hayman, D.T.S.; Wood, J.L.N.; Webb, C.T.; Restif, O. The effect of seasonal birth pulses on pathogen persistence in wild mammal populations. Proc. R. Soc. B 2014, 281, 20132962. [Google Scholar] [CrossRef] [Green Version]
- Blackwood, J.C.; Streicker, D.G.; Altizer, S.; Rohani, P. Resolving the roles of immunity, pathogenesis, and immigration for rabies persistence in vampire bats. Proc. Natl. Acad. Sci. USA 2013, 110, 20837–20842. [Google Scholar] [CrossRef] [Green Version]
- Rupprecht, C.E.; Turmelle, A.; Kuzmin, I.V. A perspective on lyssavirus emergence and perpetuation. Curr. Opin. Virol. 2011, 1, 662–670. [Google Scholar] [CrossRef]
- Everard, C.O.R.; Baer, G.M.; Alls, M.E.; Moore, S.A. Rabies serum neutralizing antibody in mongooses from Grenada. Trans. R. Soc. Trop. Med. Hyg. 1981, 5, 654–666. [Google Scholar] [CrossRef]
- Gold, S.; Donnelly, C.A.; Nouvellet, P.; Woodroffe, R. Rabies virus-neutralising antibodies in healthy, unvaccinated individuals: What do they mean for rabies epidemiology? PLoS Negl. Trop. Dis. 2020, 14, e0007933. [Google Scholar] [CrossRef] [PubMed]


| Parameter | Initial Value (Population Growth) | Value | Reference |
|---|---|---|---|
| Biological parameters | |||
| Habitat-specific carrying capacities (animals/km2) | Semi-wooded: 80 Heavily wooded: 50 Grassland: 30 Wetlands: 10 Developed: 4 | Baseline: semi-wooded range: 33–124 animals/km2. Coefficient ranges: -Wooded: 0.1–1.52 -Heavily wooded: 0.43–1.087 -Grassland: 0.1–0.43 -Wetlands: 10 -Developed: 4 | Mean densities presented in [33], relative difference between habitats from [32]. No available data to inform coefficient values for developed areas and wetlands. |
| Elevation-related resistance to movement | Resistance to movement when cell elevation ≥300 m: 0% | Resistance to movement when cell elevation ≥300 m range: 0–99%. | Small Indian mongooses mostly stay at elevations <300 m [43] |
| Age of independence (mongoose becomes juvenile, no longer dependent on maternal care) | 22 weeks | Range: 17.5–26.3 weeks | [44,45] |
| Age of adulthood (mongoose no longer juvenile, i.e., sexually mature) | 22 weeks | Range: 1.1–42.6 weeks after age of independence | [44] |
| Age- and sex-specific average annual mortality (%) | 0 year: 35.9 (M); 60.1 (F) 1 year: 86.4 (M); 80.9 (F) 2 years: 58.8 (M); 84.6 (F) 3 years: 43.9 (M); NA (F) | For animals aged <4 years, selection from normal distribution where mean= initial age- and sex-specific mortality rate and SD = 0.05 × mortality rate For animals aged ≥4 years, selection from uniform distribution, range: 40-95 | Derived from population age distributions in [44] |
| Gestation period | 7 weeks | 7 weeks | [46] |
| Distribution of birthing date | mean = week 27 (first week of July), SD = 2 weeks | 1st birth peak: mean = week 27 (first week of July), SD = 2 weeks 2nd birth peak (if present): week 1 (first week of January), SD = 2 weeks | Derived from birth distribution in [44] |
| Number of annual birth peaks | 1 | 2 if maternal care period allows it, 1 otherwise | [44] |
| Prevent mating of siblings? | No | No | No published data suggesting such a mechanism |
| Female juvenile birth probability | 50 | 50 | [47] |
| Female adult birth probability | 100 | 100 | [47] |
| Average litter size +/− variance | 4 +/− 4 | 4 +/− 4 | [44,48] |
| Litter M:F sex ratio | 1:1 | 1:1 | [44] |
| Weeks when dispersal is permitted | Week 19 (2nd week of May) | Week 19 (2nd week of May) | [49] |
| Age- and sex-specific dispersal distance | For both sexes and all ages: 50% probability of moving 1 cell; 50% probability of moving 2 cells | Gamma distribution with: Juveniles: Mu range: 1–10; scale range: 0.1–10 Adult females: Mu = 1, scale range: 0.1–10 Adult males: Female movement distribution × 1.46 | Derived from [50,51] |
| Probability of interaction with animals from neighboring cells | For both sexes: 22% (constant throughout the year) | Probability obtained based on home range sizes ranging from 0.01 km2–0.5 km2 for females. Multiplying factor for male home range: 2.05–2.48. | [51] |
| Epidemiological parameters | |||
| Distribution of rabies incubation period | NA | 1 week: 25% 2 weeks: 25% 3 weeks: 25% 4 weeks: 25% | Computed from empirical data presented in [7] |
| Duration of rabies infection period | NA | 2 weeks | Computed from empirical data presented in [7] |
| Rabies transmission coefficient (probability of transmission given a contact between infectious and susceptible individuals) | NA | Range: 1–100% | No published data |
| Rabies-induced mortality | NA | Range: 1–100% | No published data |
| Initial infection location | NA | 3 adjacent cells randomly selected on landscape | No published data; rabies introduction in islands considered isolated events |
| Initial infection prevalence | NA | Range: 50–100% | No published data; rabies introduction in islands considered isolated events |
| Time of initial infection | NA | 1st week of 5th year of simulation | Rabies introduced following time required for population size to adjust to landscape carrying capacities |
| Variables | Type of Variable | Description | Distribution | No. var 1(P) | No. Models | n | Varstochasticity |
|---|---|---|---|---|---|---|---|
| Persistence | Logical (binary) | Whether rabies persisted (1) or not (0) from initial infection through the end of the 25-years simulation. | Multinomial logistic regression (package nnet [54]) | 20 | 131,072 | 2500 | 0.1173 2 |
| %exposed | Proportion | Proportion of the total population that was exposed to rabies and recovered from the infection at the end of the 25-years simulation (overall indicator of outbreak severity) | Binomial | 22 | 1,262,144 | 1614 | 0.3099 |
| TimeToCross | Latency time | Time (weeks) since initial infection for the disease to extend to half the length of the study area (measures the severity of the initial outbreak) | Gamma | 23 | 1,408,579 | 2282 | 0.0842 |
| MaxInfect | Positive integer (count) | Maximal number of rabies cases that occurred during any week of the simulation (overall indicator of outbreak severity) | Negative binomial | 21 | 131,072 | 2499 | 0.0993 |
| InfectY1 | Positive integer (count) | Total number of rabies cases one year after the initial infection. | Negative binomial | 22 | 262,144 | 2499 | 0.0998 |
| InfectSpatVM | Positive numeric | Mean: variance ratio for the number of infected animals per cell (spatial measure of diseased population dynamics) | Gamma | 25 | 262,144 | 1573 | 0.1388 |
| Variable | Description |
|---|---|
| Landscape-related variables | |
| Kmean | Average cell carrying capacity on the landscape |
| Kcv | Coefficient of variation of cell carrying capacities over the landscape |
| Resist_elev | Resistance to incoming and outgoing movement (%) among cells where elevation ≥300 m above sea level, representing the impermeability index of the barrier to mongoose dispersal associated with landscape elevation |
| K_init_infect | Sum of the carrying capacities from the three cells where the initial rabies infection occurred |
| Animal movement variables | |
| YOY_Max_Mvt | Young of the year maximum annual movement distance allowed |
| Adult_Max_Mvt | Adult maximum annual movement distance allowed |
| YOY_mvt_0pc YOY_mvt_25pc YOY_mvt_50pc YOY_mvt_75pc YOY_mvt_90pc | Young of the year 0th, 25th, 50th, 75th, and 90th percentiles of annual movement distance allowed |
| Adult_mvt_25pc Adult_mvt_50pc Adult_mvt_75pc Adult_mvt_90pc | Adult 0th, 25th, 50th, 75th, and 90th percentiles of annual movement distance allowed |
| Prob_OHC_M Prob_OHC_F | Sex-specific weekly probability of being outside home cell (i.e., interacting with individuals from a neighboring cell) |
| Demographic variables | |
| Nb_birth_peaks | Number of annual birth peaks |
| Age_ind | Age (weeks) at which young of the year become independent from their mother and undergo demographic processes independently |
| YOYM_mortality 1yrM_mortality 2yrM_mortality 3yrM_mortality 4yrM_mortality YOYF_mortality 1yrF_mortality 2yrF_mortality 3yrF_mortality 4yrF_mortality | Sex- and age-specific annual mortality rates for animals aged <1, 1, 2, 3, and 4 years old |
| Epidemiological variables | |
| Rab_spread_rate | Probability of an individual transmitting rabies when interacting with a conspecific |
| Rab_mortality | Rabies-induced mortality rate |
| Init_infect_x Init_infect_y | Vertical (y) and horizontal (x) distance (no. of cells) from the landscape center point where the initial rabies infection occurred |
| N_init_infect | No. of animals infected by the initial rabies infection |
| Response Variables | Persistence | %Exposed | TimeTo Cross | InfectY1 | MaxInfect | Infect SpatVM | |
|---|---|---|---|---|---|---|---|
| Landscape variables | Kmean | nl | nl | nl | |||
| Kcv | nl | + | |||||
| K_init_infect | |||||||
| Resistance_in/out | nl | nl | |||||
| Animal movement variables | YOY_mvt_0pc | ||||||
| YOY_mvt_25pc | |||||||
| YOY_mvt_50pc | |||||||
| YOY_mvt_75pc | |||||||
| YOY_mvt_90pc | − | + | + | ||||
| YOY_Max_mvt | nl | + | |||||
| Adult_mvt_25pc | + | + | + | ||||
| Adult_mvt_50pc | |||||||
| Adult_mvt_75pc | + | nl | |||||
| Adult_mvt_90pc | + | ||||||
| Adult_Max_Mvt | |||||||
| Prob_OHC_M | − | ||||||
| Prob_OHC_F | + | nl | |||||
| Demographic variables | Nb_birth_peaks | + | + | − | |||
| Age_ind | − | nl | nl | + | - | nl | |
| YOYM_mortality | − | − | |||||
| 1yrM_mortality | nl | nl | |||||
| 2yrM_mortality | |||||||
| 3yrM_mortality | + | nl | |||||
| 4yrM_mortality | nl | ||||||
| YOYF_mortality | nl | nl | − | − | |||
| 1yrF_mortality | nl | nl | − | ||||
| 2yrF_mortality | |||||||
| 3yrF_mortality | + | ||||||
| 4yrF_mortality | − | ||||||
| Epidemiological variables | Rab_spread_rate | − | nl | nl | nl | nl | |
| Rab_mortality | nl | nl | |||||
| Init_infect_y | + | nl | |||||
| Init_infect_x | nl | nl | |||||
| N_init_infect | + | nl | nl | ||||
| Interaction terms | none | YOY_mvt_90pc* Age_ind 4yrM_mortality* YOYF_mortality* 1yrF_mortality * Rab_mortality | Prob_OHC_F* N_init_infect | none | Adult_mvt_75pc* Resistance_in/out YOY_mvt_90pc* Age_ind | Kmean* Rab_spread_rate |
| Landscape Variables | Movement Variables | Demographic Variables | Epidemiological Variables | ||||||
|---|---|---|---|---|---|---|---|---|---|
| Habitat-Specific Densities (Kmean, Kcv) | Resistance to Dispersal Associated with Elevation | YOY Dispersal | Adult Fine-scale Movement | Home Range Size | Age of Independence | Nb Annual Birth Peaks | Age- and Sex-Specific Mortality | Rabies Transmission Rate | |
| Capture/Mark/ Recapture (CMR) | standardized method sampling in different habitats | sampling across a topographic gradient | standardized method sampling in different habitats | baited automatic cameras monitoring marked females (presence of pups) | female reproductive status upon capture (nursing, pregnant) baited automatic cameras monitoring marked females (presence of pups) | age estimation (age distribution curves) survival analysis from CMR data | |||
| Telemetry | equipment of animals in mountainous areas | equipment of YOY | fine-scale location (e.g., GPS data, automated passive integrated transponder (PIT) tag scanning) | sampling in different habitats | equipment of pregnant females automated PIT tag scanning | proximity function | |||
| Genetics | genotype comparisons of populations across mountainous landscapes | ||||||||
Publisher’s Note: MDPI stays neutral with regard to jurisdictional claims in published maps and institutional affiliations. |
© 2021 by the authors. Licensee MDPI, Basel, Switzerland. This article is an open access article distributed under the terms and conditions of the Creative Commons Attribution (CC BY) license (http://creativecommons.org/licenses/by/4.0/).
Share and Cite
Sauvé, C.C.; Rees, E.E.; Gilbert, A.T.; Berentsen, A.R.; Allibert, A.; Leighton, P.A. Modeling Mongoose Rabies in the Caribbean: A Model-Guided Fieldwork Approach to Identify Research Priorities. Viruses 2021, 13, 323. https://0-doi-org.brum.beds.ac.uk/10.3390/v13020323
Sauvé CC, Rees EE, Gilbert AT, Berentsen AR, Allibert A, Leighton PA. Modeling Mongoose Rabies in the Caribbean: A Model-Guided Fieldwork Approach to Identify Research Priorities. Viruses. 2021; 13(2):323. https://0-doi-org.brum.beds.ac.uk/10.3390/v13020323
Chicago/Turabian StyleSauvé, Caroline C., Erin E. Rees, Amy T. Gilbert, Are R. Berentsen, Agathe Allibert, and Patrick A. Leighton. 2021. "Modeling Mongoose Rabies in the Caribbean: A Model-Guided Fieldwork Approach to Identify Research Priorities" Viruses 13, no. 2: 323. https://0-doi-org.brum.beds.ac.uk/10.3390/v13020323