
E6/E7 Functional Differences among Two Natural Human Papillomavirus 18 Variants in Human Keratinocytes

 , , , ,
Abstract
:
1. Introduction
2. Materials and Methods
2.1. Cells and Plasmids
2.2. PHK Growth Kinetics
2.3. Cell Proliferation
2.4. qRT-PCR
2.5. Western Blotting
2.6. DNA-Induced Damage and Apoptosis
2.7. EMT (Epithelial–Mesenchymal Transition) Analysis
2.8. Clonogenic Assay
2.9. Induction of Differentiation
2.10. Spheroid Formation Assay
2.11. Cell Migration and Invasion
2.12. Raft Cultures and Immunohistochemistry
2.13. Statistical Analysis
3. Results
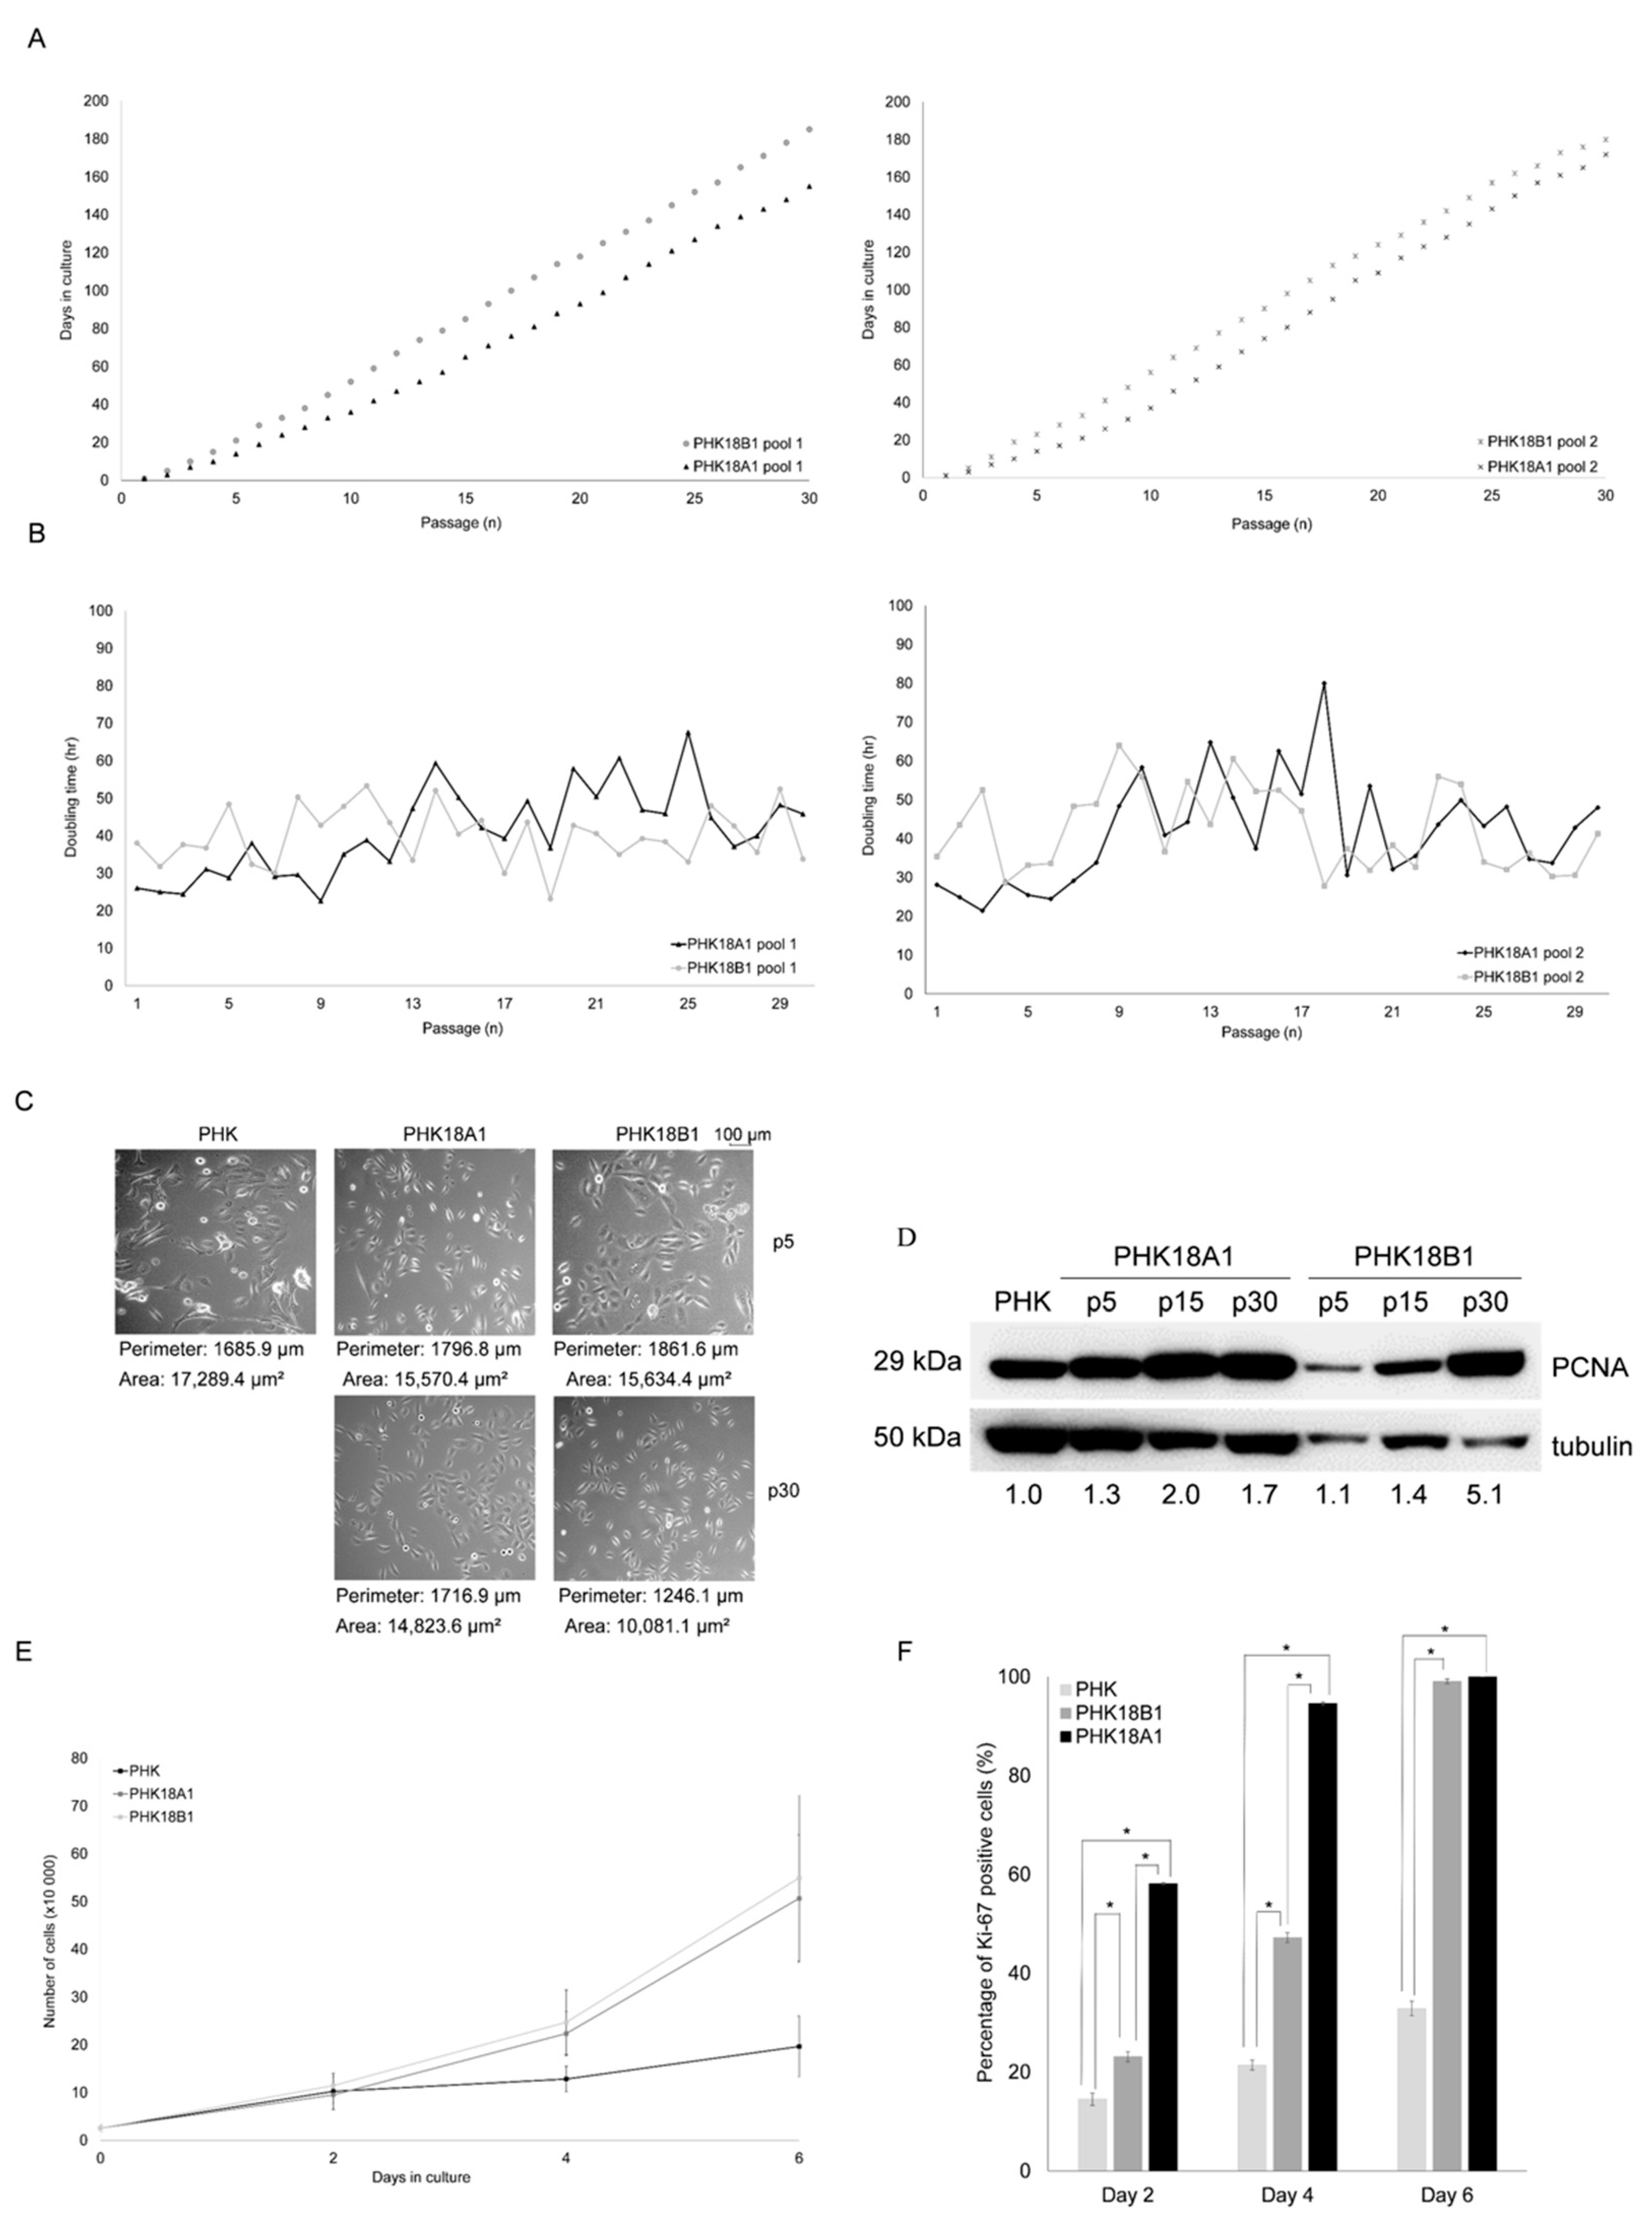
3.1. E6/E7 of HPV-18 Variants Differ in Immortalization Ability
3.2. Immortalized PHK18A1 and PHK18B1 Show No Difference in Proliferation
3.3. PHK18A1 and PHK18B1 Exhibit Similar E6*I, E6, E7, p53, p16, pRb, and p21 levels
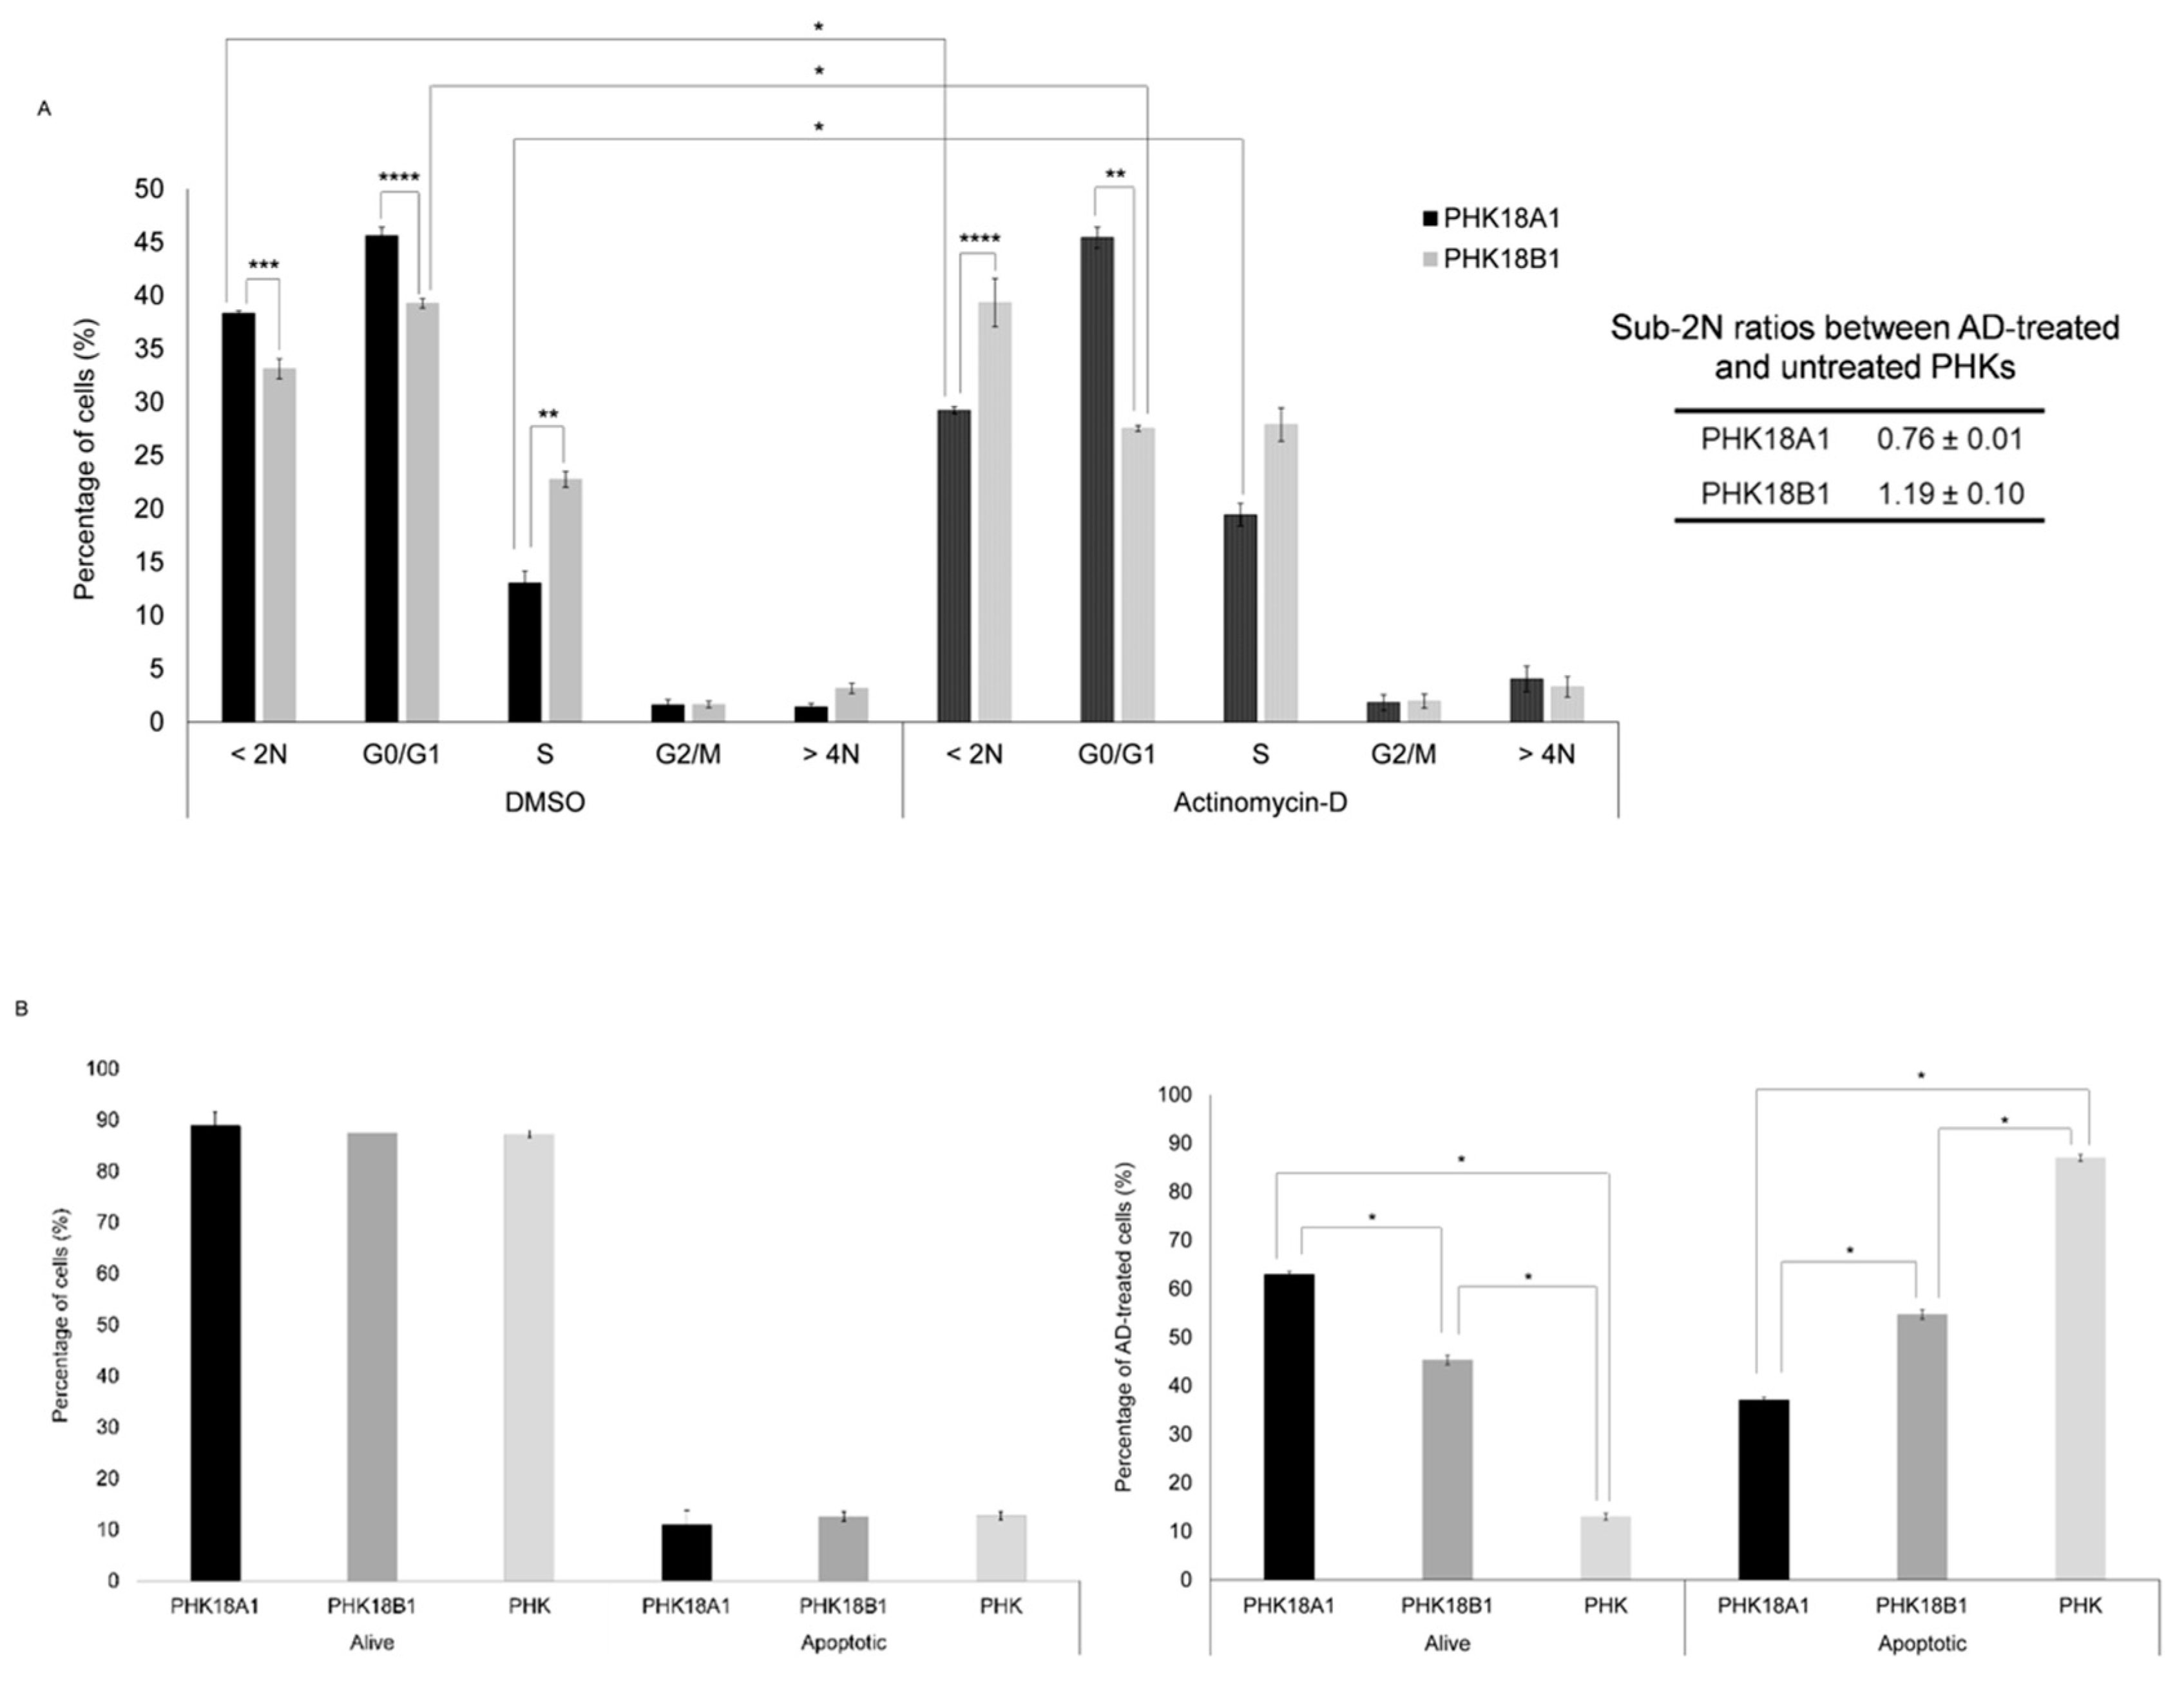
3.4. PHK18A1 and PHK18B1 Similarly Overcome Actinomycin-D (AD)-Induced Growth Arrest
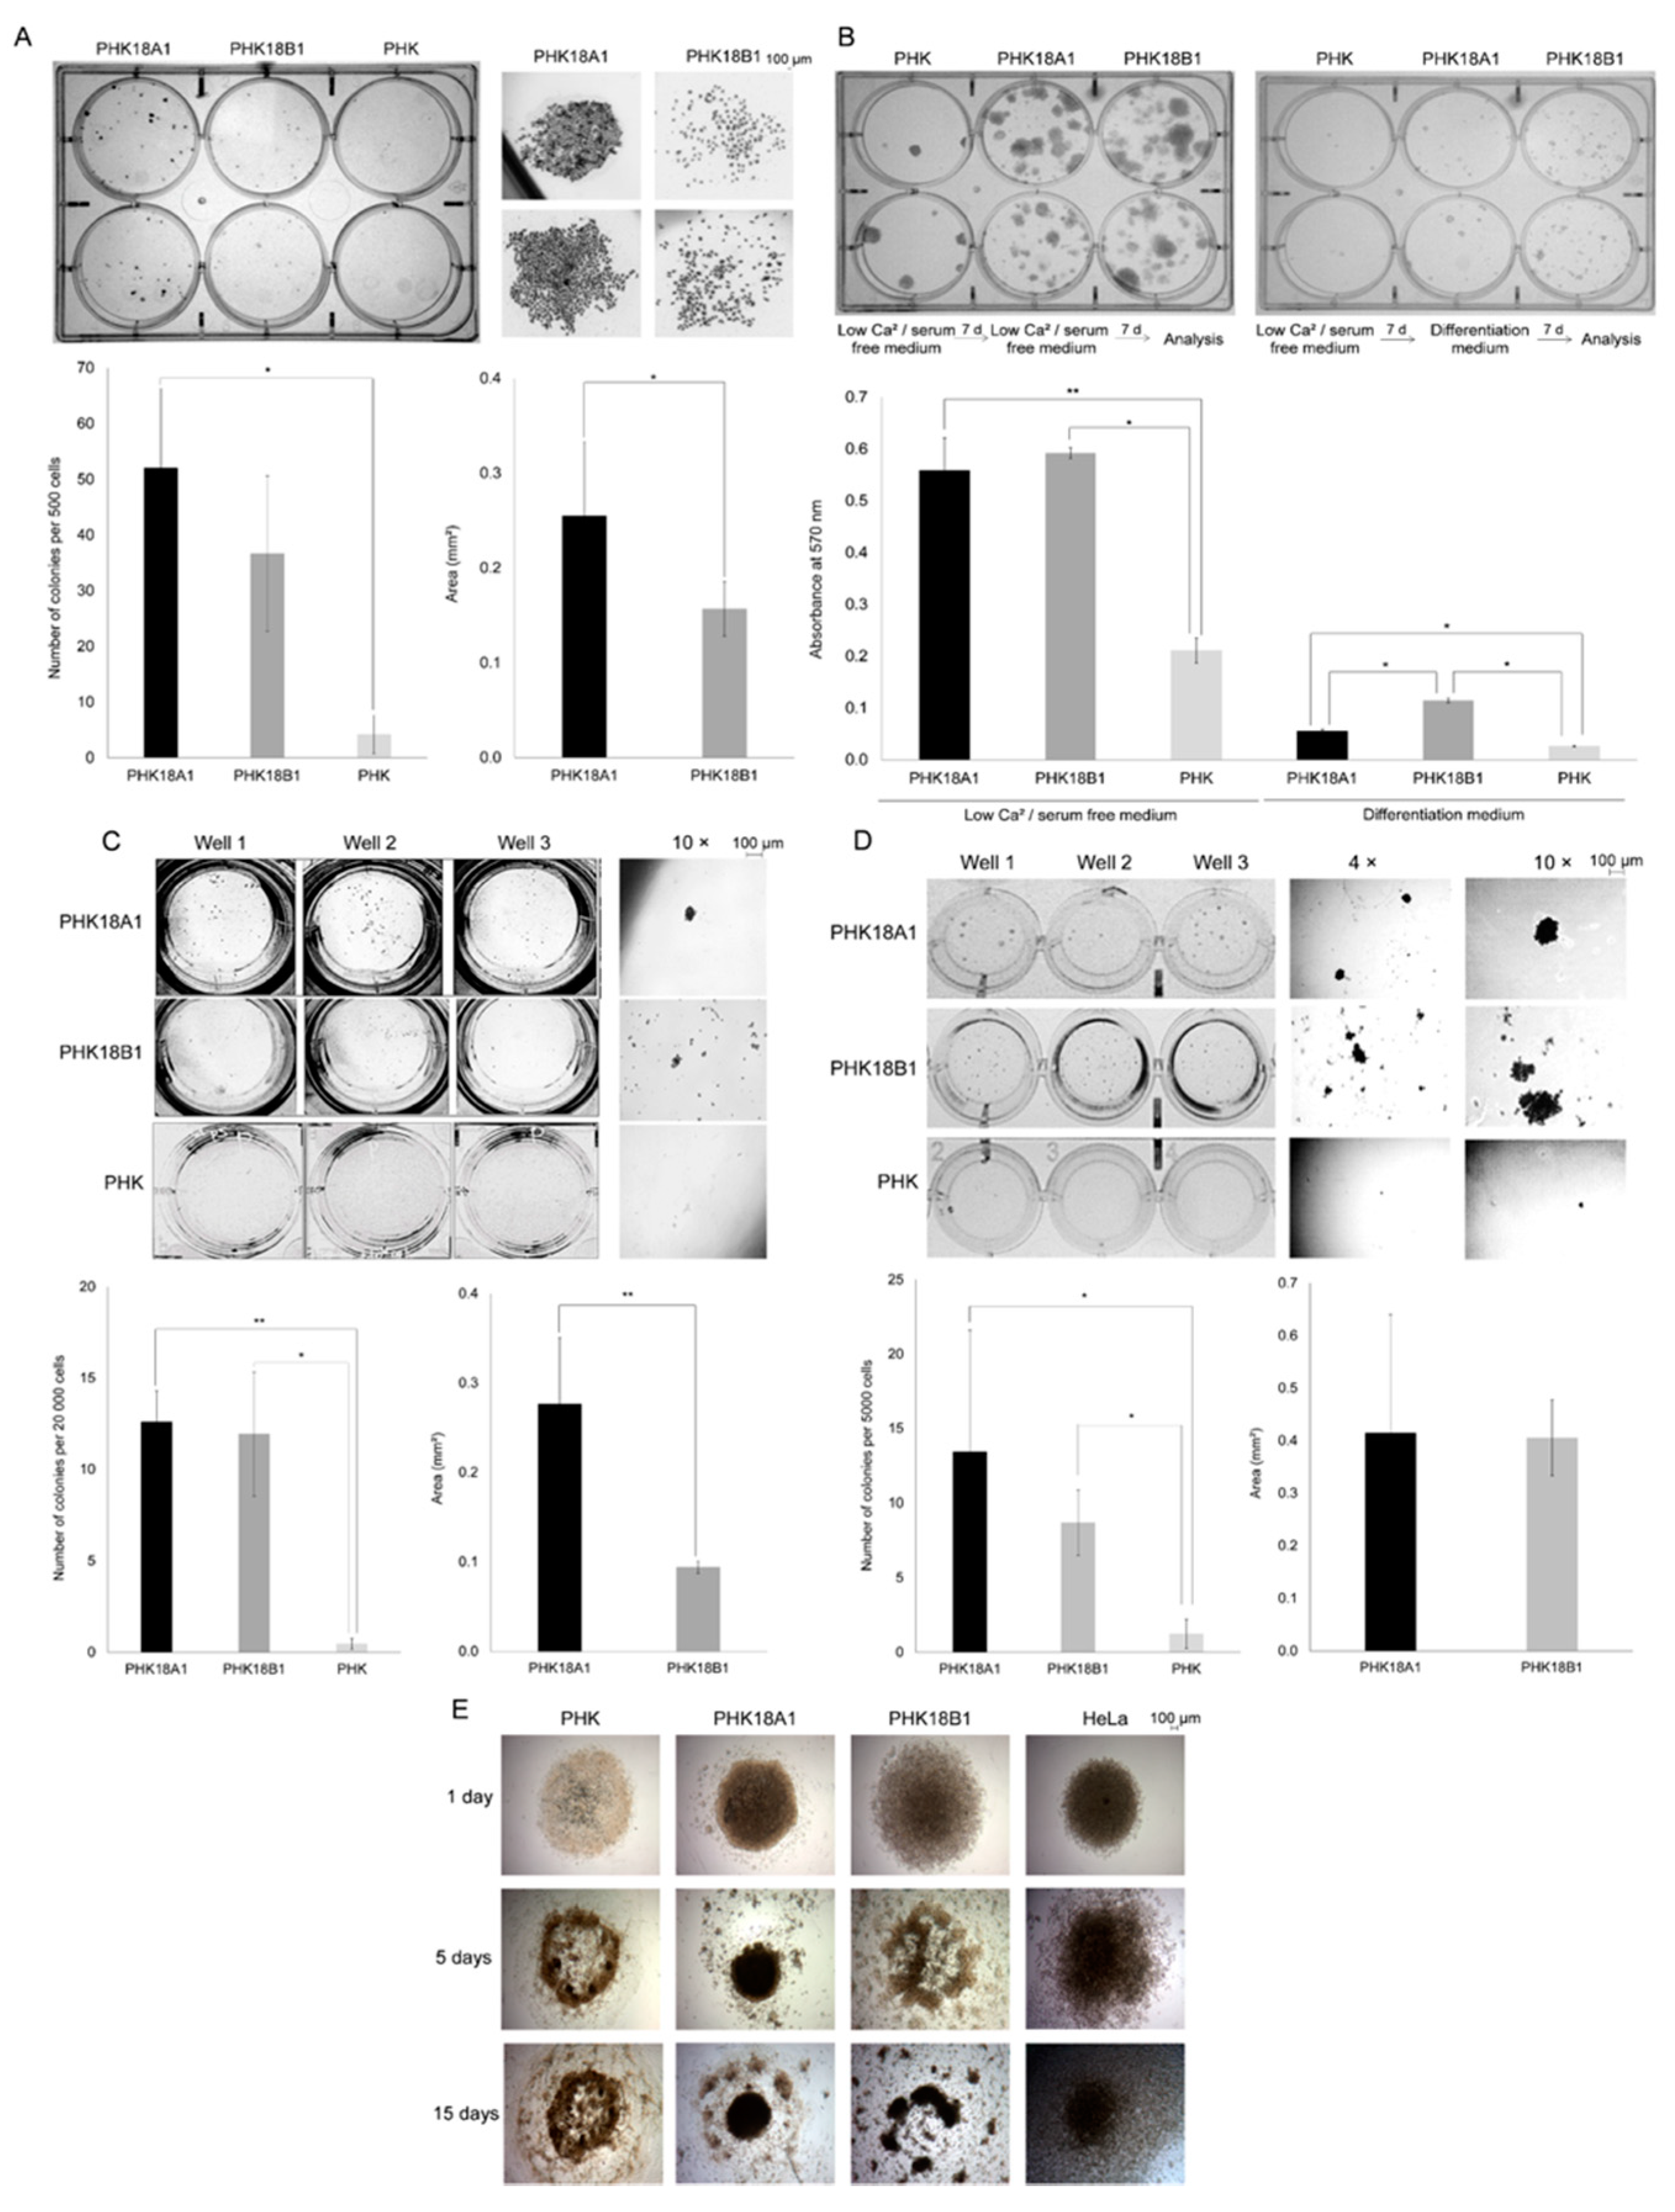
3.5. PHK18A1 and PHK18B1 Differ in Colony Formation Ability in Monolayer Cultures
3.6. PHK18A1 and PHK18B1 Differ in the Ability to form Colonies in 3D Cultures
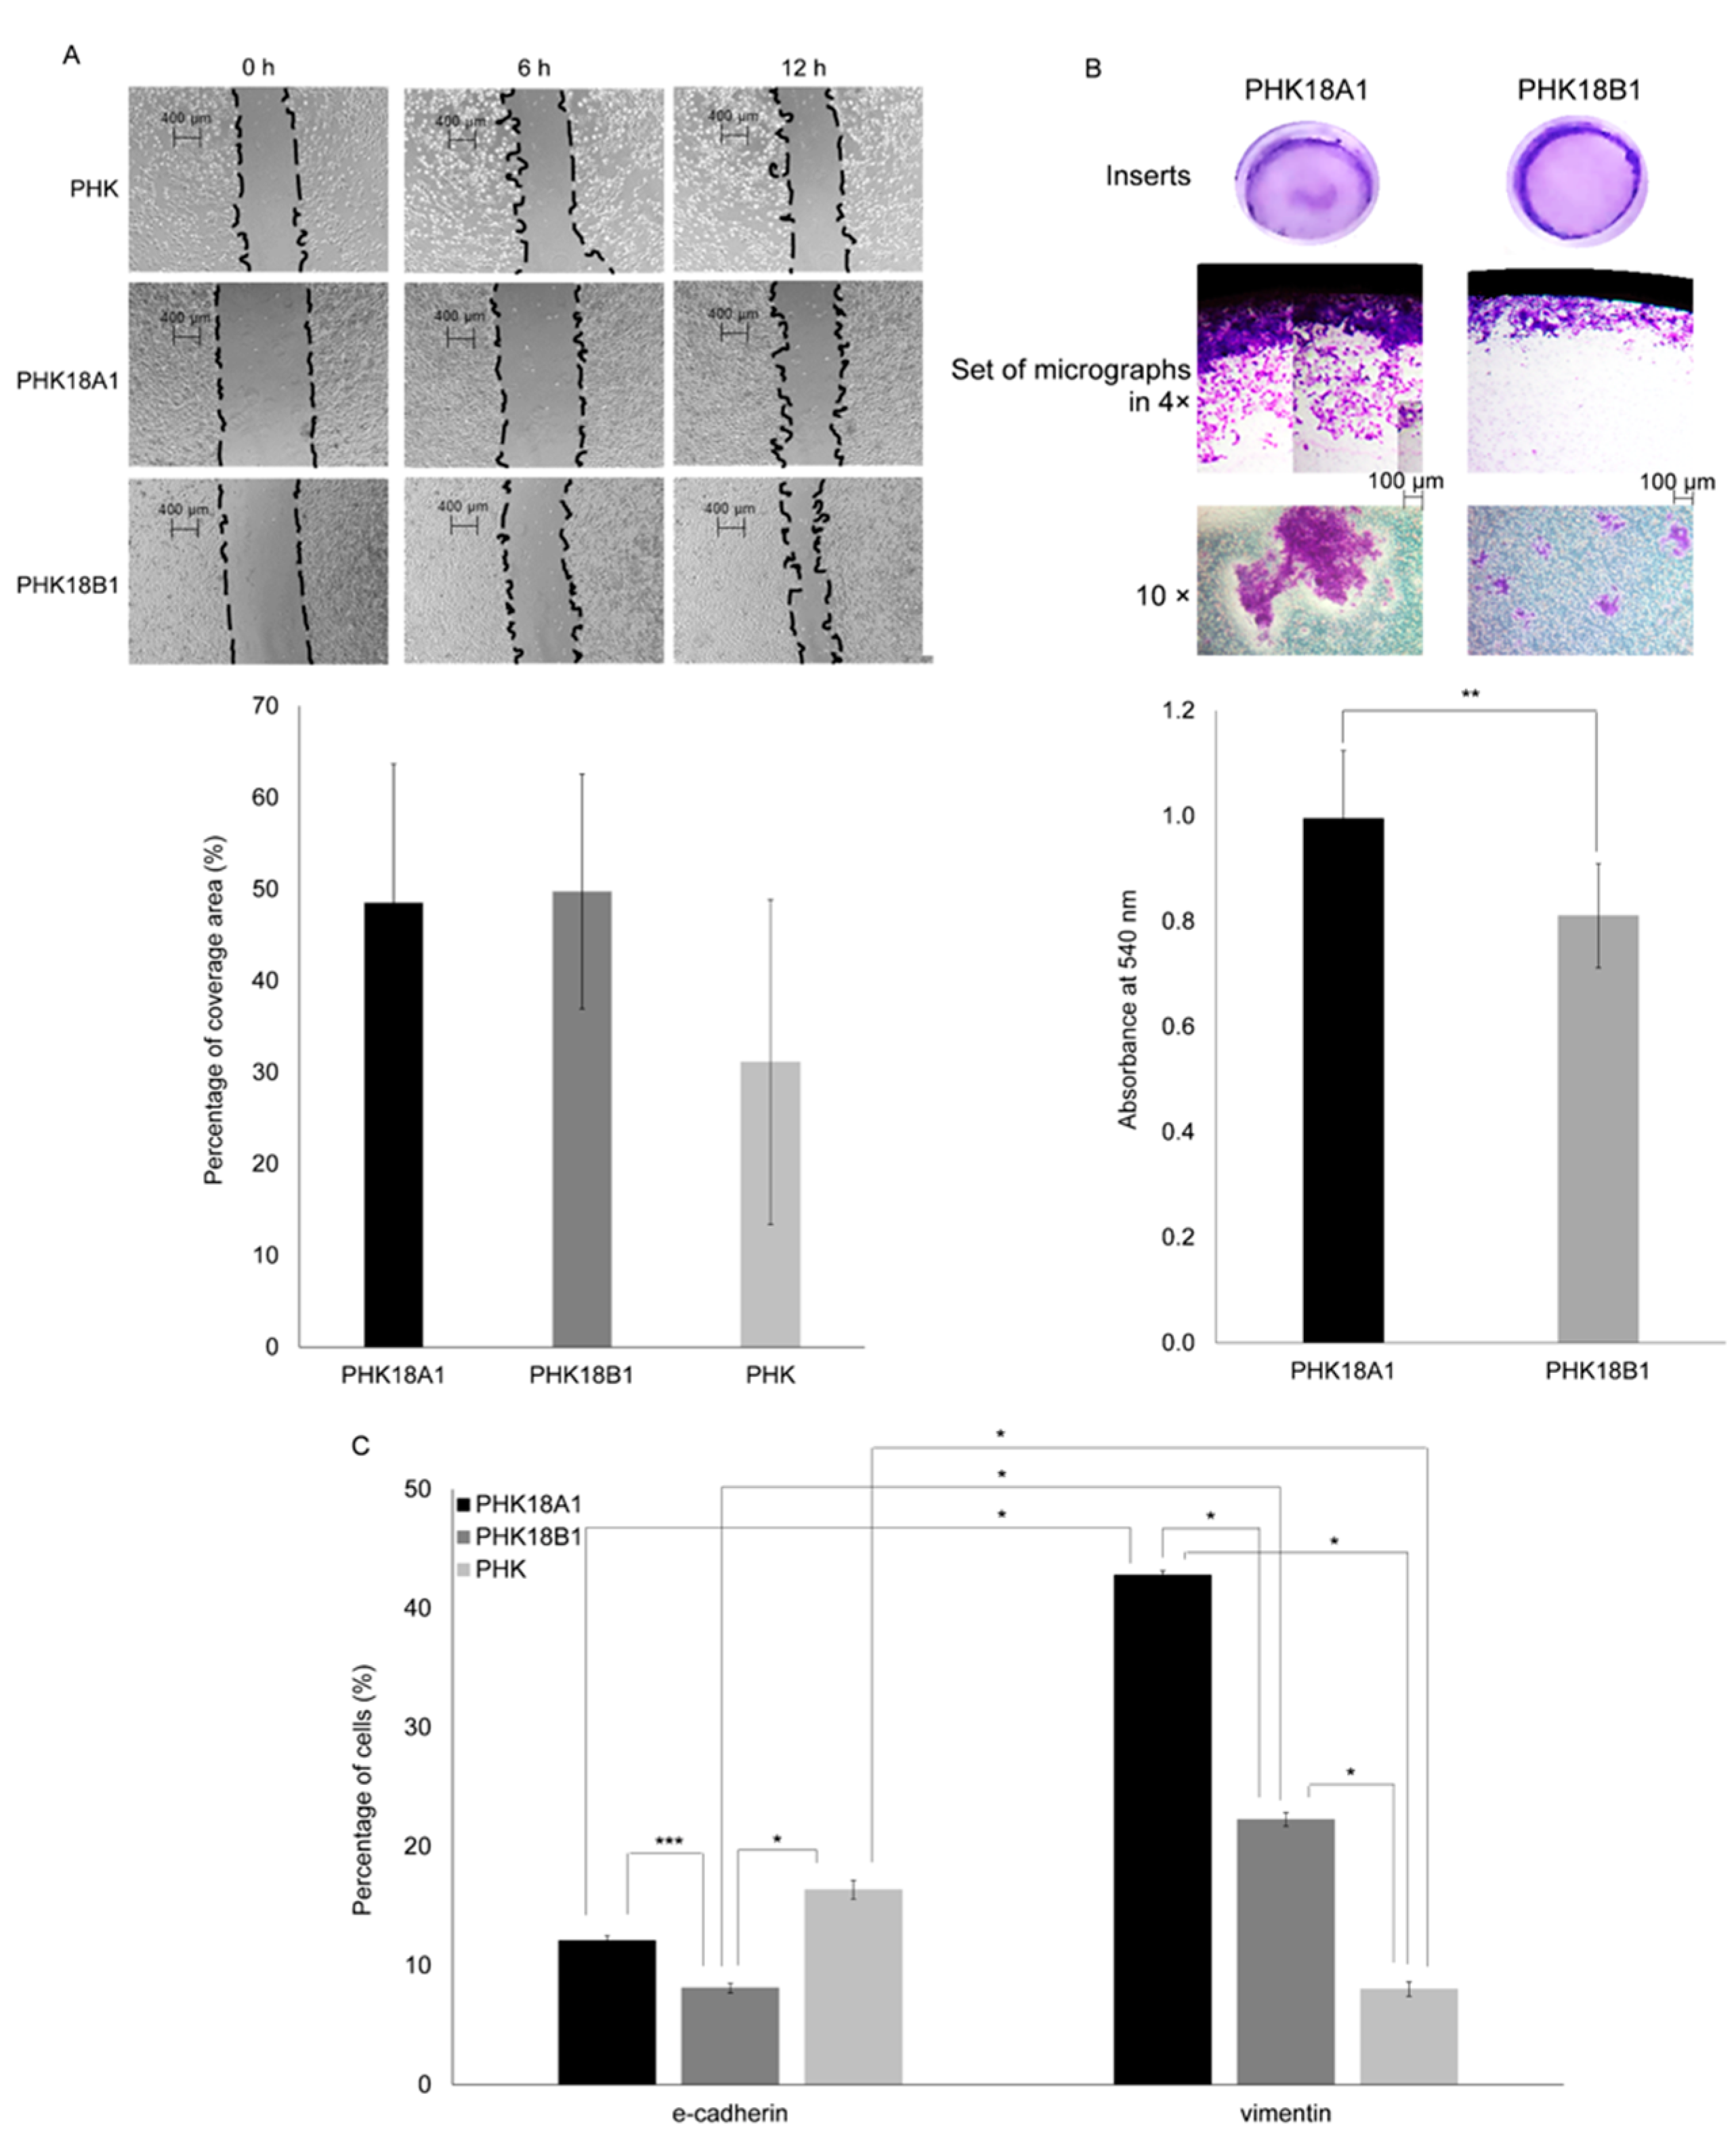
3.7. PHK18A1 and PHK18B1 Differ in Invasion but Not in Migration Ability
3.8. PHK18A1 and PHK18B1 Spheroids Differ in Epithelial–Mesenchymal Transition (EMT) Phenotype
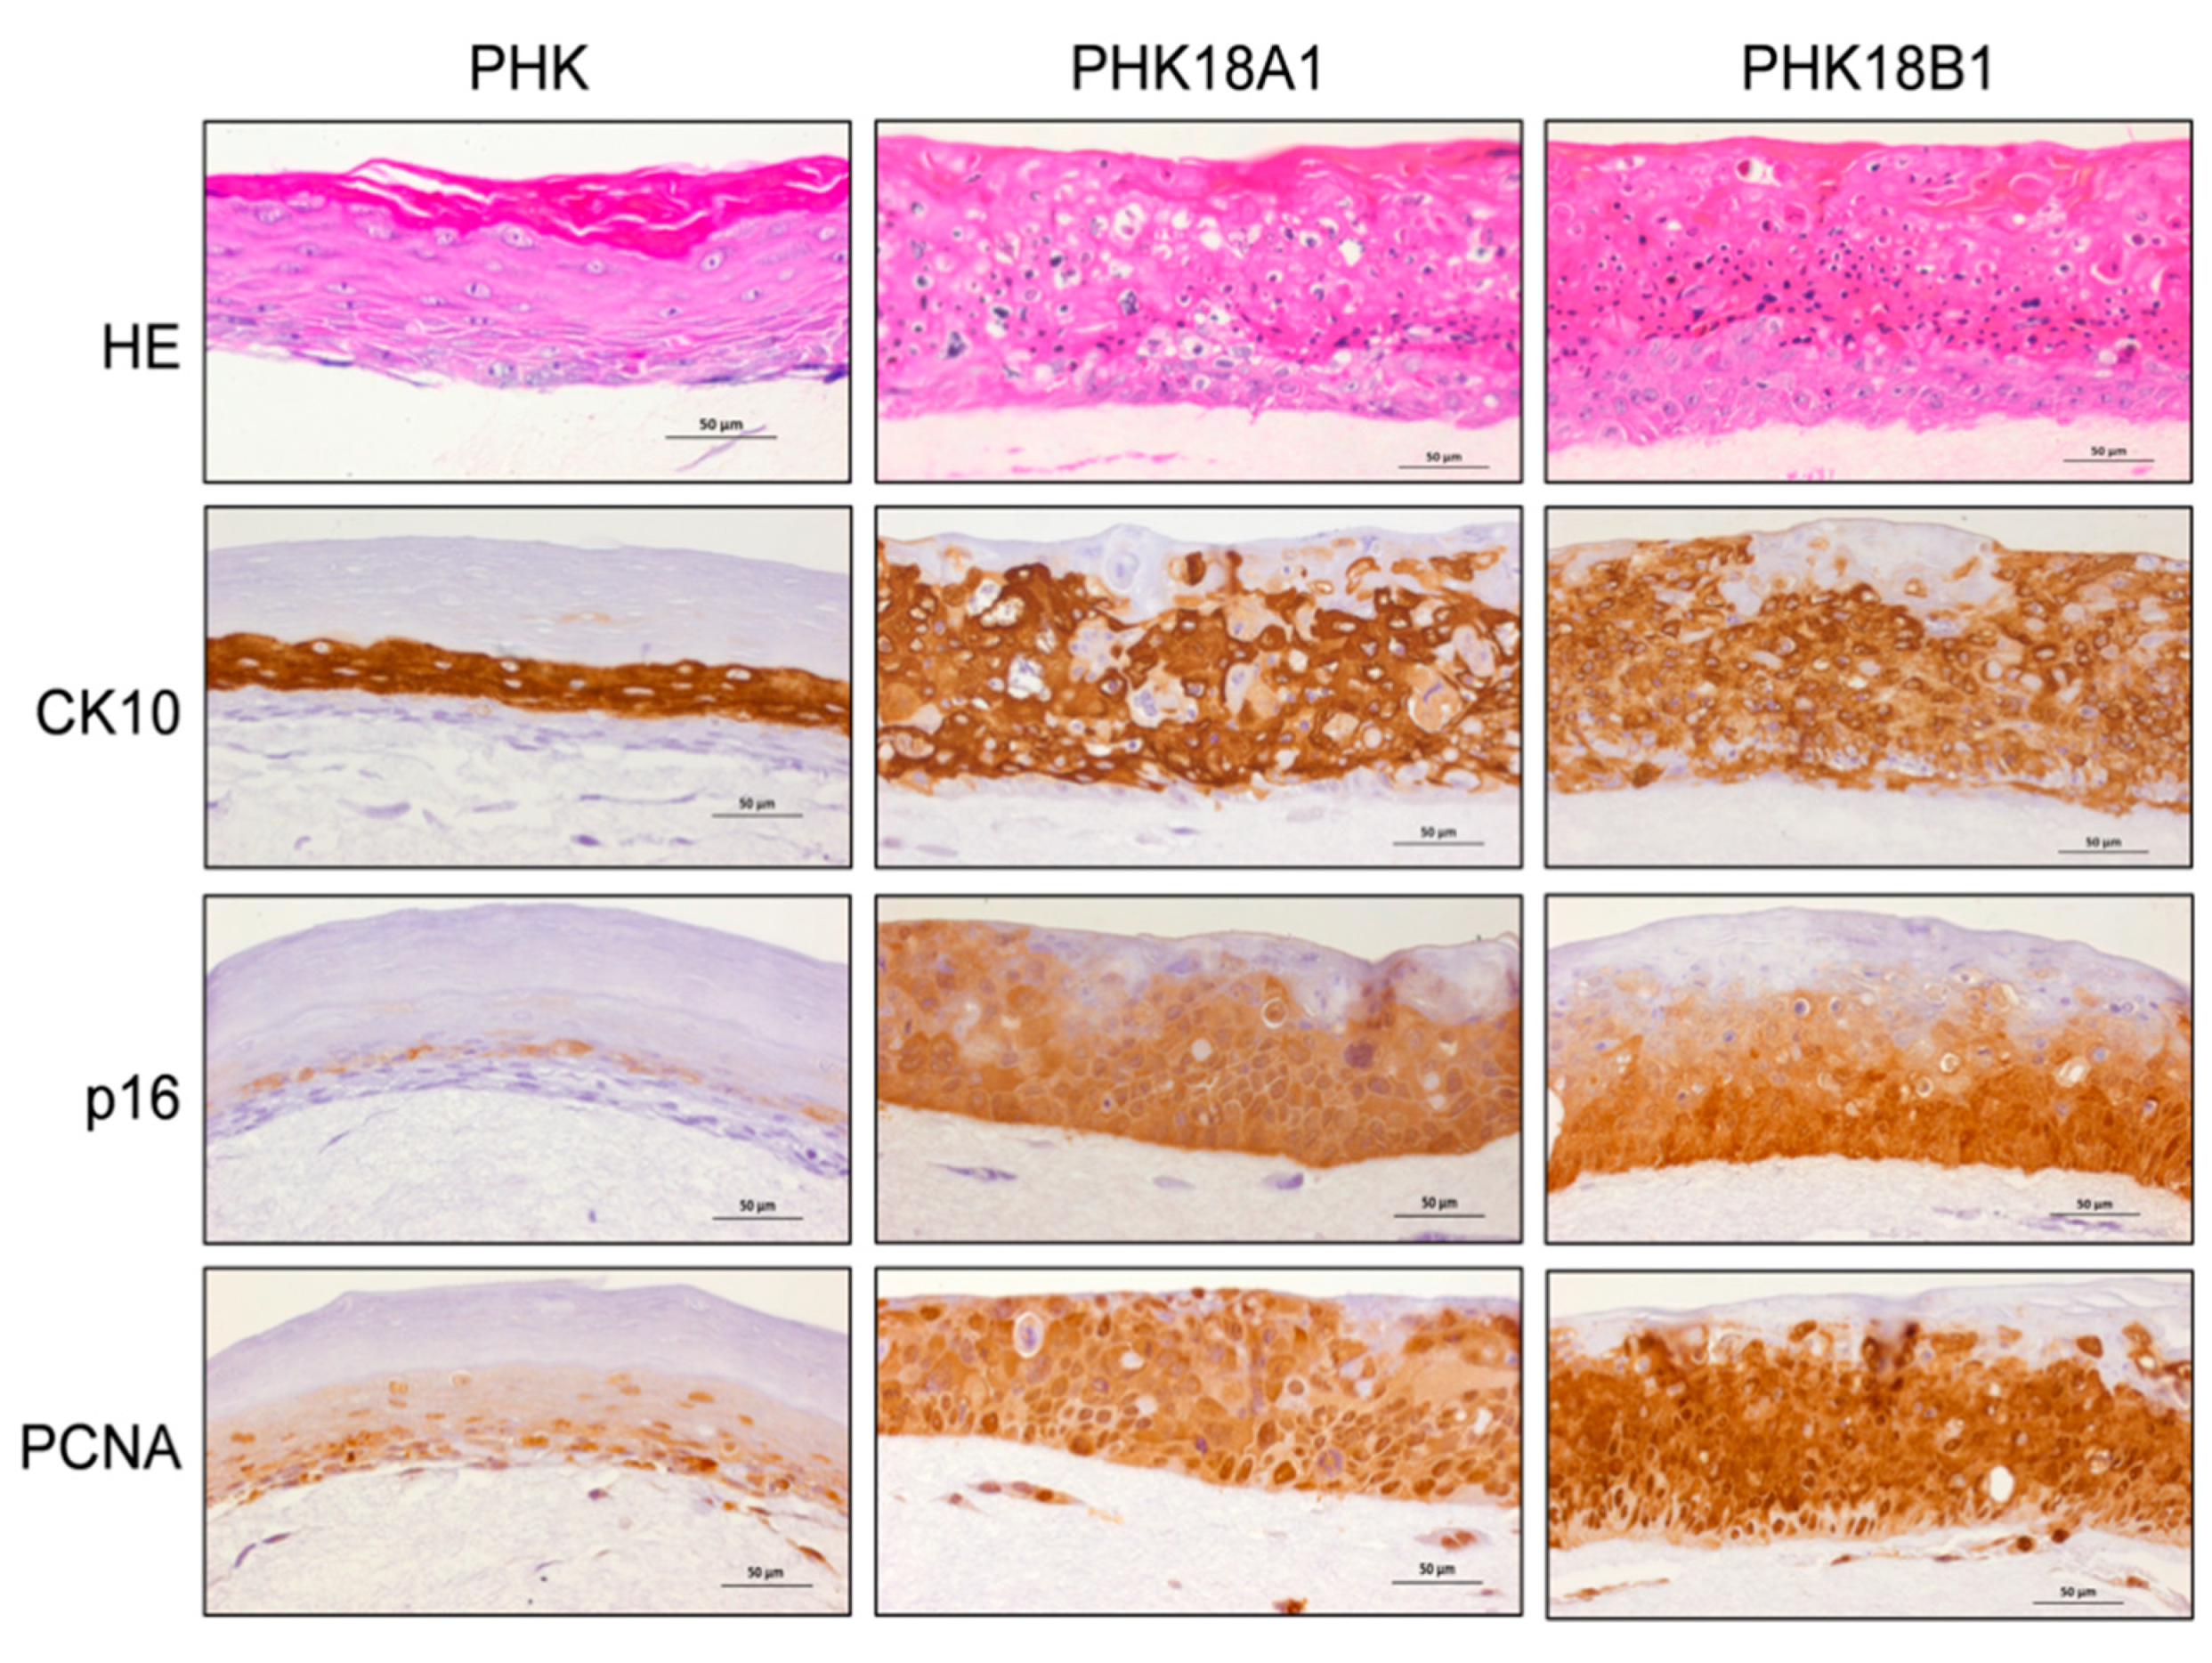
3.9. PHK18A1 and PHK18B1 Form Similar Epithelia in Raft Cultures
4. Discussion
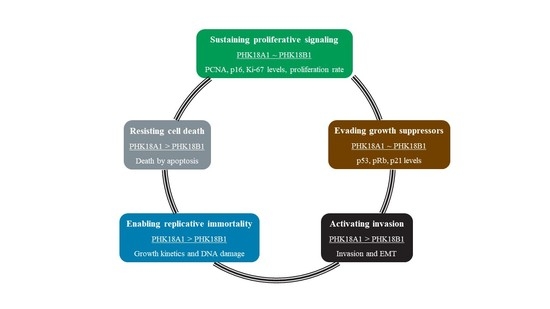
5. Conclusions
Supplementary Materials
Author Contributions
Funding
Institutional Review Board Statement
Informed Consent Statement
Data Availability Statement
Acknowledgments
Conflicts of Interest
References
- de Sanjosé, S.; Serrano, B.; Tous, S.; Alejo, M.; Lloveras, B.; Quirós, B.; Clavero, O.; Vidal, A.; Ferrándiz-Pulido, C.; Pavón, M.Á.; et al. Burden of Human Papillomavirus (HPV)-Related Cancers Attributable to HPVs 6/11/16/18/31/33/45/52 and 58. JNCI Cancer Spectr. 2019, 2. [Google Scholar] [CrossRef] [PubMed] [Green Version]
- Ong, C.K.; Chan, S.Y.; Campo, M.S.; Fujinaga, K.; Mavromara-Nazos, P.; Labropoulou, V.; Pfister, H.; Tay, S.K.; ter Meulen, J.; Villa, L.L.; et al. Evolution of human papillomavirus type 18: An ancient phylogenetic root in Africa and intratype diver-sity reflect coevolution with human ethnic groups. J. Virol. 1993, 67, 6424–6431. [Google Scholar] [CrossRef] [PubMed] [Green Version]
- Chen, Z.; Schiffman, M.; Herrero, R.; DeSalle, R.; Anastos, K.; Segondy, M.; Sahasrabuddhe, V.V.; Gravitt, P.E.; Hsing, A.W.; Burk, R.D. Evolution and taxonomic classification of alphapapillomavirus 7 complete genomes: HPV18, HPV39, HPV45, HPV59, HPV68 and HPV70. PLoS ONE 2013, 8, e72565. [Google Scholar] [CrossRef] [PubMed]
- Chen, A.A.; Gheit, T.; Franceschi, S.; Tommasino, M.; Clifford, G.M.; IARC HPV Variant Study Group. Human Papilloma-virus 18 Genetic Variation and Cervical Cancer Risk Worldwide. J. Virol. 2015, 89, 10680–10687. [Google Scholar] [CrossRef] [PubMed] [Green Version]
- Berumen, J.; Ordoñez, R.M.; Lazcano, E.; Salmeron, J.; Galvan, S.C.; Estrada, R.A.; Yunes, E.; Garcia-Carranca, A.; Gonzalez-Lira, G.; La Campa, A.M.-D. Asian-American variants of human papillomavirus 16 and risk for cervical cancer: A case-control study. J. Natl. Cancer Inst. 2001, 93, 1325–1330. [Google Scholar] [CrossRef]
- Sichero, L.; Ferreira, S.; Trottier, H.; Duarte-Franco, E.; Ferenczy, A.; Franco, E.L.; Villa, L.L. High grade cervical lesions are caused preferentially by non-European variants of HPVs 16 and 18. Int. J. Cancer 2007, 120, 1763–1768. [Google Scholar] [CrossRef] [PubMed]
- Richard, C.; Lanner, C.; Naryzhny, S.N.; Sherman, L.; Lee, H.; Lambert, P.F.; Zehbe, I. The immortalizing and transforming ability of two common human papillomavirus 16 E6 variants with different prevalences in cervical cancer. Oncogene 2010, 29, 3435–3445. [Google Scholar] [CrossRef] [Green Version]
- Sichero, L.; Sobrinho, J.S.; Villa, L.L. Oncogenic potential diverge among human papillomavirus type 16 natural variants. Virology 2012, 432, 127–132. [Google Scholar] [CrossRef]
- Lizano, M.; García-Carrancá, A. Molecular variants of human papillomaviruses types 16, 18, and 45 in tumors of the uterine cervix in Mexico. Gac. Med. Mex. 1997, 133, 43–48. [Google Scholar] [PubMed]
- Pista, A.; Oliveira, A.; Barateiro, A.; Costa, H.; Verdasca, N.; Paixão, M.T. Molecular variants of human papillomavirus type 16 and 18 and risk for cervical neoplasia in Portugal. J. Med. Virol. 2007, 79, 1889–1897. [Google Scholar] [CrossRef]
- Xi, L.F.; Koutsky, L.A.; Hildesheim, A.; Galloway, D.A.; Wheeler, C.M.; Winer, R.L.; Ho, J.; Kiviat, N.B. Risk for high-grade cervical intraepithelial neoplasia associated with variants of human papillomavirus types 16 and 18. Cancer Epidemiol. Biomark. Prev. 2007, 16, 4–10. [Google Scholar] [CrossRef] [Green Version]
- Pérez, S.; Cid, A.; Iñarrea, A.; Pato, M.; Lamas, M.J.; Couso, B.; Gil, M.; Alvarez, M.J.; Rey, S.; López-Miragaya, I.; et al. Preva-lence of HPV 16 and HPV 18 lineages in Galicia, Spain. PLoS ONE 2014, 9, e104678. [Google Scholar] [CrossRef] [Green Version]
- Schiffman, M.; Rodriguez, A.C.; Chen, Z.; Wacholder, S.; Herrero, R.; Hildesheim, A.; Desalle, R.; Befano, B.; Yu, K.; Safaeian, M.; et al. A population-based prospective study of carcinogenic human papillomavirus variant lineages, viral persistence, and cervical neoplasia. Cancer Res. 2010, 70, 3159–3169. [Google Scholar] [CrossRef] [PubMed] [Green Version]
- Arias-Pulido, H.; Peyton, C.L.; Torrez-Martínez, N.; Anderson, D.N.; Wheeler, C.M. Human papillomavirus type 18 variant lineages in United States populations characterized by sequence analysis of LCR-E6, E2, and L1 regions. Virology 2005, 338, 22–34. [Google Scholar] [CrossRef] [PubMed] [Green Version]
- Burk, R.D.; Terai, M.; Gravitt, P.E.; Brinton, L.A.; Kurman, R.J.; Barnes, W.A.; Greenberg, M.D.; Hadjimichael, O.C.; Fu, L.; McGowan, L.; et al. Distribution of human papillomavirus types 16 and 18 variants in squamous cell carcinomas and ade-nocarcinomas of the cervix. Cancer Res. 2003, 63, 7215–7220. [Google Scholar] [PubMed]
- De Boer, M.A.; Peters, L.A.; Aziz, M.F.; Siregar, B.; Cornain, S.; Vrede, M.A.; Jordanova, E.S.; Fleuren, G.J. Human papillo-mavirus type 18 variants: Histopathology and E6/E7 polymorphisms in three countries. Int. J. Cancer 2005, 114, 422–425. [Google Scholar] [CrossRef] [PubMed]
- Münger, K.; Phelps, W.C.; Bubb, V.; Howley, P.M.; Schlegel, R. The E6 and E7 genes of the human papillomavirus type 16 together are necessary and sufficient for transformation of primary human keratinocytes. J. Virol. 1989, 63, 4417–4421. [Google Scholar] [CrossRef] [Green Version]
- Pim, D.; Banks, L. Interaction of viral oncoproteins with cellular target molecules: Infection with high-risk vs low-risk hu-man papillomaviruses. APMIS 2010, 118, 471–493. [Google Scholar] [CrossRef]
- Blanton, R.A.; Perez-Reyes, N.; Merrick, D.T.; McDougall, J.K. Epithelial cells immortalized by human papillomaviruses have premalignant characteristics in organotypic culture. Am. J. Pathol. 1991, 138, 673–685. [Google Scholar]
- Steenbergen, R.D.; Parker, J.N.; Isern, S.; Snijders, P.J.; Walboomers, J.M.; Meijer, C.J.; Broker, T.R.; Chow, L.T. Viral E6-E7 transcription in the basal layer of organotypic cultures without apparent p21cip1 protein precedes immortalization of hu-man papillomavirus type 16- and 18-transfected human keratinocytes. J. Virol. 1998, 72, 749–757. [Google Scholar] [CrossRef] [Green Version]
- Sichero, L.; Franco, E.L.; Villa, L.L. Different P105 promoter activities among natural variants of human papillomavirus type 18. J. Infect. Dis. 2005, 191, 739–742. [Google Scholar] [CrossRef] [Green Version]
- López-Saavedra, A.; González-Maya, L.; Ponce-de-León, S.; García-Carrancá, A.; Mohar, A.; Lizano, M. Functional implica-tion of sequence variation in the long control region and E2 gene among human papillomavirus type 18 variants. Arch. Virol. 2009, 154, 747–754. [Google Scholar] [CrossRef]
- De La Cruz-Hernández, E.; García-Carrancá, A.; Mohar-Betancourt, A.; Dueñas-González, A.; Contreras-Paredes, A.; Pérez-Cardenas, E.; Herrera-Goepfert, R.; Lizano-Soberón, M. Differential splicing of E6 within human papillomavirus type 18 variants and functional consequences. J. Gen. Virol. 2005, 86, 2459–2468. [Google Scholar] [CrossRef] [PubMed] [Green Version]
- Vazquez-Vega, S.; Sanchez-Suarez, L.P.; Andrade-Cruz, R.; Castellanos-Juarez, E.; Contreras-Paredes, A.; Lizano-Soberon, M.; Garcia-Carranca, A.; Benitez Bribiesca, L. Regulation of p14ARF expression by HPV-18 E6 variants. J. Med. Virol. 2013, 85, 1215–1221. [Google Scholar] [CrossRef] [PubMed]
- Contreras-Paredes, A.; De la Cruz-Hernández, E.; Martínez-Ramírez, I.; Dueñas-González, A.; Lizano, M. E6 variants of human papillomavirus 18 differentially modulate the protein kinase B/phosphatidylinositol 3-kinase (akt/PI3K) signaling pathway. Virology 2009, 383, 78–85. [Google Scholar] [CrossRef] [PubMed] [Green Version]
- Boccardo, E.; Baldi, C.V.M.; Carvalho, A.F.; Rabachini, T.; Torres, C.; Barreta, L.A.; Brentani, H.; Villa, L.L. Expression of human papillomavirus type 16 E7 oncoprotein alters keratinocytes expression profile in response to tumor necrosis factor-α. Carcinogenesis 2010, 31, 521–531. [Google Scholar] [CrossRef] [Green Version]
- Livak, K.J.; Schmittgen, T.D. Analysis of relative gene expression data using real-time quantitative PCR and the 2(-Delta Delta C(T)) Method. Methods 2001, 25, 402–408. [Google Scholar] [CrossRef] [PubMed]
- Boccardo, E.; Noya, F.; Broker, T.R.; Chow, L.T.; Villa, L.L. HPV-18 confers resistance to TNF-α in organotypic cultures of human keratinocytes. Virology 2004, 328, 233–243. [Google Scholar] [CrossRef] [Green Version]
- Brant, A.C.; Menezes, A.N.; Felix, S.P.; de Almeida, L.M.; Sammeth, M.; Moreira, M.A. Characterization of HPV integration, viral gene expression and E6E7 alternative transcripts by RNA-Seq: A descriptive study in invasive cervical cancer. Genomics 2019, 111, 1853–1861. [Google Scholar] [CrossRef]
- Tang, S.; Tao, M.; McCoy, J.P.J.; Zheng, Z.M. The E7 oncoprotein is translated from spliced E6*I transcripts in high-risk human papillomavirus type 16- or type 18-positive cervical cancer cell lines via translation reinitiation. J. Virol. 2006, 80, 4249–4263. [Google Scholar] [CrossRef] [Green Version]
- Klaes, R.; Friedrich, T.; Spitkovsky, D.; Ridder, R.; Rudy, W.; Petry, U.; Dallenbach-Hellweg, G.; Schmidt, D.; Doeberitz, M.V.K. Overexpression of p16INK4A as a specific marker for dysplastic and neoplastic epithelial cells of the cervix uteri. Int. J. Cancer 2001, 92, 276–284. [Google Scholar] [CrossRef] [PubMed]
- Friedl, P.; Wolf, K. Tumour-cell invasion and migration: Diversity and escape mechanisms. Nat. Rev. Cancer 2003, 3, 362–374. [Google Scholar] [CrossRef]
- Termini, L.; Boccardo, E. Epithelial Organotypic Cultures: A Viable Model to Address Mechanisms of Carcinogenesis by Epitheliotropic Viruses. Curr. Top. Med. Chem. 2018, 18, 246–255. [Google Scholar] [CrossRef]
- Maddox, P.; Sasieni, P.; Szarewski, A.; Anderson, M.; Hanby, A. Differential expression of keratins 10, 17, and 19 in normal cervical epithelium, cervical intraepithelial neoplasia, and cervical carcinoma. J. Clin. Pathol. 1999, 52, 41–46. [Google Scholar] [CrossRef] [Green Version]
- Lace, M.J.; Anson, J.R.; Klingelhutz, A.J.; Lee, J.H.; Bossler, A.D.; Haugen, T.H.; Turek, L.P. Human papillomavirus (HPV) type 18 induces extended growth in primary human cervical, tonsillar, or foreskin keratinocytes more effectively than other high-risk mucosal HPVs. J. Virol. 2009, 83, 11784–11794. [Google Scholar] [CrossRef] [Green Version]
- Klingelhutz, A.J.; Foster, S.A.; McDougall, J.K. Telomerase activation by the E6 gene product of human papillomavirus type 16. Nature 1996, 380, 79–82. [Google Scholar] [CrossRef]
- Pim, D.; Banks, L. HPV-18 E6*I protein modulates the E6-directed degradation of p53 by binding to full-length HPV-18 E6. Oncogene 1999, 18, 7403–7408. [Google Scholar] [CrossRef] [PubMed] [Green Version]
- Estêvão, D.; Costa, N.R.; Gil da Costa, R.M.; Medeiros, R. Hallmarks of HPV carcinogenesis: The role of E6, E7 and E5 oncoproteins in cellular malignancy. Biochim. Biophys. Acta (BBA)-Gene Regul. Mech. 2019, 1862, 153–162. [Google Scholar] [CrossRef] [PubMed]
- DiMaio, D.; Liao, J.B. Human Papillomaviruses and Cervical Cancer. Adv. Virus Res. 2006, 66, 125–159. [Google Scholar]
- Kleeff, J.; Kornmann, M.; Sawhney, H.; Korc, M. Actinomycin D induces apoptosis and inhibits growth of pancreatic cancer cells. Int. J. Cancer 2000, 86, 399–407. [Google Scholar] [CrossRef]
- Wright, S.C.; Zhong, J.; Larrick, J.W. Inhibition of apoptosis as a mechanism of tumor promotion. FASEB J. 1994, 8, 654–660. [Google Scholar] [CrossRef]
- Rajendran, V.; Jain, M.V. In Vitro Tumorigenic Assay: Colony Forming Assay for Cancer Stem Cells. Methods Mol. Biol. 2018, 1692, 89–95. [Google Scholar] [CrossRef] [PubMed]
- Fragoso-Ontiveros, V.; María Alvarez-García, R.; Contreras-Paredes, A.; Vaca-Paniagua, F.; Alonso Herrera, L.; López-Camarillo, C.; Jacobo-Herrera, N.; Lizano-Soberón, M.; Pérez-Plasencia, C. Gene expression profiles induced by E6 from non-European HPV18 variants reveals a differential activation on cellular processes driving to carcinogenesis. Virology 2012, 432, 81–90. [Google Scholar] [CrossRef] [PubMed] [Green Version]
- Wang, Q.; Song, R.; Zhao, C.; Liu, H.; Yang, Y.; Gu, S.; Feng, D.; He, J. HPV16 E6 promotes cervical cancer cell migration and invasion by downregulation of NHERF1. Int. J. Cancer 2019, 144, 1619–1632. [Google Scholar] [CrossRef]
- Asadurian, Y.; Kurilin, H.; Lichtig, H.; Jackman, A.; Gonen, P.; Tommasino, M.; Zehbe, I.; Sherman, L. Activities of human papillomavirus 16 E6 natural variants in human keratinocytes. J. Med. Virol. 2007, 79, 1751–1760. [Google Scholar] [CrossRef] [PubMed]
- Cabeça, T.K.; de Mello Abreu, A.; Andrette, R.; de Souza Lino, V.; Morale, M.G.; Aguayo, F.; Termini, L.; Villa, L.L.; Lepique, A.P.; Boccardo, E. HPV-Mediated Resistance to TNF and TRAIL Is Characterized by Global Alterations in Apoptosis Regu-latory Factors, Dysregulation of Death Receptors, and Induction of ROS/RNS. Int. J. Mol. Sci. 2019, 20, 198. [Google Scholar] [CrossRef] [PubMed] [Green Version]
- McCance, D.J.; Kopan, R.; Fuchs, E.; Laimins, L.A. Human papillomavirus type 16 alters human epithelial cell differentiation in vitro. Proc. Natl. Acad. Sci. USA 1988, 85, 7169–7173. [Google Scholar] [CrossRef] [Green Version]
- Flores, E.R.; Allen-Hoffmann, B.L.; Lee, D.; Lambert, P.F. The human papillomavirus type 16 E7 oncogene is required for the productive stage of the viral life cycle. J. Virol. 2000, 74, 6622–6631. [Google Scholar] [CrossRef] [Green Version]
- Hudson, J.B.; Bedell, M.A.; McCance, D.J.; Laiminis, L.A. Immortalization and altered differentiation of human keratinocytes in vitro by the E6 and E7 open reading frames of human papillomavirus type 18. J. Virol. 1990, 64, 519–526. [Google Scholar] [CrossRef] [Green Version]
- Herfs, M.; Yamamoto, Y.; Laury, A.; Wang, X.; Nucci, M.R.; McLaughlin-Drubin, M.E.; Münger, K.; Feldman, S.; McKeon, F.D.; Xian, W.; et al. A discrete population of squamocolumnar junction cells implicated in the pathogenesis of cervical cancer. Proc. Natl. Acad. Sci. USA 2012, 109, 10516–10521. [Google Scholar] [CrossRef] [Green Version]


Publisher’s Note: MDPI stays neutral with regard to jurisdictional claims in published maps and institutional affiliations. |
© 2021 by the authors. Licensee MDPI, Basel, Switzerland. This article is an open access article distributed under the terms and conditions of the Creative Commons Attribution (CC BY) license (https://creativecommons.org/licenses/by/4.0/).
Share and Cite
Nunes, E.M.; Talpe-Nunes, V.; Sobrinho, J.S.; Ferreira, S.; Lino, V.d.S.; Termini, L.; Silva, G.Á.F.; Boccardo, E.; Villa, L.L.; Sichero, L. E6/E7 Functional Differences among Two Natural Human Papillomavirus 18 Variants in Human Keratinocytes. Viruses 2021, 13, 1114. https://0-doi-org.brum.beds.ac.uk/10.3390/v13061114
Nunes EM, Talpe-Nunes V, Sobrinho JS, Ferreira S, Lino VdS, Termini L, Silva GÁF, Boccardo E, Villa LL, Sichero L. E6/E7 Functional Differences among Two Natural Human Papillomavirus 18 Variants in Human Keratinocytes. Viruses. 2021; 13(6):1114. https://0-doi-org.brum.beds.ac.uk/10.3390/v13061114
Chicago/Turabian StyleNunes, Emily Montosa, Valéria Talpe-Nunes, João Simão Sobrinho, Silvaneide Ferreira, Vanesca de Souza Lino, Lara Termini, Gabriela Ávila Fernandes Silva, Enrique Boccardo, Luisa Lina Villa, and Laura Sichero. 2021. "E6/E7 Functional Differences among Two Natural Human Papillomavirus 18 Variants in Human Keratinocytes" Viruses 13, no. 6: 1114. https://0-doi-org.brum.beds.ac.uk/10.3390/v13061114