Prediction of Renal Acid Load in Adult Patients on Parenteral Nutrition

 ,
,
Abstract
: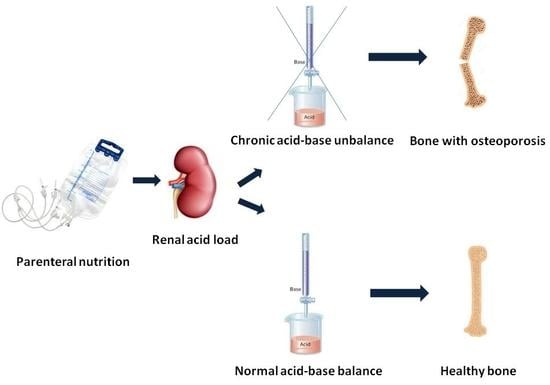
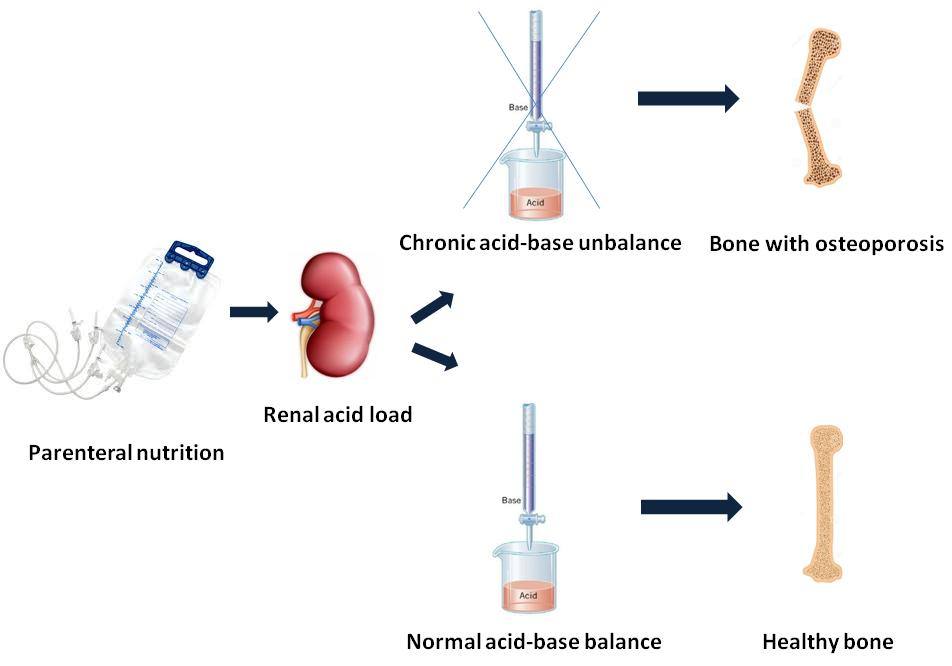
1. Introduction
2. Materials and Methods
3. Statistics
4. Results
4.1. Predictive Equations for the Titratable Acidity and the pH of TPN Mixtures
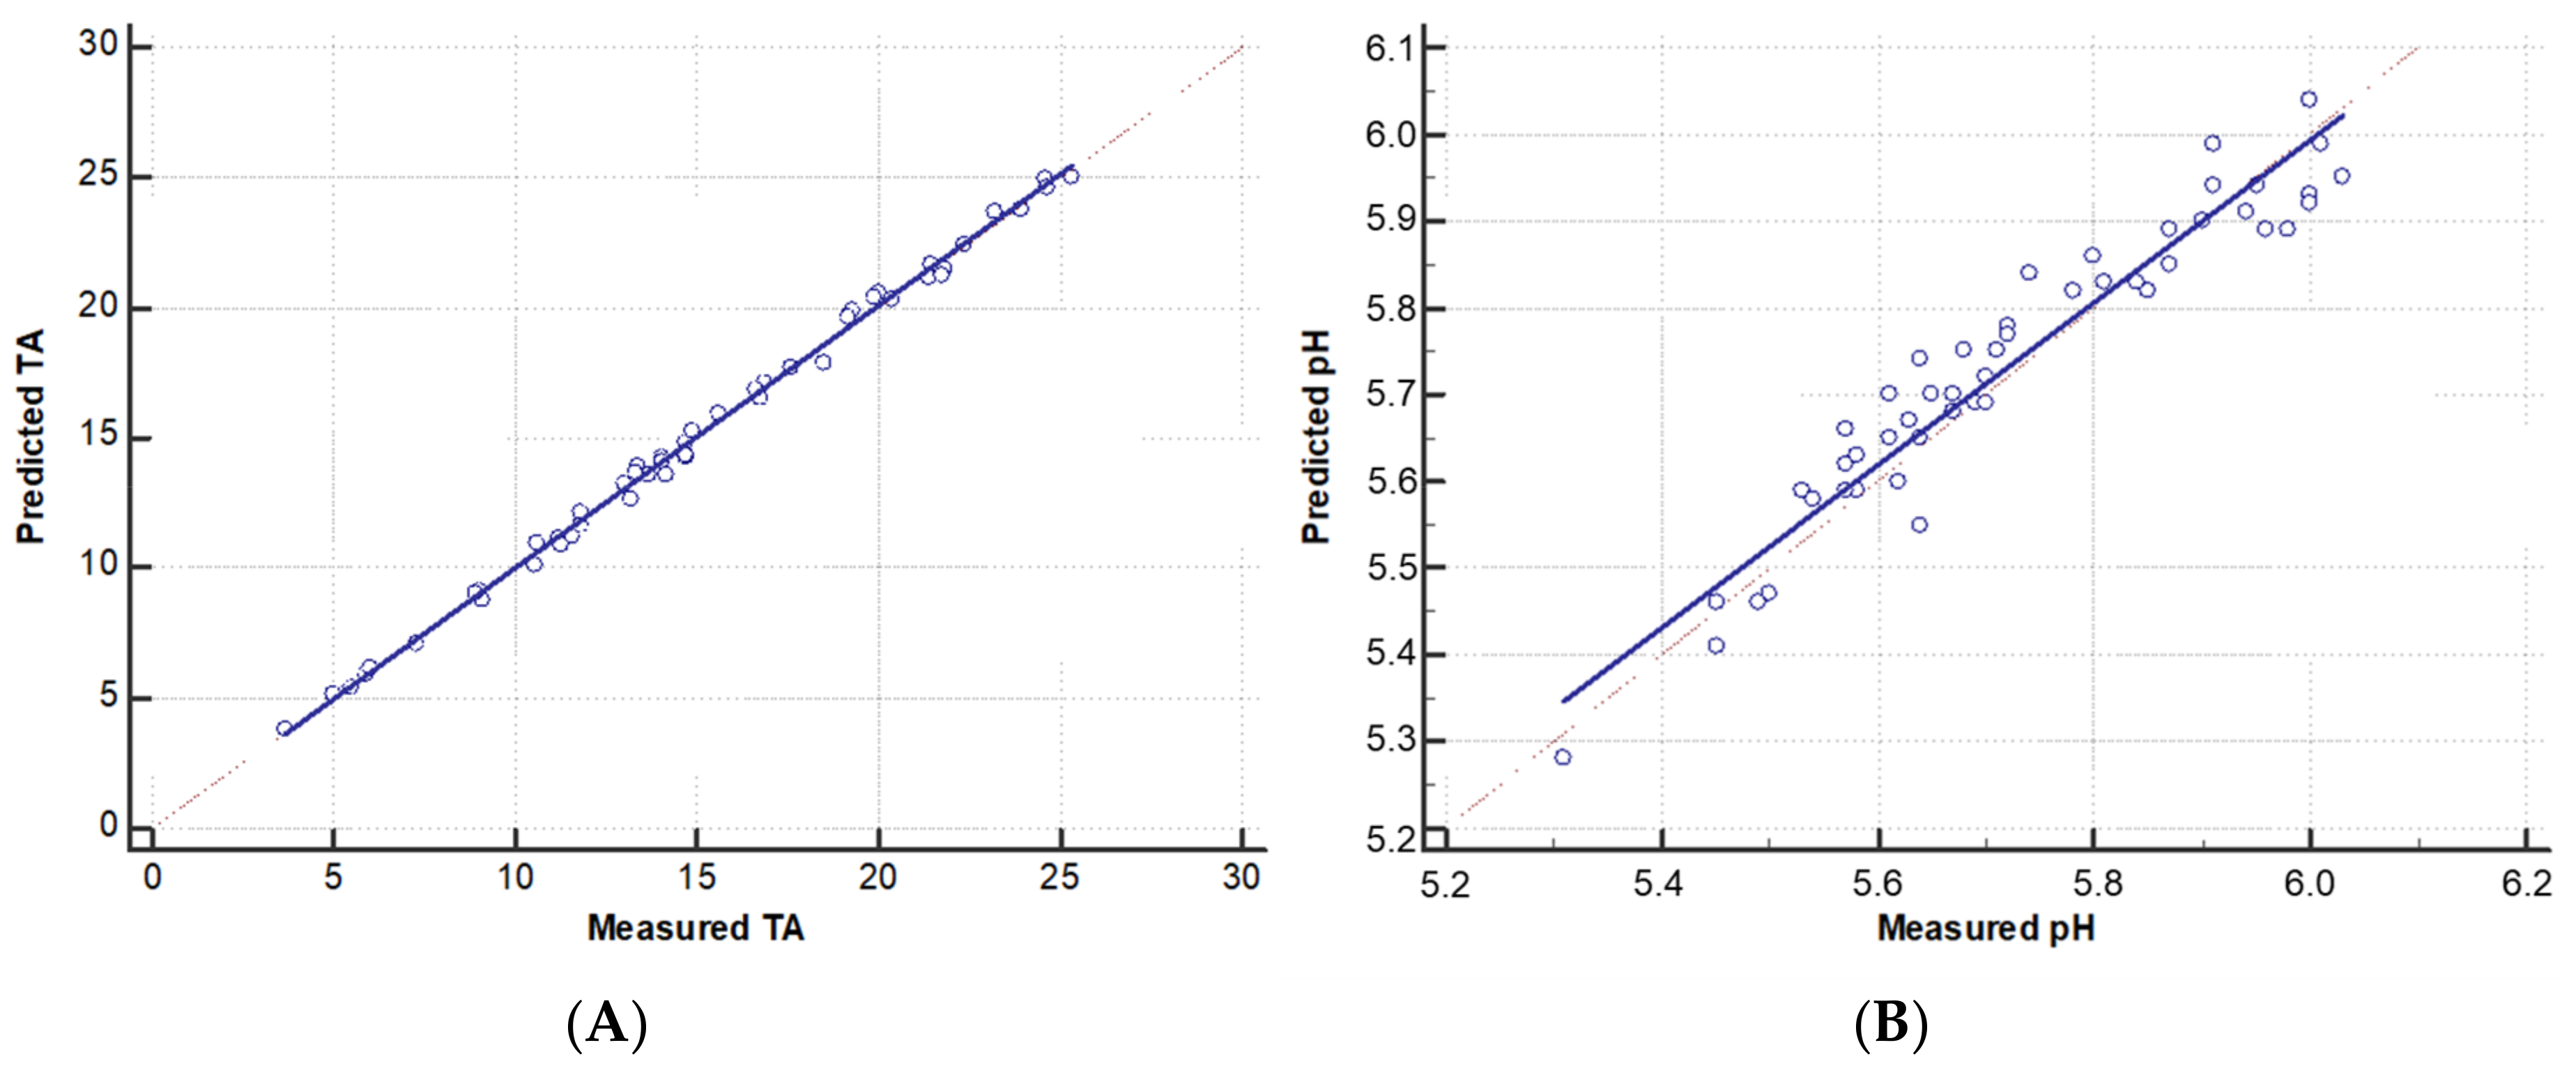
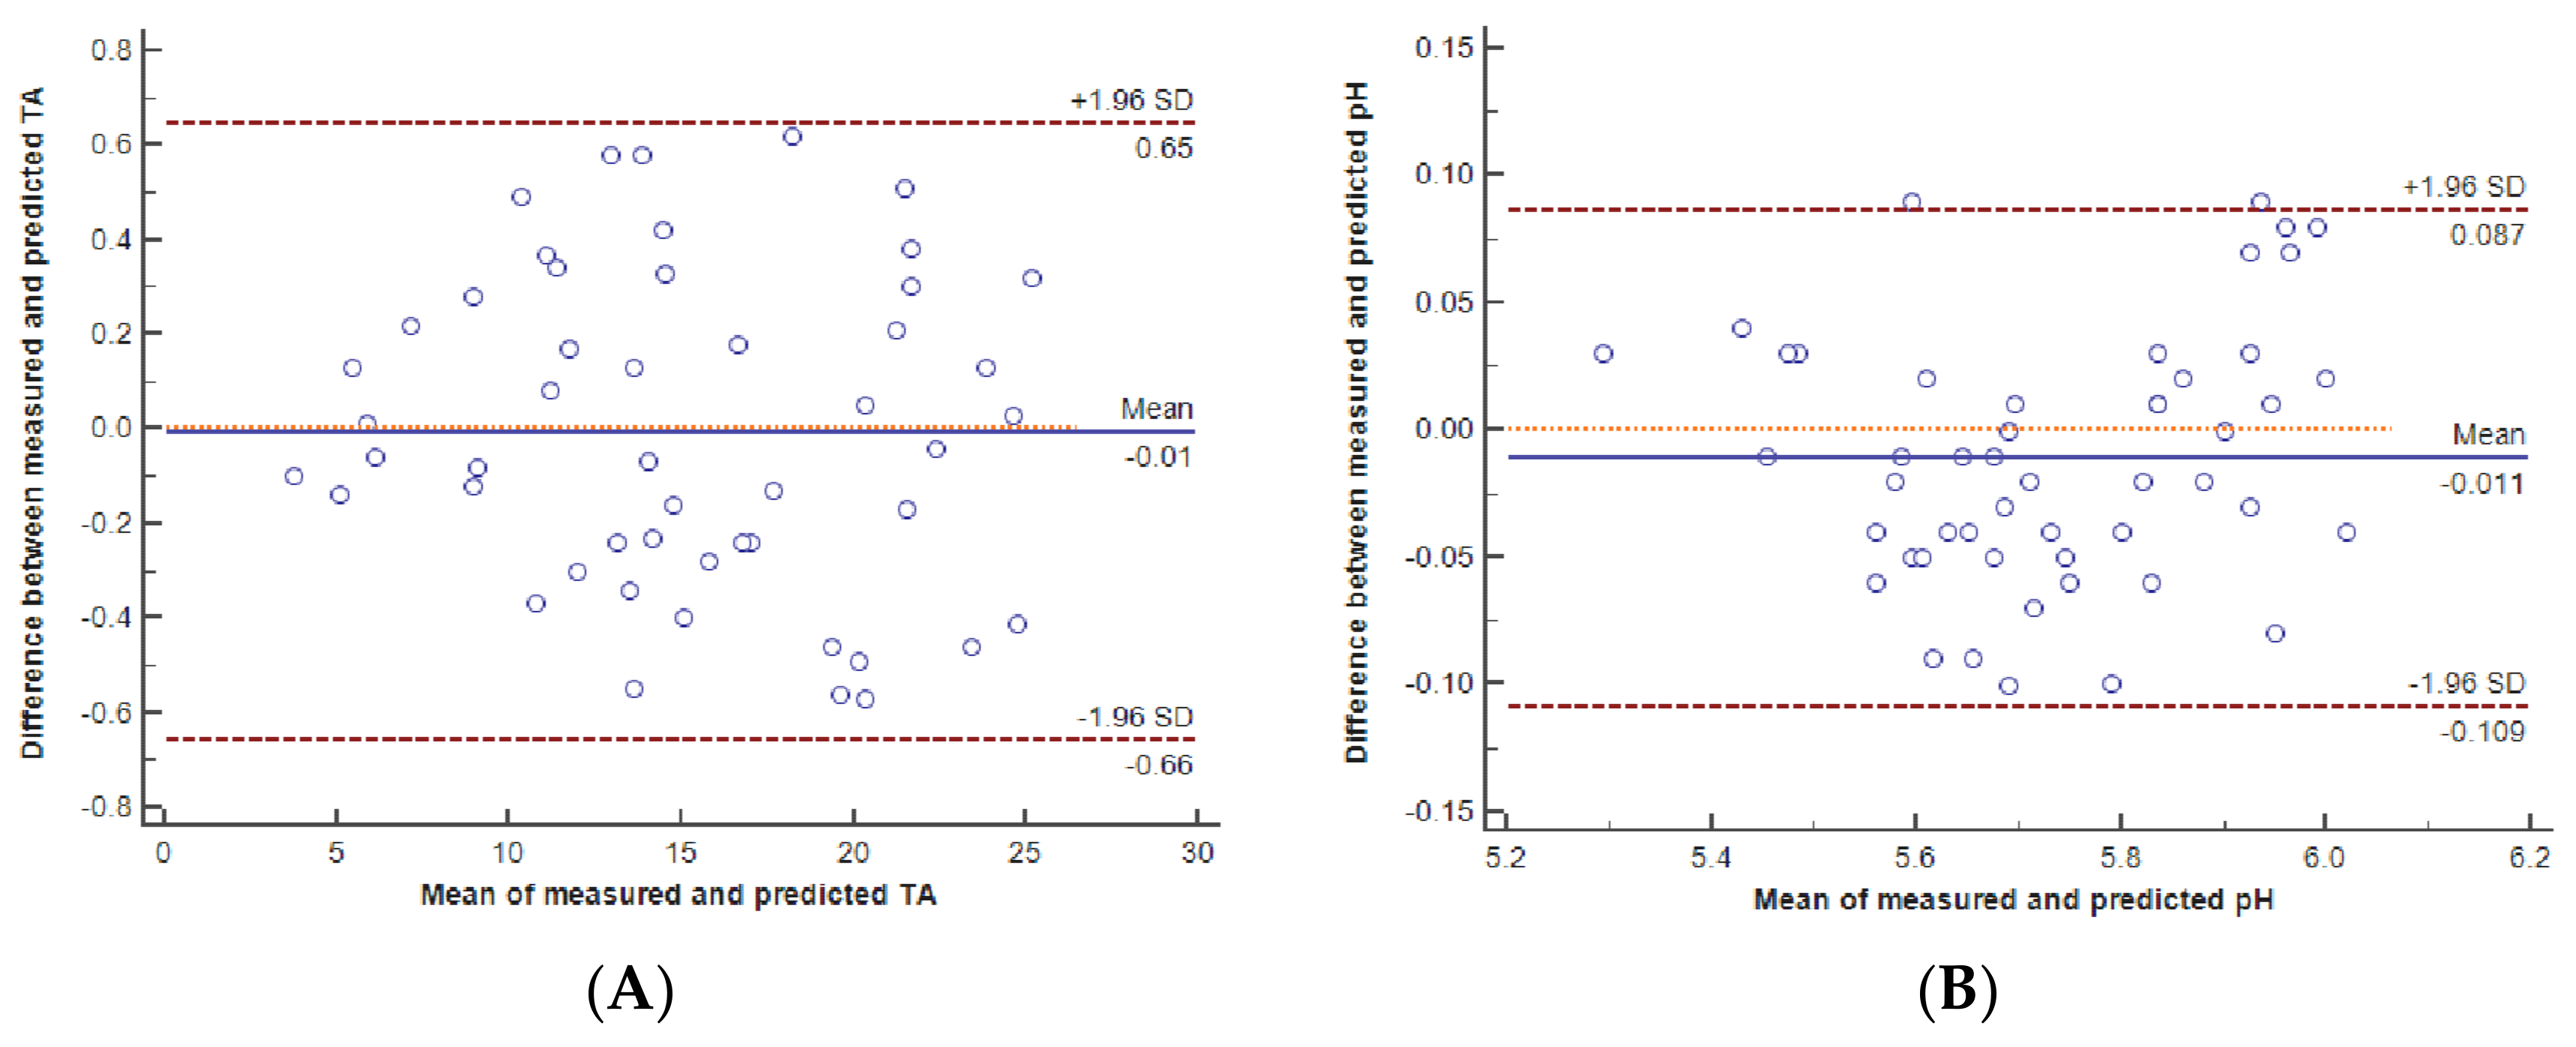
4.2. Comparison of Measured and Predicted Titratable Acidity and pH
4.3. Calculation of the Potential Metabolic Acid Load
4.4. Calculation of the Potential Total Acid Load
5. Discussion
6. Conclusions
Acknowledgments
Author Contributions
Conflicts of Interest
Abbreviations
| MA | Metabolic acidosis |
| MBD | Metabolic bone disease |
| PMAL | Potential metabolic acid load |
| PTAL | Potential total acid load |
| TA | Titratable acidity |
| PN | Parenteral nutrition |
References
- Jones, B.J.; Chopra, P.; Groning, J.; Deel-Smith, P. Acid-base disturbance during home parenteral nutrition—An observational cohort study. e-SPEN Eur. e-J. Clin. Nutr. Metab. 2011, 6, e31–e35. [Google Scholar] [CrossRef]
- Kato, K.; Sugiura, S.; Yano, K.; Fukuoka, T.; Itoh, A.; Nagino, M.; Nabeshima, T.; Yamada, K. The Latent Risk of Acidosis in Commercially Available Total Parenteral Nutrition (TPN) Products: A Randomized Clinical Trial in Postoperative Patients. J. Clin. Biochem. Nutr. 2009, 45, 68–73. [Google Scholar] [CrossRef] [PubMed]
- Cohen-Solal, M.; Baudoin, C.; Joly, F.; Vahedi, K.; D’Aoust, L.; De Vernejoul, M.C.; Messing, B. Osteoporosis in patients on long-term home parenteral nutrition: A longitudinal study. J. Bone Miner. Res. 2003, 18, 1989–1994. [Google Scholar] [CrossRef] [PubMed]
- Pironi, L.; Labate, A.M.; Pertkiewicz, M.; Przedlacki, J.; Tjellesen, L.; Staun, M.; De Francesco, A.; Gallenca, P.; Guglielmi, F.W.; Van Gossum, A.; et al. Prevalence of bone disease in patients on home parenteral nutrition. Clin. Nutr. 2002, 21, 289–295. [Google Scholar] [CrossRef] [PubMed]
- Buchman, A.L.; Moukarzel, A. Metabolic bone disease associated with total parenteral nutrition. Clin. Nutr. 2000, 19, 217–231. [Google Scholar] [CrossRef] [PubMed]
- Hamilton, C.; Seidner, D.L. Metabolic bone disease and parenteral nutrition. Curr. Gastroenterol. Rep. 2004, 6, 335–341. [Google Scholar] [CrossRef] [PubMed]
- Berkelhammer, C.H.; Wood, R.J.; Sitrin, M.D. Acetate and hypercalciuria during total parenteral nutrition. Am. J. Clin. Nutr. 1988, 48, 1482–1489. [Google Scholar] [CrossRef] [PubMed]
- Bengoa, J.M.; Sitrin, M.D.; Wood, R.J.; Rosenberg, I.H. Amino acid-induced hypercalciuria in patients on total parenteral nutrition. Am. J. Clin. Nutr. 1983, 38, 264–269. [Google Scholar] [CrossRef] [PubMed]
- Sugiura, S.; Inagaki, K.; Noda, Y.; Nagai, T.; Nabeshima, T. Acid load during total parenteral nutrition: Comparison of hydrochloric acid and acetic acid on plasma acid-base balance. Nutrition 2000, 16, 260–263. [Google Scholar] [CrossRef]
- Green, J.; Kleeman, C.R. Role of bone in regulation of systemic acid-base balance. Kidney Int. 1991, 39, 9–26. [Google Scholar] [CrossRef] [PubMed]
- Bonjour, J.P. Nutritional disturbance in acid-base balance and osteoporosis: A hypothesis that disregards the essential homeostatic role of the kidney. Br. J. Nutr. 2013, 110, 1168–1177. [Google Scholar] [CrossRef] [PubMed]
- Dounousi, E.; Zikou, X.; Koulouras, V.; Katopodis, K. Metabolic acidosis during parenteral nutrition: Pathophysiological mechanisms. Indian J. Crit. Care Med. 2015, 19, 270–274. [Google Scholar] [CrossRef] [PubMed]
- Alpern, R.J.; Sakhaee, K. The clinical spectrum of chronic metabolic acidosis: Homeostatic mechanisms produce significant morbidity. Am. J. Kidney Dis. 1997, 29, 291–302. [Google Scholar] [CrossRef]
- Vormann, J.; Goedecke, T. Acid-Base Homeostasis: Latent Acidosis as a Cause of Chronic Diseases. Schweiz. Z. Ganzheitsmed. 2006, 18, 255–266. [Google Scholar] [CrossRef]
- Allwood, M.C.; Kearney, M.C. Compatibility and stability of additives in parenteral nutrition admixtures. Nutrition 1998, 14, 697–706. [Google Scholar] [CrossRef]
- Fry, L.K.; Stegink, L.D. Formation of Maillard reaction products in parenteral alimentation solutions. J. Nutr. 1982, 2, 1631–1637. [Google Scholar] [CrossRef] [PubMed]
- Martins, S.; Jongen, W.; van Boekel, M. A review of Maillard reaction in food and implications to kinetic modelling. Trends Food Sci. Technol. 2001, 11, 364–373. [Google Scholar] [CrossRef]
- Washington, C. Stability of lipid emulsions for drug delivery. Adv. Drug Deliv. Rev. 1996, 20, 131–145. [Google Scholar] [CrossRef]


| Mean ± SD | Min–Max | |
|---|---|---|
| Volume (mL) | 1979 ± 574 | 630–3000 |
| Osmolarity (mOsm/L) | 1013 ± 236 | 419–1515 |
| Glucose (g/100 mL) | 9.1 ± 3.1 | 3.0–21.1 |
| Lipid (g/100 mL) | 2.2 ± 0.7 | 0–3.6 |
| Amino Acid (g/100 mL)) | 3.3 ± 1.2 | 1.1–6.1 |
| Calcium (mmol/L) | 3.0 ± 2.2 | 0–14.3 |
| Phosphorous (mmol/L) | 6.1 ± 4.4 | 0–18.6 |
| Sodium (mmol/L) | 51.1 ± 18.0 | 15.0–90.0 |
| Potassium (mmol/L) | 25.2 ± 13.4 | 0–73.4 |
| Magnesium (mmol/L) | 4.6 ± 2.7 | 1.2–13.2 |
| Acetate (mmol/L) | 29.1 ± 10.5 | 9.6–53.7 |
| Gluconate (mmol/mL) | 5.8 ± 4.1 | 0–27.1 |
| Chloride (mmol/mL) | 76.3 ± 25.6 | 31.4–140.0 |
| Mean (95% CI) | Min–Max | |
|---|---|---|
| Measured TA (mmol) | 15.2 (13.6–16.8) | 3.7–25.3 |
| Predicted TA (mmol) | 15.2 (13.6–16.8) | 3.8–25.0 |
| Measured pH | 5.73 (5.68–5.78) | 5.31–6.03 |
| Predicted pH | 5.74 (5.69–5.79) | 5.28–6.04 |
| Mean ± SD | Min–Max | |
|---|---|---|
| Cysteine (mmol/L) | 0.4 ± 01 | 0.1–0.7 |
| Methionine (mmol/L) | 12.0 ± 4.3 | 4.0–22.2 |
| Lysine (mmol/L) | 17.0 ± 6.1 | 5.6–31.4 |
| Arginine (mmol/L) | 18.5 ± 6.7 | 6.1–34.2 |
| Histhidine (mmol/L) | 7.2 ± 2.6 | 2.4–13.4 |
| Phospholipid (mmol/L) | 1.5 ± 0.5 | 0–2.6 |
| Acetate (mmol/L) | 29.1 ± 10.5 | 9.6–53.7 |
| Gluconate (mmol/L) | 5.8 ± 4.1 | 0–27.1 |
| Mean ± SD | Min–Max | |
|---|---|---|
| TA (mmol) | 15.2 ± 5.7 | 3.7–25.3 |
| PMAL (mmol) | 65.1 ± 28.5 | −0.6–131.9 |
| PTAL (mmol) | 80.3 ± 32.6 | 5.3–151.8 |
© 2018 by the authors. Licensee MDPI, Basel, Switzerland. This article is an open access article distributed under the terms and conditions of the Creative Commons Attribution (CC BY) license (http://creativecommons.org/licenses/by/4.0/).
Share and Cite
Iacone, R.; Scanzano, C.; D’Isanto, A.; Vitalone, A.; Frangipane, I.; D’Angeli, M.; Santarpia, L.; Contaldo, F. Prediction of Renal Acid Load in Adult Patients on Parenteral Nutrition. Pharmaceutics 2018, 10, 43. https://0-doi-org.brum.beds.ac.uk/10.3390/pharmaceutics10020043
Iacone R, Scanzano C, D’Isanto A, Vitalone A, Frangipane I, D’Angeli M, Santarpia L, Contaldo F. Prediction of Renal Acid Load in Adult Patients on Parenteral Nutrition. Pharmaceutics. 2018; 10(2):43. https://0-doi-org.brum.beds.ac.uk/10.3390/pharmaceutics10020043
Chicago/Turabian StyleIacone, Roberto, Clelia Scanzano, Anna D’Isanto, Andrea Vitalone, Ignazio Frangipane, Mariana D’Angeli, Lidia Santarpia, and Franco Contaldo. 2018. "Prediction of Renal Acid Load in Adult Patients on Parenteral Nutrition" Pharmaceutics 10, no. 2: 43. https://0-doi-org.brum.beds.ac.uk/10.3390/pharmaceutics10020043