Immediate-Release Nifedipine Binary Dry Powder Mixtures with Nanocellulose Featuring Enhanced Solubility and Dissolution Rate


Abstract
:
1. Introduction
2. Materials and Methods
2.1. Materials
2.2. Mixture Preparation
2.2.1. Non-Heated Mixture
2.2.2. Heated Mixture
2.3. Methods
2.3.1. Scanning Electron Microscopy (SEM)
2.3.2. Differential Scanning Calorimetry (DSC)
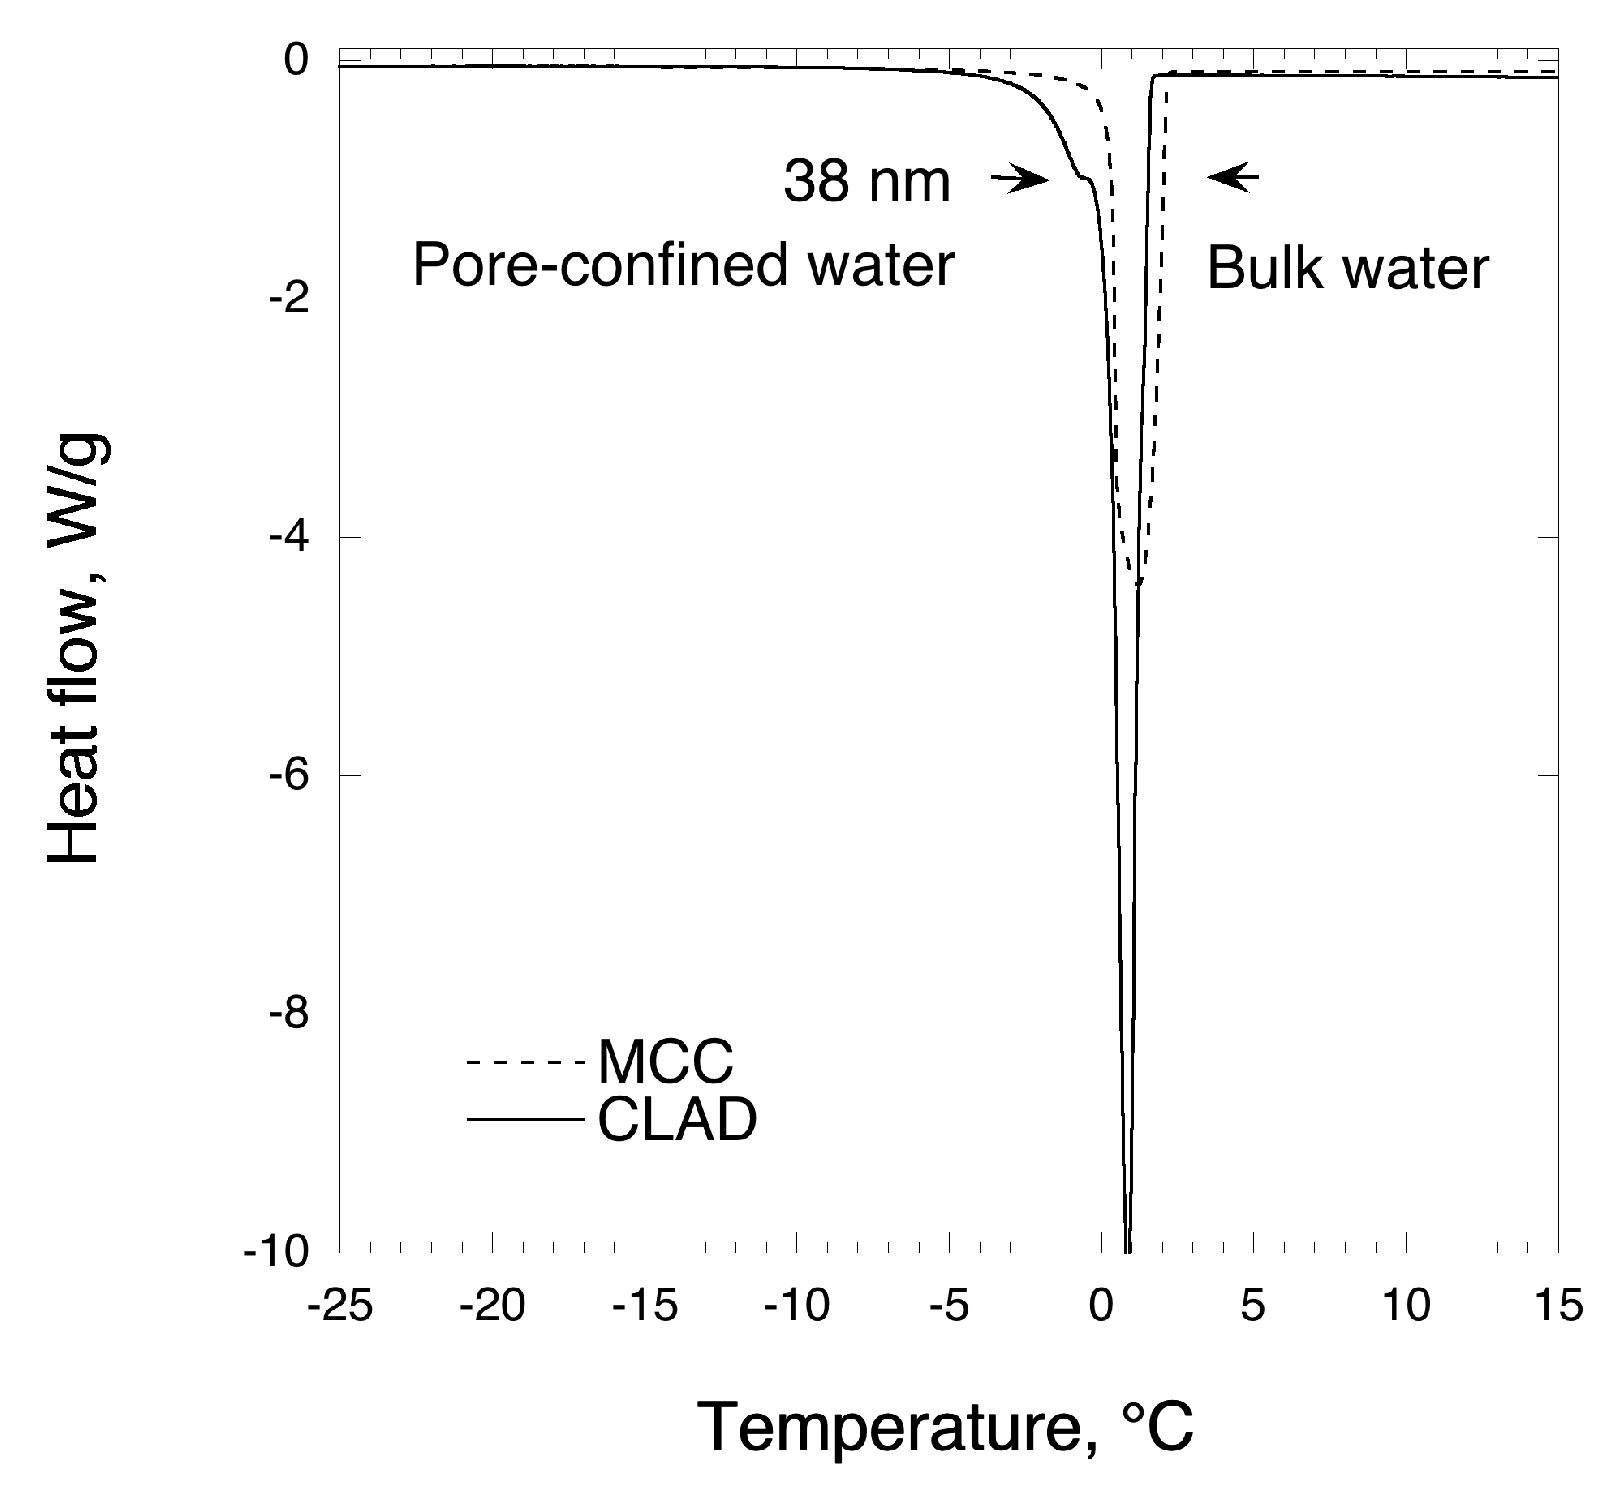
Cryoporometry
Melting Enthalpy
2.3.3. X-ray Diffraction (XRD)
2.3.4. In Vitro Dissolution Test in Biorelevant Media
2.3.5. High Performance Liquid Chromatography (HPLC)
2.3.6. Solid-State Stability
3. Results
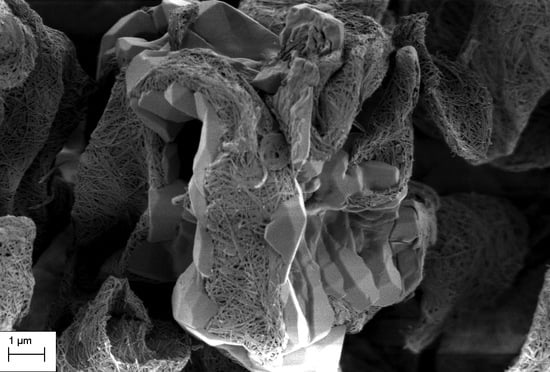
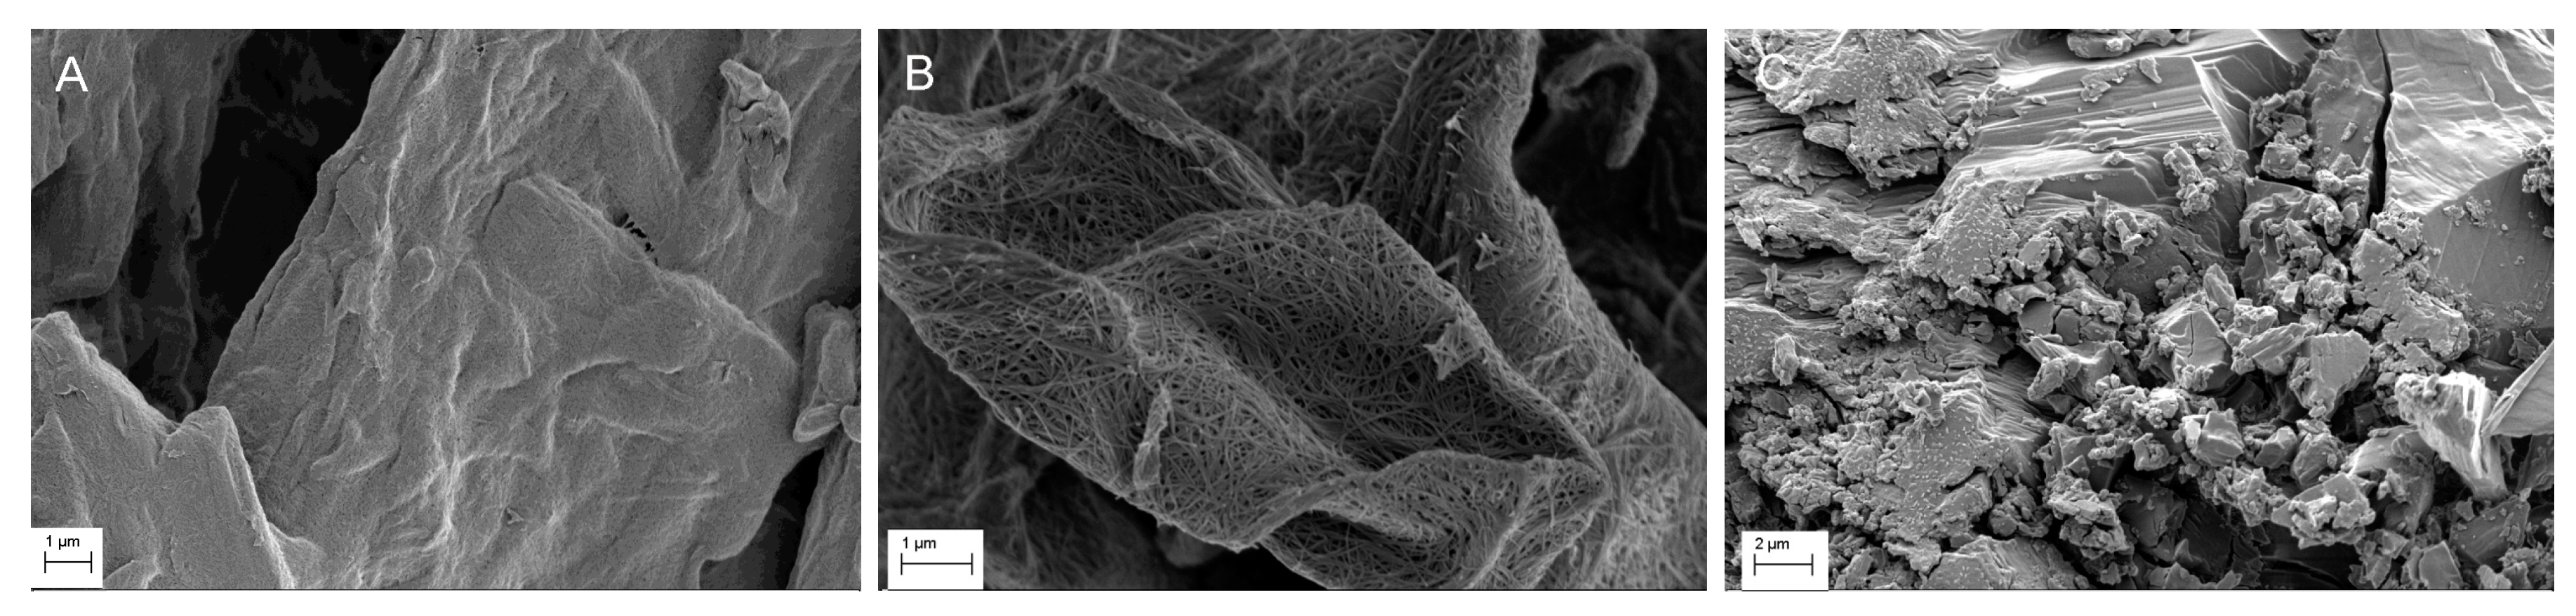
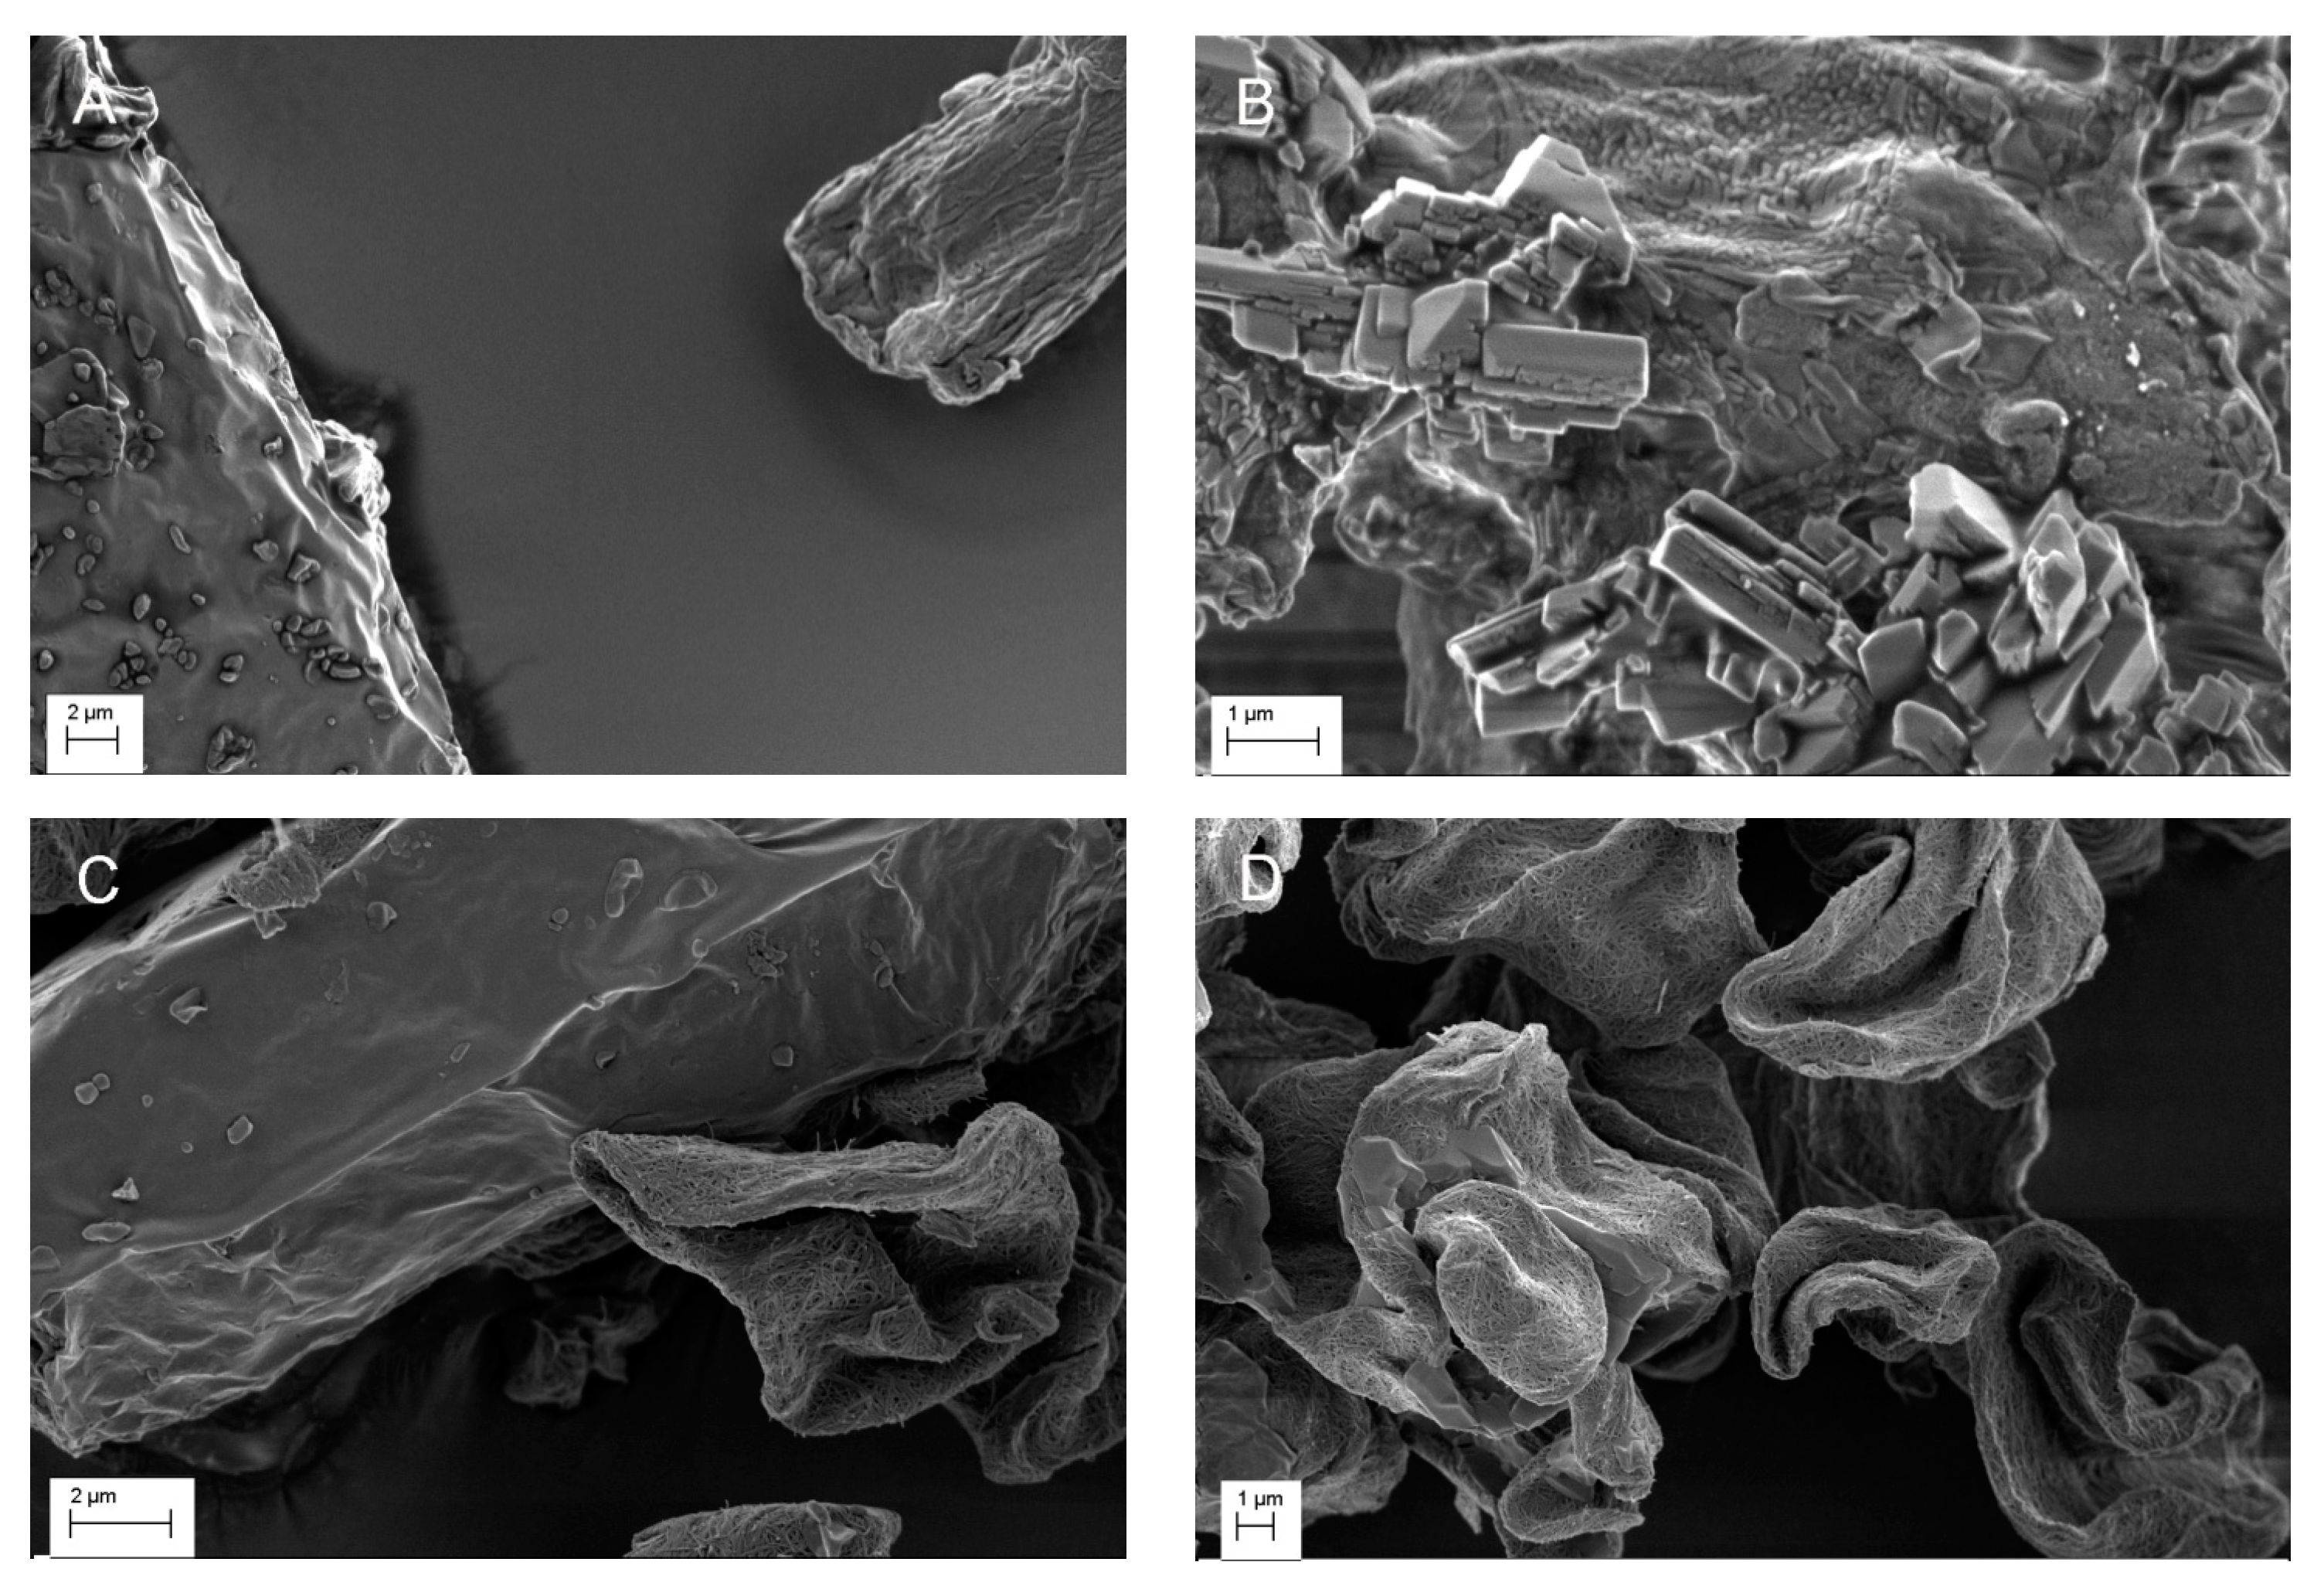
3.1. SEM
3.2. DSC
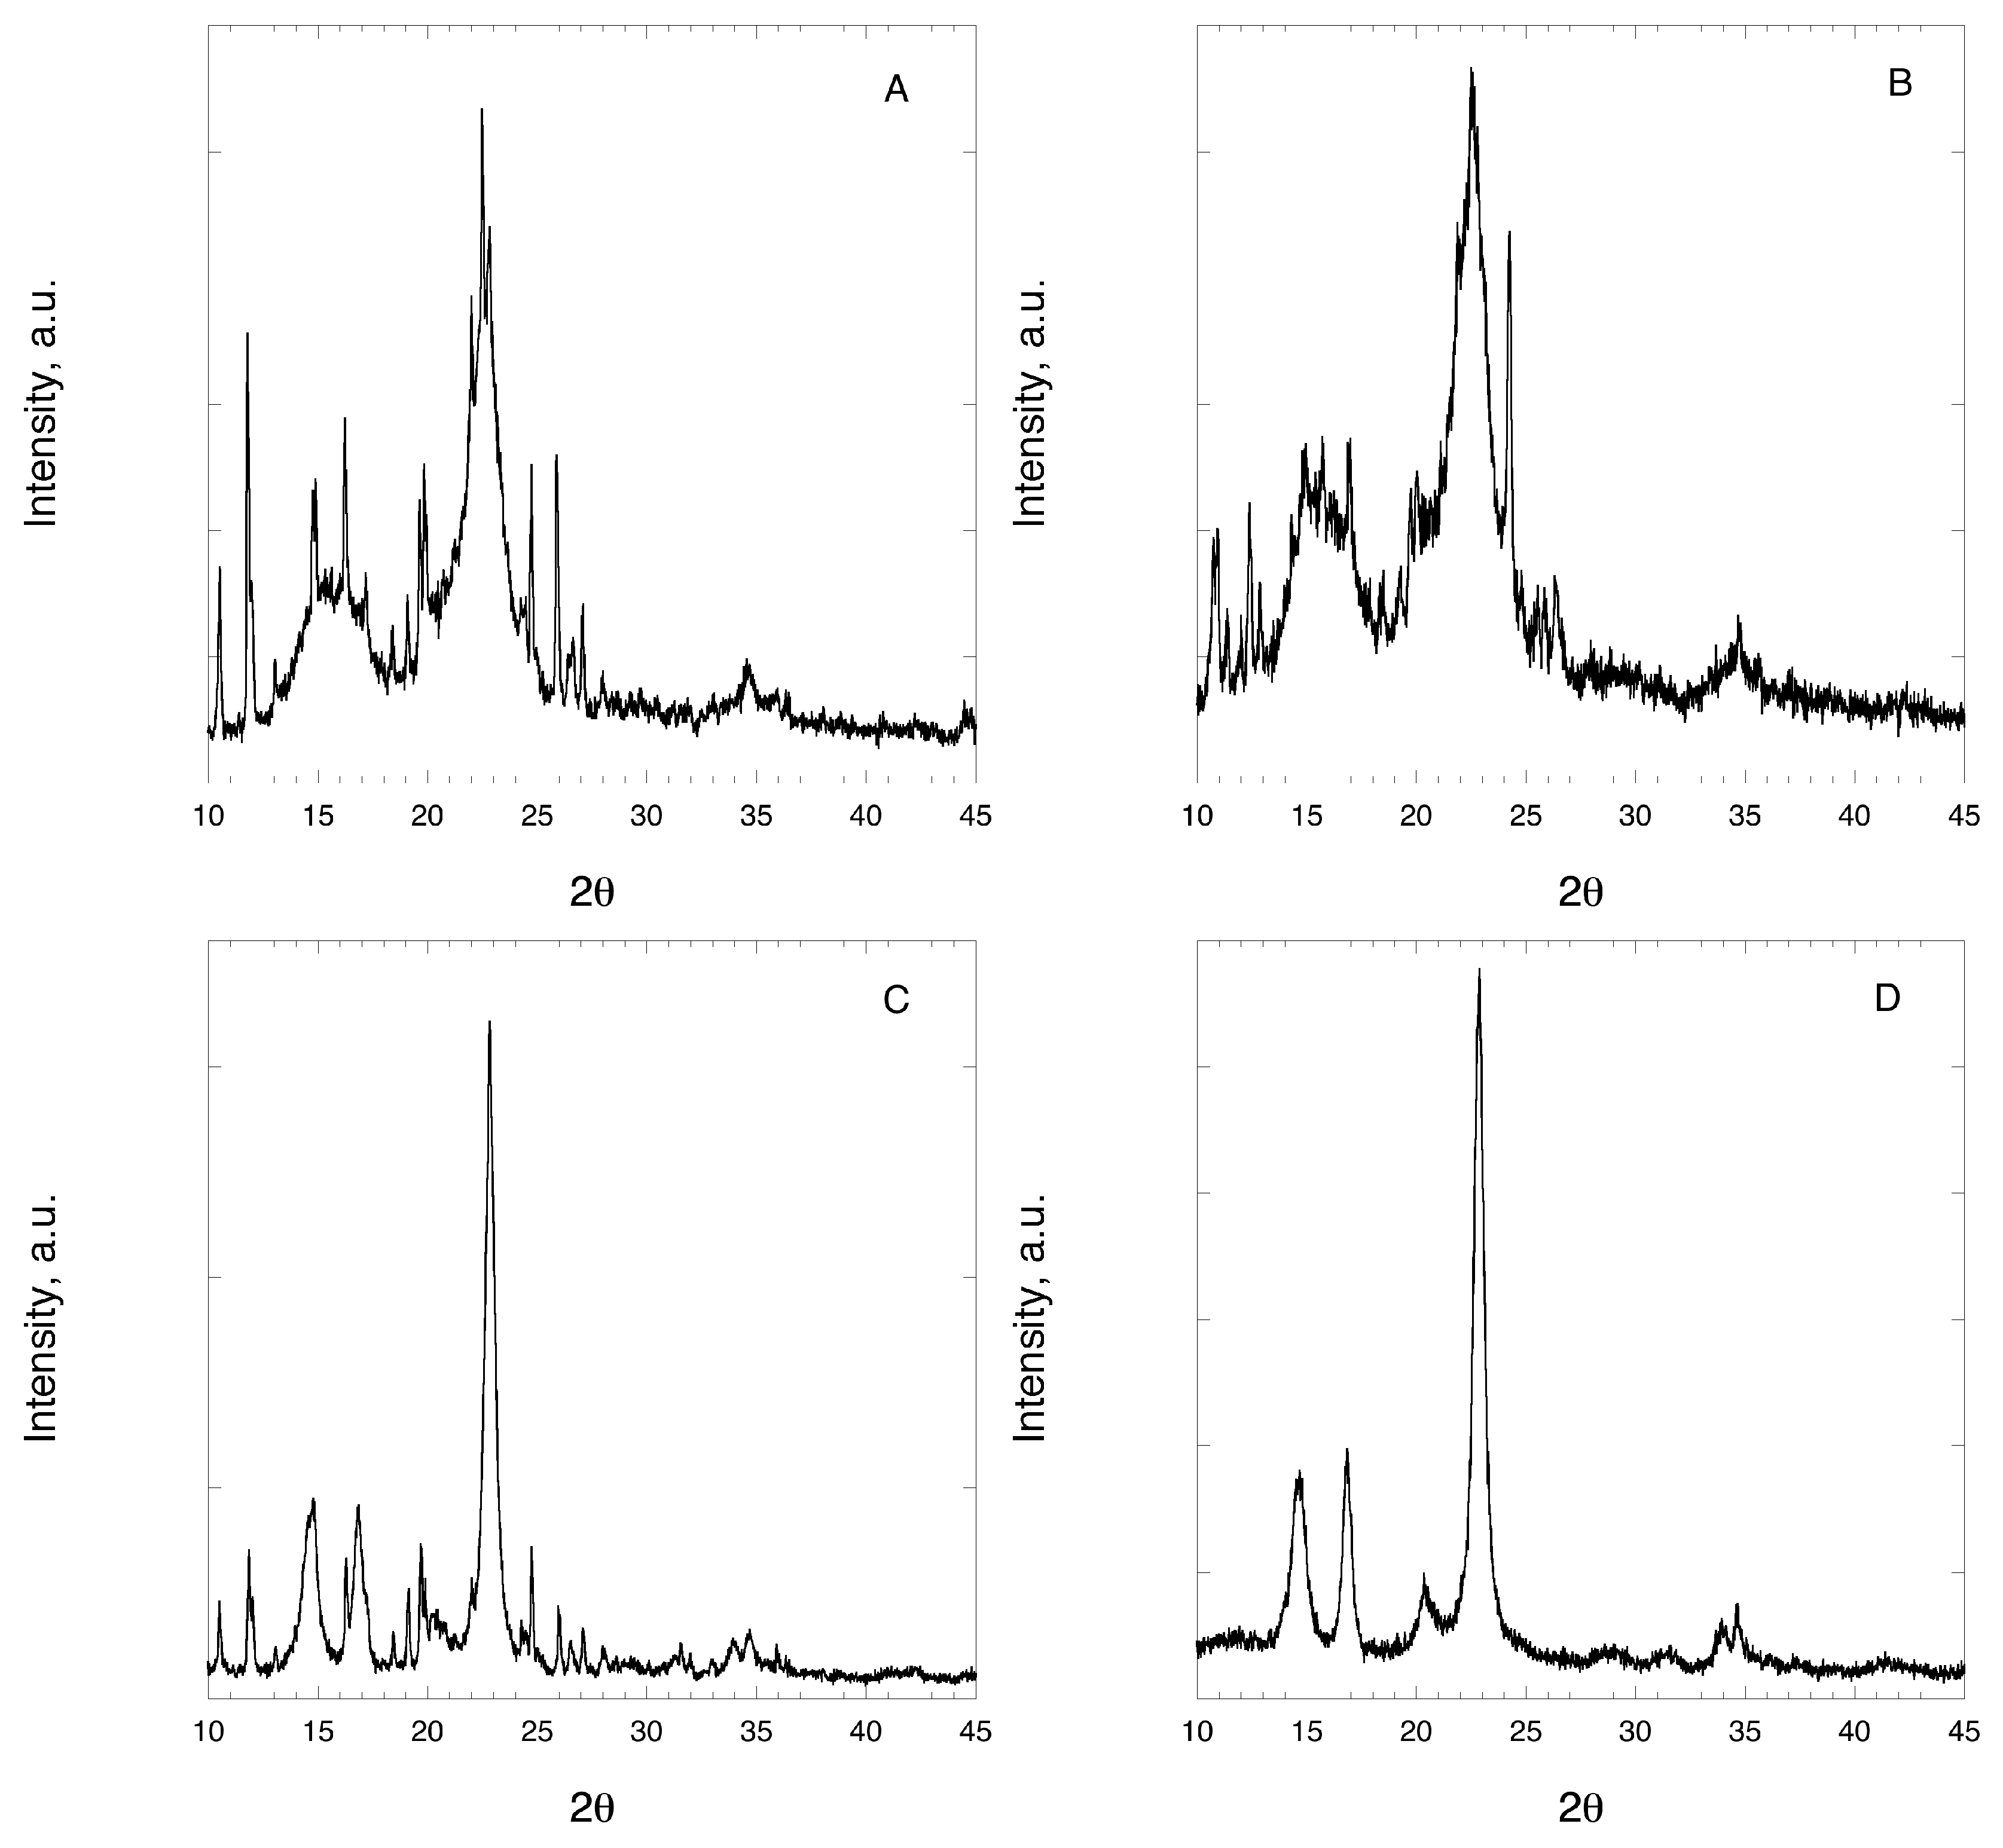
3.3. X-ray Diffraction
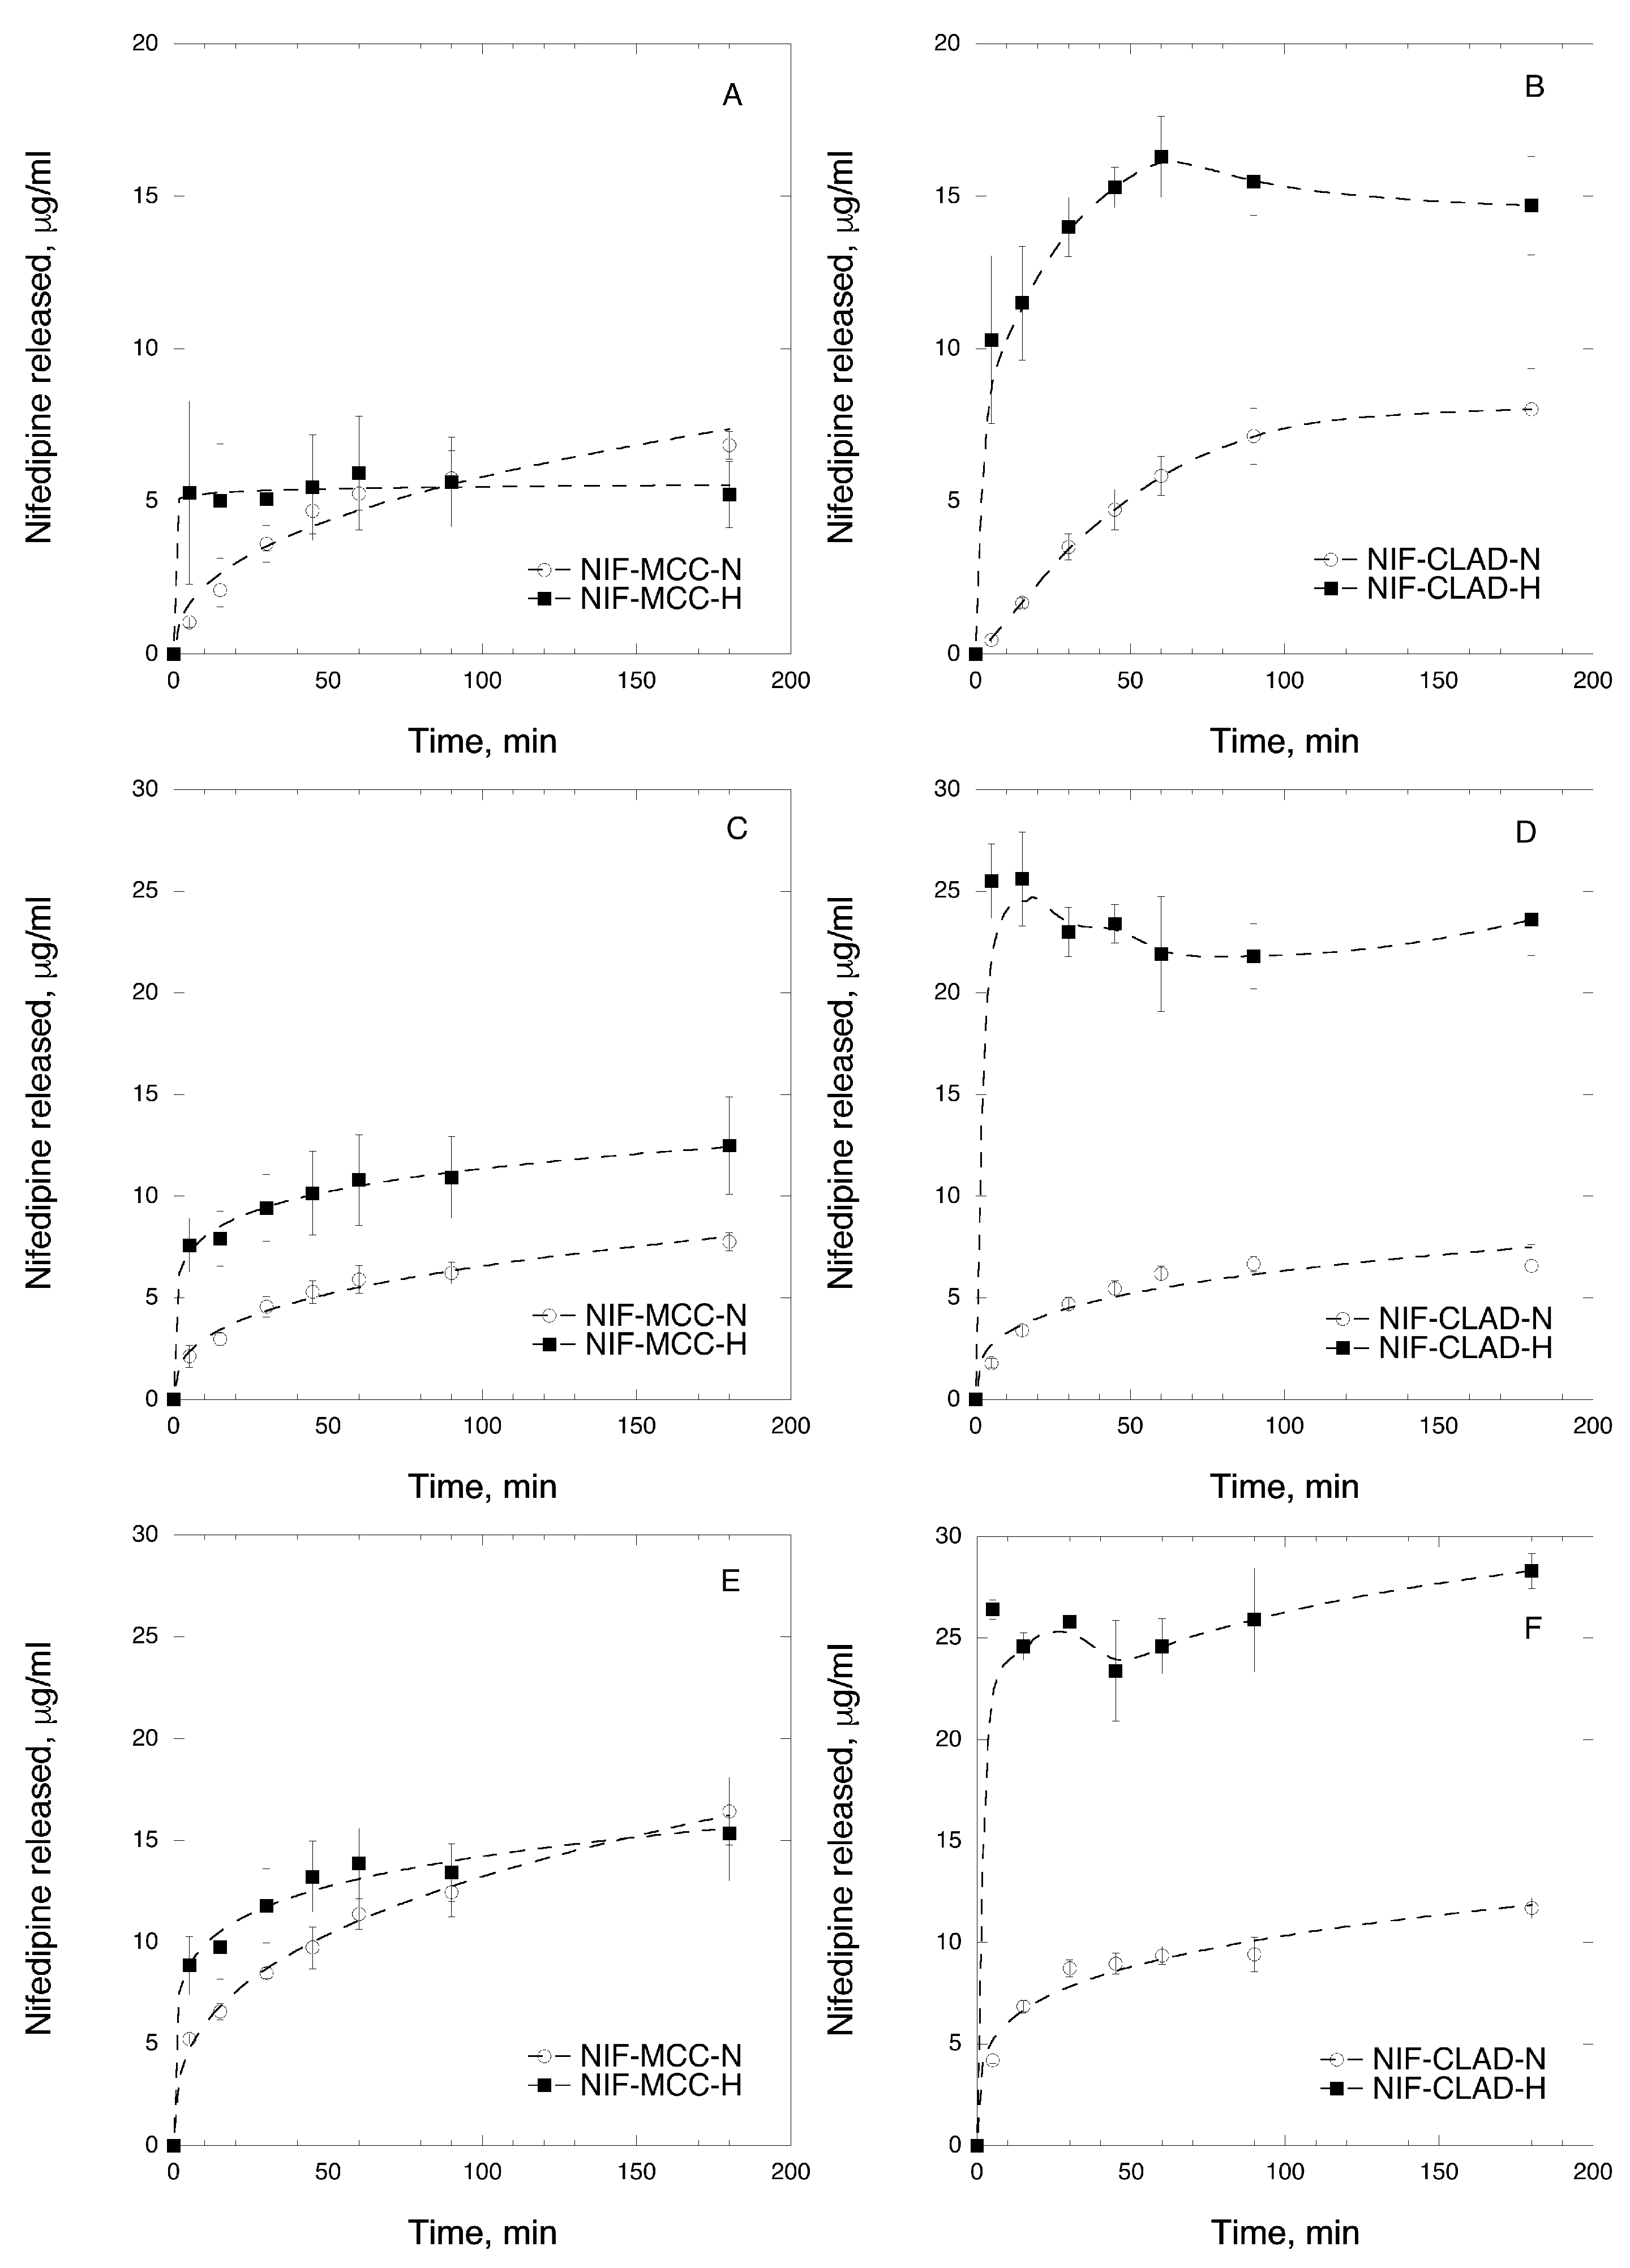
3.4. In Vitro Dissolution in Biorelevant Media
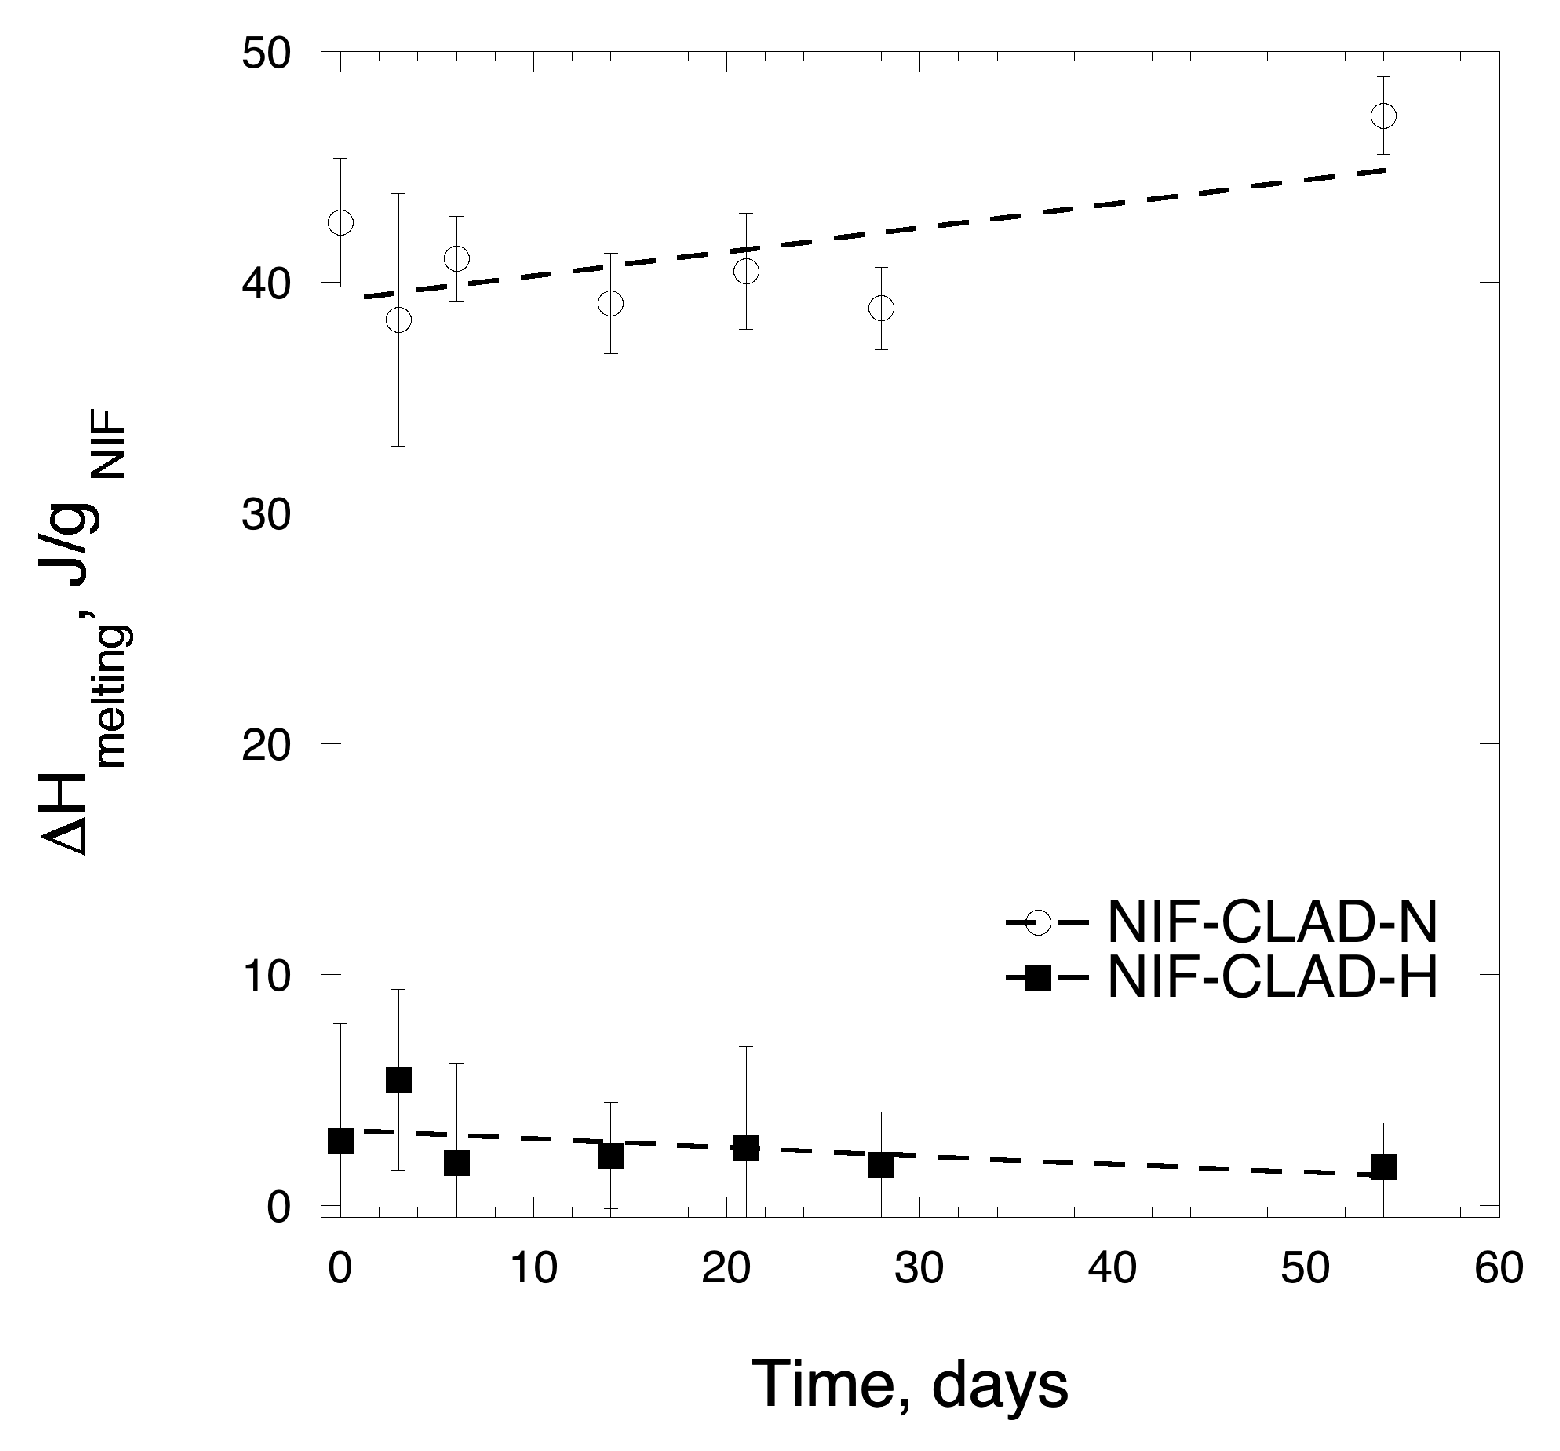
3.5. Solid-State Stability
4. Discussion
5. Conclusions
Supplementary Materials
Author Contributions
Funding
Acknowledgments
Conflicts of Interest
References
- Kiriyama, A.; Honbo, A.; Nishimura, A.; Shibata, N.; Iga, K. Pharmacokinetic-pharmacodynamic analyses of antihypertensive drugs, nifedipine and propranolol, in spontaneously hypertensive rats to investigate characteristics of effect and side effects. Regul. Toxicol. Pharmacol. 2016, 76, 21–29. [Google Scholar] [CrossRef]
- Toal, C.B.; Meredith, P.A.; Elliott, H.L. Once daily nifedipine: The formulation dictates the pharmacokinetic characteristics and the therapeutic responses. Int. J. Clin. Pharmacol. Ther. 2012, 50, 202–217. [Google Scholar] [CrossRef]
- Snider, M.; Nuzum, D.; Veverka, A. Long-acting nifedipine in the management of the hypertensive patient. Vasc. Health Risk Manag. 2008, 4, 1249–1257. [Google Scholar] [PubMed]
- Means, L.; Benken, S.T.; Tesoro, E.P. Safety of Immediate-release nifedipine. J. Cardiovasci. Pharm. 2016, 68, 395–399. [Google Scholar] [CrossRef]
- Schubert, I.; Hein, R.; Abbas, S.; Thurmann, P. The frequency of prescription of immediate-release nifedipine for elderly patients in Germany: Utilization analysis of a substance on the PRISCUS list of potentially inappropriate medications. Dtsch. Arztebl. Int. 2012, 109, 215–219. [Google Scholar] [PubMed]
- Yan, G.; Li, H.; Zhang, R.; Ding, D. Preparation and evaluation of a sustained-release formulation of nifedipine HPMC tablets. Drug Dev. Ind. Pharm. 2000, 26, 681–686. [Google Scholar] [CrossRef] [PubMed]
- Kleinbloesem, C.H.; van Brummelen, P.; Breimer, D.D. Nifedipine. Relationship between pharmacokinetics and pharmacodynamics. Clin. Pharmacokinet. 1987, 12, 12–29. [Google Scholar] [CrossRef] [PubMed]
- Toal, C.B. Formulation dependent pharmacokinetics—Does the dosage form matter for nifedipine? J. Cardiovasci. Pharm. 2004, 44, 82–86. [Google Scholar] [CrossRef]
- Chung, M.; Reitberg, D.P.; Gaffney, M.; Singleton, W. Clinical pharmacokinetics of nifedipine gastrointestinal therapeutic system. A controlled-release formulation of nifedipine. Am. J. Med. 1987, 83, 10–14. [Google Scholar] [CrossRef]
- Gajendran, J.; Kramer, J.; Shah, V.P.; Langguth, P.; Polli, J.; Mehta, M.; Groot, D.W.; Cristofoletti, R.; Abrahamsson, B.; Dressman, J.B. Biowaiver Monographs for Immediate-Release Solid Oral Dosage Forms: Nifedipine. J. Pharm. Sci. 2015, 104, 3289–3298. [Google Scholar] [CrossRef]
- Taburet, A.M.; Singlas, E.; Colin, J.N.; Banzet, O.; Thibonnier, M.; Corvol, P. Pharmacokinetic studies of nifedipine tablet. Correlation with antihypertensive effects. Hypertension 1983, 5, 29–33. [Google Scholar] [CrossRef]
- Zylber-Katz, E.; Koren, G.; Granit, L.; Levy, M. Bioavailability of nifedipine: A comparison between two preparations. Biopharm. Drug Dispos. 1984, 5, 109–115. [Google Scholar] [CrossRef] [PubMed]
- Friedrich, H.; Nada, A.; Bodmeier, R. Solid state and dissolution rate characterization of co-ground mixtures of nifedipine and hydrophilic carriers. Drug Dev. Ind. Pharm. 2005, 31, 719–728. [Google Scholar] [CrossRef] [PubMed]
- Hecq, J.; Deleers, M.; Fanara, D.; Vranckx, H.; Amighi, K. Preparation and characterization of nanocrystals for solubility and dissolution rate enhancement of nifedipine. Int. J. Pharm. 2005, 299, 167–177. [Google Scholar] [CrossRef] [PubMed]
- Li, N.; DeGennaro, M.D.; Liebenberg, W.; Tiedt, L.R.; Zahr, A.S.; Pishko, M.V.; de Villiers, M.M. Increased dissolution and physical stability of micronized nifedipine particles encapsulated with a biocompatible polymer and surfactants in a wet ball milling process. Pharmazie 2006, 61, 595–603. [Google Scholar] [PubMed]
- Gohel, M.C.; Patel, M.R.; Patel, K.V. Studies in dissolution enhancement of nifedipine. Drug Dev. Ind. Pharm. 1996, 22, 263–268. [Google Scholar] [CrossRef]
- Yonemochi, E.; Yamamoto, K. Porous glass. In Encyclopedia of Surface and Colloid Science; Somasundaran, P., Ed.; Taylor & Francis: Abingdon, UK, 2006; Volume 6, pp. 5068–5077. [Google Scholar]
- Vasconcelos, T.; Sarmento, B.; Costa, P. Solid dispersions as strategy to improve oral bioavailability of poor water soluble drugs. Drug Discov. Today 2007, 12, 1068–1075. [Google Scholar] [CrossRef]
- Hasegawa, A.; Nakagawa, H.; Sugimoto, I. Solid dispersion obtained from nifedipine and enteric coating agents. I. Dissolution behavior. Yakugaku Zasshi J. Pharm. Soc. Jpn. 1984, 104, 485–489. [Google Scholar] [CrossRef]
- Emara, L.H.; Badr, R.M.; Elbary, A.A. Improving the dissolution and bioavailability of nifedipine using solid dispersions and solubilizers. Drug Dev. Ind. Pharm. 2002, 28, 795–807. [Google Scholar] [CrossRef]
- Mihranyan, A. Cellulose from Cladophorales Green Algae: From Environmental Problem to High-Tech Composite Materials. J. Appl. Polym. Sci. 2011, 119, 2449–2460. [Google Scholar] [CrossRef]
- Gustafsson, C.; Lennholm, H.; Iversen, T.; Nystrom, C. Evaluation of surface and bulk characteristics of cellulose I powders in relation to compaction behavior and tablet properties. Drug Dev. Ind. Pharm. 2003, 29, 1095–1107. [Google Scholar] [CrossRef] [PubMed]
- Stromme, M.; Mihranyan, A.; Ek, R. What to do with all these algae? Mater. Lett. 2002, 57, 569–572. [Google Scholar] [CrossRef]
- Mihranyan, A.; Andersson, S.B.; Ek, R. Sorption of nicotine to cellulose powders. Eur. J. Pharm. Sci. 2004, 22, 279–286. [Google Scholar] [CrossRef] [PubMed]
- Heidarian, M.; Mihranyan, A.; Stromme, M.; Ek, R. Influence of water-cellulose binding energy on stability of acetylsalicylic acid. Int. J. Pharm. 2006, 323, 139–145. [Google Scholar] [CrossRef] [PubMed]
- Carlsson, D.O.; Hua, K.; Forsgren, J.; Mihranyan, A. Aspirin degradation in surface-charged TEMPO-oxidized mesoporous crystalline nanocellulose. Int. J. Pharm. 2014, 461, 74–81. [Google Scholar] [CrossRef] [PubMed]
- Mihranyan, A.; Stromme, M.; Ek, R. Influence of cellulose powder structure on moisture-induced degradation of acetylsalicylic acid. Eur. J. Pharm. Sci. 2006, 27, 220–225. [Google Scholar] [CrossRef] [PubMed]
- Chowdary, K.P.R.; Ramesh, K.V.R.N.S. Improvement of dissolution rate and efficiency of nifedipine by solid dispersion in PVP-MCC and HPC-MCC. Indian J. Pharm. Sci. 1994, 56, 95–99. [Google Scholar]
- Alqurshi, A.; Chan, K.L.A.; Royall, P.G. In-situ freeze-drying-forming amorphous solids directly within capsules: An investigation of dissolution enhancement for a poorly soluble drug. Sci. Rep. 2017, 7, 2910. [Google Scholar] [CrossRef] [PubMed]
- Mantas, A.; Labbe, V.; Loryan, I.; Mihranyan, A. Amorphisation of Free Acid Ibuprofen and Other Profens in Mixtures with Nanocellulose: Dry Powder Formulation Strategy for Enhanced Solubility. Pharmaceutics 2019. Revision. [Google Scholar]
- Landry, M.R. Thermoporometry by differential scanning calorimetry: Experimental considerations and applications. Thermochim. Acta 2005, 433, 27–50. [Google Scholar] [CrossRef]
- Tozuka, Y.; Yonemochi, E.; Oguchi, T.; Yamamoto, K. Fluorometric studies of pyrene adsorption on porous crystalline cellulose. J. Colloid Interf. Sci. 1998, 205, 510–515. [Google Scholar] [CrossRef] [PubMed]
- Tozuka, Y.; Yonemochi, E.; Oguchi, T.; Yamamoto, K. Molecular states of 2-naphthoic acid in solid dispersions with porous crystalline cellulose, as investigated by fluorescence spectroscopy. B Chem. Soc. Jpn. 2000, 73, 1567–1572. [Google Scholar] [CrossRef]
- Lombardo, S.; Chen, P.; Larsson, P.A.; Thielemans, W.; Wohlert, J.; Svagan, A.J. Toward Improved Understanding of the Interactions between Poorly Soluble Drugs and Cellulose Nanofibers. Langmuir 2018, 34, 5464–5473. [Google Scholar] [CrossRef] [PubMed]
- Raemsch, K.D.; Sommer, J. Pharmacokinetics and metabolism of nifedipine. Hypertension 1983, 5, 18–24. [Google Scholar] [CrossRef]
- Thelen, K.; Jantratid, E.; Dressman, J.B.; Lippert, J.; Willmann, S. Analysis of nifedipine absorption from soft gelatin capsules using PBPK modeling and biorelevant dissolution testing. J. Pharm. Sci. 2010, 99, 2899–2904. [Google Scholar] [CrossRef] [PubMed]


| Drug | Structure | IUPAC Name |
|---|---|---|
| NIF |  | 1,4-dihydro-2,6-dimethyl-4-(2-nitrophenyl)-3,5-pyridine dicarboxylic acid dimethyl ester |
| Ton, °C | Tm, °C | ΔH, J/g mix | CrI *, % | |
|---|---|---|---|---|
| NIF | 172.1 ± 0.1 | 172.8 ± 0.1 | 105.4 ± 2.2 | 100 |
| NIF-MCC-N | 171.7 ± 0.0 | 173.1 ± 0.1 | 20.5 ± 0.8 | 97.4 |
| NIF-MCC-H | 162.6 ± 1.4 | 167.8 ± 0.8 | 11.1 ± 1.9 | 52.5 |
| NIF-CLAD-N | 171.8 ± 0.0 | 173.1 ± 0.1 | 7.5 ± 2.3 | 35.5 |
| NIF-CLAD-H | 142.4 ± 1.8 | 148.7 ± 1.9 | 0.7 ± 0.5 | 3.3 |
© 2019 by the authors. Licensee MDPI, Basel, Switzerland. This article is an open access article distributed under the terms and conditions of the Creative Commons Attribution (CC BY) license (http://creativecommons.org/licenses/by/4.0/).
Share and Cite
Mantas, A.; Mihranyan, A. Immediate-Release Nifedipine Binary Dry Powder Mixtures with Nanocellulose Featuring Enhanced Solubility and Dissolution Rate. Pharmaceutics 2019, 11, 37. https://0-doi-org.brum.beds.ac.uk/10.3390/pharmaceutics11010037
Mantas A, Mihranyan A. Immediate-Release Nifedipine Binary Dry Powder Mixtures with Nanocellulose Featuring Enhanced Solubility and Dissolution Rate. Pharmaceutics. 2019; 11(1):37. https://0-doi-org.brum.beds.ac.uk/10.3390/pharmaceutics11010037
Chicago/Turabian StyleMantas, Athanasios, and Albert Mihranyan. 2019. "Immediate-Release Nifedipine Binary Dry Powder Mixtures with Nanocellulose Featuring Enhanced Solubility and Dissolution Rate" Pharmaceutics 11, no. 1: 37. https://0-doi-org.brum.beds.ac.uk/10.3390/pharmaceutics11010037