
Overcoming the Low Oral Bioavailability of Deuterated Pyrazoloquinolinone Ligand DK-I-60-3 by Nanonization: A Knowledge-Based Approach

 , , ,
, , ,  ,
,
Abstract
:1. Introduction
2. Materials and Methods
2.1. Materials
2.2. Methods
2.2.1. Preformulation Studies
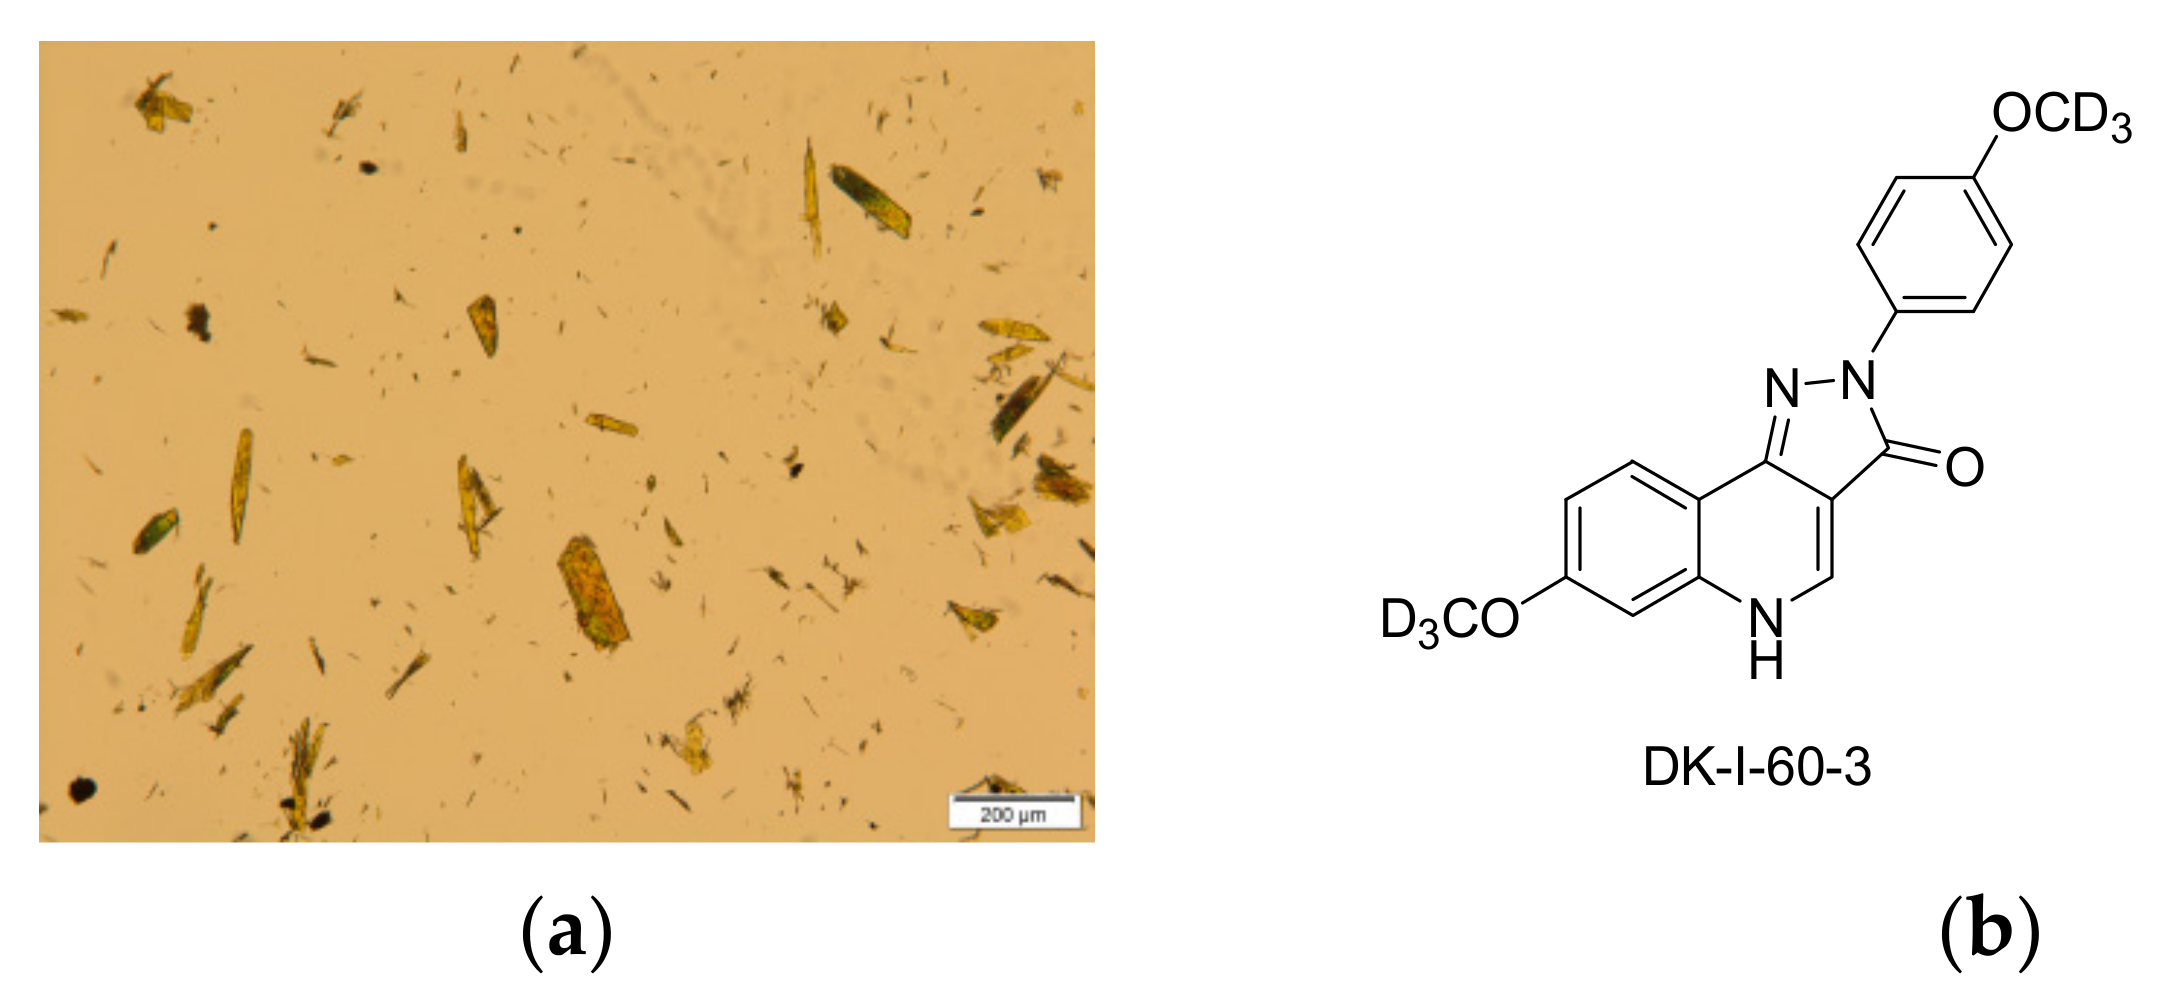
Solubility of DK-I-60-3
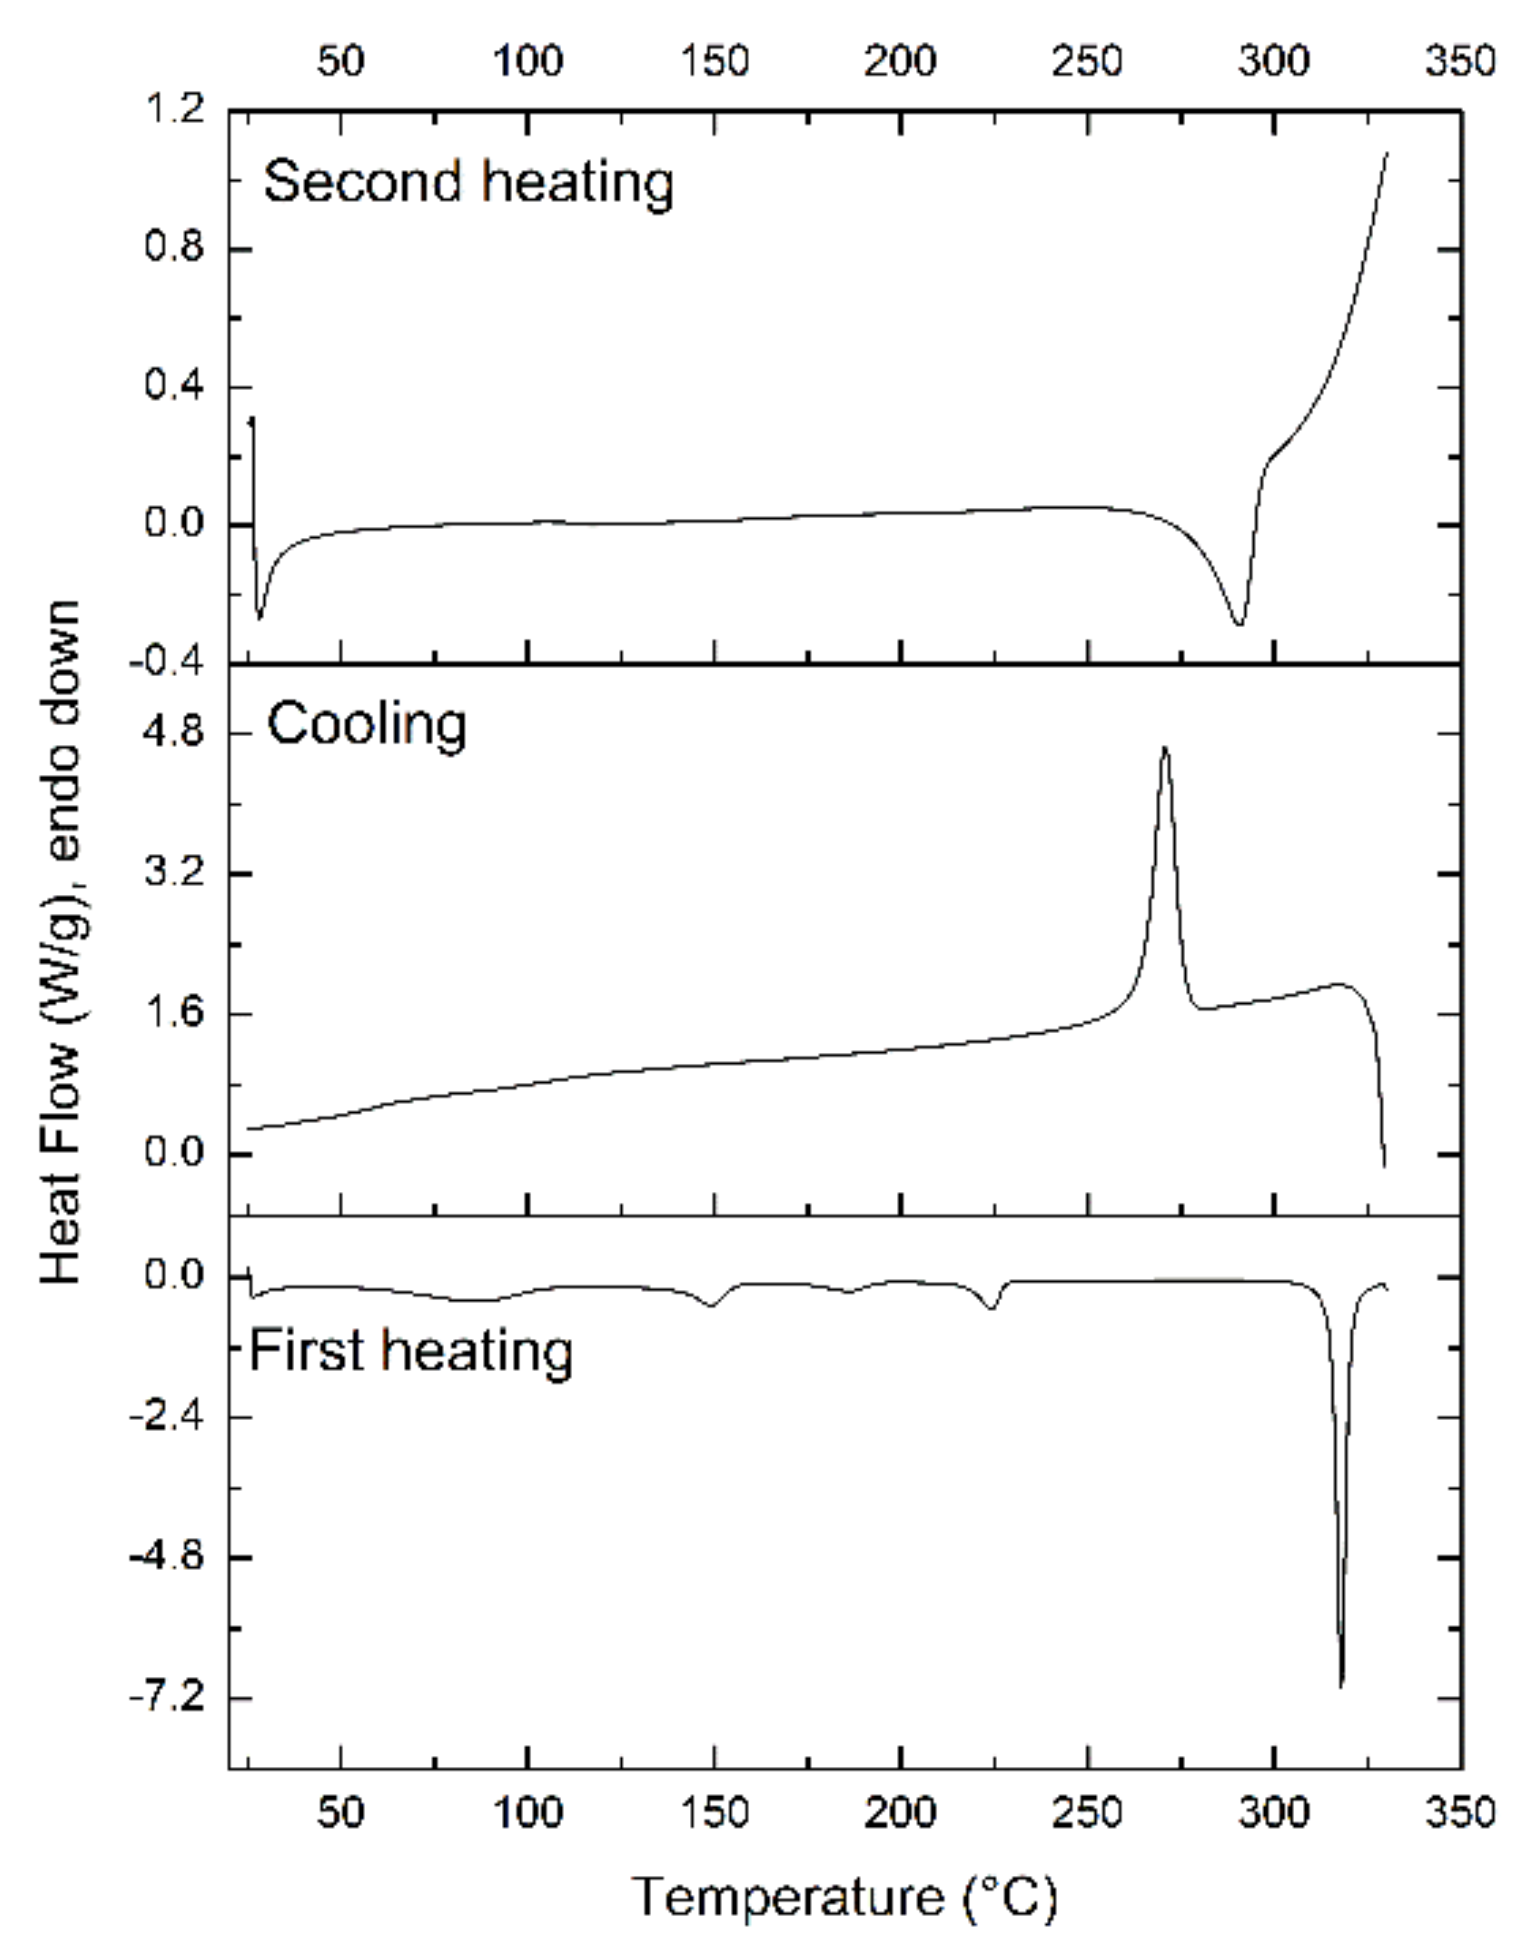
Melt-Quenching
2.2.2. Nanocrystal Dispersions Preparation
2.2.3. Physicochemical Characterization
Particle Size Measurements
Zeta Potential Measurements
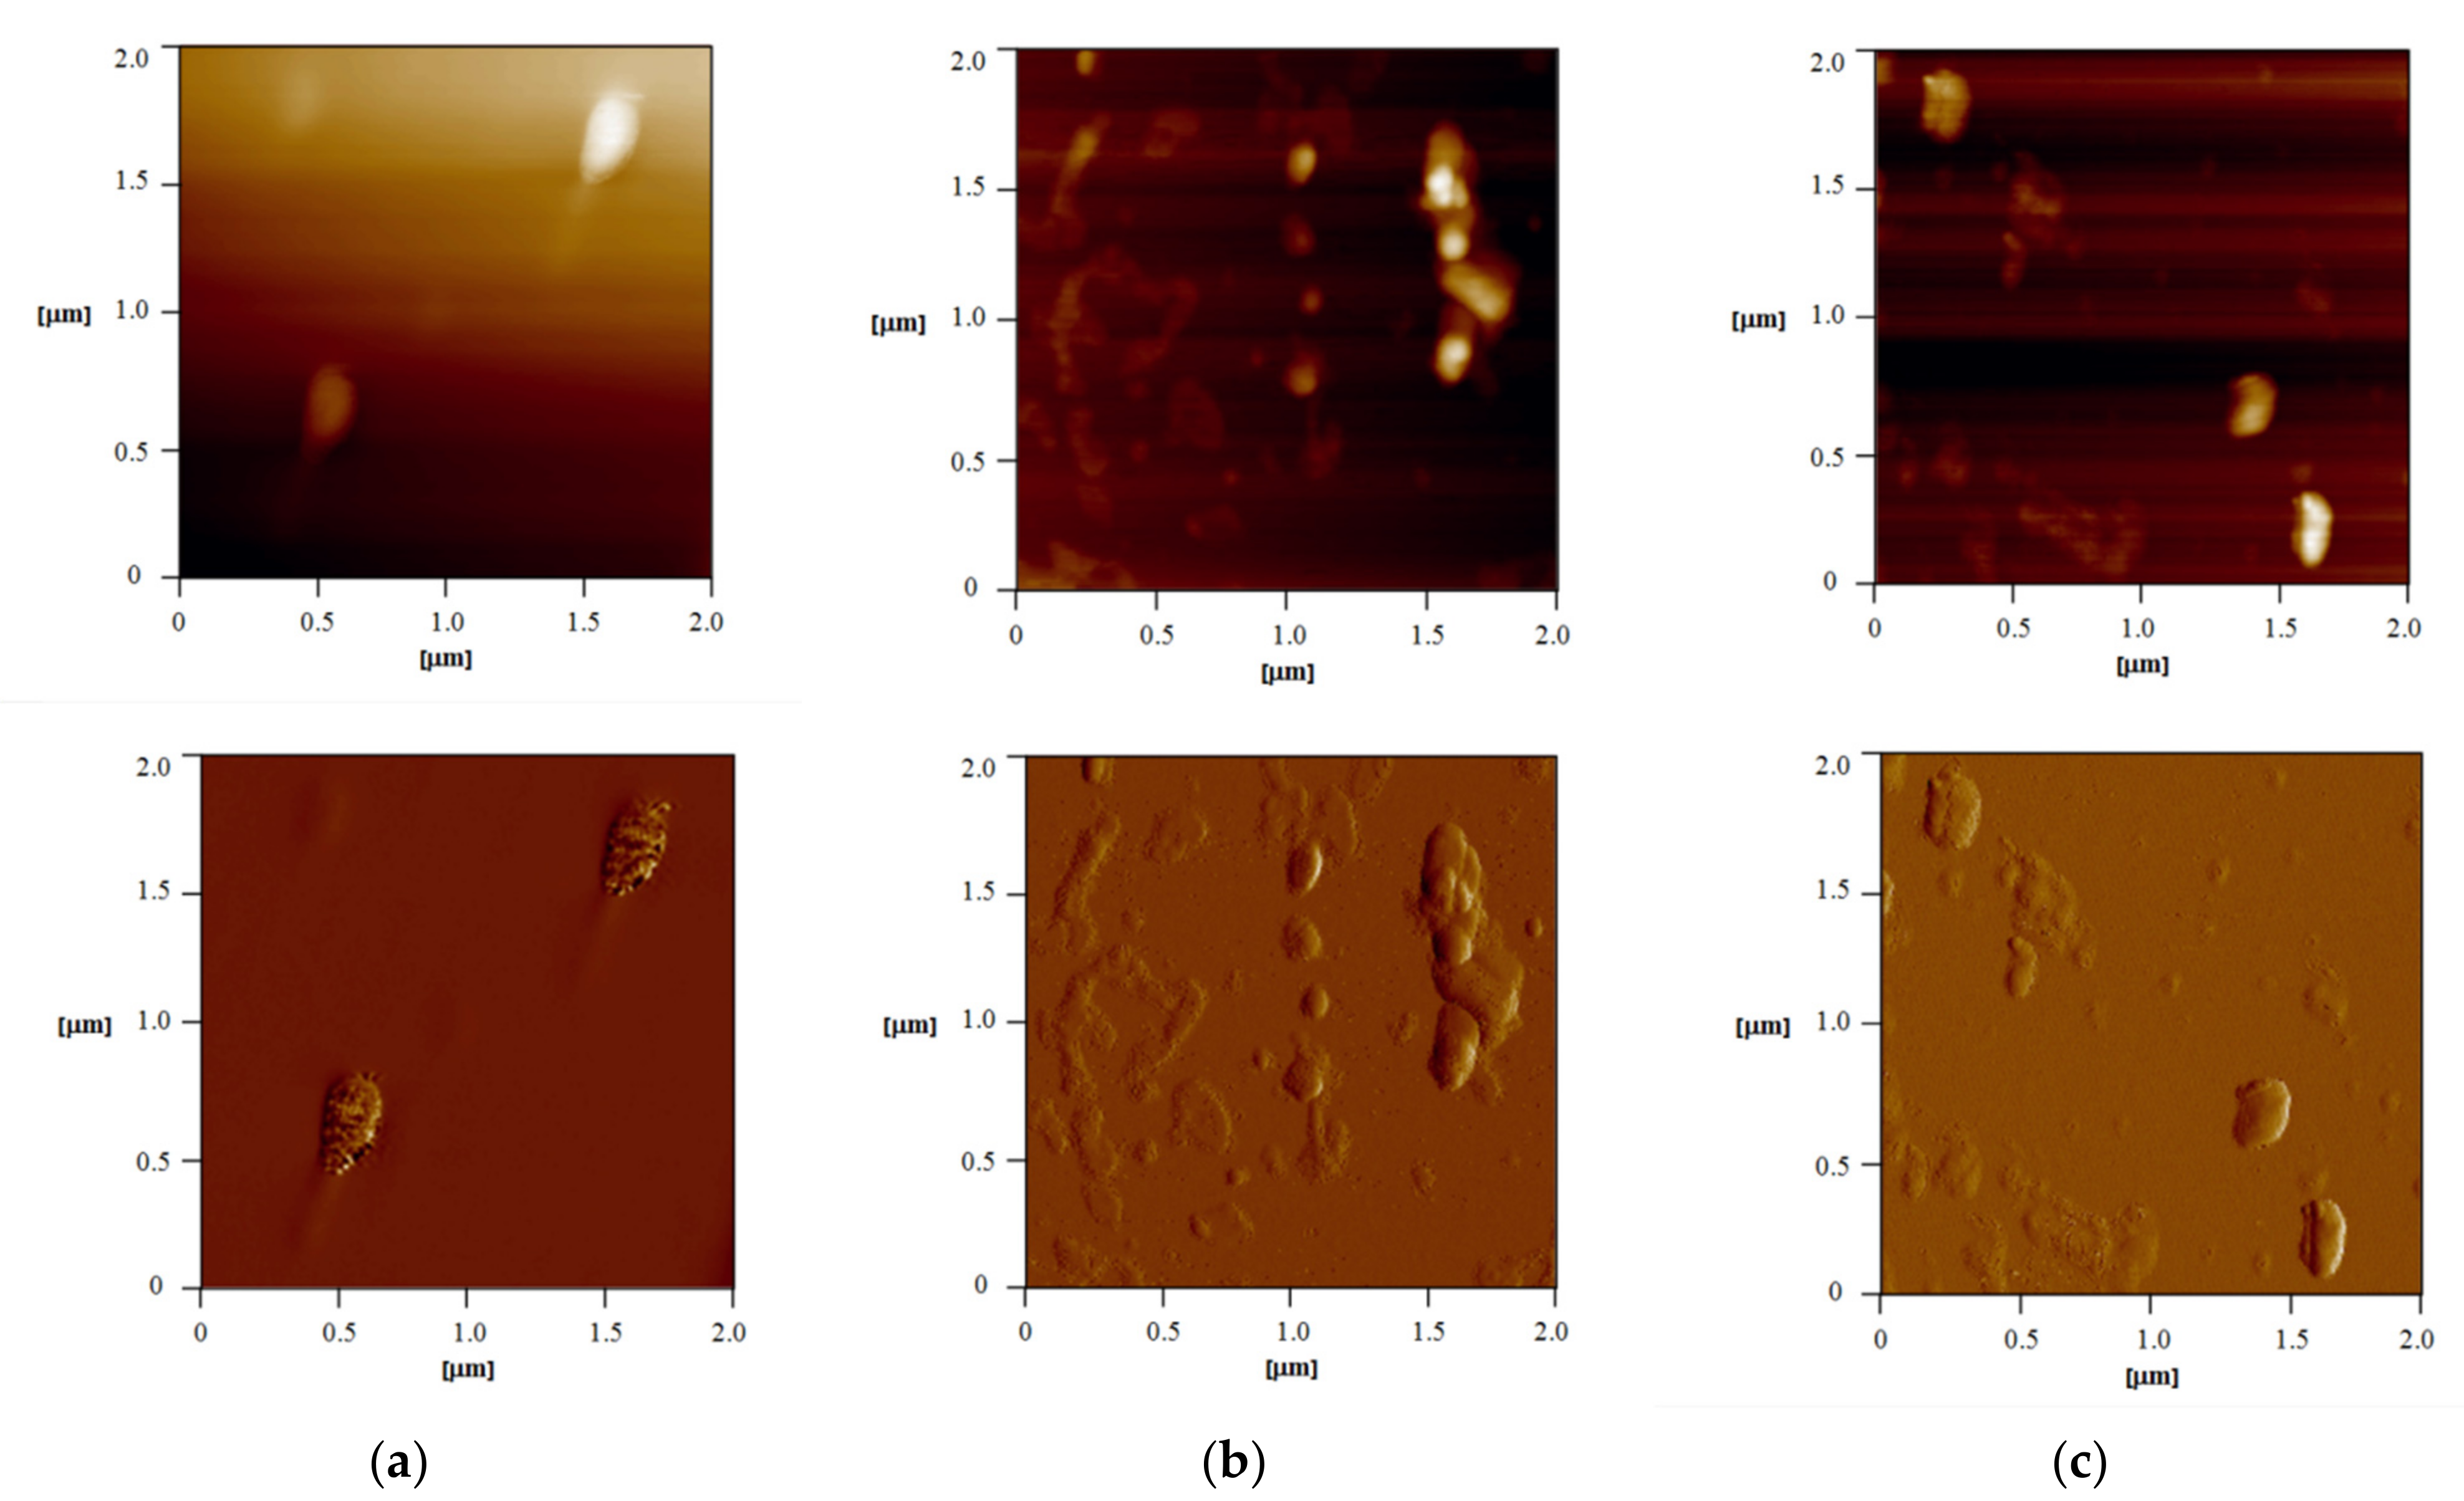
Atomic Force Microscopy (AFM)
Differential Scanning Calorimetry (DSC)
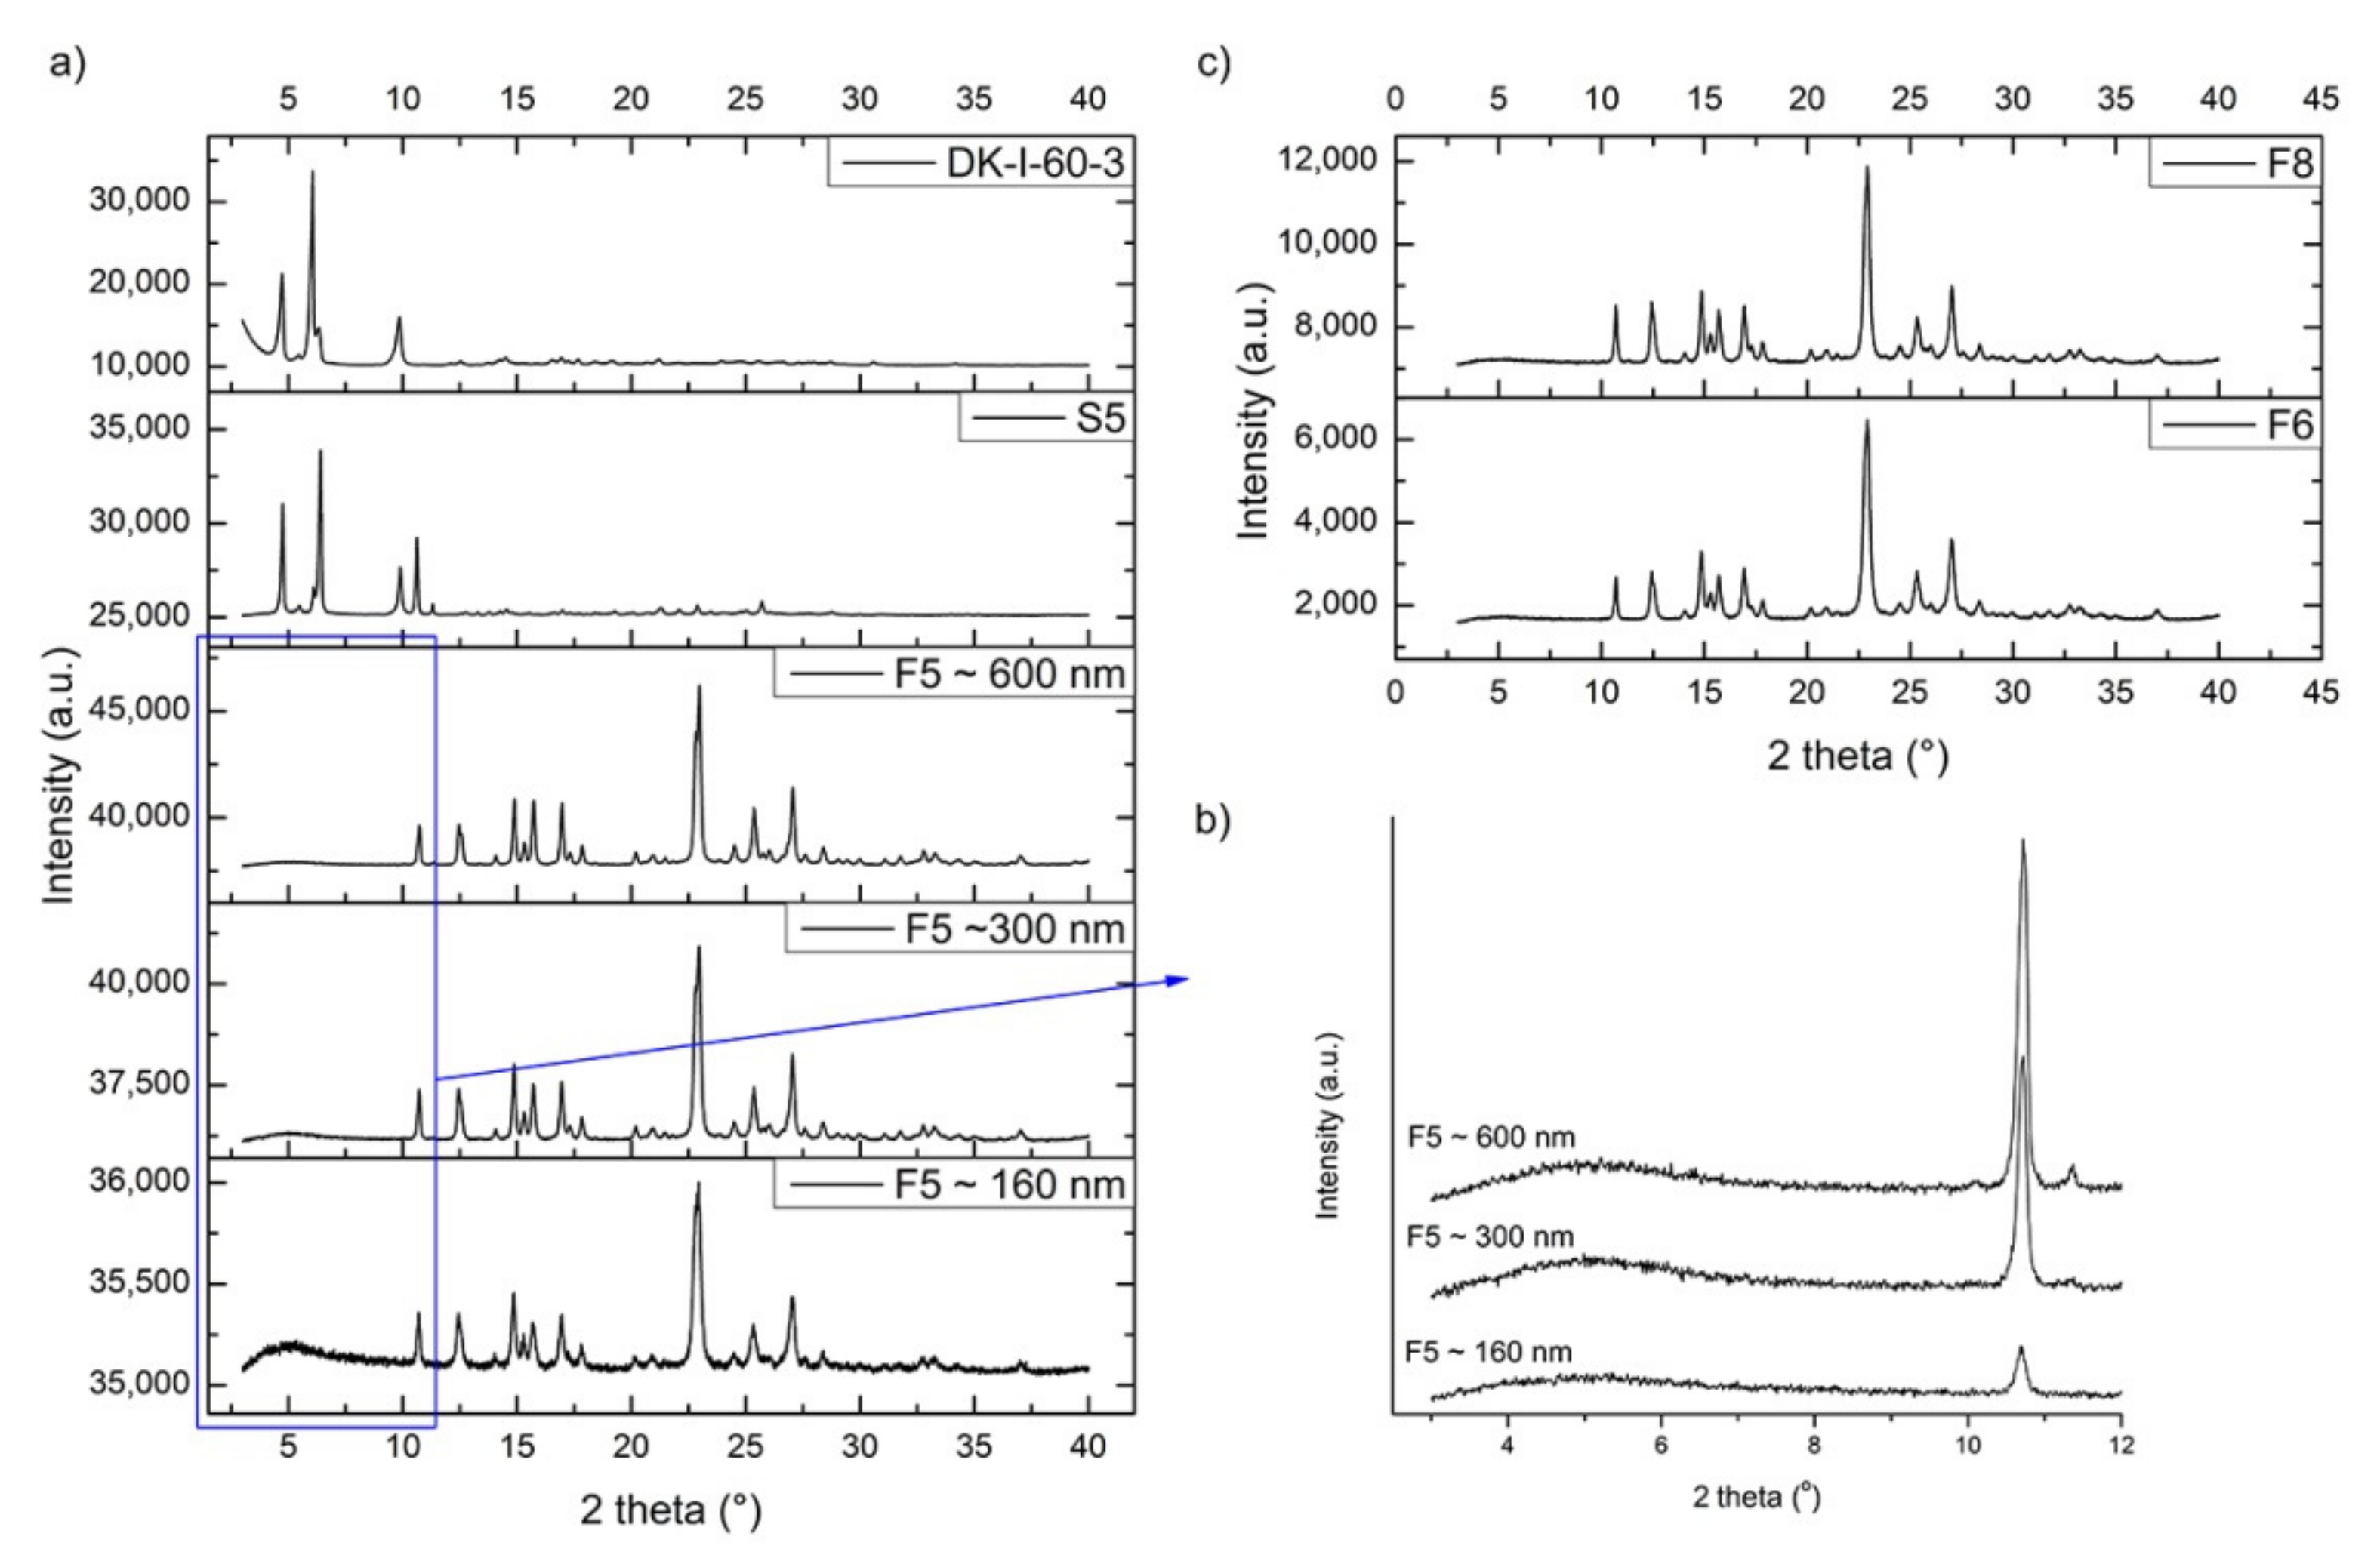
X-ray Powder Diffraction Analysis (XRPD)
Dissolution Study
Solubility of Nanocrystals
2.2.4. In Vivo Pharmacokinetic and Biodistribution Studies
2.2.5. Analytical Method
2.2.6. Statistical Analysis
3. Results and Discussion
3.1. Preformulation Studies
3.2. Nanocrystal Dispersions Preparation and Physicochemical Characterization
3.2.1. Process Parameters
3.2.2. Formulation Parameters
3.2.3. Stability Study
3.2.4. Atomic Force Microscopy (AFM)
3.2.5. Differential Scanning Calorimetry (DSC) and X-ray Powder Diffraction Analysis (XRPD)
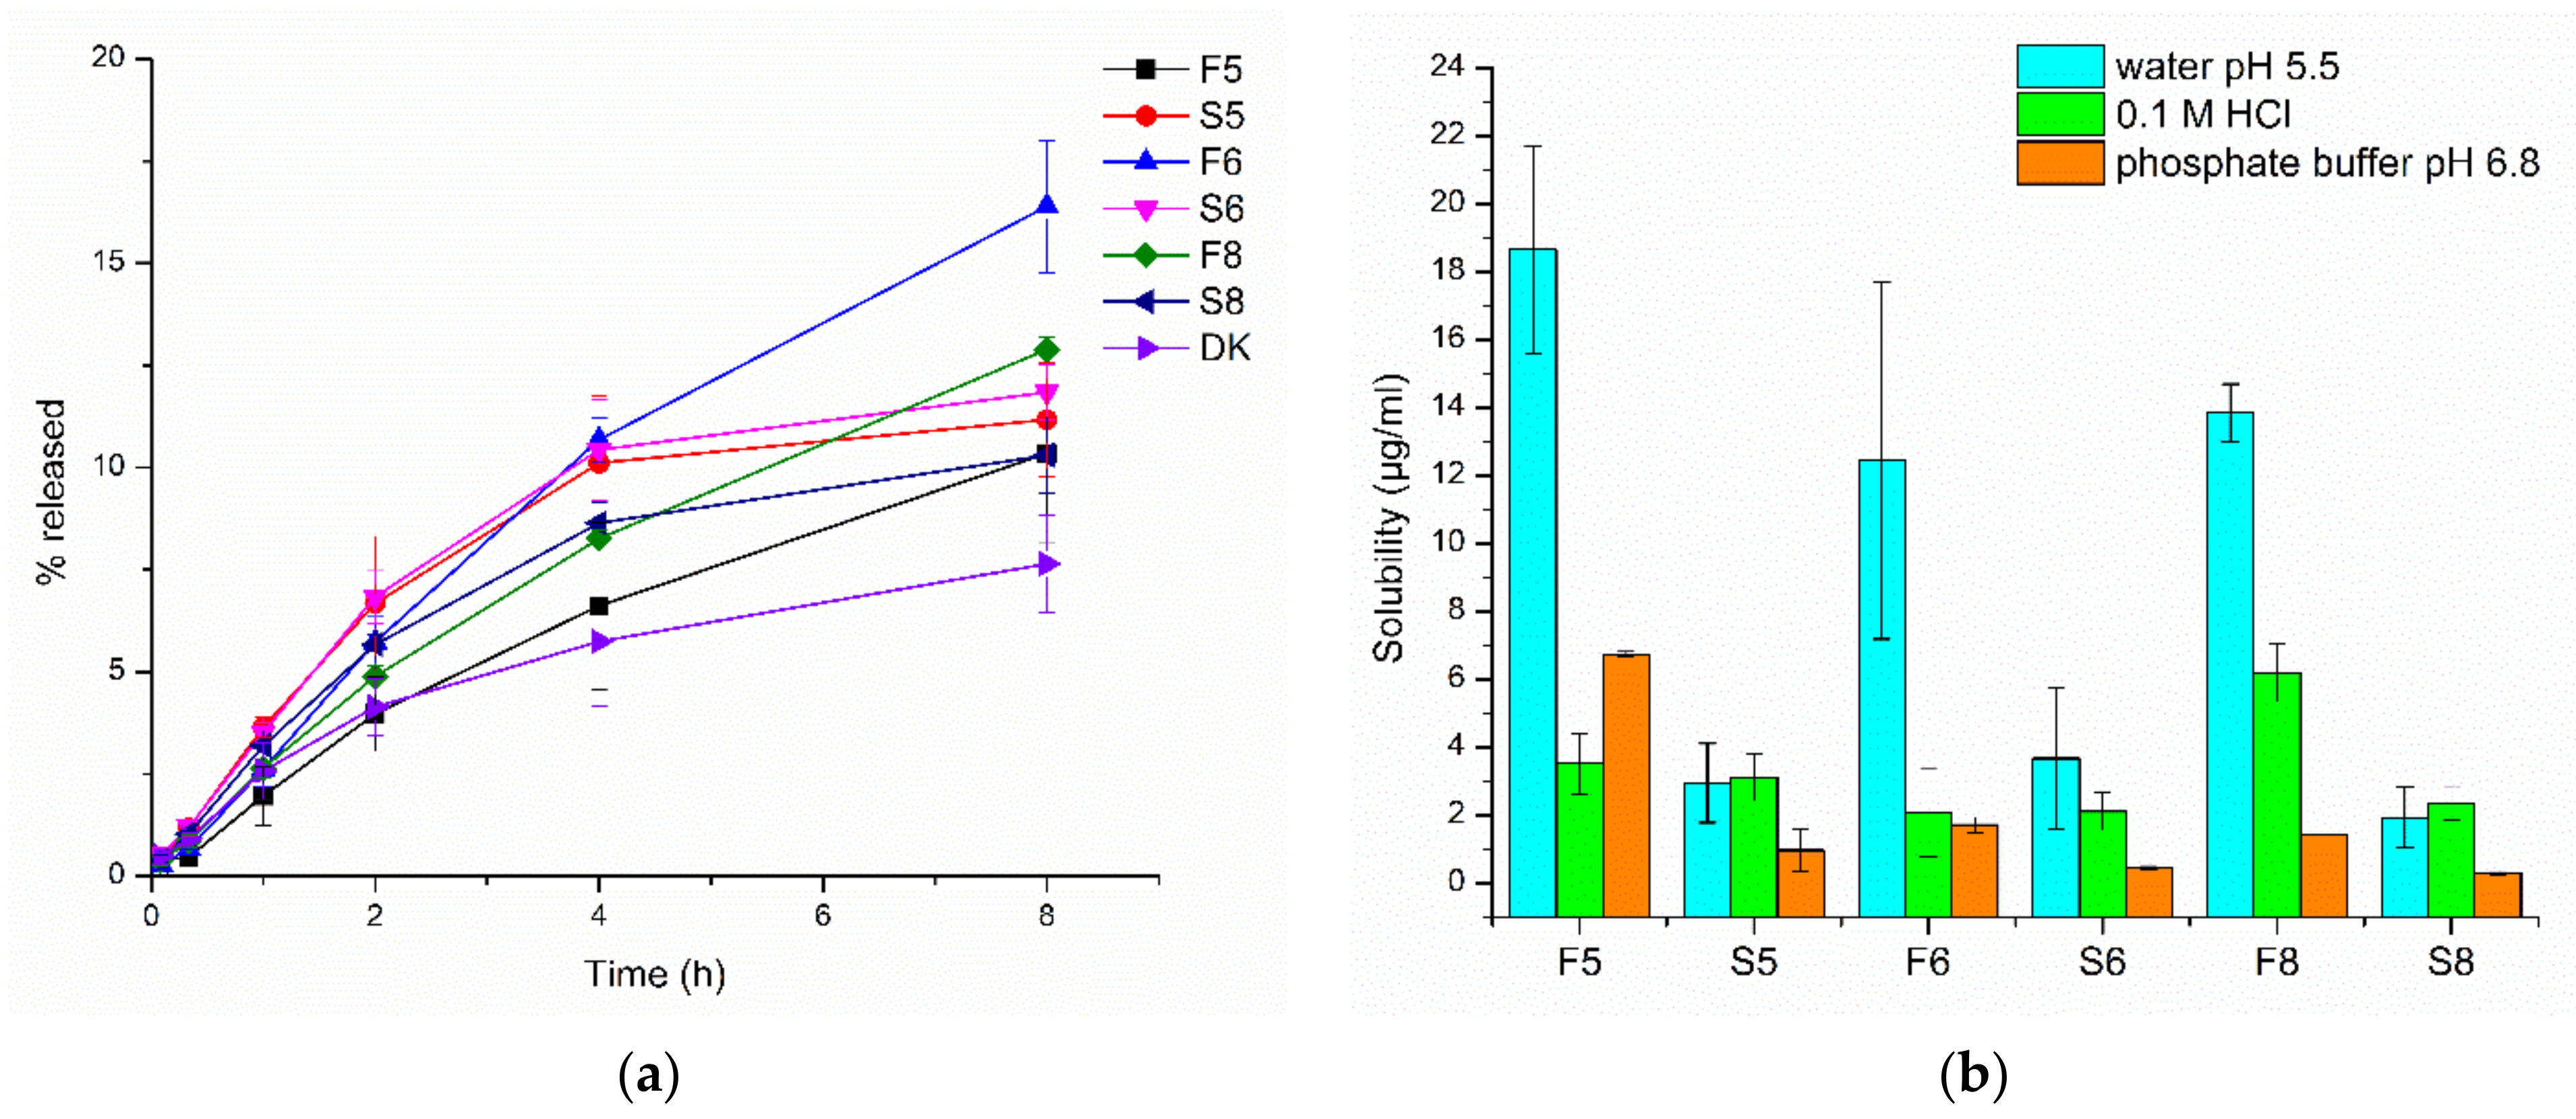
3.2.6. Dissolution Study and Solubility of Nanocrystals
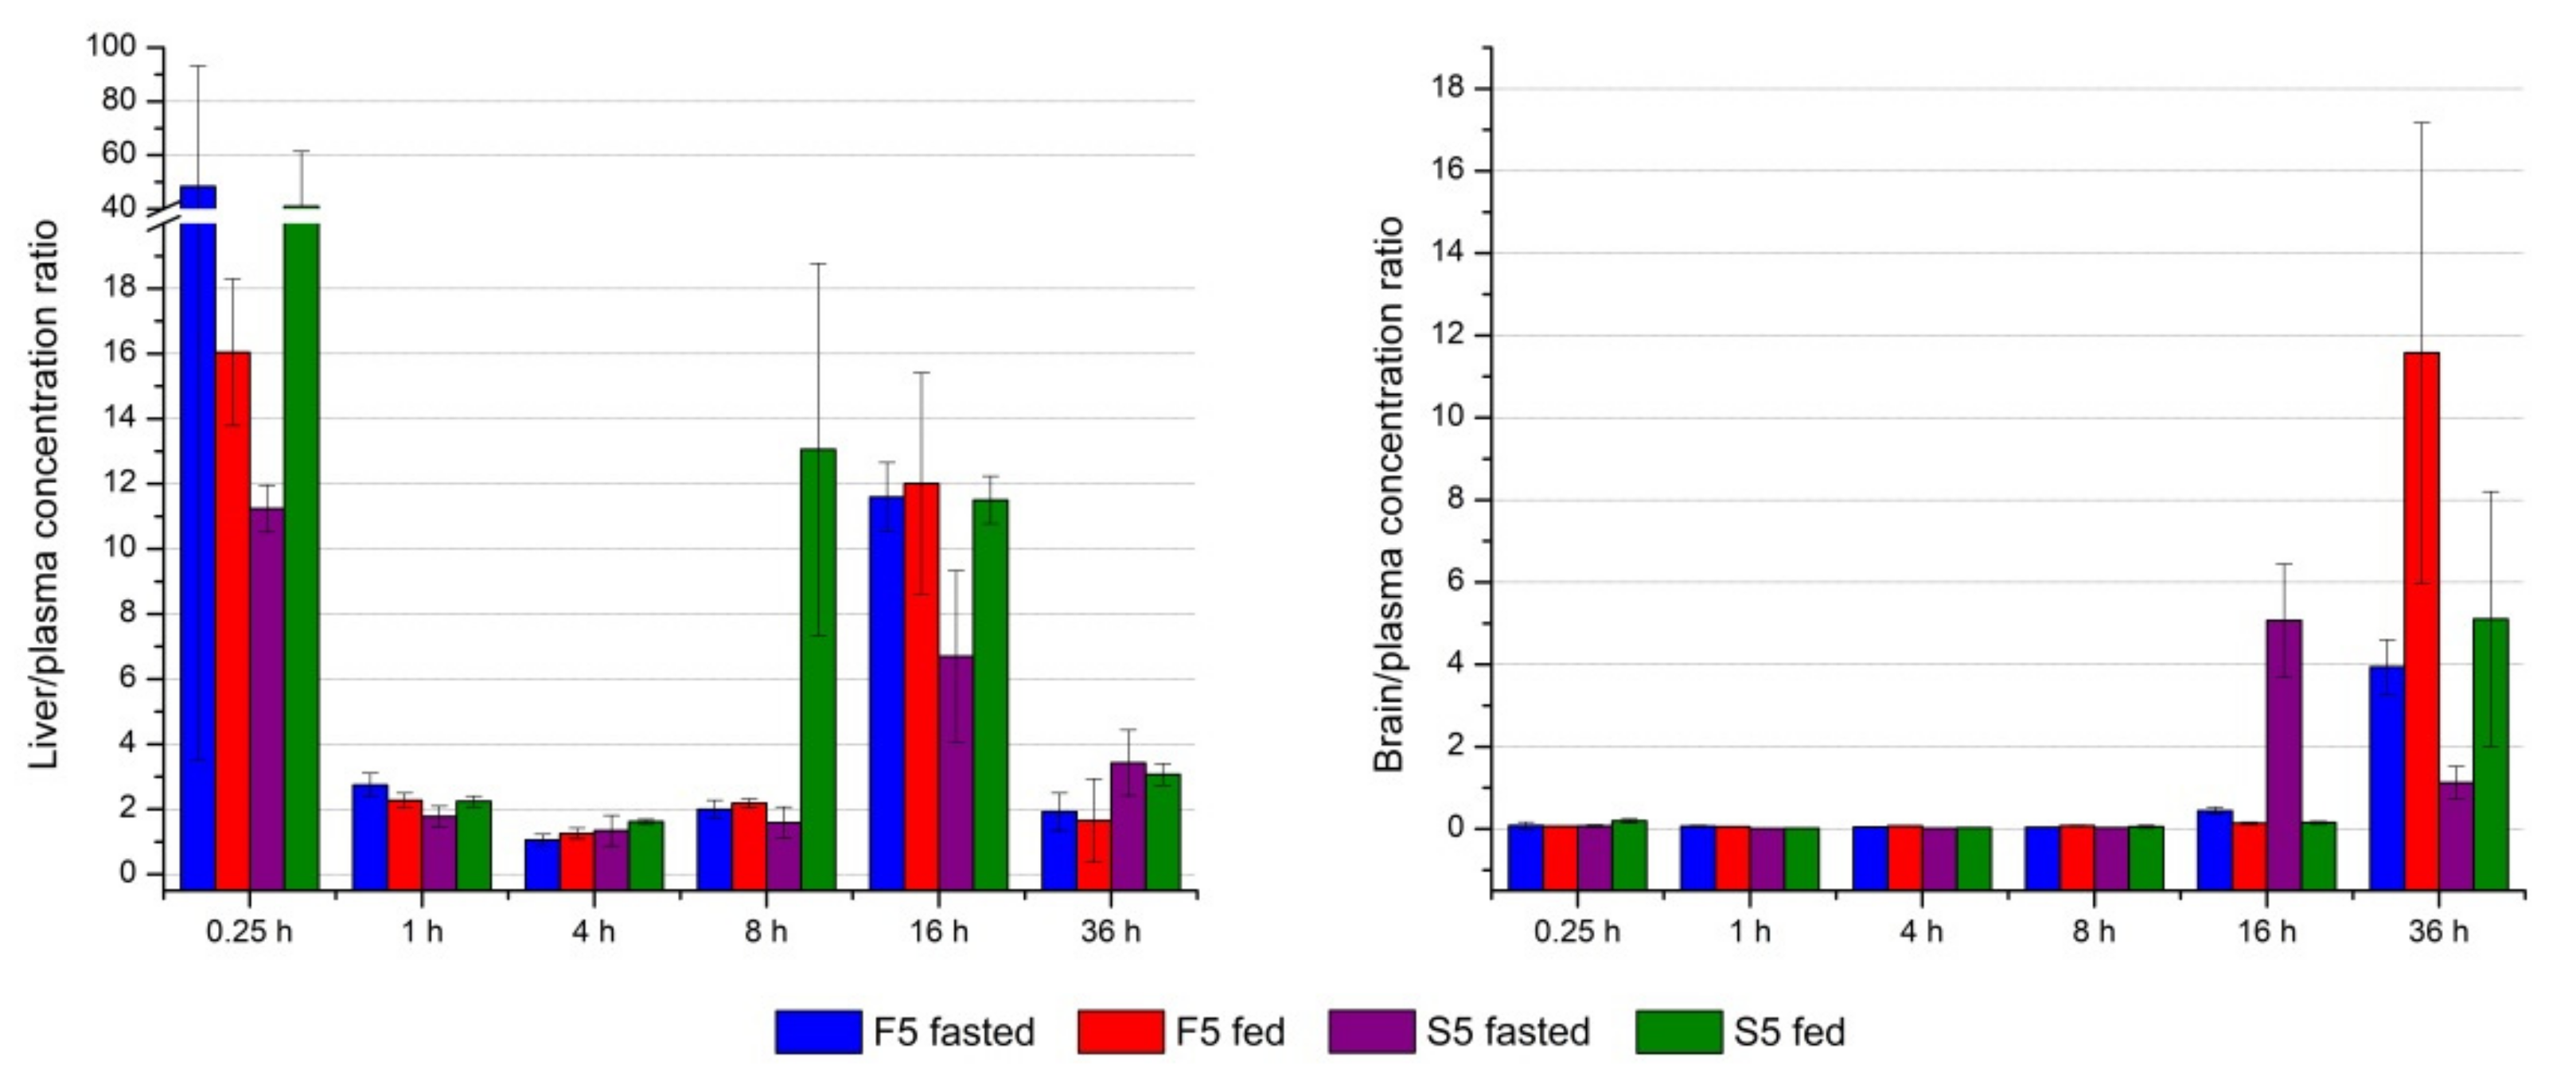
3.2.7. In Vivo Pharmacokinetic and Biodistribution Studies
4. Conclusions
Supplementary Materials
Author Contributions
Funding
Institutional Review Board Statement
Informed Consent Statement
Conflicts of Interest
References
- Peltonen, L.; Hirvonen, J. Drug nanocrystals–versatile option for formulation of poorly soluble materials. Int. J. Pharm. 2018, 537, 73–83. [Google Scholar] [CrossRef]
- Ayad, M.H. Rational formulation strategy from drug discovery profiling to human proof of concept. Drug Deliv. 2015, 22, 877–884. [Google Scholar] [CrossRef] [Green Version]
- Bergström, C.A.; Charman, W.N.; Porter, C.J. Computational prediction of formulation strategies for beyond-rule-of-5 compounds. Adv. Drug Del. Rev. 2016, 101, 6–21. [Google Scholar] [CrossRef] [PubMed]
- Möschwitzer, J.P. Drug nanocrystals in the commercial pharmaceutical development process. Int. J. Pharm. 2013, 453, 142–156. [Google Scholar] [CrossRef] [PubMed]
- Alhalaweh, A.; Alzghoul, A.; Kaialy, W.; Mahlin, D.; Bergström, C.A. Computational predictions of glass-forming ability and crystallization tendency of drug molecules. Mol. Pharm. 2014, 11, 3123–3132. [Google Scholar] [CrossRef] [PubMed]
- Kalepu, S.; Nekkanti, V. Insoluble drug delivery strategies: Review of recent advances and business prospects. Acta Pharm. Sin. B 2015, 5, 442–453. [Google Scholar] [CrossRef] [Green Version]
- Dening, T.J.; Rao, S.; Thomas, N.; Prestidge, C.A. Oral nanomedicine approaches for the treatment of psychiatric illnesses. J. Control Release 2016, 223, 137–156. [Google Scholar] [CrossRef] [PubMed]
- Peltonen, L.; Hirvonen, J. Pharmaceutical nanocrystals by nanomilling: Critical process parameters, particle fracturing and stabilization methods. J. Pharm. Pharmacol. 2010, 62, 1569–1579. [Google Scholar] [CrossRef]
- Chen, M.L.; John, M.; Lee, S.L.; Tyner, K.M. Development considerations for nanocrystal drug products. AAPS J. 2017, 19, 642–651. [Google Scholar] [CrossRef] [PubMed]
- Gao, L.; Liu, G.; Ma, J.; Wang, X.; Zhou, L.; Li, X. Drug nanocrystals: In vivo performances. J. Control Release 2012, 160, 418–430. [Google Scholar] [CrossRef] [PubMed]
- O’Shea, J.P.; Holm, R.; O’Driscoll, C.M.; Griffin, B.T. Food for thought: Formulating away the food effect—A PEARRL review. J. Pharm. Pharmacol. 2019, 71, 510–535. [Google Scholar] [CrossRef] [PubMed] [Green Version]
- Knutson, D.E.; Kodali, R.; Divović, B.; Treven, M.; Stephen, M.R.; Zahn, N.M.; Dobričić, V.; Huber, A.T.; Meirelles, M.A.; Verma, R.S.; et al. Design and synthesis of novel deuterated ligands functionally selective for the γ-aminobutyric acid type A receptor (GABAAR) α6 subtype with improved metabolic stability and enhanced bioavailability. J. Med. Chem. 2018, 61, 2422–2446. [Google Scholar] [CrossRef] [PubMed]
- Mitrović, J.R.; Divović, B.; Knutson, D.; Đoković, J.B.; Vulić, P.J.; Randjelović, D.V.; Dobričić, V.D.; Čalija, B.R.; Cook, J.M.; Savić, M.M.; et al. Nanocrystal dispersion of DK-I-56–1, a poorly soluble pyrazoloquinolinone positive modulator of α6 GABAA receptors: Formulation approach toward improved in vivo performance. Eur. J. Pharm. Sci. 2020, 152, 105432. [Google Scholar] [CrossRef] [PubMed]
- Baird, J.A.; Van Eerdenbrugh, B.; Taylor, L.S. A classification system to assess the crystallization tendency of organic molecules from undercooled melts. J. Pharm. Sci. 2010, 99, 3787–3806. [Google Scholar] [CrossRef]
- Van Eerdenbrugh, B.; Van den Mooter, G.; Augustijns, P. Top-down production of drug nanocrystals: Nanosuspension stabilization, miniaturization and transformation into solid products. Int. J. Pharm. 2008, 364, 64–75. [Google Scholar] [CrossRef]
- Siewert, C.; Moog, R.; Alex, R.; Kretzer, P.; Rothenhäusler, B. Process and scaling parameters for wet media milling in early phase drug development: A knowledge based approach. Eur. J. Pharm. Sci. 2018, 115, 126–131. [Google Scholar] [CrossRef]
- Wu, L.; Zhang, J.; Watanabe, W. Physical and chemical stability of drug nanoparticles. Adv. Drug Deliv. Rev. 2011, 63, 456–469. [Google Scholar] [CrossRef]
- Li, J.; Wang, Z.; Zhang, H.; Gao, J.; Zheng, A. Progress in the development of stabilization strategies for nanocrystal preparations. Drug Deliv. 2021, 28, 19–36. [Google Scholar] [CrossRef] [PubMed]
- Wang, Y.; Zheng, Y.; Zhang, L.; Wang, Q.; Zhang, D. Stability of nanosuspensions in drug delivery. J. Control Release 2013, 172, 1126–1141. [Google Scholar] [CrossRef]
- Pardeike, J.; Müller, R.H. Nanosuspensions: A promising formulation for the new phospholipase A2 inhibitor PX-18. Int. J. Pharm. 2010, 391, 322–329. [Google Scholar] [CrossRef] [PubMed]
- Bhattacharjee, S. DLS and zeta potential–what they are and what they are not? J. Control Release 2016, 235, 337–351. [Google Scholar] [CrossRef]
- Caputo, F.; Clogston, J.; Calzolai, L.; Rösslein, M.; Prina-Mello, A. Measuring particle size distribution of nanoparticle enabled medicinal products, the joint view of EUNCL and NCI-NCL. A step by step approach combining orthogonal measurements with increasing complexity. J. Control Release 2019, 299, 31–43. [Google Scholar] [CrossRef]
- Medarević, D.; Djuriš, J.; Ibrić, S.; Mitrić, M.; Kachrimanis, K. Optimization of formulation and process parameters for the production of carvedilol nanosuspension by wet media milling. Int. J. Pharm. 2018, 540, 150–161. [Google Scholar] [CrossRef]
- Yang, H.; Teng, F.; Wang, P.; Tian, B.; Lin, X.; Hu, X.; Zhang, L.; Zhang, K.; Zhang, Y.; Tang, X. Investigation of a nanosuspension stabilized by Soluplus® to improve bioavailability. Int. J. Pharm. 2014, 477, 88–95. [Google Scholar] [CrossRef] [PubMed]
- Peltonen, L.; Strachan, C.J. Degrees of order: A comparison of nanocrystal and amorphous solids for poorly soluble drugs. Int. J. Pharm. 2020, 586, 119492. [Google Scholar] [CrossRef] [PubMed]
- Bates, S.; Zografi, G.; Engers, D.; Morris, K.; Crowley, K.; Newman, A. Analysis of amorphous and nanocrystalline solids from their X-ray diffraction patterns. Pharm. Res. 2006, 23, 2333–2349. [Google Scholar] [CrossRef] [PubMed]
- Liu, P.; De Wulf, O.; Laru, J.; Heikkilä, T.; van Veen, B.; Kiesvaara, J.; Hirvonen, J.; Peltonen, L.; Laaksonen, T. Dissolution studies of poorly soluble drug nanosuspensions in non-sink conditions. AAPS Pharmscitech. 2013, 14, 748–756. [Google Scholar] [CrossRef] [Green Version]
- Moreno-Bautista, G.; Tam, K.C. Evaluation of dialysis membrane process for quantifying the in vitro drug-release from colloidal drug carriers. Colloids Surf. A Physicochem. Eng. Asp. 2011, 389, 299–303. [Google Scholar] [CrossRef]
- Sawant, K.K.; Patel, M.H.; Patel, K. Cefdinir nanosuspension for improved oral bioavailability by media milling technique: Formulation, characterization and in vitro–in vivo evaluations. Drug Dev. Ind. Pharm. 2016, 42, 758–768. [Google Scholar] [CrossRef]
- Müller, R.H.; Gohla, S.; Keck, C.M. State of the art of nanocrystals–special features, production, nanotoxicology aspects and intracellular delivery. Eur. J. Pharm. Biopharm. 2011, 78, 1–9. [Google Scholar] [CrossRef]
- Liversidge, G.G.; Cundy, K.C. Particle size reduction for improvement of oral bioavailability of hydrophobic drugs: I. Absolute oral bioavailability of nanocrystalline danazol in beagle dogs. Int. J. Pharm. 1995, 125, 91–97. [Google Scholar] [CrossRef]
- Mou, D.; Chen, H.; Wan, J.; Xu, H.; Yang, X. Potent dried drug nanosuspensions for oral bioavailability enhancement of poorly soluble drugs with pH-dependent solubility. Int. J. Pharm. 2011, 413, 237–244. [Google Scholar] [CrossRef] [PubMed]
- Imono, M.; Uchiyama, H.; Yoshida, S.; Miyazaki, S.; Tamura, N.; Tsutsumimoto, H.; Kadota, K.; Tozuka, Y. The elucidation of key factors for oral absorption enhancement of nanocrystal formulations: In vitro–in vivo correlation of nanocrystals. Eur. J. Pharm. Biopharm. 2020, 146, 84–92. [Google Scholar] [CrossRef] [PubMed]
- Sjögren, E.; Abrahamsson, B.; Augustijns, P.; Becker, D.; Bolger, M.B.; Brewster, M.; Brouwers, J.; Flanagan, T.; Harwood, M.; Heinen, C.; et al. In vivo methods for drug absorption–comparative physiologies, model selection, correlations with in vitro methods (IVIVC), and applications for formulation/API/excipient characterization including food effects. Eur. J. Pharm. Sci. 2014, 57, 99–151. [Google Scholar] [CrossRef] [PubMed]
- Lu, Y.; Lv, Y.; Li, T. Hybrid drug nanocrystals. Adv. Drug Deliv. Rev. 2019, 143, 115–133. [Google Scholar] [CrossRef] [PubMed]
- Daniel, W.A. Mechanisms of cellular distribution of psychotropic drugs. Significance for drug action and interactions. Prog. Neuropsychopharmacol. Biol. Psychiatry 2003, 27, 65–73. [Google Scholar] [CrossRef]


| Formulation | DK-I-60-3 (% w/w) | SLS (% w/w) | PVP (% w/w) | Water (% w/w) | SLS:PVP Ratio |
|---|---|---|---|---|---|
| F1 | 0.20 | 0.02 | 0.20 | to 100 | 1:10 |
| F2 | 0.20 | 0.02 | 0.08 | to 100 | 1:4 |
| F3 | 0.20 | 0.02 | 0.04 | to 100 | 1:2 |
| F4 | 0.20 | 0.02 | 0.02 | to 100 | 1:1 |
| F5 | 0.20 | 0.05 | 0.50 | to 100 | 1:10 |
| F6 | 0.20 | 0.05 | 0.20 | to 100 | 1:4 |
| F7 | 0.20 | 0.05 | 0.10 | to 100 | 1:2 |
| F8 | 0.20 | 0.05 | 0.05 | to 100 | 1:1 |
| Solvent | Solubility (µg/mL) |
|---|---|
| Water (pH 5.23) | 6.34 ± 1.14 |
| 0.1 M HCl (pH 1.2) | 7.21 ± 0.40 |
| Phosphate buffer (pH 6.8) | 7.75 ± 1.09 |
| Medium-chain tryglycerides | 50.33 ± 7.19 |
| Soybean oil | 13.81 ± 0.69 |
| Castor oil | 57.96 ± 1.79 |
| Benzyl alcohol | 10,373.53 ± 371.41 |
| Polyethylene glycol 400 | 8224.72 ± 103.20 |
| Isopropanol | 1009.41 ± 19.50 |
| Methanol | 802.86 ± 103.43 |
| Ethanol, 96%, v/v | 1807.70 ± 21.67 |
| Dimethyl sulfoxide | 166,495.77 ± 4075.05 |
| Formulation | Milling Media Volume (%, v/v) | z-Ave (nm) | PDI | ZP (mV) |
|---|---|---|---|---|
| 60 | 195.8 ± 1.7 | 0.238 ± 0.029 | ||
| F1 | 40 | 236.7 ± 1.9 | 0.208 ± 0.002 | −17.5 ± 1.6 |
| 20 | 233.6 ± 2.7 | 0.260 ± 0.007 | ||
| F2 | 60 | 137.7 ± 2.2 | 0.226 ± 0.015 | |
| 40 | 165.5 ± 4.3 | 0.226 ± 0.011 | −16.8 ± 0.5 | |
| 20 | 229.9 ± 4.9 | 0.205 ± 0.012 | ||
| F3 | 60 | 235.1 ± 4.2 | 0.273 ± 0.044 | |
| 40 | 239.3 ± 3.3 | 0.251 ± 0.017 | −28.0 ± 1.2 | |
| 20 | 298.6 ± 9.1 | 0.301 ± 0.019 | ||
| F4 | 60 | 155.6 ± 2.3 | 0.258 ± 0.040 | |
| 40 | 176.0 ± 3.1 | 0.250 ± 0.040 | −19.2 ± 0.7 | |
| 20 | 233.1 ± 6.2 | 0.277 ± 0.016 | ||
| F5 | 60 | 148.7 ± 2.5 | 0.231 ± 0.010 | |
| 40 | 174.1 ± 0.6 | 0.231 ± 0.015 | −21.8 ± 5.6 | |
| 20 | 222.8 ± 3.3 | 0.253 ± 0.021 | ||
| F6 | 60 | 138.7 ± 2.3 | 0.225 ± 0.011 | |
| 40 | 153.1 ± 1.8 | 0.197 ± 0.021 | −31.9 ± 1.8 | |
| 20 | 185.3 ± 1.5 | 0.179 ± 0.012 | ||
| F7 | 60 | 151.6 ± 4.3 | 0.206 ± 0.012 | |
| 40 | 170.2 ± 2.4 | 0.220 ± 0.008 | −36.8 ± 1.1 | |
| 20 | 214.2 ± 5.5 | 0.205 ± 0.022 | ||
| F8 | 60 | 143.6 ± 1.4 | 0.231 ± 0.006 | |
| 40 | 160.4 ± 3.1 | 0.208 ± 0.014 | −38.1 ± 1.9 | |
| 20 | 182.7 ± 1.2 | 0.202 ± 0.011 |
| Formulation | z-Ave (nm) | PDI | ZP (mV) | |||
|---|---|---|---|---|---|---|
| 1 Month | 3 Months | 1 Month | 3 Months | 1 Month | 3 Months | |
| F5 | 183.5 ± 4.2 | 181.2 ± 3.3 | 0.227 ± 0.024 | 0.212 ± 0.008 | −18.0 ± 0.3 | −20.7 ± 1.5 |
| F6 | 162.2 ± 4.2 | 161.8 ± 5.1 | 0.204 ± 0.007 | 0.212 ± 0.010 | −35.3 ± 1.2 | −30.4 ± 0.8 |
| F7 | 212.0 ± 5.3 | 214.2 ± 5.9 | 0.238 ± 0.004 | 0.220 ± 0.005 | −36.7 ± 1.1 | −40.7 ± 1.1 |
| F8 | 175.4 ± 4.1 | 175.8 ± 5.2 | 0.208 ± 0.021 | 0.257 ± 0.081 | −41.8 ± 2.6 | −38.3 ± 1.0 |
Publisher’s Note: MDPI stays neutral with regard to jurisdictional claims in published maps and institutional affiliations. |
© 2021 by the authors. Licensee MDPI, Basel, Switzerland. This article is an open access article distributed under the terms and conditions of the Creative Commons Attribution (CC BY) license (https://creativecommons.org/licenses/by/4.0/).
Share and Cite
Mitrović, J.R.; Divović-Matović, B.; Knutson, D.E.; Đoković, J.B.; Kremenović, A.; Dobričić, V.D.; Randjelović, D.V.; Pantelić, I.; Cook, J.M.; Savić, M.M.; et al. Overcoming the Low Oral Bioavailability of Deuterated Pyrazoloquinolinone Ligand DK-I-60-3 by Nanonization: A Knowledge-Based Approach. Pharmaceutics 2021, 13, 1188. https://0-doi-org.brum.beds.ac.uk/10.3390/pharmaceutics13081188
Mitrović JR, Divović-Matović B, Knutson DE, Đoković JB, Kremenović A, Dobričić VD, Randjelović DV, Pantelić I, Cook JM, Savić MM, et al. Overcoming the Low Oral Bioavailability of Deuterated Pyrazoloquinolinone Ligand DK-I-60-3 by Nanonization: A Knowledge-Based Approach. Pharmaceutics. 2021; 13(8):1188. https://0-doi-org.brum.beds.ac.uk/10.3390/pharmaceutics13081188
Chicago/Turabian StyleMitrović, Jelena R., Branka Divović-Matović, Daniel E. Knutson, Jelena B. Đoković, Aleksandar Kremenović, Vladimir D. Dobričić, Danijela V. Randjelović, Ivana Pantelić, James M. Cook, Miroslav M. Savić, and et al. 2021. "Overcoming the Low Oral Bioavailability of Deuterated Pyrazoloquinolinone Ligand DK-I-60-3 by Nanonization: A Knowledge-Based Approach" Pharmaceutics 13, no. 8: 1188. https://0-doi-org.brum.beds.ac.uk/10.3390/pharmaceutics13081188