
Artificial Neural Networks to Predict the Apparent Degree of Supersaturation in Supersaturated Lipid-Based Formulations: A Pilot Study

 , and
, and
Abstract
: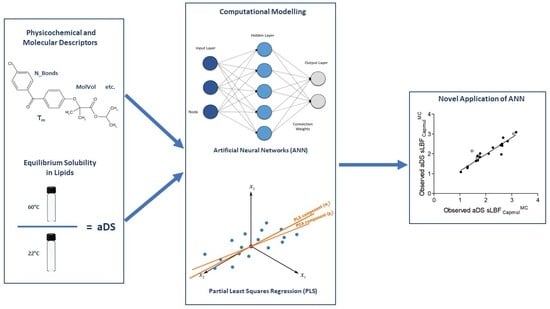
1. Introduction
2. Materials and Methods
2.1. Chemicals and Materials
2.2. Formulations
2.3. Dataset Selection/Drug Physiochemical and Molecular Properties
2.4. Equilibrium Solubility Determination
2.5. Apparent Degree of Supersaturation (aDS)
2.6. Differential Scanning Calorimetry
2.7. Statistical Analysis
2.8. Partial Least Squares Regression (PLS)
2.9. Artificial Neural Networks (ANNs)
3. Results
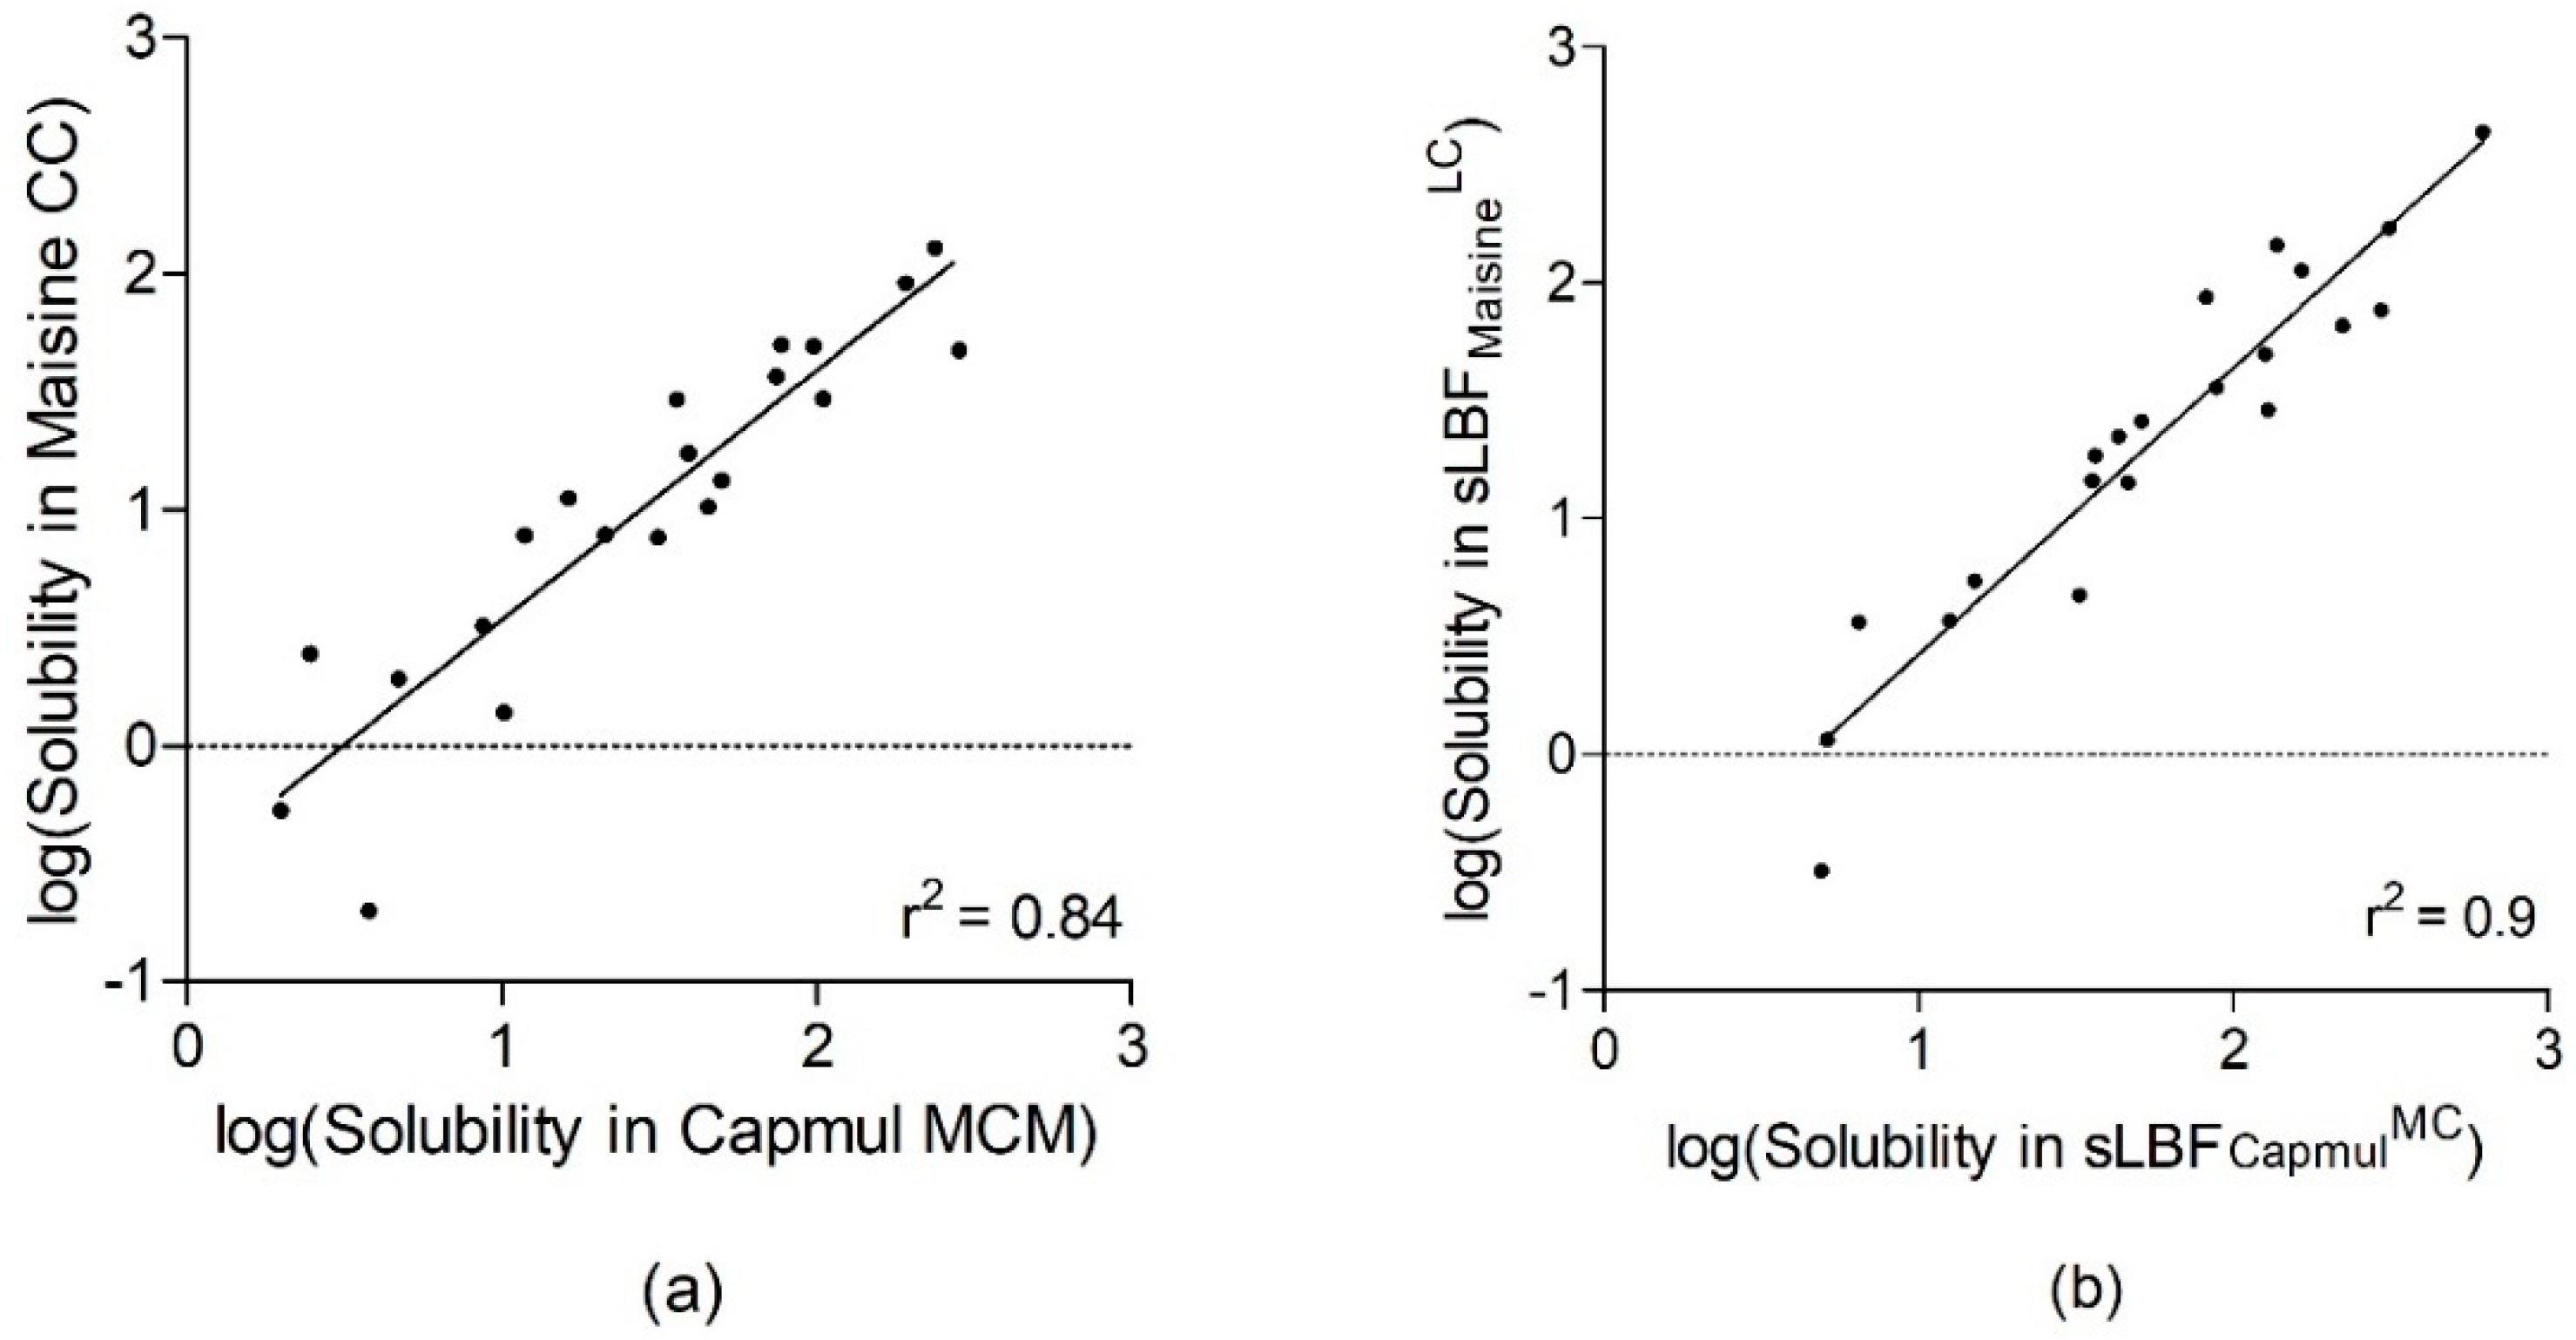
3.1. Comparing the Solubility of MC- and LC-based LBFs and sLBFs
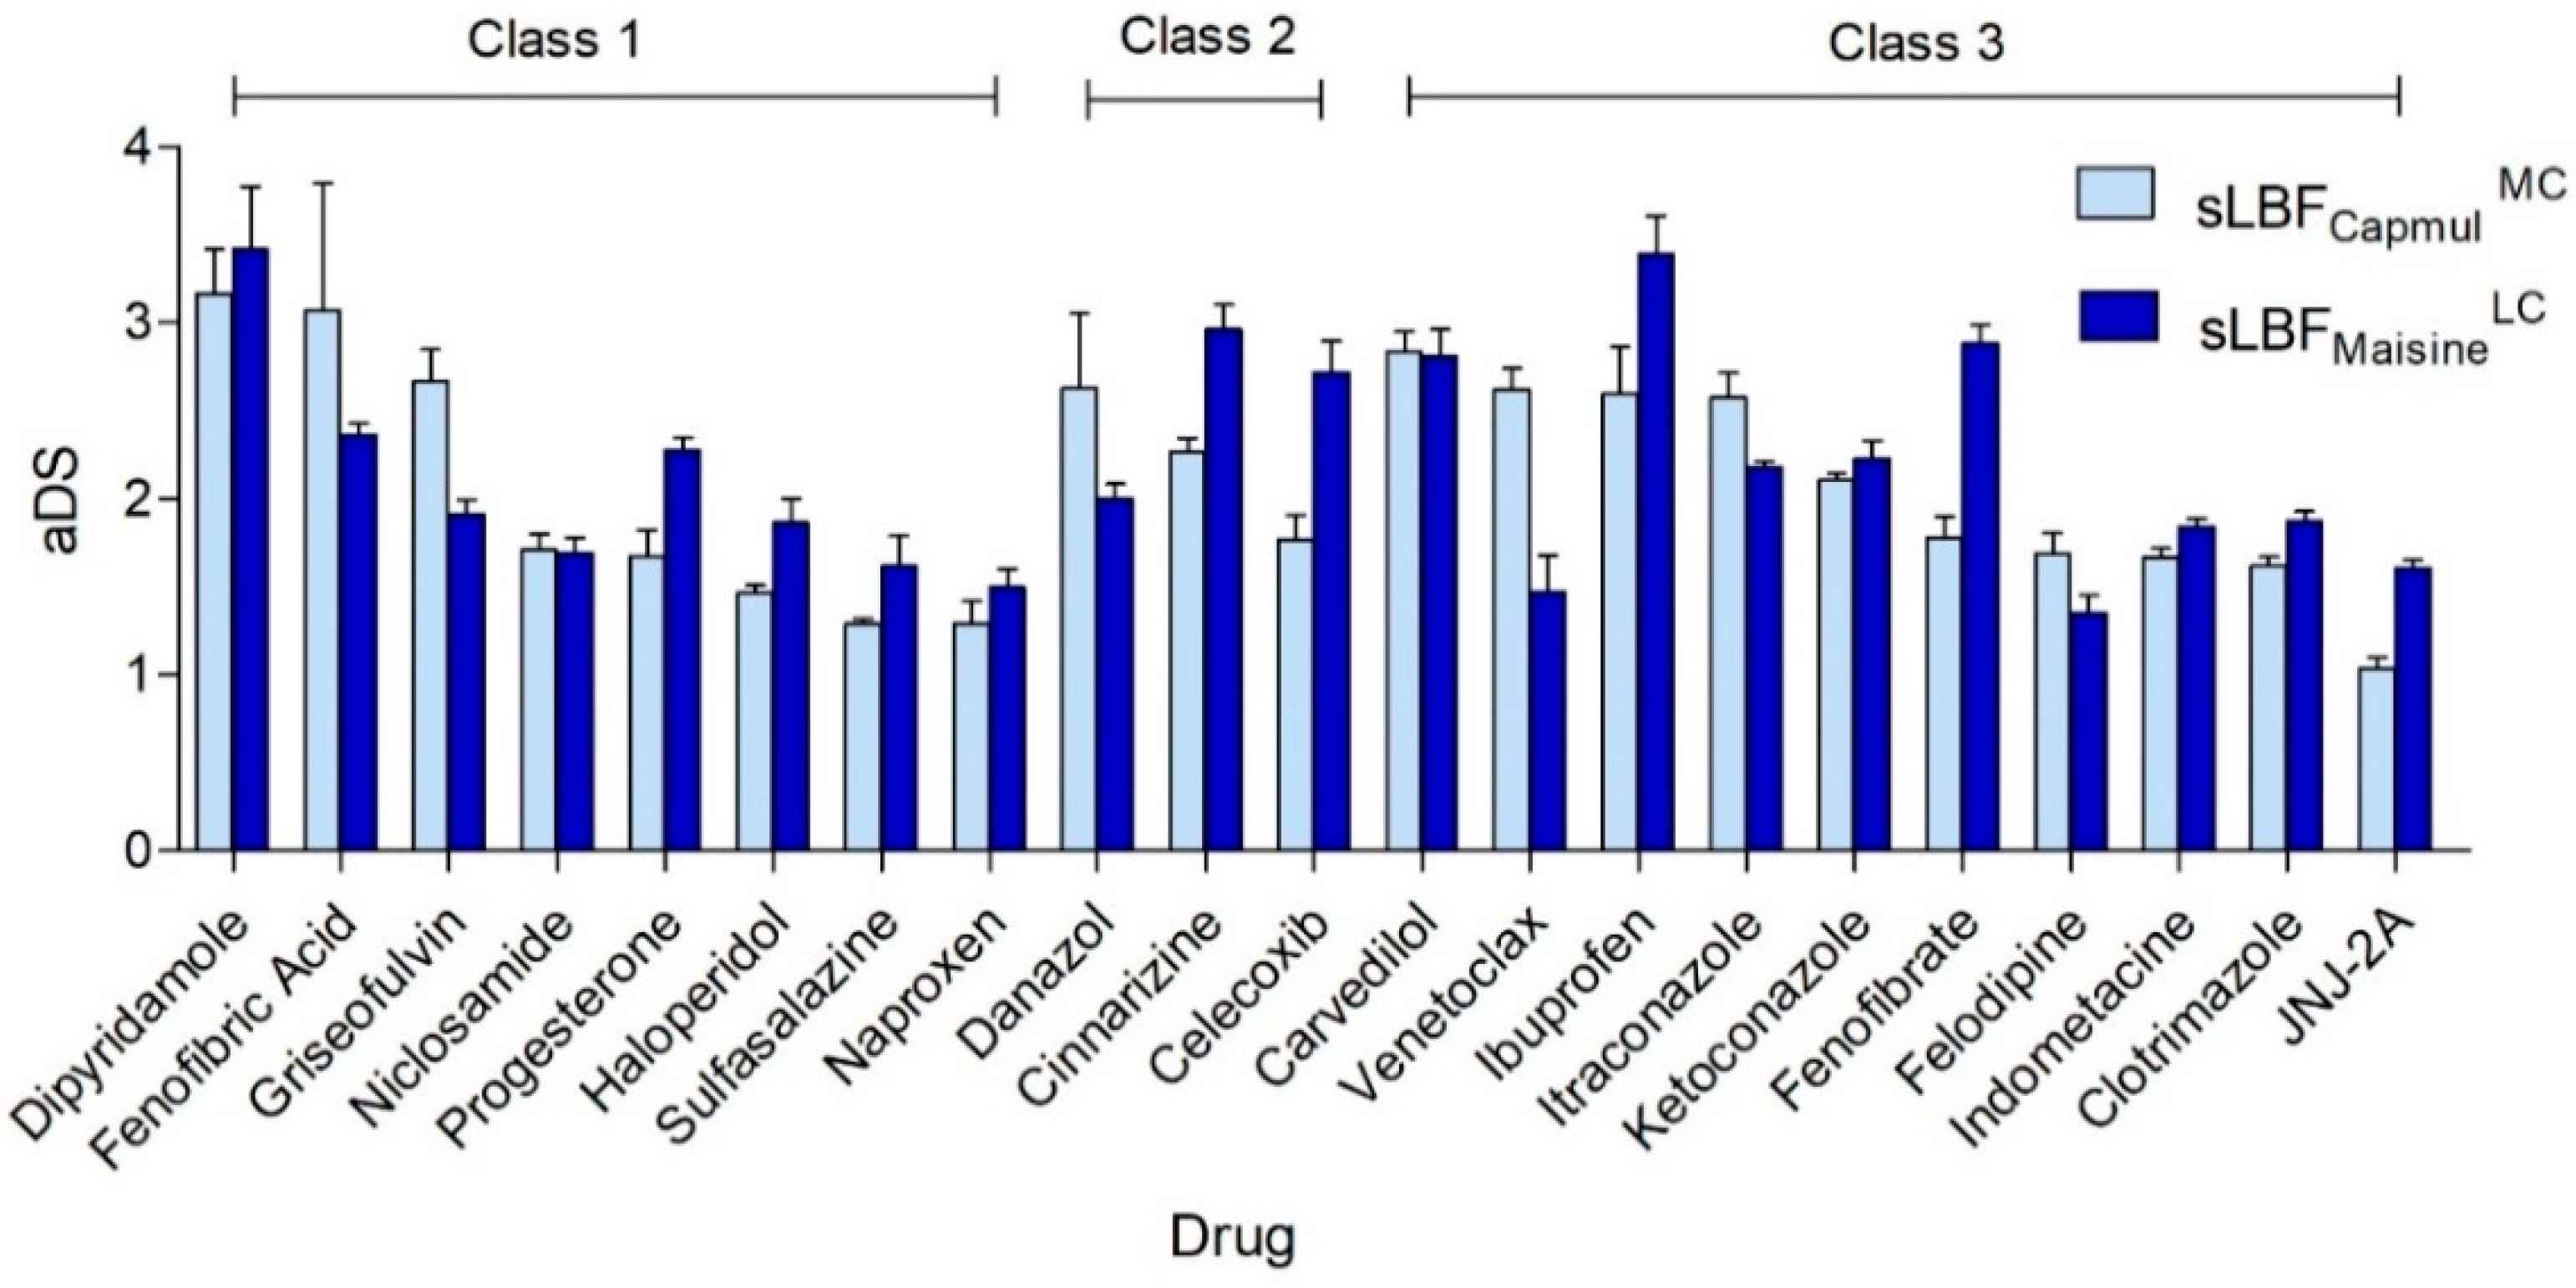
3.2. Apparent Degree of Supersaturation
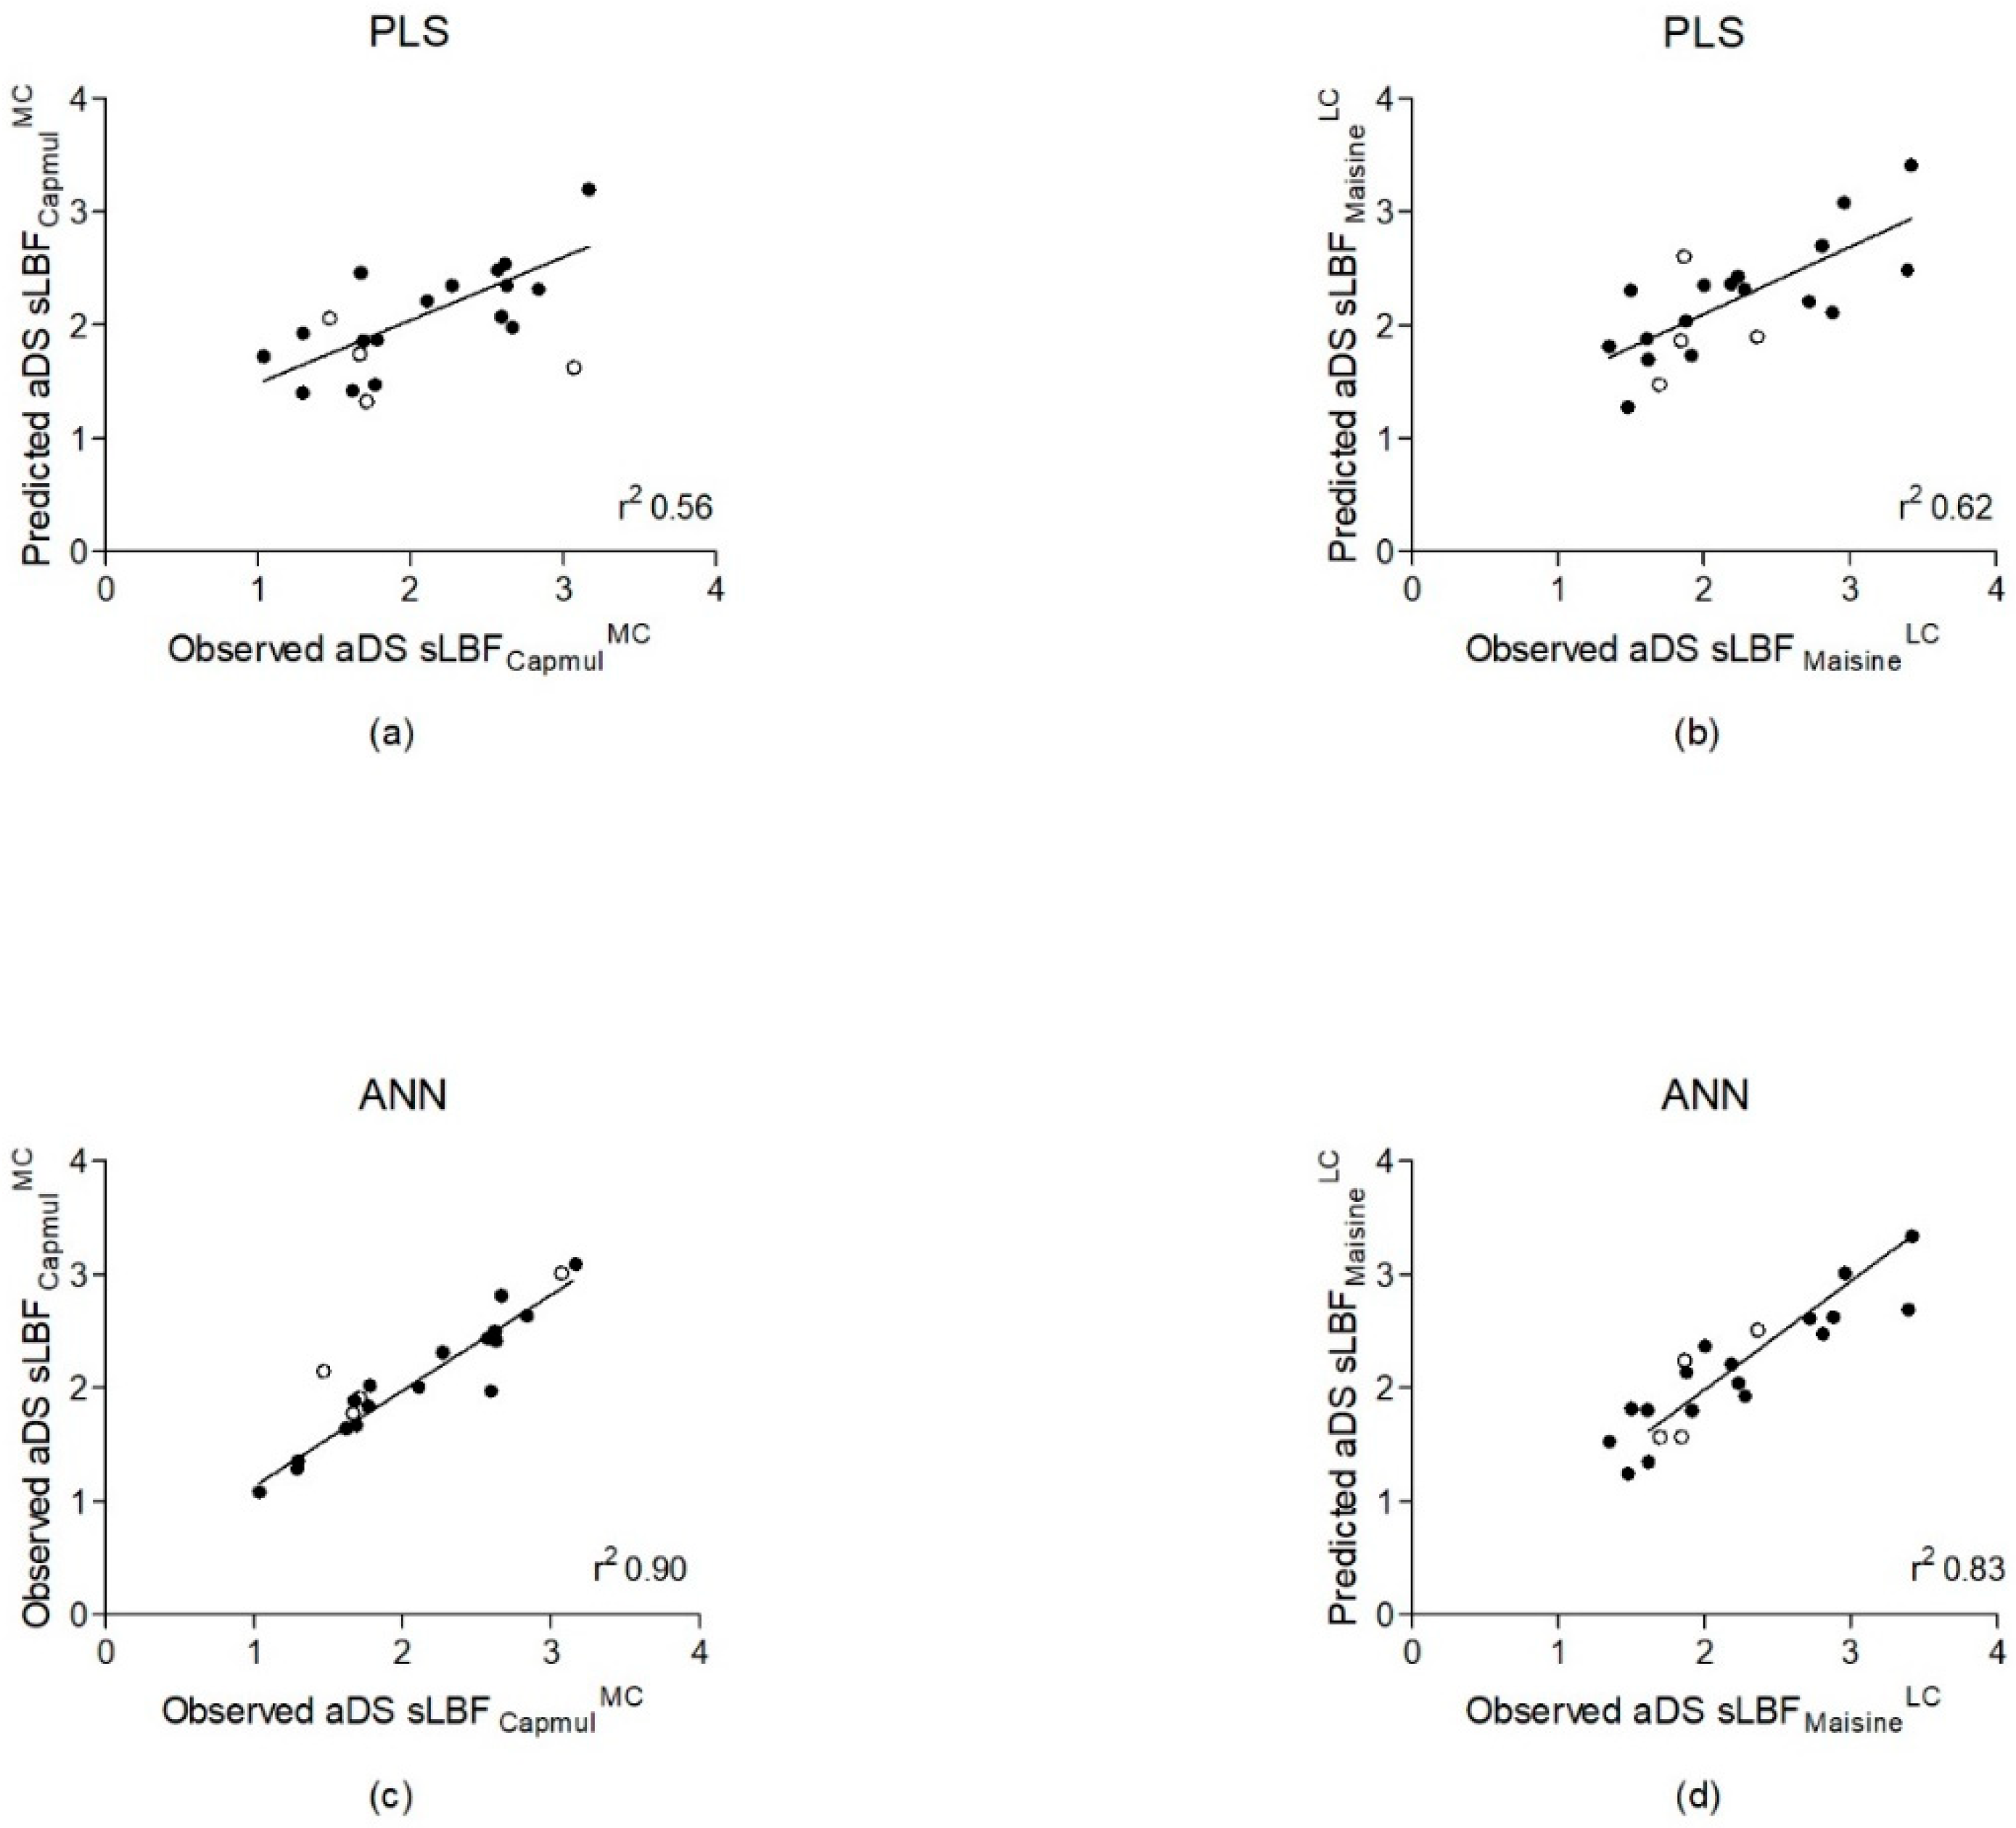
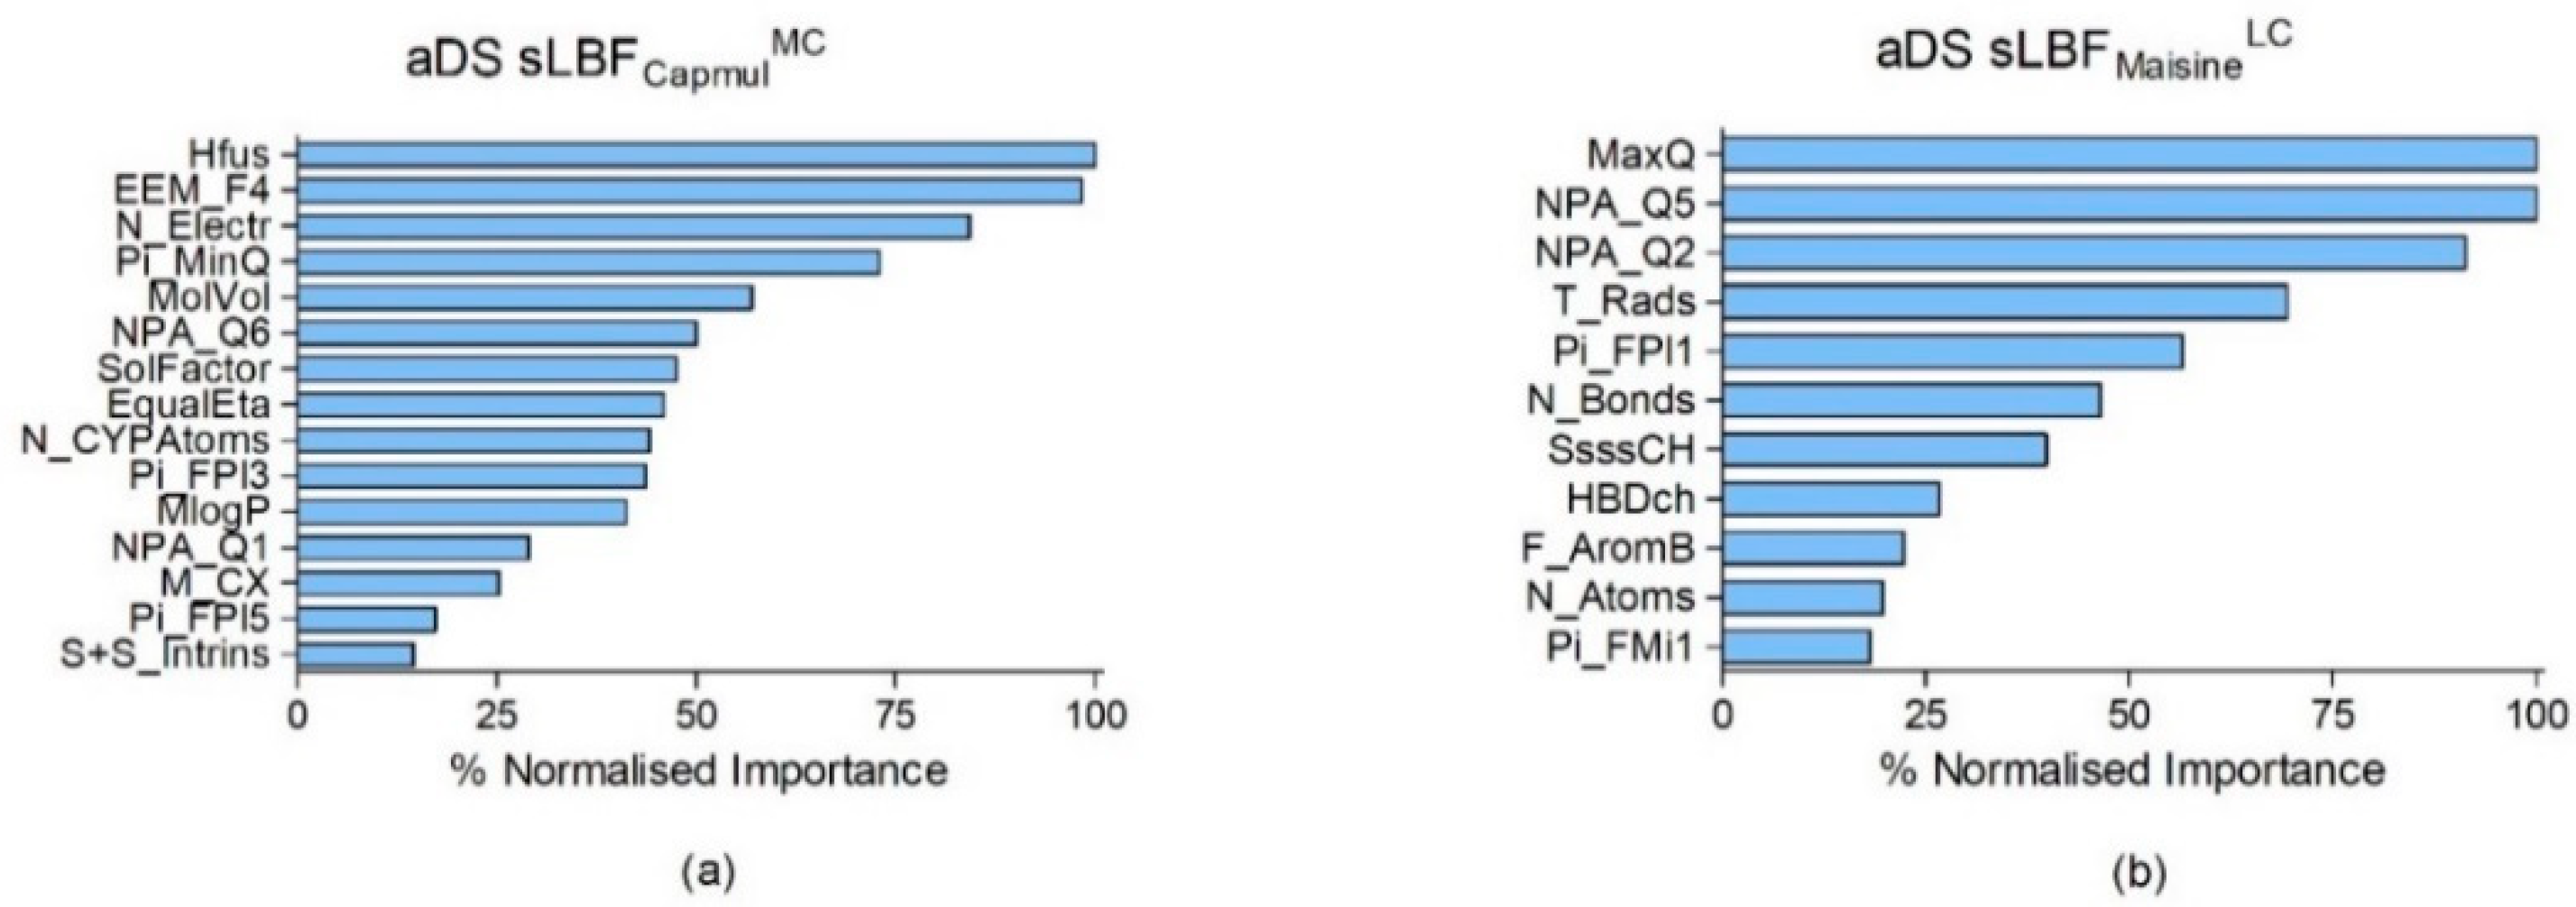
3.3. Quantitatively Predicting aDS Using PLS and ANNs
4. Discussion
5. Conclusions
Supplementary Materials
Author Contributions
Funding
Data Availability Statement
Acknowledgments
Conflicts of Interest
References
- Kuentz, M.; Holm, R.; Elder, D.P. Methodology of oral formulation selection in the pharmaceutical industry. Eur. J. Pharm. Sci. 2016, 87, 136–163. [Google Scholar] [CrossRef] [PubMed]
- Kuentz, M.; Holm, R.; Kronseder, C.; Saal, C.; Griffin, B.T. Rational Selection of Bio-Enabling Oral Drug Formulations–A PEARRL Commentary. J. Pharm. Sci. 2021, 110, 1921–1930. [Google Scholar] [CrossRef] [PubMed]
- Bergstrom, C.A.S.; Charman, W.N.; Porter, C.J.H. Computational prediction of formulation strategies for beyond-rule-of-5 compounds. Adv. Drug Deliv. Rev. 2016, 101, 6–21. [Google Scholar] [CrossRef] [PubMed]
- Zhuang, X.; Lu, C. PBPK modeling and simulation in drug research and development. Acta Pharm. Sin. B 2016, 6, 430–440. [Google Scholar] [CrossRef] [PubMed] [Green Version]
- Rane, S.S.; Anderson, B.D. What determines drug solubility in lipid vehicles: Is it predictable? Adv. Drug Deliv. Rev. 2008, 60, 638–656. [Google Scholar] [CrossRef] [PubMed]
- Niederquell, A.; Wyttenbach, N.; Kuentz, M. New prediction methods for solubility parameters based on molecular sigma profiles using pharmaceutical materials. Int. J. Pharm. 2018, 546, 137–144. [Google Scholar] [CrossRef]
- DeBoyace, K.; Wildfong, P.L. The Application of Modeling and Prediction to the Formation and Stability of Amorphous Solid Dispersions. J. Pharm. Sci. 2018, 107, 57–74. [Google Scholar] [CrossRef] [Green Version]
- Birru, W.A.; Warren, D.B.; Han, S.; Benameur, H.; Porter, C.J.; Pouton, C.W.; Chalmers, D.K. Computational Models of the Gastrointestinal Environment. Phase Behavior and Drug Solubilization Capacity of a Type I Lipid-Based Drug Formulation after Digestion. Mol. Pharm. 2017, 14, 580–592. [Google Scholar] [CrossRef]
- Alhalaweh, A.; Alzghoul, A.; Kaialy, W.; Mahlin, D.; Bergström, C.A.S. Computational Predictions of Glass-Forming Ability and Crystallization Tendency of Drug Molecules. Mol. Pharm. 2014, 11, 3123–3132. [Google Scholar] [CrossRef]
- Hossain, S.; Kabedev, A.; Parrow, A.; Bergström, C.A.; Larsson, P. Molecular simulation as a computational pharmaceutics tool to predict drug solubility, solubilization processes and partitioning. Eur. J. Pharm. Biopharm. 2019, 137, 46–55. [Google Scholar] [CrossRef]
- Kuentz, M.; Bergström, C.A. Synergistic Computational Modeling Approaches as Team Players in the Game of Solubility Predictions. J. Pharm. Sci. 2021, 110, 22–34. [Google Scholar] [CrossRef] [PubMed]
- Wyttenbach, N.; Niederquell, A.; Kuentz, M. Machine Estimation of Drug Melting Properties and Influence on Solubility Prediction. Mol. Pharm. 2020, 17. [Google Scholar] [CrossRef]
- Panagou, E.; Mohareb, F.; Argyri, A.; Bessant, C.; Nychas, G.-J.E. A comparison of artificial neural networks and partial least squares modelling for the rapid detection of the microbial spoilage of beef fillets based on Fourier transform infrared spectral fingerprints. Food Microbiol. 2011, 28, 782–790. [Google Scholar] [CrossRef] [PubMed] [Green Version]
- Farizawani, A.; Puteh, M.; Marina, Y.; Rivaie, A. A review of artificial neural network learning rule based on multiple variant of conjugate gradient approaches. J. Phys. Conf. Ser. 2020, 1529. [Google Scholar] [CrossRef]
- Bourquin, J.; Schmidli, H.; Van Hoogevest, P.; Leuenberger, H. Basic Concepts of Artificial Neural Networks (ANN) Modeling in the Application to Pharmaceutical Development. Pharm. Dev. Technol. 1997, 2, 95–109. [Google Scholar] [CrossRef] [PubMed]
- Tu, J.V. Advantages and disadvantages of using artificial neural networks versus logistic regression for predicting medical outcomes. J. Clin. Epidemiol. 1996, 49, 1225–1231. [Google Scholar] [CrossRef]
- Aksu, B.; Paradkar, A.; De Matas, M.; Özer, O.; Güneri, T.; York, P. Quality by Design Approach: Application of Artificial Intelligence Techniques of Tablets Manufactured by Direct Compression. AAPS PharmSciTech 2012, 13, 1138–1146. [Google Scholar] [CrossRef]
- Damiati, S.A.; Martini, L.G.; Smith, N.W.; Lawrence, M.J.; Barlow, D.J. Application of machine learning in prediction of hydrotrope-enhanced solubilisation of indomethacin. Int. J. Pharm. 2017, 530, 99–106. [Google Scholar] [CrossRef] [Green Version]
- Yang, Y.; Ye, Z.; Su, Y.; Zhao, Q.; Li, X.; Ouyang, D. Deep learning for in vitro prediction of pharmaceutical formulations. Acta Pharm. Sin. B 2019, 9, 177–185. [Google Scholar] [CrossRef]
- Barmpalexis, P.; Karagianni, A.; Nikolakakis, I.; Kachrimanis, K. Artificial neural networks (ANNs) and partial least squares (PLS) regression in the quantitative analysis of cocrystal formulations by Raman and ATR-FTIR spectroscopy. J. Pharm. Biomed. Anal. 2018, 158, 214–224. [Google Scholar] [CrossRef]
- Gao, H.; Wang, W.; Dong, J.; Ye, Z.; Ouyang, D. An integrated computational methodology with data-driven machine learning, molecular modeling and PBPK modeling to accelerate solid dispersion formulation design. Eur. J. Pharm. Biopharm. 2021, 158, 336–346. [Google Scholar] [CrossRef] [PubMed]
- Brinkmann, J.; Exner, L.; Luebbert, C.; Sadowski, G. In-Silico Screening of Lipid-Based Drug Delivery Systems. Pharm. Res. 2020, 37, 1–12. [Google Scholar] [CrossRef] [PubMed]
- Galata, D.L.; Farkas, A.; Könyves, Z.; Mészáros, L.A.; Szabó, E.; Csontos, I.; Pálos, A.; Marosi, G.; Nagy, Z.K. Fast, Spectroscopy-Based Prediction of In Vitro Dissolution Profile of Extended Release Tablets Using Artificial Neural Networks. Pharmaceutics 2019, 11, 400. [Google Scholar] [CrossRef] [Green Version]
- Djuris, J.; Cirin-Varadjan, S.; Aleksic, I.; Djuris, M.; Cvijic, S.; Ibric, S. Application of Machine-Learning Algorithms for Better Understanding of Tableting Properties of Lactose Co-Processed with Lipid Excipients. Pharmaceutics 2021, 13, 663. [Google Scholar] [CrossRef]
- Tosca, E.; Bartolucci, R.; Magni, P. Application of Artificial Neural Networks to Predict the Intrinsic Solubility of Drug-Like Molecules. Pharmaceutics 2021, 13, 1101. [Google Scholar] [CrossRef] [PubMed]
- Van Hauwermeiren, D.; Stock, M.; De De Beer, T.; Nopens, I. Predicting Pharmaceutical Particle Size Distributions Using Kernel Mean Embedding. Pharmaceutics 2020, 12, 271. [Google Scholar] [CrossRef] [Green Version]
- Alskar, L.C.; Porter, C.J.; Bergstrom, C.A.S. Tools for Early Prediction of Drug Loading in Lipid-Based Formulations. Mol. Pharm. 2016, 13, 251–261. [Google Scholar] [CrossRef] [PubMed] [Green Version]
- Alskar, L.C.; Keemink, J.; Johannesson, J.; Porter, C.J.H.; Bergstrom, C.A.S. Impact of Drug Physicochemical Properties on Lipolysis-Triggered Drug Supersaturation and Precipitation from Lipid-Based Formulations. Mol. Pharm. 2018, 15, 4733–4744. [Google Scholar] [CrossRef] [Green Version]
- Persson, L.C.; Porter, C.; Charman, W.; Bergström, C.A.S. Computational Prediction of Drug Solubility in Lipid Based Formulation Excipients. Pharm. Res. 2013, 30, 3225–3237. [Google Scholar] [CrossRef]
- Bennett-Lenane, H.; Koehl, N.J.; O’Dwyer, P.J.; Box, K.J.; O’Shea, J.P.; Griffin, B.T. Applying Computational Predictions of Biorelevant Solubility Ratio Upon Self-Emulsifying Lipid-Based Formulations Dispersion to Predict Dose Number. J. Pharm. Sci. 2020, 110, 164–175. [Google Scholar] [CrossRef] [PubMed]
- Sacchetti, M.; Nejati, E. Prediction of drug solubility in lipid mixtures from the individual ingredients. AAPS PharmSciTech. 2012, 13, 1103–1109. [Google Scholar] [CrossRef] [Green Version]
- Alsenz, J.; Kuentz, M. From Quantum Chemistry to Prediction of Drug Solubility in Glycerides. Mol. Pharm. 2019, 16, 4661–4669. [Google Scholar] [CrossRef]
- Brinkmann, J.; Exner, L.; Verevkin, S.P.; Luebbert, C.; Sadowski, G. PC-SAFT Modeling of Phase Equilibria Relevant for Lipid-Based Drug Delivery Systems. J. Chem. Eng. Data 2021, 66, 1280–1289. [Google Scholar] [CrossRef]
- Han, R.; Xiong, H.; Ye, Z.; Yang, Y.; Huang, T.; Jing, Q.; Lu, J.; Pan, H.; Ren, F.; Ouyang, D. Predicting physical stability of solid dispersions by machine learning techniques. J. Control. Release 2019, 311-312, 16–25. [Google Scholar] [CrossRef]
- Mendyk, A.; Pacławski, A.; Szafraniec-Szczęsny, J.; Antosik, A.; Jamróz, W.; Paluch, M.; Jachowicz, R. Data-Driven Modeling of the Bicalutamide Dissolution from Powder Systems. AAPS PharmSciTech 2020, 21, 111–119. [Google Scholar] [CrossRef] [Green Version]
- O’Driscoll, C.; Griffin, B. Biopharmaceutical challenges associated with drugs with low aqueous solubility—The potential impact of lipid-based formulations. Adv. Drug Deliv. Rev. 2008, 60, 617–624. [Google Scholar] [CrossRef]
- Bennett-Lenane, H.; O’Shea, J.P.; O’Driscoll, C.M.; Griffin, B.T. A Retrospective Biopharmaceutical Analysis of >800 Approved Oral Drug Products: Are Drug Properties of Solid Dispersions and Lipid-Based Formulations Distinctive? J. Pharm. Sci. 2020, 109, 3248–3261. [Google Scholar] [CrossRef]
- Koehl, N.J.; Henze, L.J.; Kuentz, M.; Holm, R.; Griffin, B.T. Supersaturated Lipid-Based Formulations to Enhance the Oral Bioavailability of Venetoclax. Pharmaceutics 2020, 12, 564. [Google Scholar] [CrossRef]
- Thomas, N.; Holm, R.; Müllertz, A.; Rades, T. In vitro and in vivo performance of novel supersaturated self-nanoemulsifying drug delivery systems (super-SNEDDS). J. Control. Release 2012, 160, 25–32. [Google Scholar] [CrossRef] [PubMed]
- Michaelsen, M.H.; Wasan, K.M.; Sivak, O.; Müllertz, A.; Rades, T. The Effect of Digestion and Drug Load on Halofantrine Absorption from Self-nanoemulsifying Drug Delivery System (SNEDDS). AAPS J. 2016, 18, 180–186. [Google Scholar] [CrossRef] [Green Version]
- Thomas, N.; Holm, R.; Garmer, M.; Karlsson, J.J.; Müllertz, A.; Rades, T. Supersaturated Self-Nanoemulsifying Drug Delivery Systems (Super-SNEDDS) Enhance the Bioavailability of the Poorly Water-Soluble Drug Simvastatin in Dogs. AAPS J. 2013, 15, 219–227. [Google Scholar] [CrossRef] [PubMed] [Green Version]
- Blaabjerg, L.I.; Lindenberg, E.; Löbmann, K.; Grohganz, H.; Rades, T. Is there a correlation between the glass forming ability of a drug and its supersaturation propensity? Int. J. Pharm. 2018, 538, 243–249. [Google Scholar] [CrossRef]
- Ilie, A.-R.; Griffin, B.T.; Kolakovic, R.; Vertzoni, M.; Kuentz, M.; Holm, R. Supersaturated lipid-based drug delivery systems–exploring impact of lipid composition type and drug properties on supersaturability and physical stability. Drug Dev. Ind. Pharm. 2020, 46, 356–364. [Google Scholar] [CrossRef] [PubMed]
- Palmelund, H.; Madsen, C.M.; Plum, J.; Müllertz, A.; Rades, T. Studying the Propensity of Compounds to Supersaturate: A Practical and Broadly Applicable Approach. J. Pharm. Sci. 2016, 105, 3021–3029. [Google Scholar] [CrossRef]
- Ilie, A.-R.; Griffin, B.T.; Vertzoni, M.; Kuentz, M.; Cuyckens, F.; Wuyts, K.; Kolakovic, R.; Holm, R. Toward simplified oral lipid-based drug delivery using mono-/di-glycerides as single component excipients. Drug Dev. Ind. Pharm. 2020, 46, 2051–2060. [Google Scholar] [CrossRef] [PubMed]
- Holm, R. Bridging the gaps between academic research and industrial product developments of lipid-based formulations. Adv. Drug Deliv. Rev. 2019, 142, 118–127. [Google Scholar] [CrossRef]
- Baird, J.A.; Van Eerdenbrugh, B.; Taylor, L. A Classification System to Assess the Crystallization Tendency of Organic Molecules from Undercooled Melts. J. Pharm. Sci. 2010, 99, 3787–3806. [Google Scholar] [CrossRef]
- Baghel, S.; Cathcart, H.; Redington, W.; O’Reilly, N. An investigation into the crystallization tendency/kinetics of amorphous active pharmaceutical ingredients: A case study with dipyridamole and cinnarizine. Eur. J. Pharm. Biopharm. 2016, 104, 59–71. [Google Scholar] [CrossRef]
- Alhalaweh, A.; Alzghoul, A.; Bergström, C.A. Molecular Drivers of Crystallization Kinetics for Drugs in Supersaturated Aqueous Solutions. J. Pharm. Sci. 2019, 108, 252–259. [Google Scholar] [CrossRef] [Green Version]
- Forina, M.; Lanteri, S.; Oliveros, M.C.C.; Millán, C.P. Selection of useful predictors in multivariate calibration. Anal. Bioanal. Chem. 2004, 380, 397–418. [Google Scholar] [CrossRef]
- Alshalif, S.A.; Ibrahim, N.; Herawan, T. (Eds.) Artificial Neural Network with Hyperbolic Tangent Activation Function to Improve the Accuracy of COCOMO II Model. Recent Advances on Soft Computing and Data Mining; Springer International Publishing: Berlin/Heidelberg, Germany, 2016. [Google Scholar] [CrossRef]
- Møller, M.F. A scaled conjugate gradient algorithm for fast supervised learning. Neural Netw. 1993, 6, 525–533. [Google Scholar] [CrossRef]
- Kirkham, M.B. Chapter 3-Structure and Properties of Water. In Principles of Soil and Plant Water Relations, 2nd ed.; Kirkham, M.B., Ed.; Academic Press: Cambridge, MA, USA, 2014; pp. 27–40. [Google Scholar]
- Fradera, X.; Solà, M. Second-order atomic Fukui indices from the electron-pair density in the framework of the atoms in molecules theory. J. Comput. Chem. 2003, 25, 439–446. [Google Scholar] [CrossRef] [PubMed]
- Fukui, K.; Yonezawa, T.; Shingu, H. A Molecular Orbital Theory of Reactivity in Aromatic Hydrocarbons. J. Chem. Phys. 1952, 20, 722–725. [Google Scholar] [CrossRef]
- Teleki, A.; Nylander, O.; Bergström, C.A. Intrinsic Dissolution Rate Profiling of Poorly Water-Soluble Compounds in Biorelevant Dissolution Media. Pharmaceutics 2020, 12, 493. [Google Scholar] [CrossRef] [PubMed]
- Geidl, S.; Bouchal, T.; Raček, T.; Vařeková, R.S.; Hejret, V.; Křenek, A.; Abagyan, R.; Koča, J. High-quality and universal empirical atomic charges for chemoinformatics applications. J. Chemin 2015, 7, 1–10. [Google Scholar] [CrossRef] [Green Version]
- Gasteiger, J.; Marsili, M. Iterative partial equalization of orbital electronegativity—A rapid access to atomic charges. Tetrahedron 1980, 36, 3219–3228. [Google Scholar] [CrossRef]


| Drug Compound | MW (g/mol) | clogP | logD6.5 | Acid/ Base/ Neutral | GFA Class | Tm (°C) | Tg (°C) | ∆Hfus (kJ/mol) | ∆Sfus × 0.01 (kJ/mol/K) | Tm/Tg | Trg | HBA | HBD | Rotatable Bonds |
|---|---|---|---|---|---|---|---|---|---|---|---|---|---|---|
| Carvedilol | 406.49 | 3.88 | 2.36 | B | III | 114.5 | 41.9 | 53.00 | 13.67 | 1.23 | 0.81 | 5 | 3 | 10 |
| Celecoxib | 381.38 | 3.81 | 3.81 | A | II | 163 | 58 | 34.10 | 7.80 | 1.32 | 0.76 | 4 | 1 | 2 |
| Cinnarizine | 368.53 | 4.92 | 3.98 | B | II | 121 | 8.5 | 37.50 | 9.50 | 1.39 | 0.72 | 2 | 0 | 5 |
| Clotrimazole | 344.85 | 5.08 | 5.06 | B | III | 148 | 30 | 33.34 | 7.97 | 1.39 | 0.72 | 1 | 0 | 4 |
| Danazol | 337.47 | 4.26 | 4.26 | N | II | 225.5 | 88.3 | 35.50 | 7.12 | 1.38 | 0.73 | 3 | 1 | 1 |
| Dipyridamole | 504.64 | 3.11 | 3.02 | B | I | 163 | 40.4 | 72.00 | 16.51 | 1.39 | 0.72 | 12 | 4 | 12 |
| Felodipine | 384.26 | 5.03 | 5.03 | B | III | 145 | 45 | 30.98 | 7.38 | 1.31 | 0.76 | 5 | 1 | 4 |
| Fenofibrate | 360.84 | 5.20 | 5.20 | N | III | 79 | −19 | 33.00 | 9.32 | 1.39 | 0.72 | 4 | 0 | 5 |
| Fenofibric acid | 318.76 | 3.98 | 1.25 | A | I | 184 | 35.4 | 99.00 | 21.66 | 1.48 | 0.68 | 4 | 1 | 3 |
| Griseofulvin | 352.77 | 2.51 | 2.51 | N | I | 245 | 89 | 39.12 | 7.96 | 1.36 | 0.73 | 6 | 0 | 3 |
| Haloperidol | 375.87 | 3.82 | 2.06 | B | I | 148 | 33 | 54.26 | 12.80 | 1.38 | 0.73 | 3 | 1 | 5 |
| Ibuprofen | 206.29 | 3.64 | 1.69 | A | III | 77 | −45 | 26.50 | 7.56 | 1.54 | 0.65 | 2 | 1 | 4 |
| Indometdacin | 357.80 | 4.03 | 1.45 | A | III | 161 | 45 | 37.60 | 8.64 | 1.37 | 0.73 | 4 | 1 | 3 |
| Itraconazole | 705.65 | 4.89 | 4.89 | B | III | 168 | 58 | 57.60 | 13.00 | 1.33 | 0.75 | 9 | 0 | 10 |
| JNJ-2A | 498.90 | 5.40 | 5.40 | N | III | 142 | 91.2 | 22.90 | 5.50 | 1.14 | 0.88 | 4 | 3 | 7 |
| Ketoconazole | 531.44 | 3.67 | 3.51 | B | III | 146 | 45 | 52.85 | 12.50 | 1.32 | 0.76 | 7 | 0 | 8 |
| Naproxen | 230.27 | 3.21 | 1.10 | A | I | 152 | 5.9 | 25.65 | 6.03 | 1.52 | 0.66 | 3 | 1 | 3 |
| Niclosamide | 327.13 | 4.03 | 4.02 | A | I | 230 | 86 | 40.70 | 8.01 | 1.40 | 0.71 | 5 | 2 | 2 |
| Progesterone | 314.47 | 3.94 | 3.94 | N | I | 130 | 55.2 | 23.67 | 5.87 | 1.23 | 0.81 | 2 | 0 | 1 |
| Sulfalazine | 398.40 | 3.15 | −0.35 | A | I | 245 | 54.6 | 99.00 | 20.08 | 1.58 | 0.63 | 9 | 3 | 3 |
| Venetoclax | 868.46 | 6.68 | 6.54 | AMPH | III | 138 | 64 | 18.40 | 4.50 | 1.22 | 0.82 | 12 | 3 | 11 |
| Y Variable | Model Type | Architecture | Input Variables | r2 | RMSE Tr | RMSE Te |
|---|---|---|---|---|---|---|
| aDS sLBFCapmulMC | PLS | 2 PCs | VMcGowan, N_Hydrogn, SHCH_321, SHaaCH, EEM_Afc, EEM_Afnp, EEM_NFc, and Pi_FMi4 | 0.56 | 0.40 | 0.79 |
| aDS sLBFCapmulMC | ANN | 1 hidden layer, 5 nodes | Pi_FPl5, NPA_Q6, ∆Hfus, EEM_F4, EqualEta, M_CX, MlogP, MolVol, N_CYPAtoms, N_Electr, NPA_Q1, Pi_FPl3, Pi_MinQ, S+S_Intrins, and SolFactor | 0.90 | 0.19 | 0.36 |
| aDS sLBFMaisineLC | PLS | 2 PCs | HIVI-TC, N_FrRotB, NPA_Q2, EEM_Nfc, EEM_NFnp, Pi_AQo, Pi_AQc, Pi_FPI3, and Pi_FMi6 | 0.62 | 0.40 | 0.45 |
| aDS sLBFMaisineLC | ANN | 1 hidden layer, 8 nodes | F_AromB, HBDch, MaxQ, N_Atoms, N_Bonds, NPA_Q2, NPA_Q5, Pi_FMi1, Pi_FPl1, SsssCH, and T_Rads | 0.83 | 0.28 | 0.25 |
Publisher’s Note: MDPI stays neutral with regard to jurisdictional claims in published maps and institutional affiliations. |
© 2021 by the authors. Licensee MDPI, Basel, Switzerland. This article is an open access article distributed under the terms and conditions of the Creative Commons Attribution (CC BY) license (https://creativecommons.org/licenses/by/4.0/).
Share and Cite
Bennett-Lenane, H.; O’Shea, J.P.; Murray, J.D.; Ilie, A.-R.; Holm, R.; Kuentz, M.; Griffin, B.T. Artificial Neural Networks to Predict the Apparent Degree of Supersaturation in Supersaturated Lipid-Based Formulations: A Pilot Study. Pharmaceutics 2021, 13, 1398. https://0-doi-org.brum.beds.ac.uk/10.3390/pharmaceutics13091398
Bennett-Lenane H, O’Shea JP, Murray JD, Ilie A-R, Holm R, Kuentz M, Griffin BT. Artificial Neural Networks to Predict the Apparent Degree of Supersaturation in Supersaturated Lipid-Based Formulations: A Pilot Study. Pharmaceutics. 2021; 13(9):1398. https://0-doi-org.brum.beds.ac.uk/10.3390/pharmaceutics13091398
Chicago/Turabian StyleBennett-Lenane, Harriet, Joseph P. O’Shea, Jack D. Murray, Alexandra-Roxana Ilie, René Holm, Martin Kuentz, and Brendan T. Griffin. 2021. "Artificial Neural Networks to Predict the Apparent Degree of Supersaturation in Supersaturated Lipid-Based Formulations: A Pilot Study" Pharmaceutics 13, no. 9: 1398. https://0-doi-org.brum.beds.ac.uk/10.3390/pharmaceutics13091398