
Liposomal Conjugates for Drug Delivery to the Central Nervous System

Abstract
: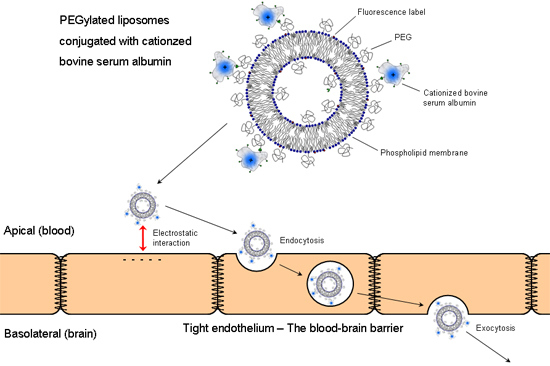
1. Introduction
2. Experimental Section
2.1. Materials
2.2. Liposome Preparation
2.3. Synthesis of Sulfhydrated Cationized BSA (cBSA-SH)
2.4. Covalent Coupling of Liposomes with cBSA
2.5. Isolation and Cultivation of Brain Capillary Endothelial Cells
2.6. In Vitro Uptake of cBSA-Liposomes
2.7. In Vivo Uptake of cBSA-Liposomes
2.8. Cryosections of Animal Tissue
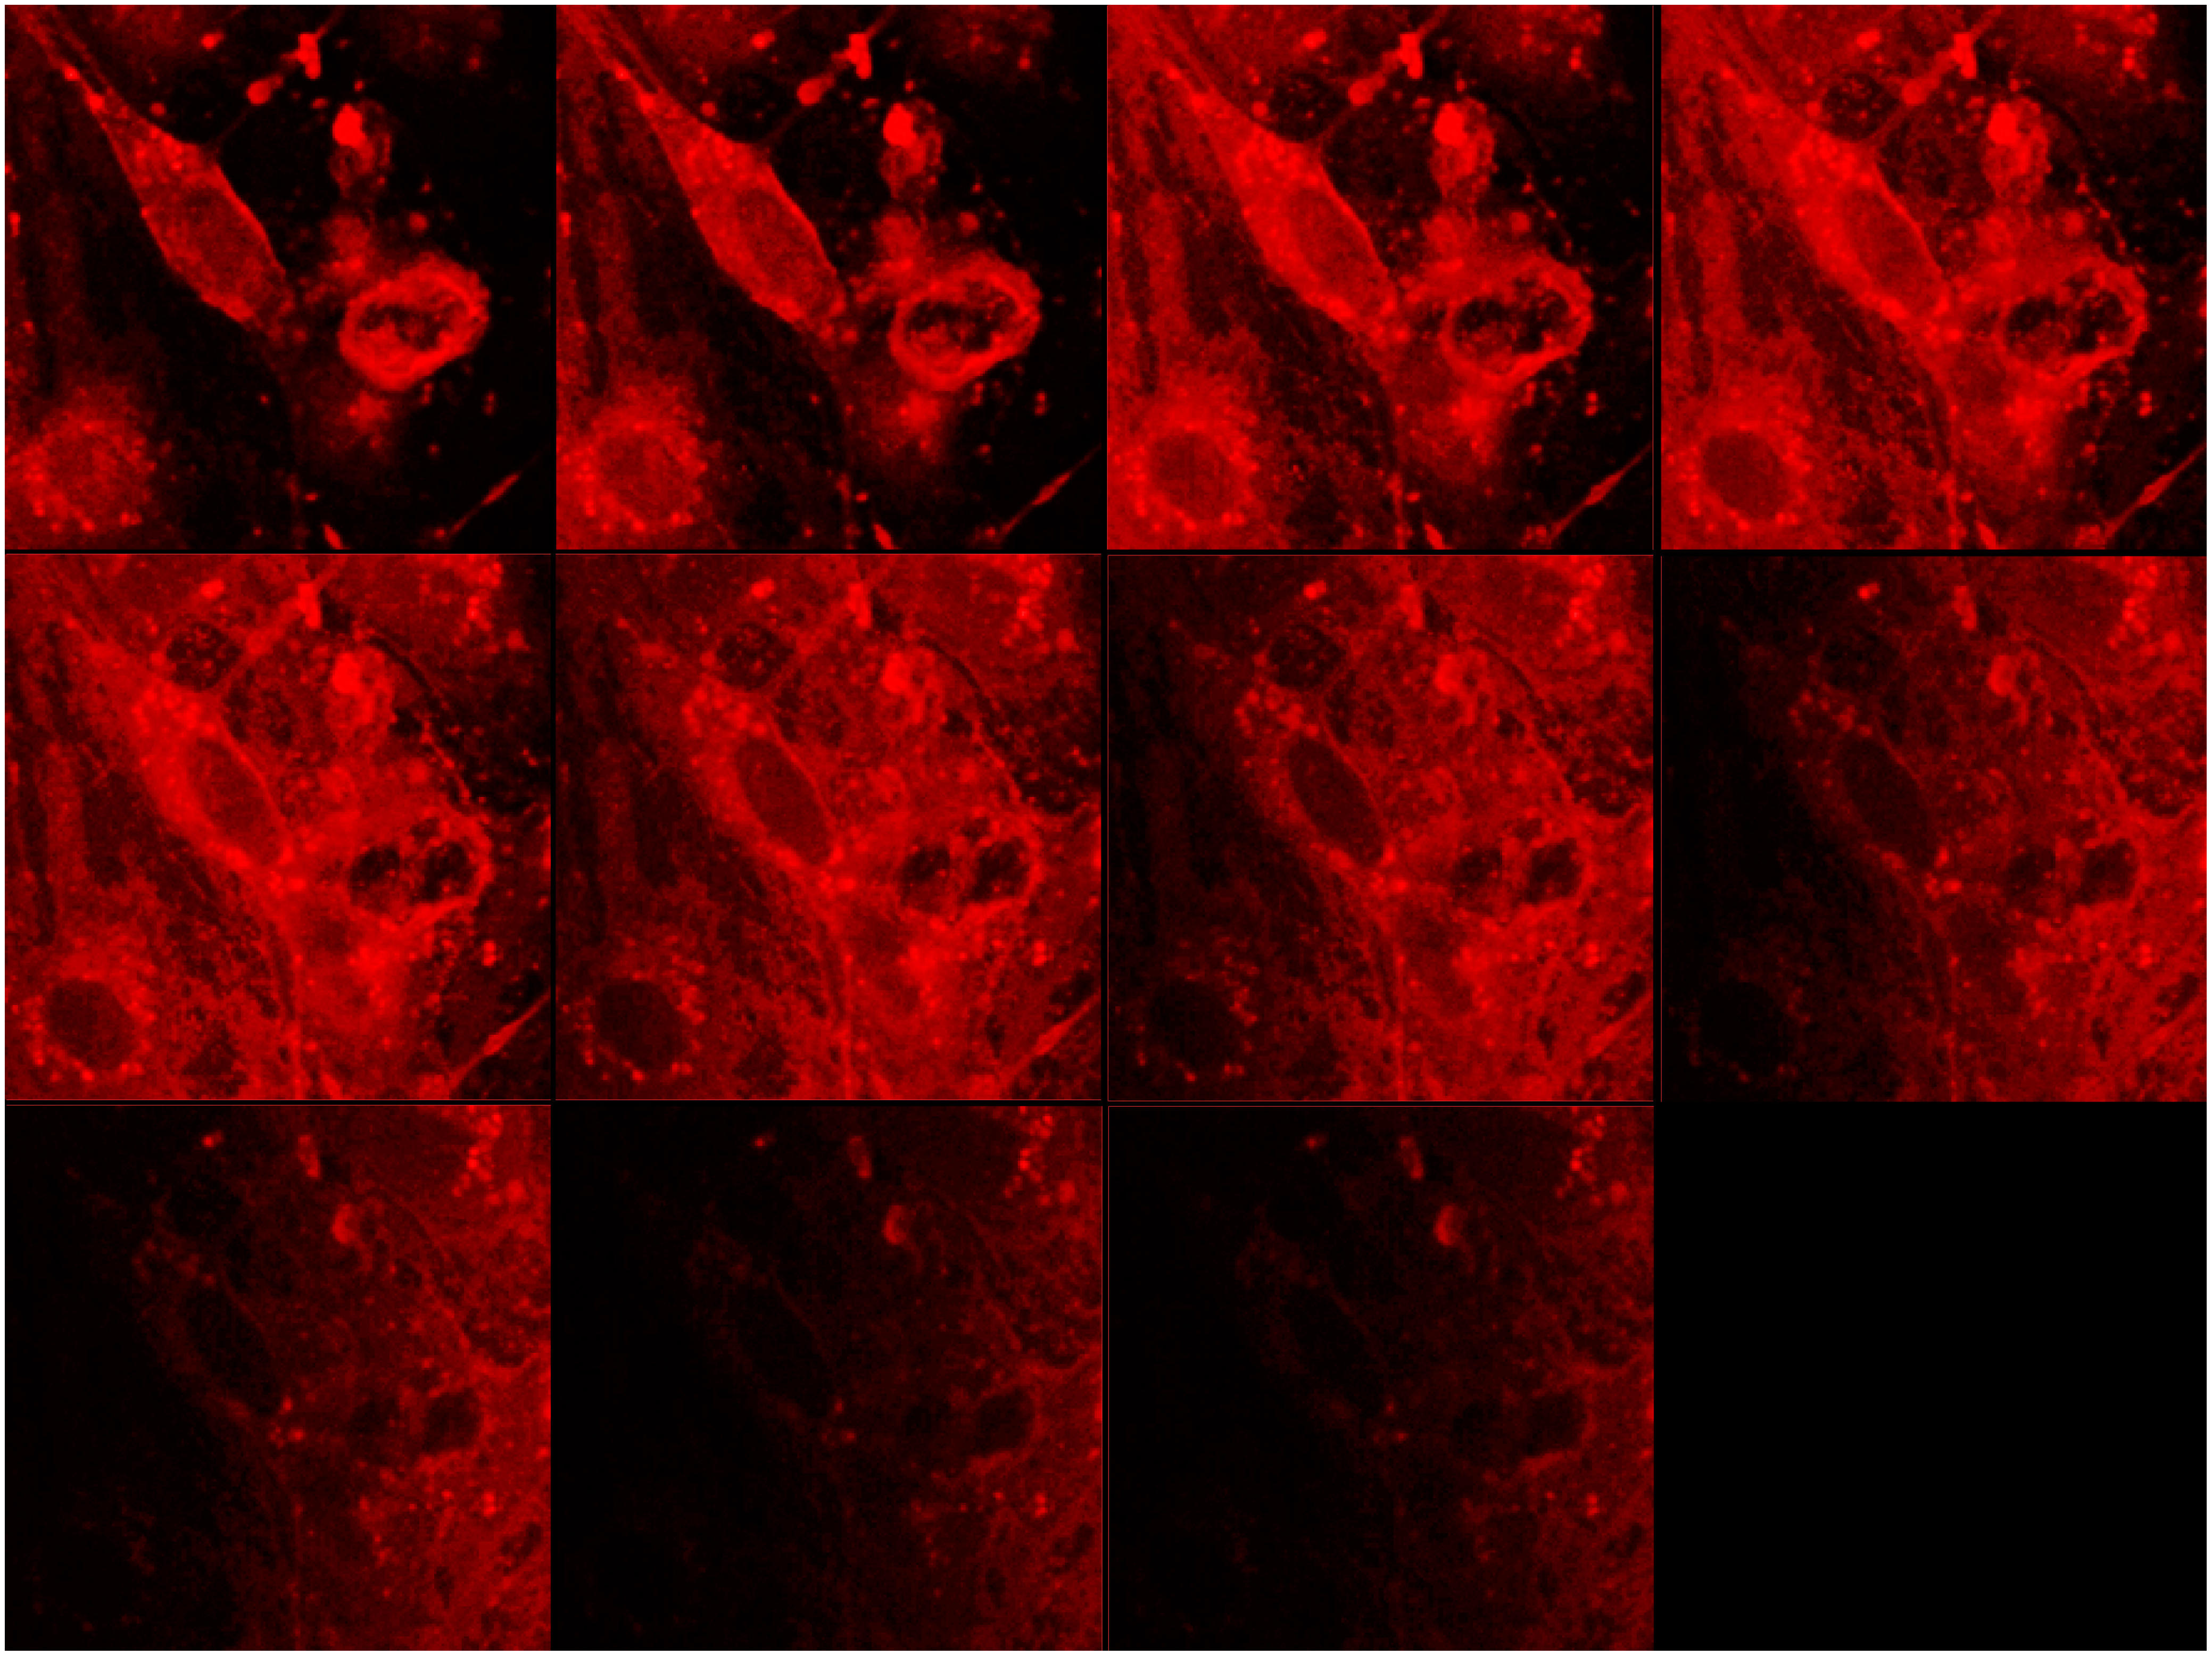
2.9. Confocal Laser Scanning Fluorescence Microscopy
3. Results and Discussion
3.1. Liposome Preparation and Coupling Efficiency

| Protein:Linker Ratio | DSPE-PEG-MI Concentration | FITC-cBSA Concentration (mM) | Coupling Efficiency (%) |
|---|---|---|---|
| 1:1 | 0.25 mM (0.25%) | 0.25 | 10.6 ± 1.5 |
| 0.50 mM (0.5%) | 0.50 | 26.5 ± 9.1 | |
| 1.0 mM (1%) | 1.0 | 72.0 ± 13.0 | |
| 2.5:1 | 0.25 mM (0.25%) | 0.625 | 10.7 ± 3.8 |
| 0.50 mM (0.5%) | 1.25 | 30.3 ± 2.9 | |
| 1.0 mM (1%) | 2.5 | 42.0 ± 9.9 | |
| 5:1 | 0.25 mM (0.25%) | 1.25 | 10.8 ± 0.8 |
| 0.50 mM (0.5%) | 2.5 | 36.1± 0.9 | |
| 1.0 mM (1%) | 5.0 | 63.5 ± 0.5 |
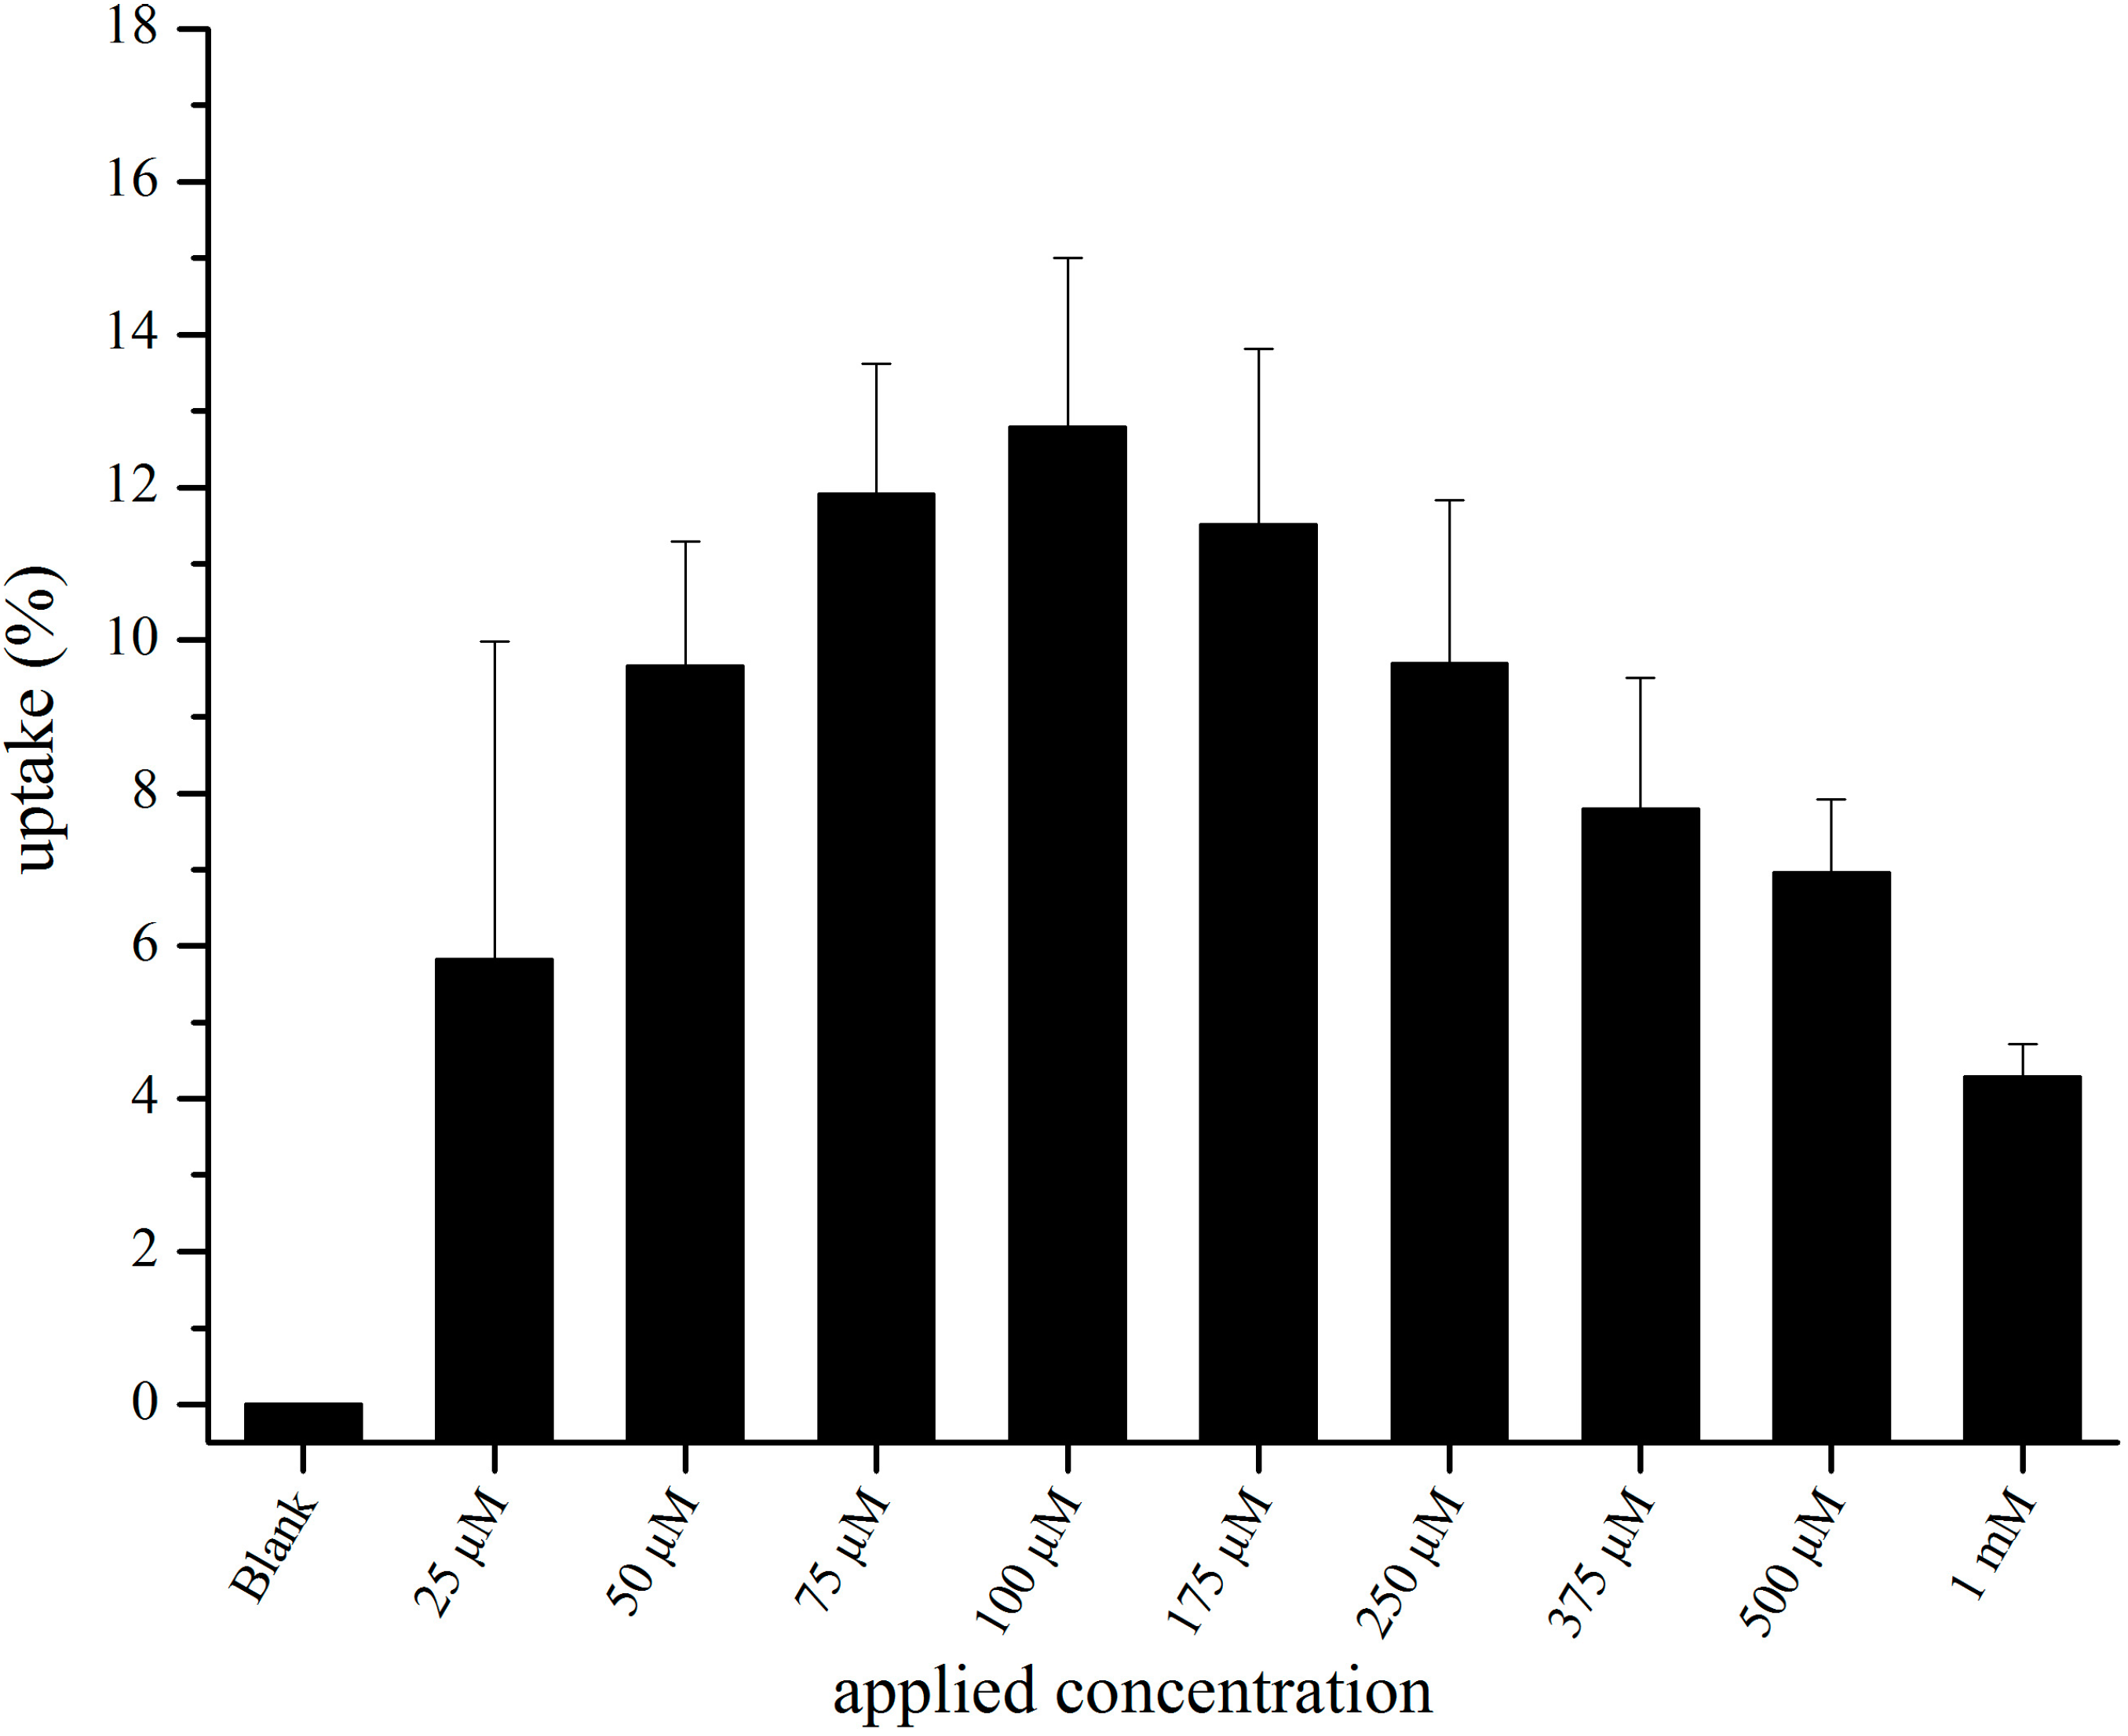
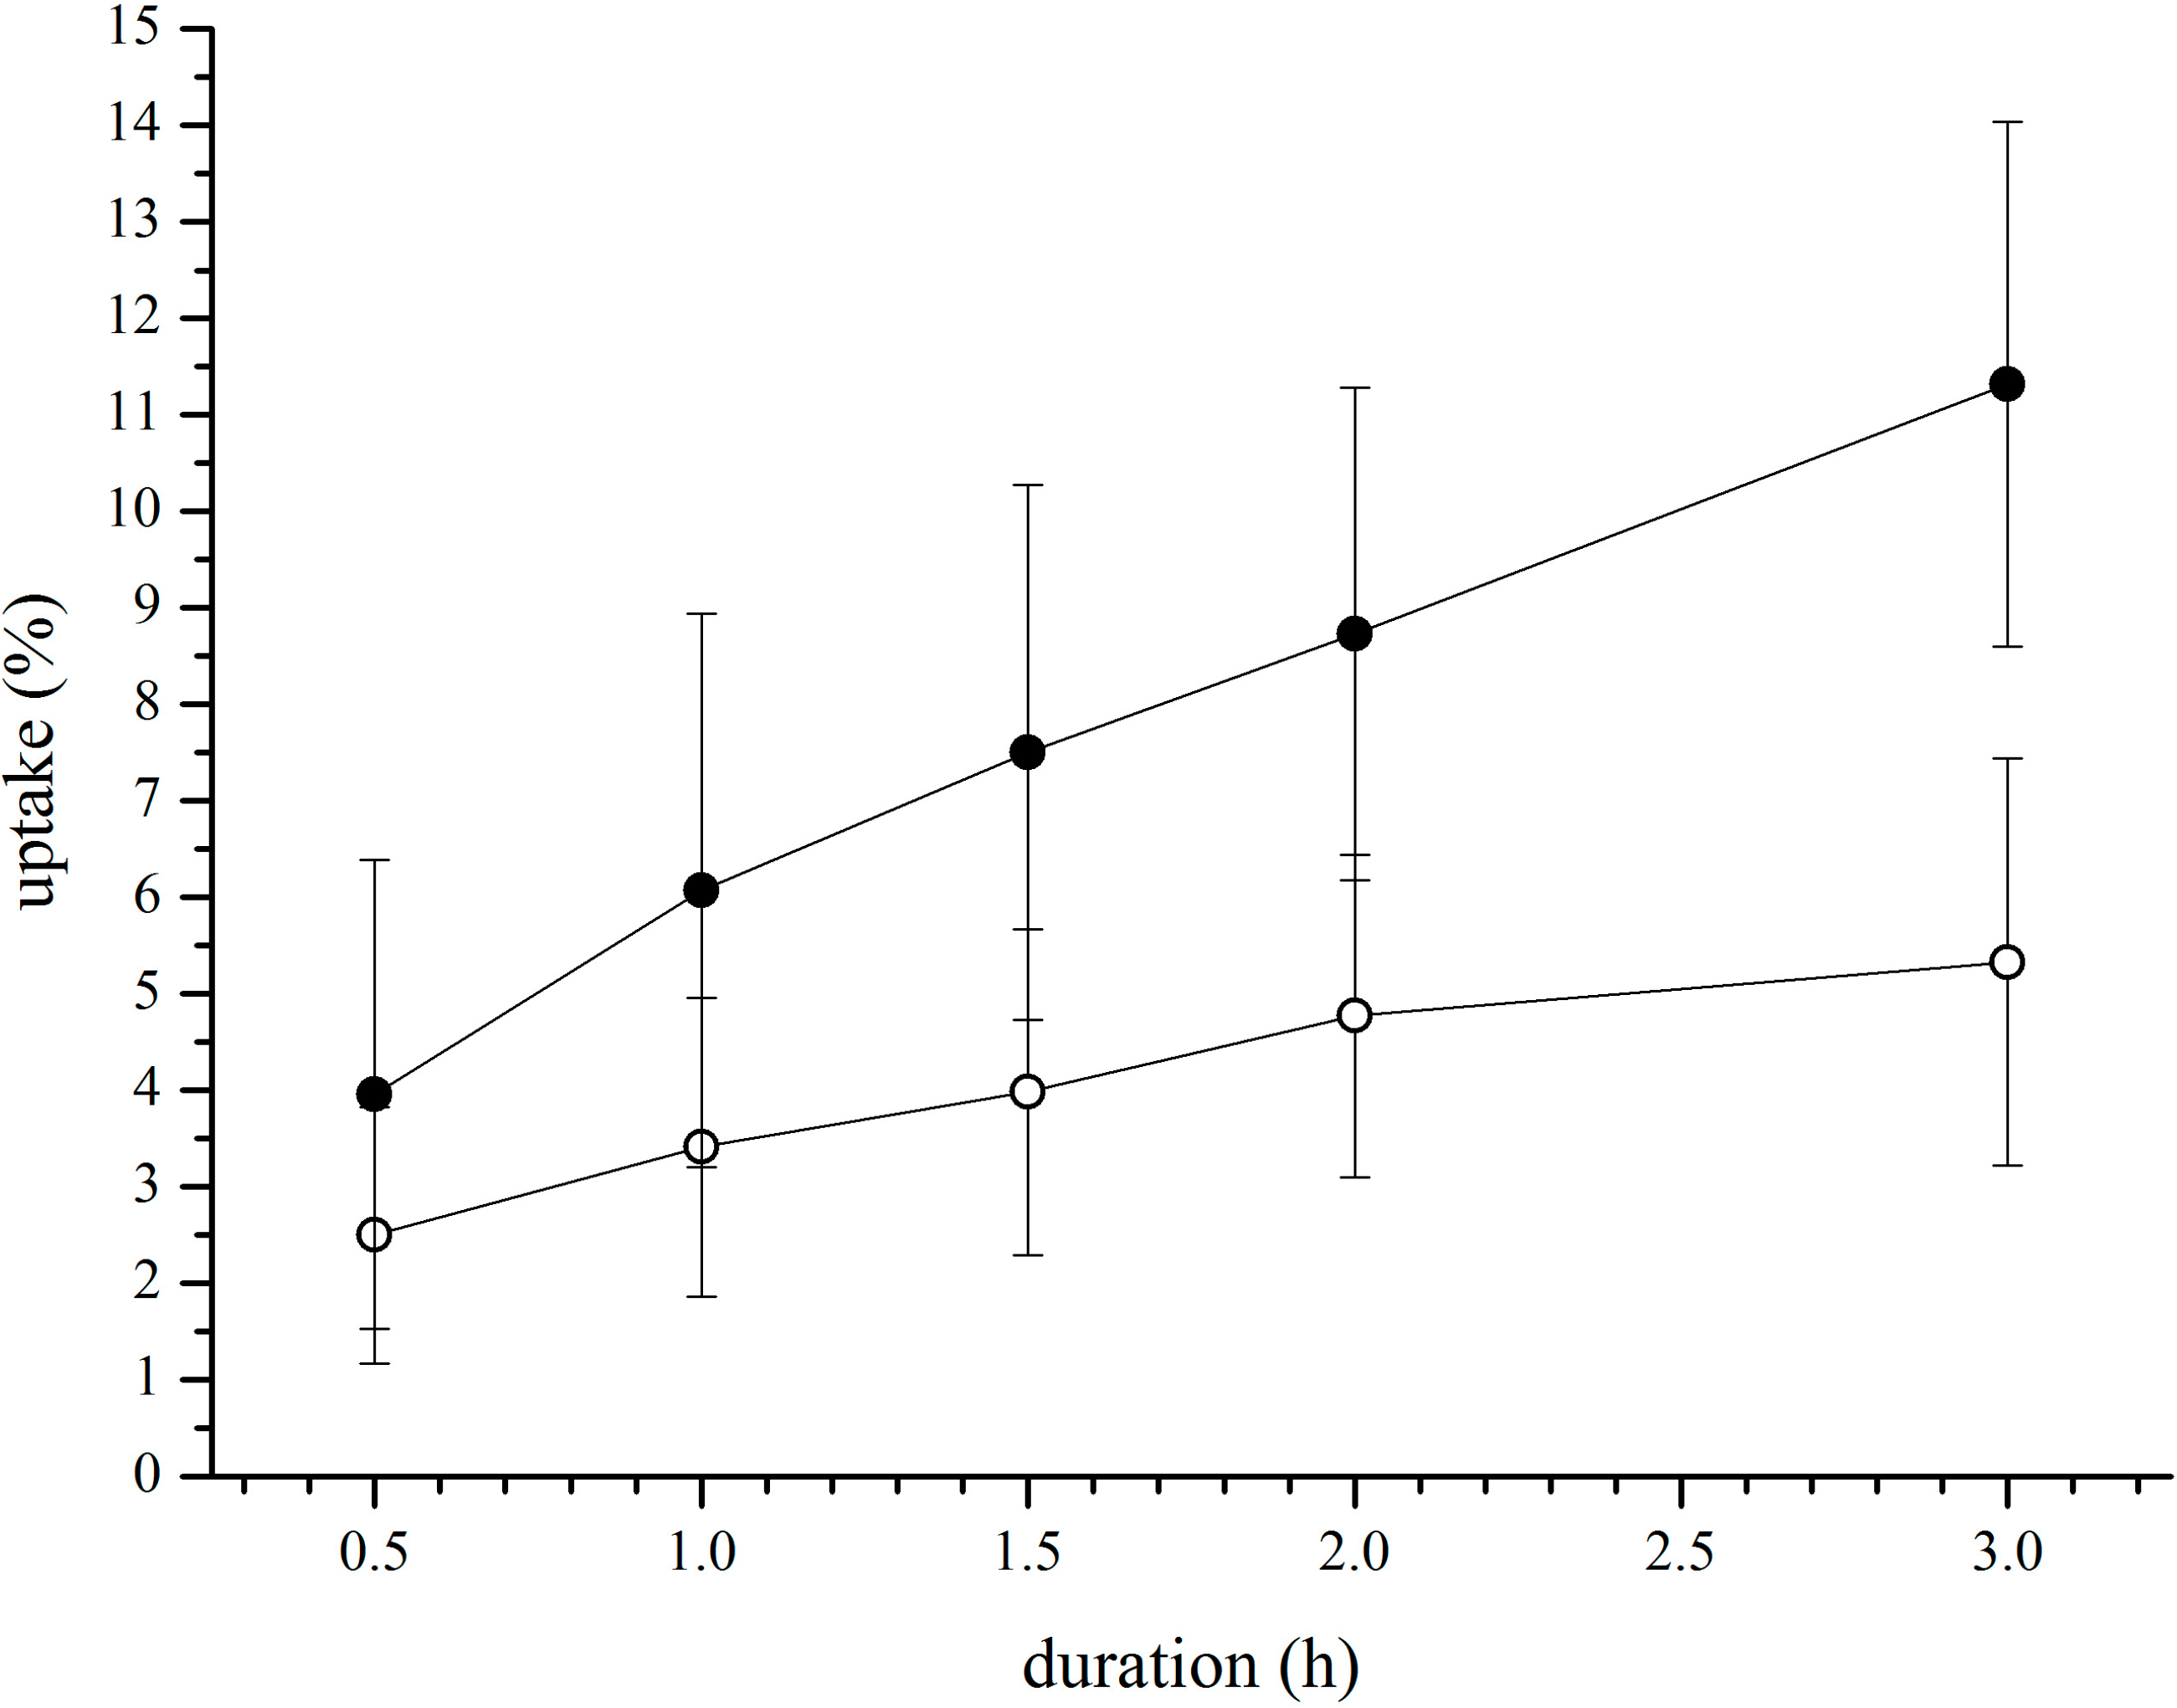
3.2. In Vitro Uptake of cBSA-Liposomes


| Concentration | Percental Rate (%/h) | Molar Rate (µM/h) |
|---|---|---|
| 100 µM | 2.9 ± 0.2 | 2.9 ± 0.2 |
| 250 µM | 1.1 ± 0.2 | 2.8 ± 0.5 |
| BSA 10fold (%) | BSA 100fold (%) | cBSA 10fold (%) | cBSA 100fold (%) |
|---|---|---|---|
| 15.5 ± 2.0 | 49.5 ± 10.7 | 22.9 ± 6.9 *** | 67.7 ± 6.2 *** |
| Liposome Type | Uptake (%) | According cBSA-Liposome Uptake (%) | cBSA Improvement Factor |
|---|---|---|---|
| Blank liposomes (1 mM) | 1.3 ± 0.5 *** | 4.3 ± 0.5 | 3.3 ± 1.7 |
| PEG-liposomes (1 mM) | 0.9 ± 0.4 *** | 4.3 ± 0.5 | 4.8 ± 2.7 |
| BSA-liposomes (250 µM) | 0.030 ± 0.006 *** | 9.7 ± 2.1 | 323.3 ± 134.7 |

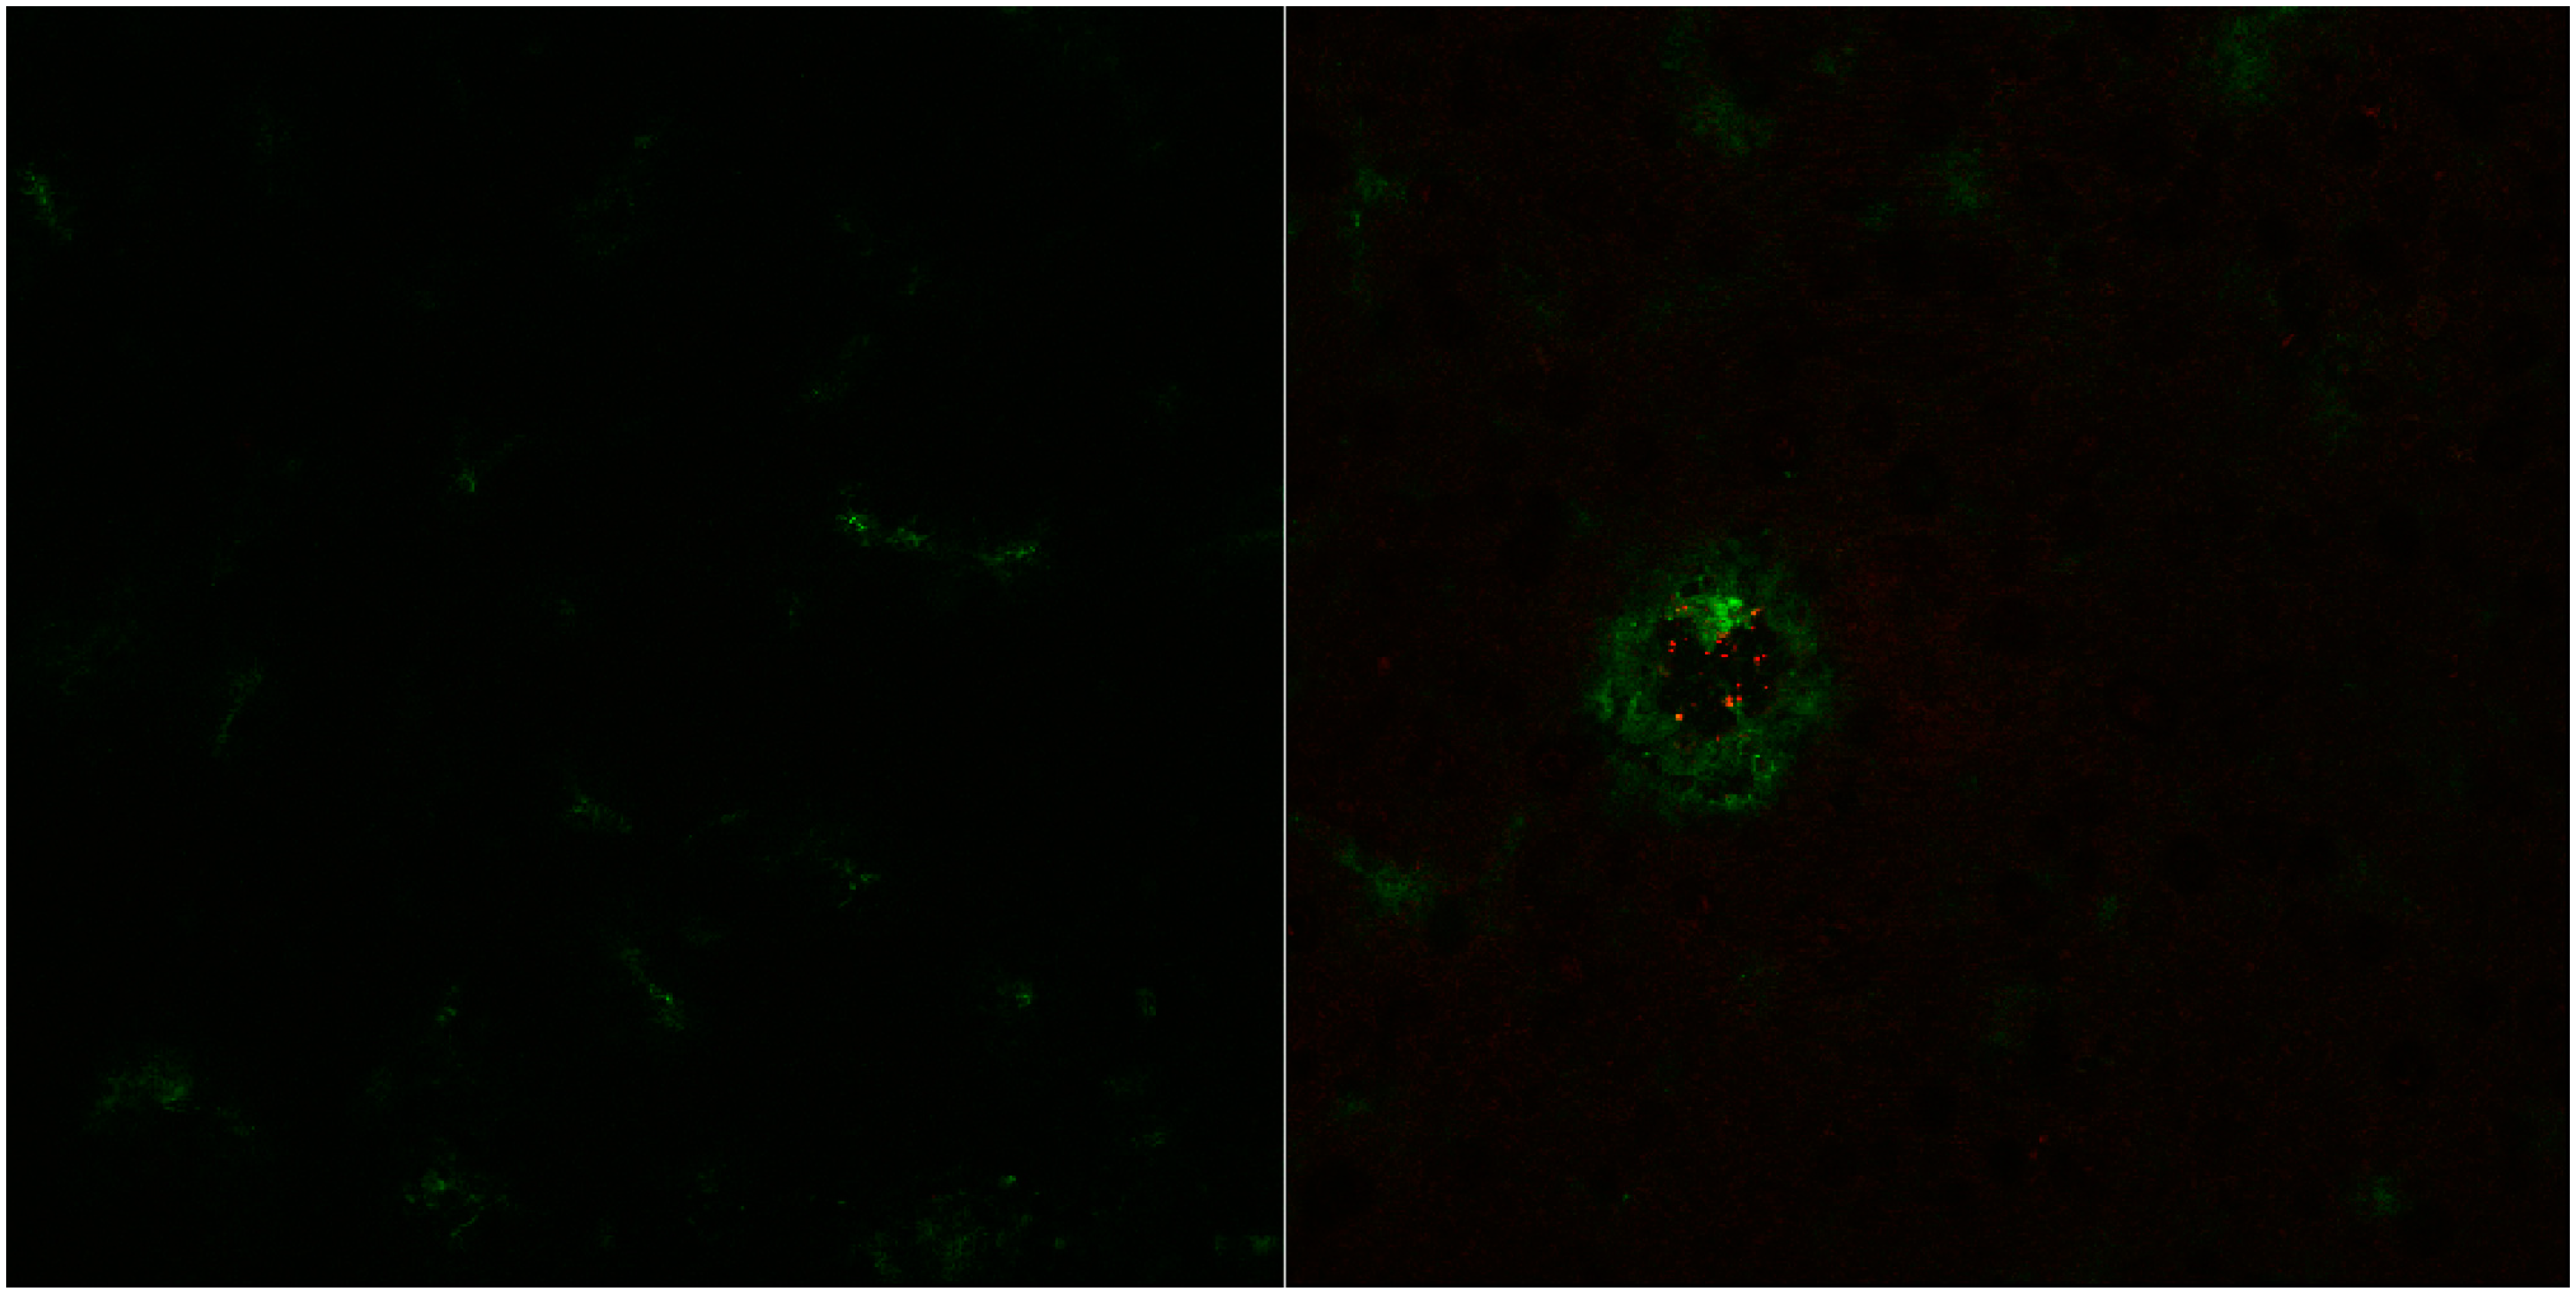
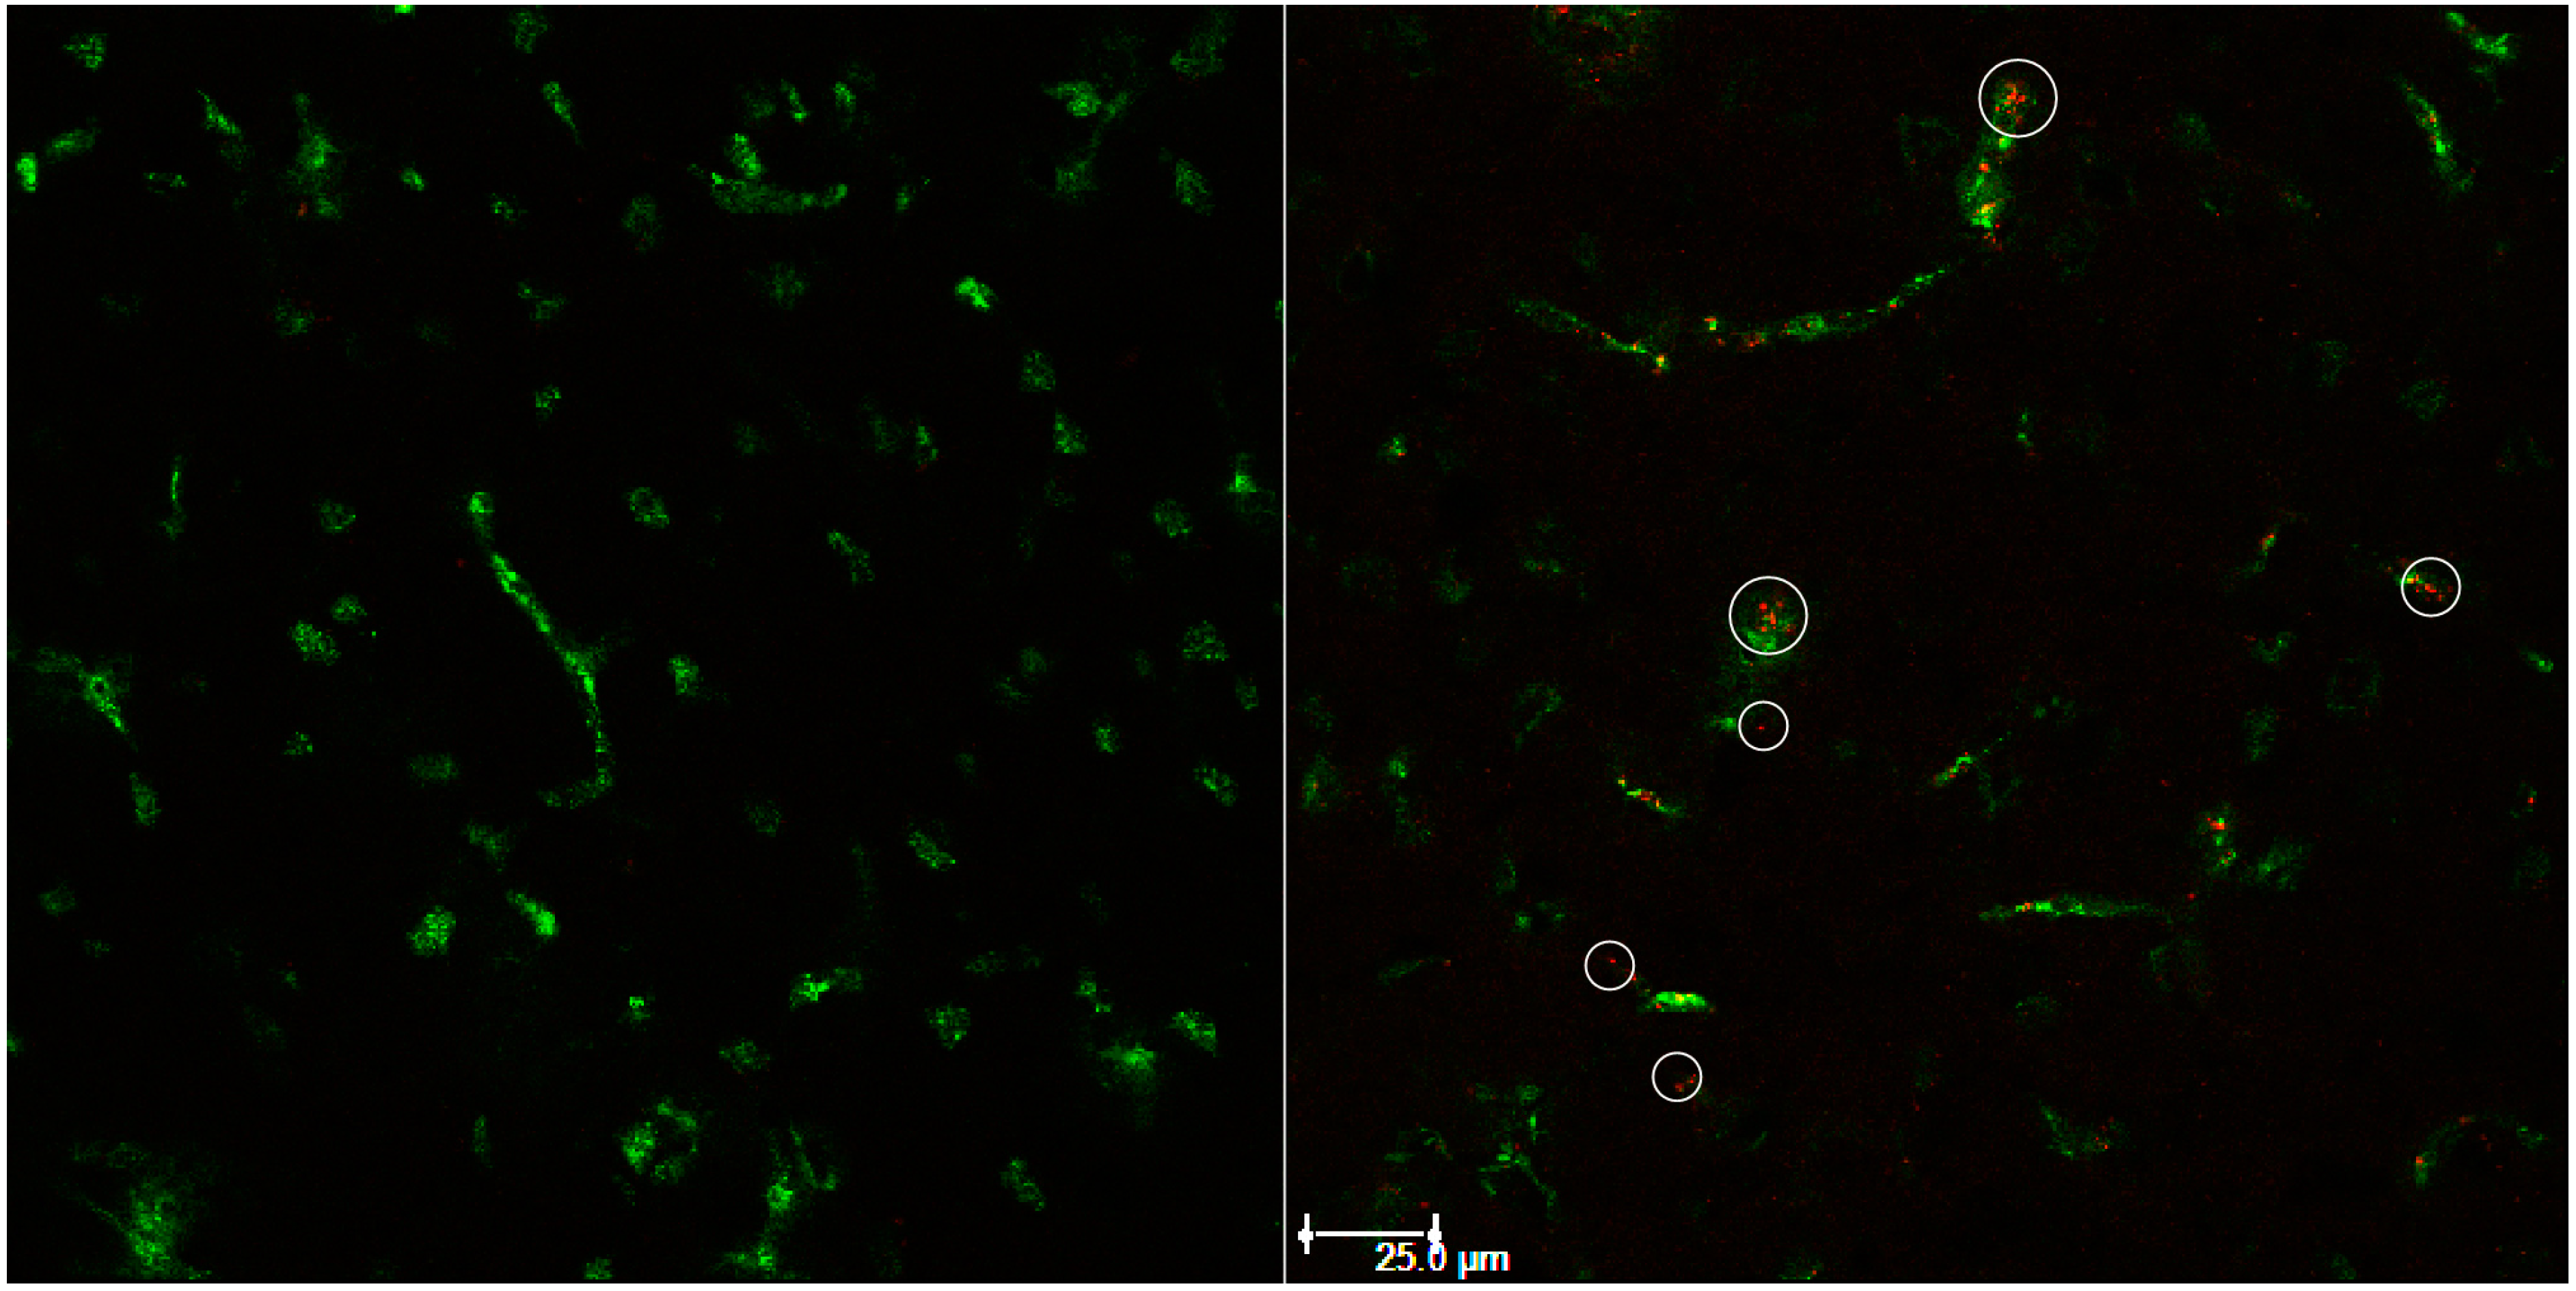
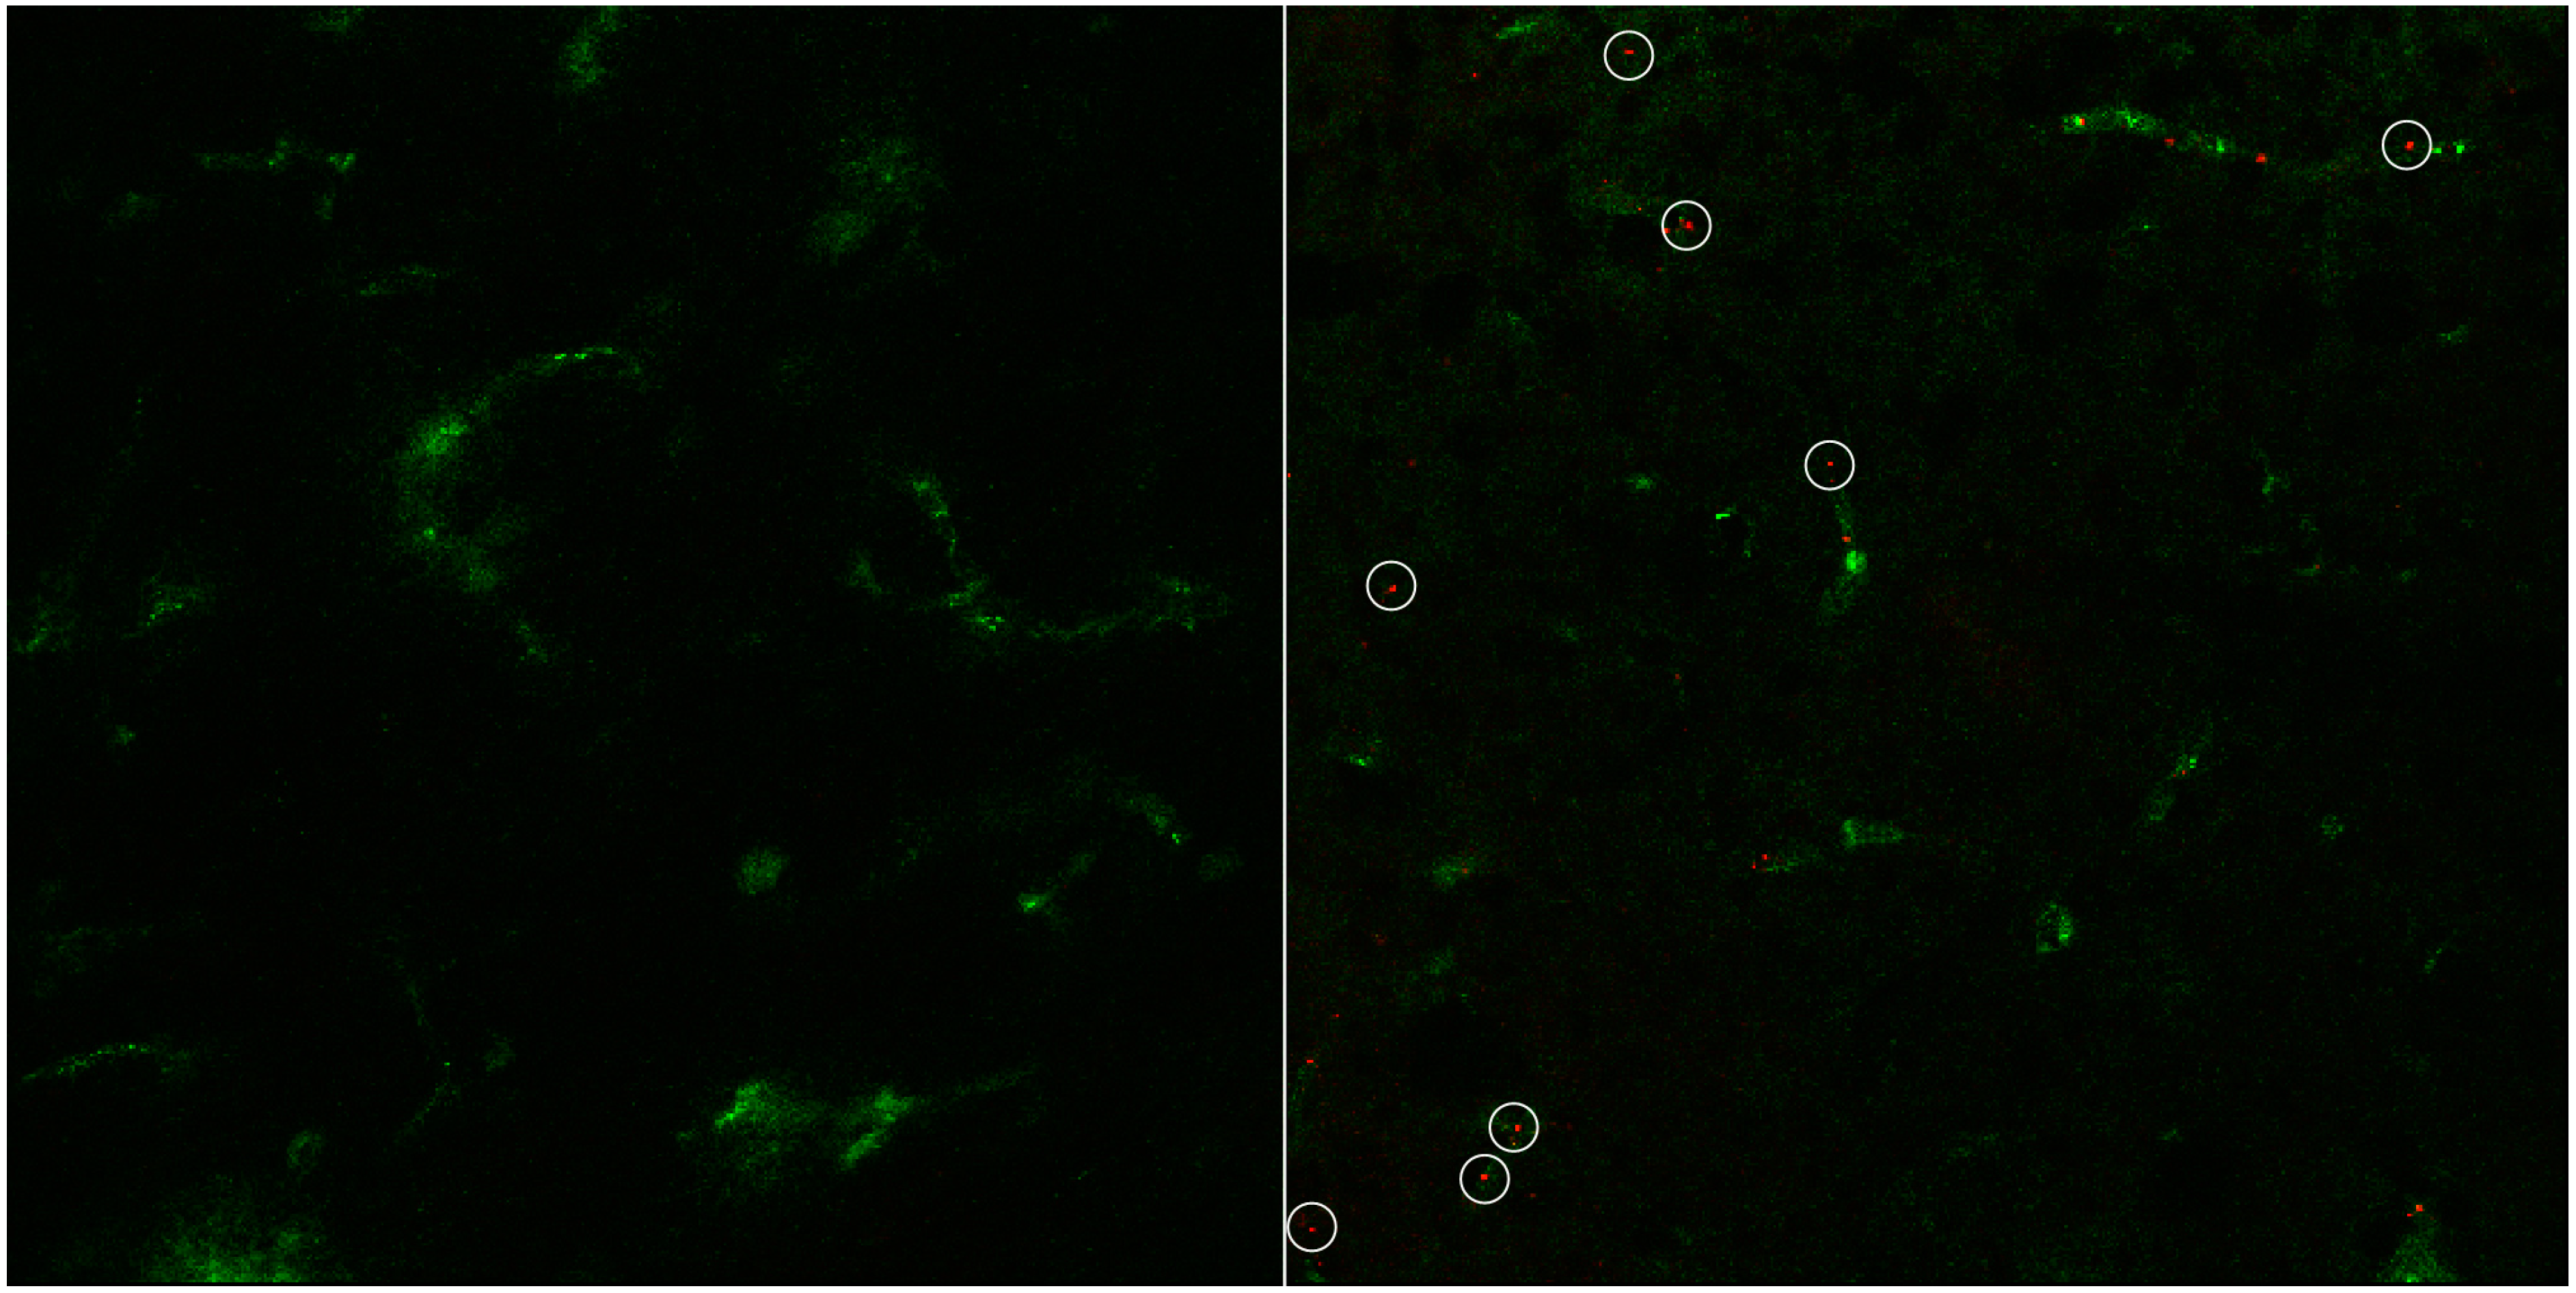
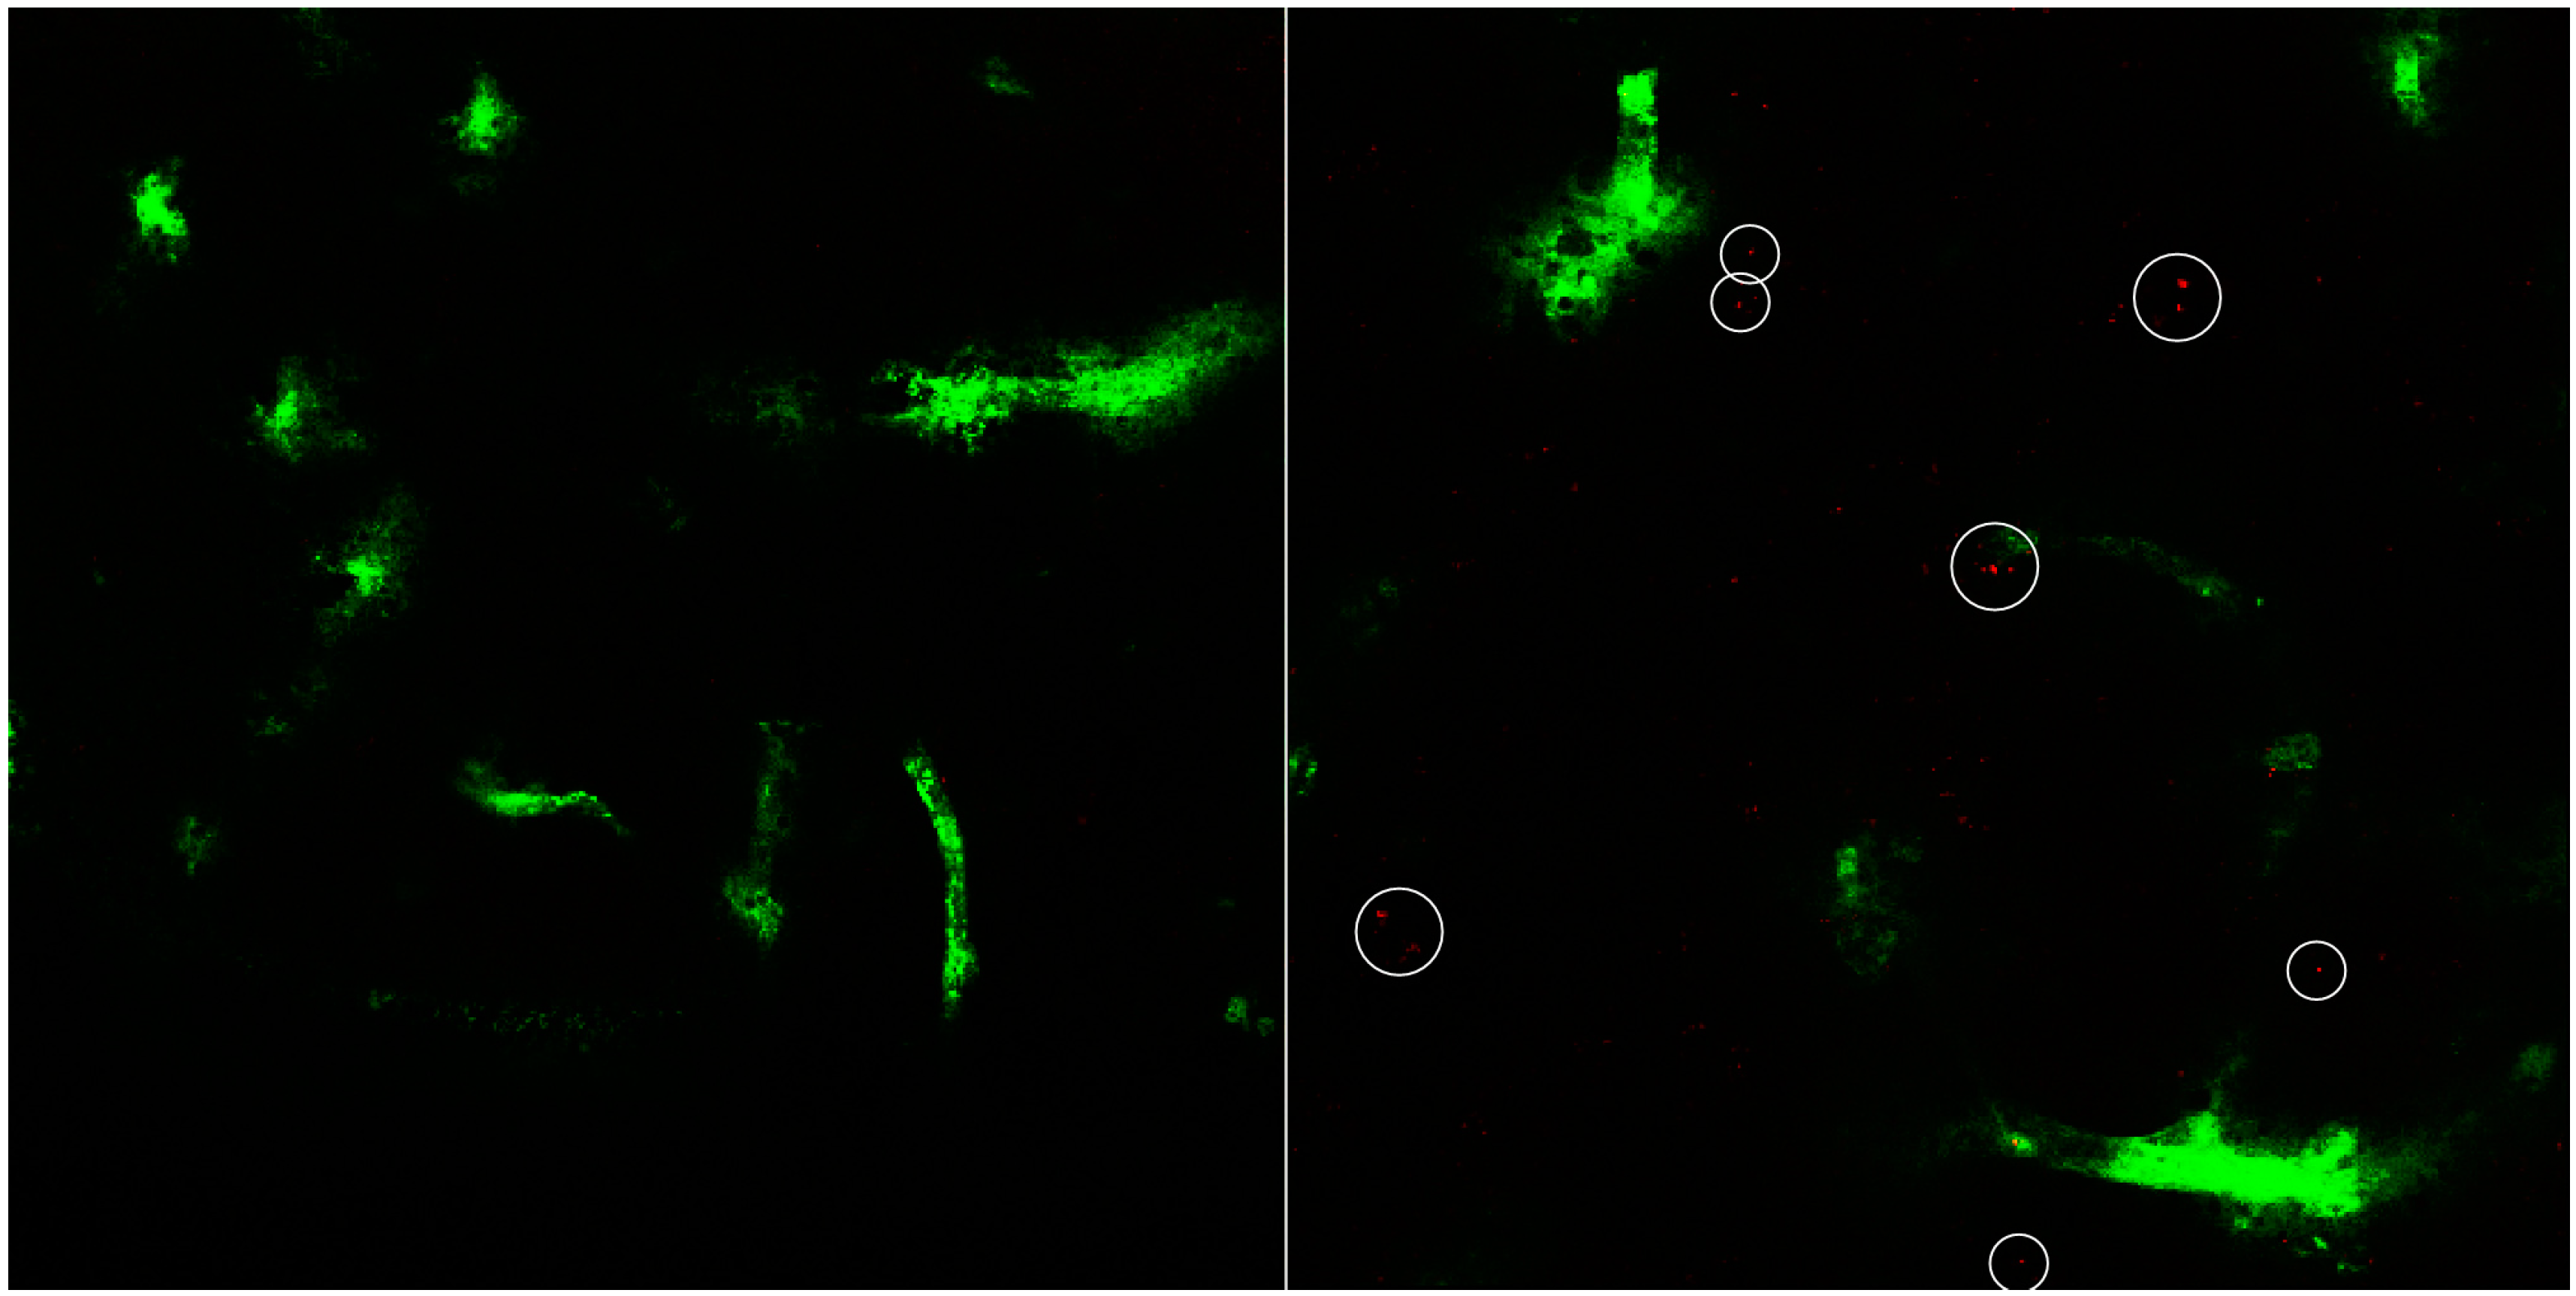
3.3. In Vivo Uptake of cBSA-Liposomes


4. Conclusions
Acknowledgments
Author Contributions
Conflicts of Interest
References
- Klinke, R.; Baumann, R.; Gay, R. Physiologie; Thieme Germany: Stuttgart, Germany, 2010. [Google Scholar]
- Langguth, P.; Fricker, G.; Wunderli-Allenspach, H. Biopharmazie; Wiley-VCH: Weinheim, Germany, 2004. [Google Scholar]
- Zong, J.; Pollack, G.M. Morphine antinociception is enhanced in mdr1a gene-deficient mice. Pharm. Res. 2000, 17, 749–753. [Google Scholar] [CrossRef] [PubMed]
- Potschka, H.; Loscher, W. In vivo evidence for p-glycoprotein-mediated transport of phenytoin at the blood-brain barrier of rats. Epilepsia 2001, 42, 1231–1240. [Google Scholar] [CrossRef] [PubMed]
- Huwyler, J.; Wu, D.; Pardridge, W.M. Brain drug delivery of small molecules using immunoliposomes. Proc. Natl. Acad. Sci. USA 1996, 93, 14164–14169. [Google Scholar] [CrossRef] [PubMed]
- Thöle, M.; Nobmann, S.; Huwyler, J.; Bartmann, A.; Fricker, G. Uptake of cationized albumin coupled liposomes by cultured porcine brain microvessel endothelial cells and intact brain capillaries. J. Drug Target. 2002, 10, 337–344. [Google Scholar] [CrossRef] [PubMed]
- Dan, N. Effect of liposome charge and peg polymer layer thickness on cell-liposome electrostatic interactions. Biochim. Biophys. Acta 2002, 1564, 343–348. [Google Scholar] [CrossRef] [PubMed]
- Mozafari, M.R. Nanoliposomes: Preparation and analysis. Methods Mol. Biol. 2010, 605, 29–50. [Google Scholar] [PubMed]
- Lasic, D.D.; Papahadjopoulos, D. Liposomes revisited. Science 1995, 267, 1275–1276. [Google Scholar] [CrossRef] [PubMed]
- Uster, P.S.; Allen, T.M.; Daniel, B.E.; Mendez, C.J.; Newman, M.S.; Zhu, G.Z. Insertion of poly(ethylene glycol) derivatized phospholipid into pre-formed liposomes results in prolonged in vivo circulation time. FEBS Lett. 1996, 386, 243–246. [Google Scholar] [CrossRef] [PubMed]
- Tagami, T.; Ernsting, M.J.; Li, S.D. Optimization of a novel and improved thermosensitive liposome formulated with dppc and a brij surfactant using a robust in vitro system. J. Control. Release 2011, 154, 290–297. [Google Scholar] [CrossRef] [PubMed]
- Chen, J.; Cheng, D.; Li, J.; Wang, Y.; Guo, J.X.; Chen, Z.P.; Cai, B.C.; Yang, T. Influence of lipid composition on the phase transition temperature of liposomes composed of both dppc and hspc. Drug Dev. Ind. Pharm. 2013, 39, 197–204. [Google Scholar] [CrossRef] [PubMed]
- Karanth, H.; Murphy, R.S.R. Ph-sensitive liposomes—principle and application in cancer therapy. J. Pharm. Pharmacol. 2007, 59, 469–483. [Google Scholar] [CrossRef] [PubMed]
- Zheng, Y.; Liu, X.; Samoshina, N.M.; Chertkov, V.A.; Franz, A.H.; Guo, X.; Samoshin, V.V. Fliposomes: Ph-controlled release from liposomes containing new trans-2-morpholinocyclohexanol-based amphiphiles that perform a conformational flip and trigger an instant cargo release upon acidification. Nat. Prod. Commun. 2012, 7, 353–358. [Google Scholar] [PubMed]
- Ulbrich, K.; Hekmatara, T.; Herbert, E.; Kreuter, J. Transferrin- and transferrin-receptor-antibody-modified nanoparticles enable drug delivery across the blood-brain barrier (BBB). Eur. J. Pharm. Biopharm. 2009, 71, 251–256. [Google Scholar] [CrossRef] [PubMed]
- Michaelis, K.; Hoffmann, M.M.; Dreis, S.; Herbert, E.; Alyautdin, R.N.; Michaelis, M.; Kreuter, J.; Langer, K. Covalent linkage of apolipoprotein e to albumin nanoparticles strongly enhances drug transport into the brain. J. Pharmacol. Exp. Ther. 2006, 317, 1246–1253. [Google Scholar] [CrossRef] [PubMed]
- Hülsermann, U.; Hoffmann, M.M.; Massing, U.; Fricker, G. Uptake of apolipoprotein e fragment coupled liposomes by cultured brain microvessel endothelial cells and intact brain capillaries. J. Drug Target. 2009, 17, 610–618. [Google Scholar] [CrossRef] [PubMed]
- Pardridge, W.M.; Triguero, D.; Buciak, J.; Yang, J. Evaluation of cationized rat albumin as a potential blood-brain barrier drug transport vector. J. Pharmacol. Exp. Ther. 1990, 255, 893–899. [Google Scholar] [PubMed]
- Kumagai, A.K.; Eisenberg, J.B.; Pardridge, W.M. Absorptive-mediated endocytosis of cationized albumin and a β-endorphin-cationized albumin chimeric peptide by isolated brain capillaries. J. Biol. Chem. 1987, 262, 15214–15219. [Google Scholar] [PubMed]
- Bangham, A.D.; Standish, M.M.; Watkins, J.C. Diffusion of univalent ions across the lamellae of swollen phospholipids. J. Mol. Biol. 1965, 13, 238–252. [Google Scholar] [CrossRef] [PubMed]
- Massing, U.; Cicko, S.; Ziroli, V. Dual asymmetric centrifugation (dac)—A new technique for liposome preparation. J. Control. Release 2008, 125, 16–24. [Google Scholar] [CrossRef] [PubMed]
- Hoare, D.G.; Koshland, D.E., Jr. A method for the quantitative modification and estimation of carboxylic acid groups in proteins. J. Biol. Chem. 1967, 242, 2447–2453. [Google Scholar] [PubMed]
- Duncan, R.J.S.; Weston, P.D.; Wrigglesworth, R. A new reagent which may be used to introduce sulfhydryl groups into proteins, and its use in the preparation of conjugates for immunoassay. Anal. Biochem. 1983, 132, 68–73. [Google Scholar] [CrossRef] [PubMed]
- Ellman, G.L. Tissue sulfhydryl groups. Arch. Biochem. Biophys. 1959, 82, 70–77. [Google Scholar] [CrossRef] [PubMed]
- Kessler, R.J.; Fanestil, D.D. Interference by lipids in the determination of protein using bicinchoninic acid. Anal. Biochem. 1986, 159, 138–142. [Google Scholar] [CrossRef] [PubMed]
- Peterson, G.L. Review of the folin phenol protein quantitation method of lowry, rosebrough, farr and randall. Anal. Biochem. 1979, 100, 201–220. [Google Scholar] [CrossRef] [PubMed]
- Franke, H.; Galla, H.; Beuckmann, C.T. Primary cultures of brain microvessel endothelial cells: A valid and flexible model to study drug transport through the blood-brain barrier in vitro. Brain Res. Protoc. 2000, 5, 248–256. [Google Scholar] [CrossRef]
- Haigler, H.T.; Maxfield, F.R.; Willingham, M.C.; Pastan, I. Dansylcadaverine inhibits internalization of 125i-epidermal growth factor in balb 3t3 cells. J. Biol. Chem. 1980, 255, 1239–1241. [Google Scholar] [PubMed]
- Sigma. Bovine Serum Albumin. In Product Information; Sigma: St. Louis, MO, USA, 1997; p. 5. [Google Scholar]
- Schnitzer, J.E.; Oh, P.; Pinney, E.; Allard, J. Filipin-sensitive caveolae-mediated transport in endothelium: Reduced transcytosis, scavenger endocytosis, and capillary permeability of select macromolecules. J. Cell Biol. 1994, 127, 1217–1232. [Google Scholar] [CrossRef] [PubMed]
- Cerletti, A.; Drewe, J.; Fricker, G.; Eberle, A.N.; Huwyler, J. Endocytosis and transcytosis of an immunoliposome-based brain drug delivery system. J. Drug Target. 2000, 8, 435–446. [Google Scholar] [CrossRef] [PubMed]
© 2015 by the authors; licensee MDPI, Basel, Switzerland. This article is an open access article distributed under the terms and conditions of the Creative Commons Attribution license (http://creativecommons.org/licenses/by/4.0/).
Share and Cite
Helm, F.; Fricker, G. Liposomal Conjugates for Drug Delivery to the Central Nervous System. Pharmaceutics 2015, 7, 27-42. https://0-doi-org.brum.beds.ac.uk/10.3390/pharmaceutics7020027
Helm F, Fricker G. Liposomal Conjugates for Drug Delivery to the Central Nervous System. Pharmaceutics. 2015; 7(2):27-42. https://0-doi-org.brum.beds.ac.uk/10.3390/pharmaceutics7020027
Chicago/Turabian StyleHelm, Frieder, and Gert Fricker. 2015. "Liposomal Conjugates for Drug Delivery to the Central Nervous System" Pharmaceutics 7, no. 2: 27-42. https://0-doi-org.brum.beds.ac.uk/10.3390/pharmaceutics7020027