Epidemic Spreading in Urban Areas Using Agent-Based Transportation Models


1
Institute of Construction and Infrastructure Management, ETH Zurich, 8093 Zurich, Switzerland
2
Institute for Transport Planning and Systems, ETH Zurich, 8093 Zurich, Switzerland
*
Author to whom correspondence should be addressed.
Future Internet 2019, 11(4), 92; https://0-doi-org.brum.beds.ac.uk/10.3390/fi11040092
Submission received: 26 February 2019
/
Revised: 27 March 2019
/
Accepted: 1 April 2019
/
Published: 8 April 2019
(This article belongs to the Special Issue Selected papers from The 7th International Conference on Complex Networks and Their Applications)
Abstract
:Human mobility is a key element in the understanding of epidemic spreading. Thus, correctly modeling and quantifying human mobility is critical for studying large-scale spatial transmission of infectious diseases and improving epidemic control. In this study, a large-scale agent-based transport simulation (MATSim) is linked with a generic epidemic spread model to simulate the spread of communicable diseases in an urban environment. The use of an agent-based model allows reproduction of the real-world behavior of individuals’ daily path in an urban setting and allows the capture of interactions among them, in the form of a spatial-temporal social network. This model is used to study seasonal influenza outbreaks in the metropolitan area of Zurich, Switzerland. The observations of the agent-based models are compared with results from classical SIR models. The model presented is a prototype that can be used to analyze multiple scenarios in the case of a disease spread at an urban scale, considering variations of different model parameters settings. The results of this simulation can help to improve comprehension of the disease spread dynamics and to take better steps towards the prevention and control of an epidemic.
1. Introduction
Epidemic spreading is strongly correlated with human mobility. Thus, understanding and modeling human mobility patterns is an important component for the development of realistic epidemic spread models. Presently, mobility and traffic have reached a complexity and volume of an unprecedented degree. Millions of people travel billions of miles on international flights each week, while hundreds of millions of people commute on a complex web of highways and railroads most of which operate at their maximum capacity. Despite this increasing connectivity and the ability to visit almost every place on this planet in a matter of days, the magnitude and intensity of modern human traffic have made human society more susceptible to threats intimately connected to human travel. Long-range human mobility is now revealed to be responsible for the rapid geographical spread of emergent infectious diseases [1,2].
In recent years this has been made evident by several epidemic outbreaks, including the severe acute respiratory syndrome (SARS) in 2003, the 2009 H1N1 influenza pandemic, the Ebola virus in 2013 and the Zika virus epidemic in 2016. In all those cases, the disease started locally but spread rapidly around the globe. Consequently, intense research effort has been devoted during the recent decade to the development of quantitative models for epidemic spreading. Hence, numerous epidemic models have been devised in the past with a wide range of complexity levels. One less complex model is the “classic” approach to model the population and disease spread via a dynamical system, where the dynamics of the infected population is described with a system of coupled nonlinear differential equations [3,4]. More sophisticated are complex network models, where the underlying social network and population interaction are modeled with modern methods of network theory [5,6]. Furthermore, with the increasing availability of computer resources agent-based simulation has become a practical method to study epidemics [7]. Agent-based models are stochastic, spatially explicit, discrete-time, simulation models where the agents represent single individuals which interacting in time and space according to prescribed rules [8]. Such an approach enables to model the entire population in a plausible manner, providing a model of community that acts as if it inhabits the city or the whole country [9,10]. In addition to daily activities, this approach can also be used to model a variety of extracurricular activities, ranging from tourists moving around a city [11,12,13] to emergency evacuations/response caused by man-made and natural hazards [14,15,16].
In this work, disease propagation models to simulate epidemic outbreaks are implemented in a large-scale agent-based transport simulation (MATSim [17]). This model is used to study seasonal influenza outbreaks in the metropolitan area of Zurich, Switzerland. The results of the agent-based model are compared with the classical SIR model. Specifically, this work advances the state-of-the-art in the field of agent-based epidemic spread models as follows.
- Using a large-scale agent-based transport simulation model, it is feasible to describe individual behavior throughout an epidemic outbreak. Not only can the locations, the person-to-person interaction time, and the activities of each individual be simulated, but also the interactions between household members and their behavior changes can be taken into account.
- Because each person is represented individually, it is possible to directly assign infection and recovery probabilities to them, which provides a more realistic representation than the parameter-based approach of classical epidemic spread models.
- The proposed approach allows the recreation of historical events of epidemic outbreaks. Using the metropolitan area of Zurich, Switzerland, it is shown that even with simple assumptions the agent-based model gives a good approximation of the seasonal influenza outbreak observed in 2016/2017.
The remainder of this study is structured as follows: In Section 2 a basic introduction to classical, complex network, and agent-based epidemic spread models are given. Section 3 describes the implemented infection model and the adaption of the agent-based model. Section 4 presents the results of the case study and discusses the major findings. Finally, the study concludes with a summary of key contributions and a discussion of open issues and future work, in Section 5.
2. Background
2.1. Classical Epidemic Spread Models
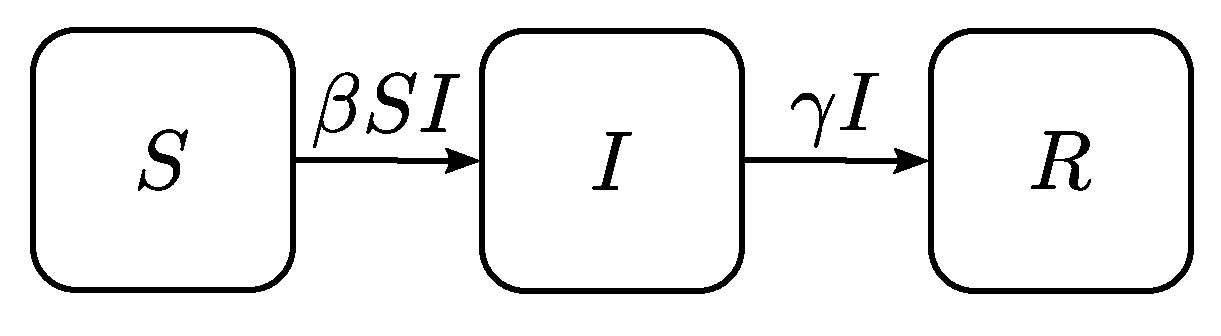
Traditional epidemiology models represent epidemics of communicable disease using a population-based, non-spatial approach. A major assumption of these mathematical models of epidemics is that the population can be divided into a set of distinct compartments. These so-called compartmental models split the population into compartments that represent the different stages of a disease. The most general approach is the SIR model, which was described by Kermack and McKendrick [3], considering three compartments: susceptible (S), infected (I), and recovered (R). Individuals that are susceptible have, in the case of the basic SIR model, never been infected, and they can catch the disease. Once they have it, they move into the Infected compartment. Infected individuals can spread the disease to susceptible individuals. The time they spend in the infected compartment is the infectious period, after which they enter the recovered compartment. The recovered compartment represents individuals that have recovered from the disease and no longer take an active part in the disease spread. The SIR model represents the virus transmission by a set of nonlinear ordinary differential equations (ODEs) that associate a transition rate to the mobility of agents between compartments.
These equations describe the time evolution of a population between disease states susceptible, infected, and recovered. The rate of new infections can be defined as , where is a parameter for infectivity. Infected individuals are assumed to recover with a constant probability at any time, which translates into a constant per capita recovery rate , and thus an overall rate of recovery . Figure 1 illustrates the scheme of the basic SIR model.
The basic SIR model assumes that the total population size remains constant over time . i.e., demographic turnovers (birth or death) are not considered. Another restriction of the original compartment model is that the model assumes that populations are completely mixed and, therefore, ignore spatial effects of spread epidemics; also, the interaction between individuals are neglected since they model populations as continuous entities [18]. Additionally, the SIR model is deterministic which implies that no randomness is involved. Hence, the same starting conditions give the same output.
Based on this general model many variations of the disease-spreading model can be derived, including the SI Susceptible-Infected, SIS Susceptible-Infected-Susceptible, or SEIR Susceptible-Exposed-Infected-Recovered. The last model adds an intermediate stage E which represents a latent state in which individuals have been exposed to the disease but are not yet infective, i.e., the individuals in this stage have the virus but cannot infect others [9]. Furthermore, the models can be extended to account for vaccination strategies [19,20].
The advantage of these models is that they have only a small number of parameters, are easily extendable, can be solved numerically or even have analytical solutions [21,22]. However, by considering an aggregated population, individual behavior cannot be taken into account, which has, in the presence of an infectious disease, a great influence on the epidemic dynamics [23].
2.2. Complex Network Epidemic Spread Models
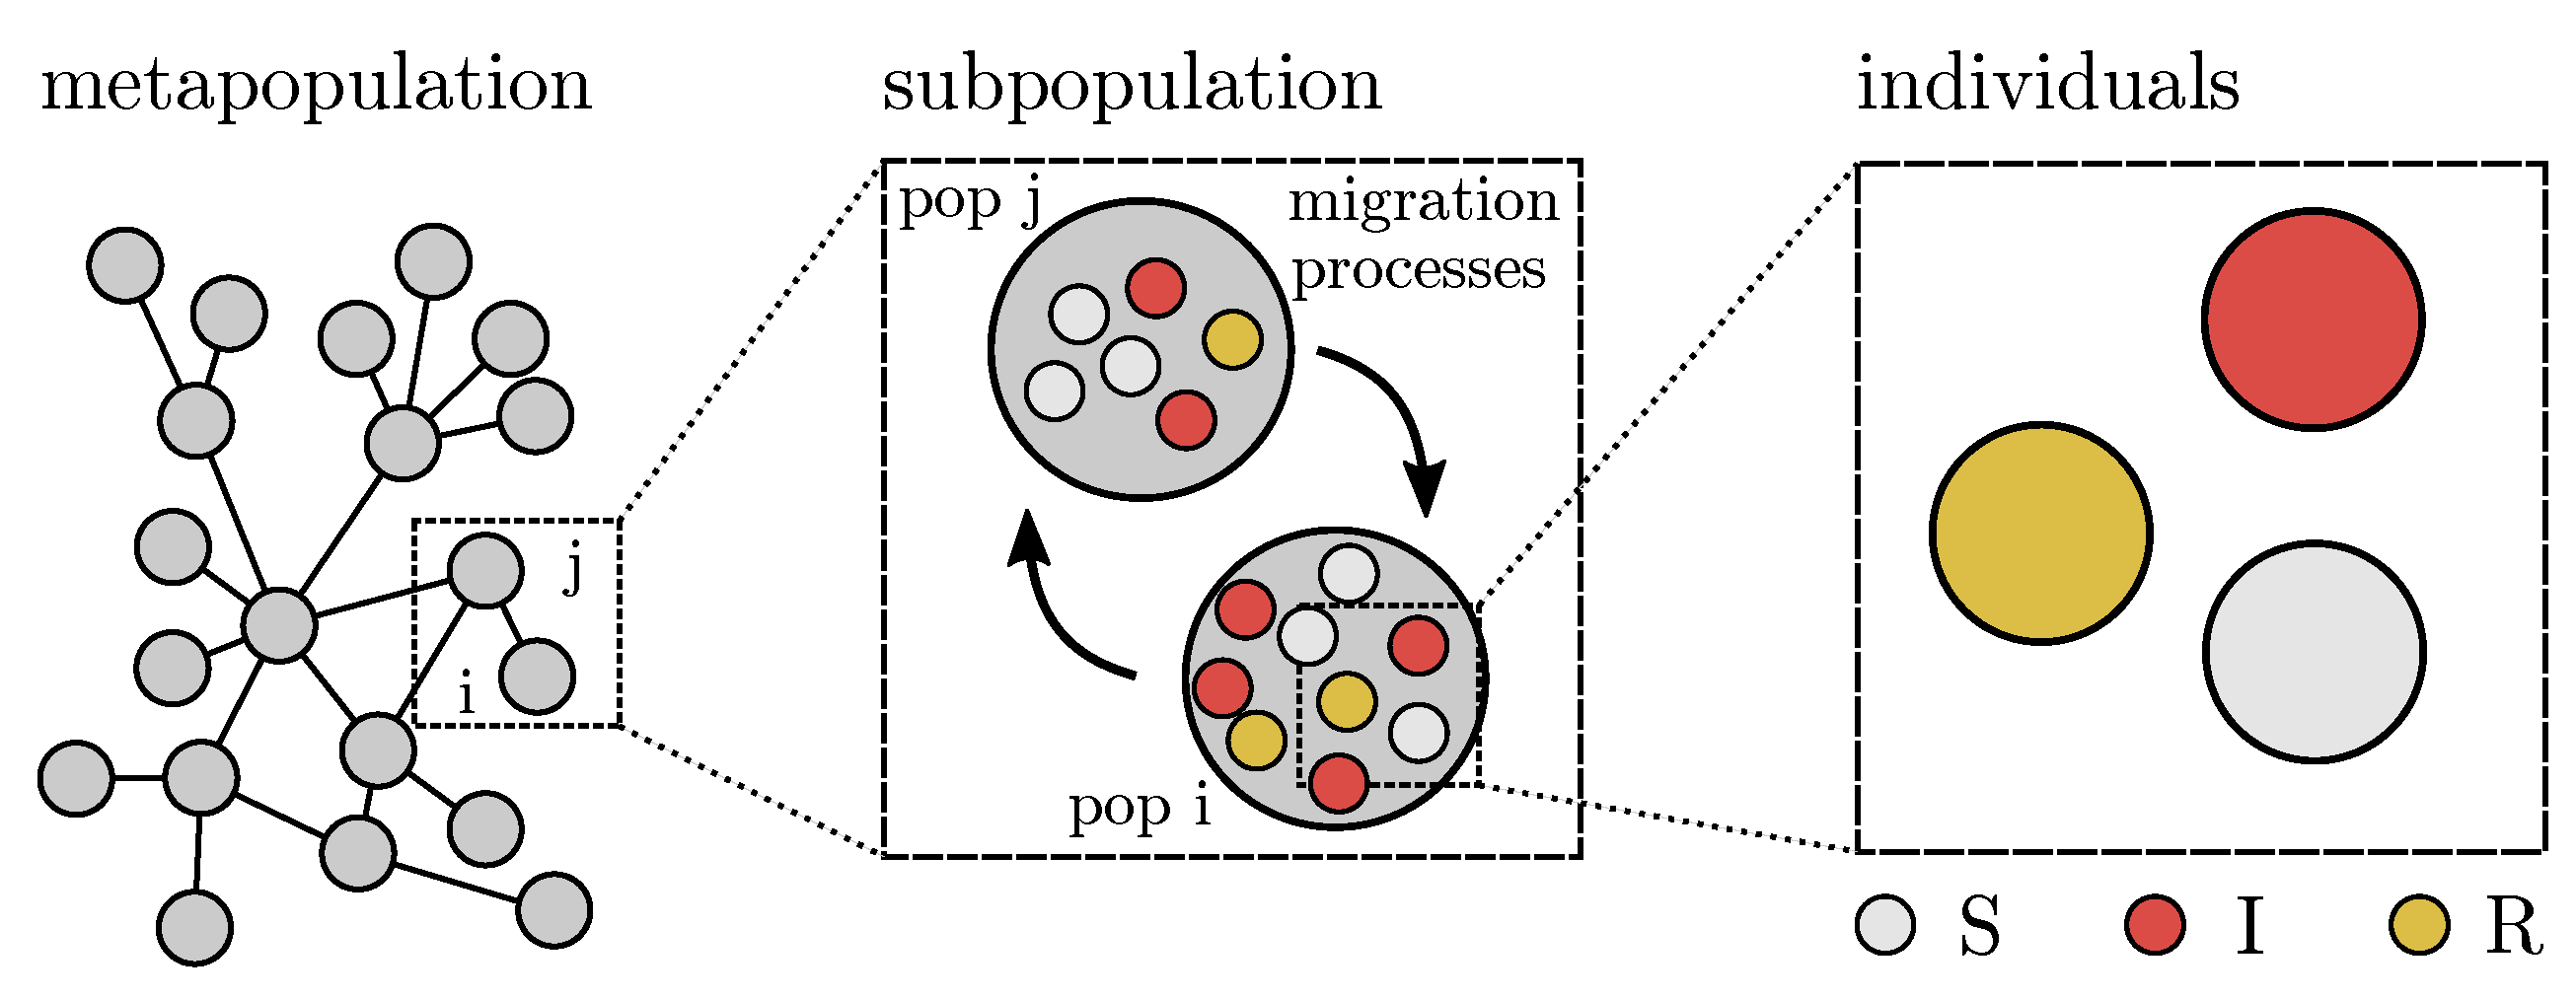
Metapopulation models extend the traditional epidemiological approaches to differentiate types of the population within each epidemic state (S, I, R). These models rely on the basic assumption that the system under study is characterized by a highly fragmented environment in which the population is structured and localized in relatively isolated discrete patches or subpopulations connected by some degree of migration. Therefore, unlike classical epidemic spread models, complex network models allow consideration of a more realistic and accurate representation of heterogeneities in the population [24].
Metapopulation epidemic models describe spatially structured interacting subpopulations, such as city locations, urban areas, or defined geographical regions. Individuals within each subpopulation are divided into classes denoting their state with respect to the modeled disease, such as infected, susceptible, recovered, etc. and the compartment dynamics accounts for the possibility that individuals in the same location may get into contact and change their state according to the infection dynamics. The interaction among subpopulations is the result of the movement of individuals from one subpopulation to the other [25]. Figure 2 shows a sketch of a metapopulation model with three different scales of the system.
Compartmental models cannot capture the complexity of human behavior, particularly regarding mobility patterns and social networks. Although metapopulation models attempt to overcome such limitations they still suffer from behavioral generalizations within the metapopulations [9].
2.3. Agent-Based Epidemic Spread Models
In contrast, Agent-based models (ABMs) allow interactions among individuals (agents) and can overcome the limitations of compartmental and metapopulation models. Modeling epidemic spreading using an agent-based approach pursues the progression of a disease through each individual, and tracks the contacts of each individual with others in the relevant social networks and geographical areas (e.g., co-workers, schoolmates) [18]. The overall system behavior results from the interactions among the multiple single agents of different kinds. The behaviors and interactions of the agents are mostly specified through a simple set of rules or a more sophisticated entity with many interacting rules. It is possible to consider individual variations in the behavioral rules (“heterogeneity”) and random influences or variations (“stochasticity”) [26]. This allows an abstraction of human actions by defining autonomous decision-making agents for the complex system.
Although these models effectively track the progression of the disease through each individual and track the contacts of each individual with others in the relevant system (social or natural), researchers started to add physical infrastructures such as road networks, and real geographic environments to account for more complex interactions among susceptible and infected individuals.
Eubank et al. [27] developed a simulation tool called EpiSims, which is a highly resolved agent-based simulation tool, combining realistic estimates of population mobility, based on census and land-use data, with parameterized models for simulating the progress of a disease within a host and of transmission between hosts. The synthetic social connection model is derived from agent activities produced by the Transportation Analysis Simulation System (TRANSIM). Perez and Dragicevic [18] developed an agent-based modeling approach, which integrates geographic information systems (GIS) to simulate a measles outbreak in an urban environment (Burnaby, BC, Canada), as a result of individuals’ interactions in a geospatial context. Individuals in a closed population are explicitly represented by agents associated with places where they interact with other agents. They are endowed with mobility, through a transportation network allowing them to move between places within the urban environment. Smieszek et al. [10] reconstructed the 2003/2004 H3N2 influenza epidemic in Switzerland with a spatially explicit, individual-based model. The model makes use of disaggregated human travel data of whole Switzerland generated by the open source transport simulation software MATSim. Luo et al. [28] modeled an artificial town populated with 1500 agents to study the propagation rules and control measures of the H1N1 influenza virus. Beside modeling behavior changes due to the epidemic, the other focus is the consideration of public transport which is a high-rate infection place due to high population density.
Because agent-based transport models are relatively computationally intensive, it was only in the last decade that they found their way into the modeling and estimation of epidemic spreads. In the same period, considerable progress was also made in modeling traffic flows that have not been incorporated into epidemic spread modeling until now. For example, the generation of household populations for the simulation of entire households has been studied only recently in the field of transport planning [29], allowing simulation of transport-related phenomena such as interactions between household members, during weekdays and weekends, with varying assumptions about their behavior changes [30].
3. Methods
Seasonal influenza epidemics are very complex in their dynamics and their effective drivers because the virus is transmitted from one individual to another one through direct physical contact, indirect physical contact, or airborne routes [10]. Throughout the day, these individuals are involved in a sequence of activities. Some of the activities are related to a fixed location, e.g., home, school, workplaces, commercial, and shopping areas, while other activities are related to the daily commuting activities of individuals through the public transportation system. When individuals travel from one place to another and thereby joining other groups, the likelihood of epidemic spread increases. Hence a key element of predicting disease propagations is an accurate simulation of this population dynamic [18]. In this study, a generic epidemic spread model—based on the SIR model—is implemented in a large-scale agent-based transport simulation, which enables to simulate daily activities of commuting, studying, working, and leisure.
3.1. Generic Epidemic Spread Model
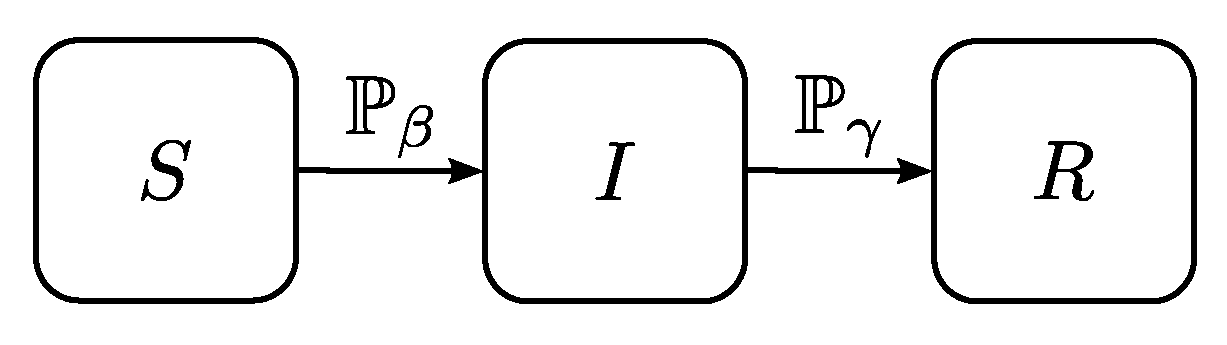
The SIR compartment model is adapted to capture the progression of the epidemic for each agent. Thereby the model is kept very generic to allow further extensions (see Section 5). At the beginning of the simulation, the population is divided into two mutually exclusive states: (1) susceptible agents which can contract influenza and (2) infected agents which are able to transmit the virus. Infected agents are randomly sampled from the whole population N, given the probability of initially infected individuals . Once an infectious individual arrives at a fixed location to perform any stationary activity (e.g., study, work, shopping, ...) every susceptible individual in this location has probability to get infected too. This is the same for the susceptible agent which arrive later throughout the day. At the end of every day, an infected agent recovers with probability . For simplicity reasons, the model is developed in such a way that all recovered individuals cannot become infected again and they will remain immune. Figure 3 illustrates the scheme of the generic epidemic spread model.
The transmission of influenza from an infected individual to a susceptible individual is a complex process dependent upon a variety of factors. The following paragraphs discuss some of the key simplifying assumptions.
- A constant and closed population is assumed meaning that although the number of individuals in each disease state changes over time, the sum of all states is always equal to the population size. Demographic turnovers and fatalities due to the virus are not considered.
- Every agent has the same probability to get infected, even though children are much more infectious than adults and shed virus from just before they develop symptoms until two weeks after infection. Additionally, every susceptible agent in a facility has the probability of getting infected, even if there is no direct contact with an infected agent.
- It is assumed that infected agents do not change their daily activities, i.e., they continue with their original plans.
- Every agent has the same probability of getting recovered.
3.2. Agent-Based Model
Reproducing real-world behavior of individuals’ daily path in an urban setting is done with the open source agent-based transport simulation MATSim [17]. MATSim focuses on the simulation of individual mobility over the course of one day, in a great level of details. Its pluggable architecture and completely disaggregate formulation are the drivers of its increasing adoption not only by researchers in the transportation planning community but also in artificial intelligence [31], as well as practitioners, such as the Swiss Federal Railways [32]. It relies on the equilibrium assumption, standard in transportation models [33]. Assuming each agent has a fixed sequence of activities, located in space, it wants to perform, the software searches for the best combination of routes, modes, and departure times for each agent, considering congestion created by other agents [34].
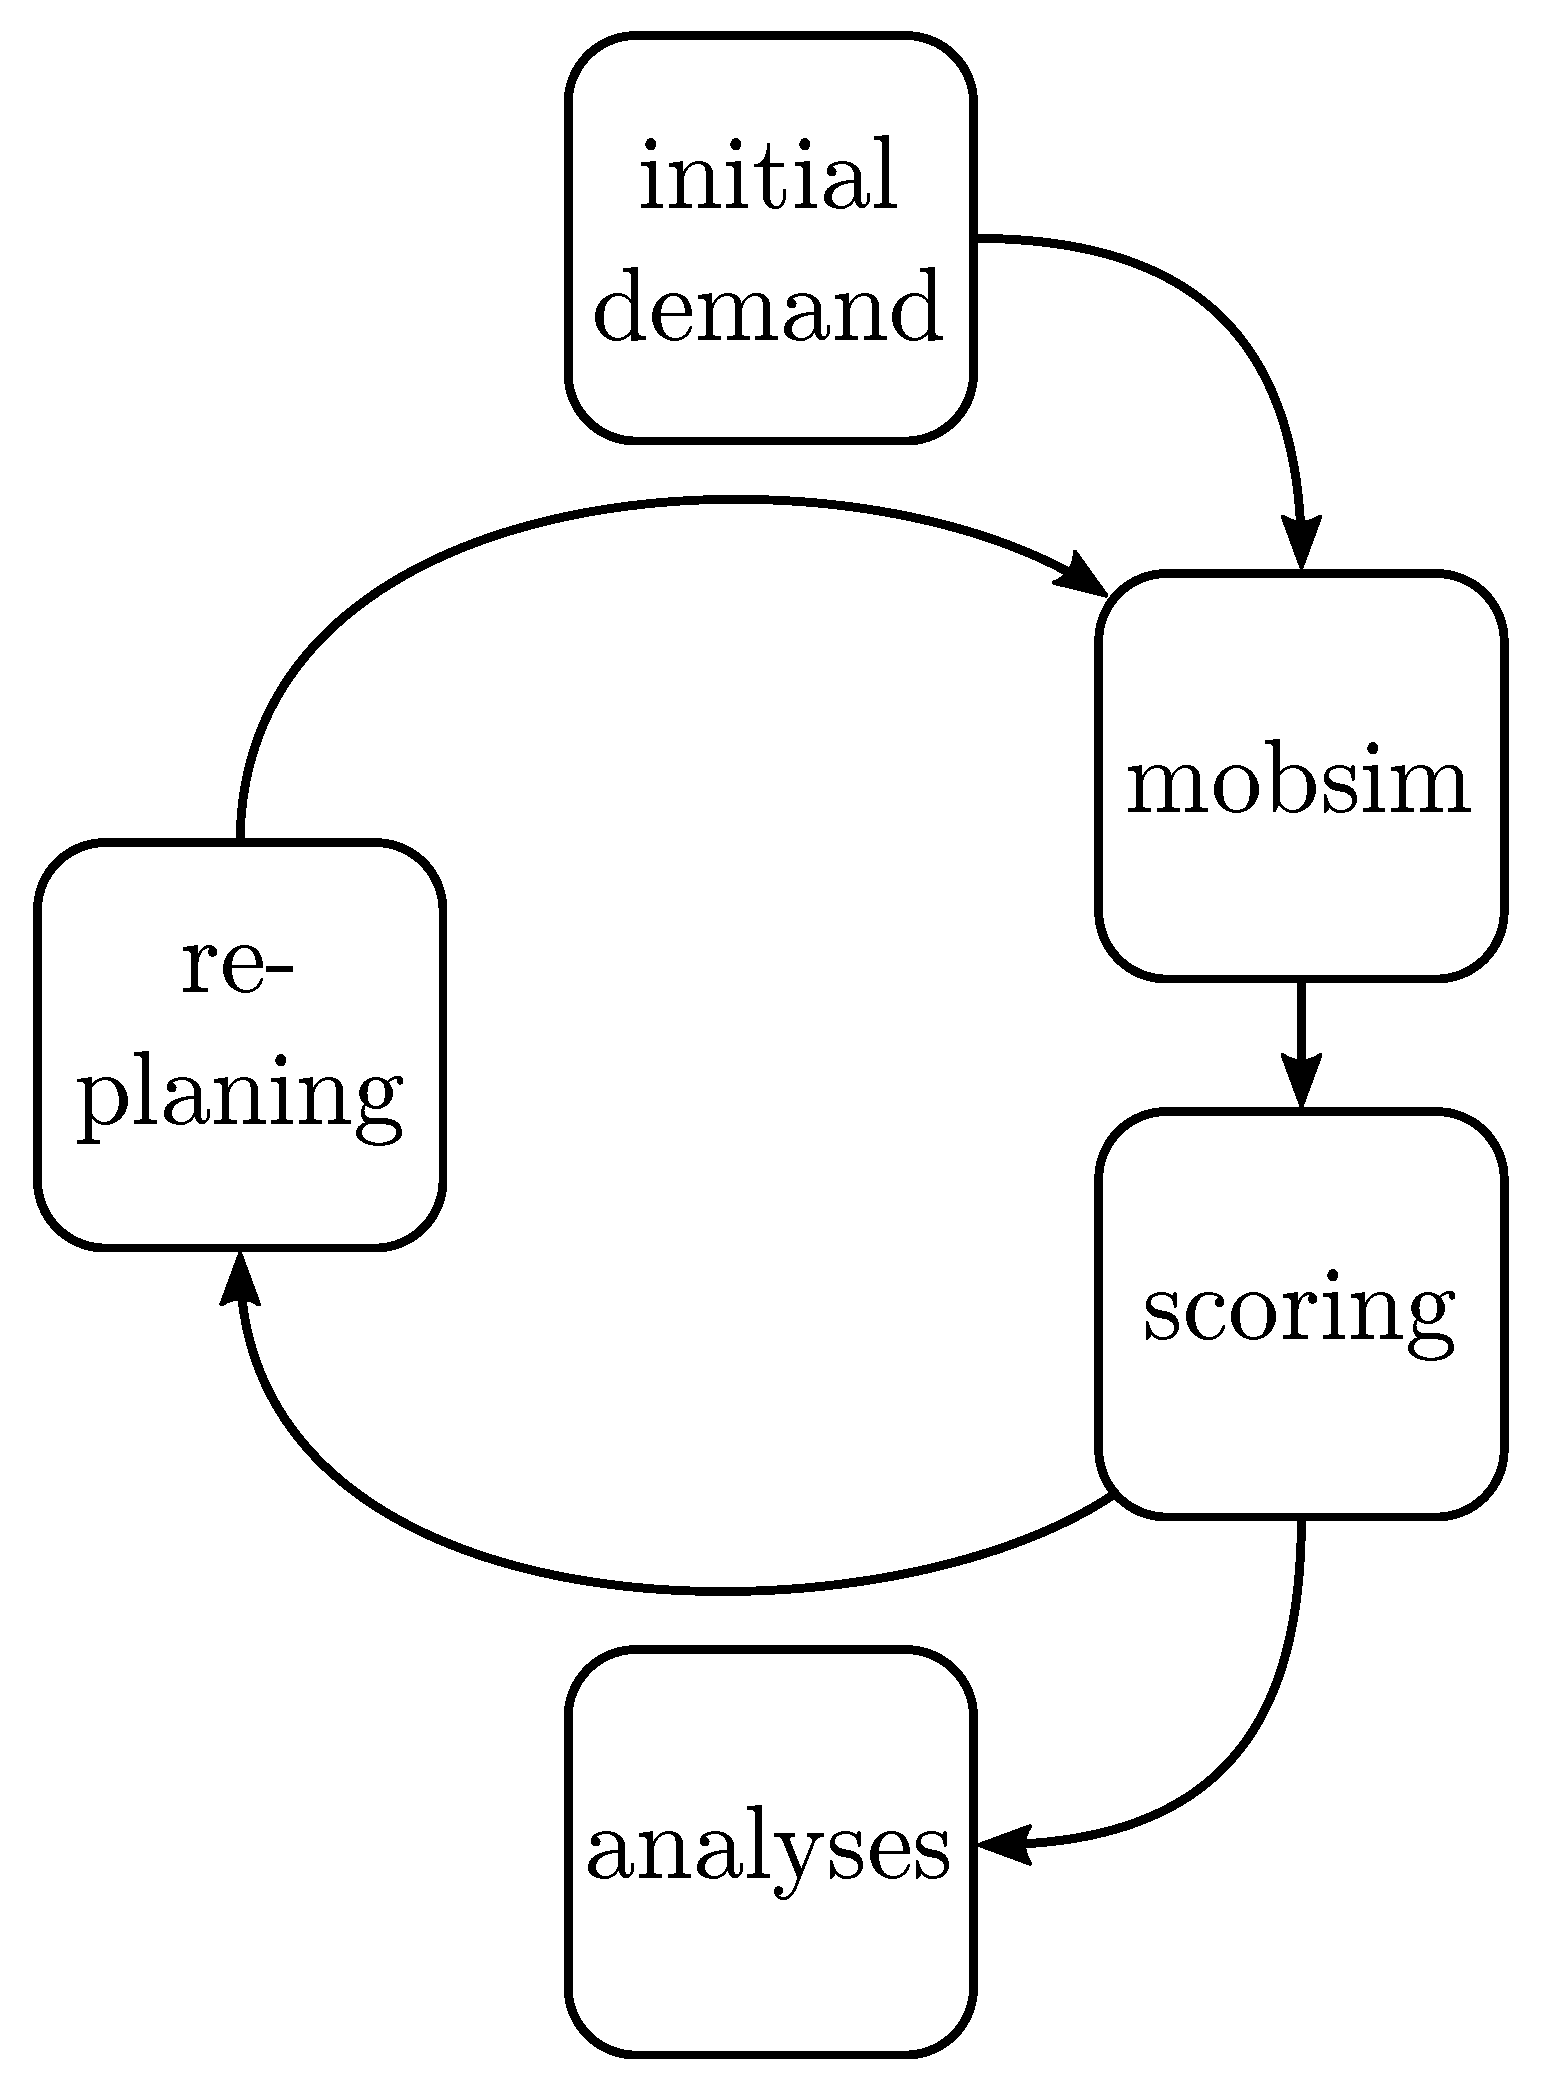
A MATSim run contains a configurable number of iterations, illustrated by the loop of Figure 4. It starts with an initial demand arising from the study area population’s daily activity chains. These chains are usually derived from empirical data through sampling or discrete choice modeling. During iterations, this initial demand is optimized individually by each agent. Every agent possesses a memory containing a fixed number of day plans, where each plan is composed of a daily activity chain and an associated score (i.e., econometric utility). In every iteration, prior to the simulation of the network loading with the MATSim mobility simulation (mobsim), each agent selects a plan from its memory. This selection is dependent on the plan scores, which are computed after each mobsim run, based on the executed plans’ performance. Plan modification is performed by the re-planning modules, on a copy of the selected plan. When the number of plans exceeds the memory size, the plan with the lowest score is removed. This evolutionary process leads to iterative improvements of the plans of the agent, given what other agents are doing. The iterative process is repeated until the average population score stabilizes [17]. Based on this information, individuals can be identified who share the same location and thus have a chance to infect each other. Since no change in the agent’s behavior is considered, the traffic simulation must be conducted only once, and the epidemic spread model can be applied to the analysis phase, drastically decreasing the computational time.
3.3. Model Calibration and Validation
For this paper, the most important part of the simulation is the description of the activity schedule of every agent (“initial demand” in Figure 4). It is that part that constrains where agents will be, and when, thus defining the contagion dynamics. Describing the whole process is out of scope for this paper, and the following focuses on the information that is useful to understand this paper. More details can be found in Bosch et al. [30] and Mueller et al. [29].
This process can be separated into two synthesis steps:
- Defining the agents in terms of basic socio-demographic data and home location
- Assigning an activity schedule to each of these agents.
In the Swiss case, the first step is straightforward, as this data is collected and available for every Swiss resident. A uniform 1% sample of that dataset is used in the rest of the process. During the second step, for each agent, an activity chain, consisting of activity types, sequence, and timings, is sampled from similar individuals in the national travel survey. Work locations are assigned based on the commuter matrices, education locations choosing from the closest ones of the appropriate type, and other activities in a way that reproduces travel distance distribution from the national travel survey. Parameters used by the agent in the loop pictured in Figure 4 are then calibrated to reproduce traffic counts and mode shares from official datasets.
To get a valid result for the epidemic spreading, the model is calibrated based on real-world observations of seasonal influenza occurred in Switzerland in the period 2016/2017 [35]. The dataset contains diagnosed influenza cases by practitioners on a weekly basis. The model results are fitted to the data set using least squares estimation.
3.4. Implementation
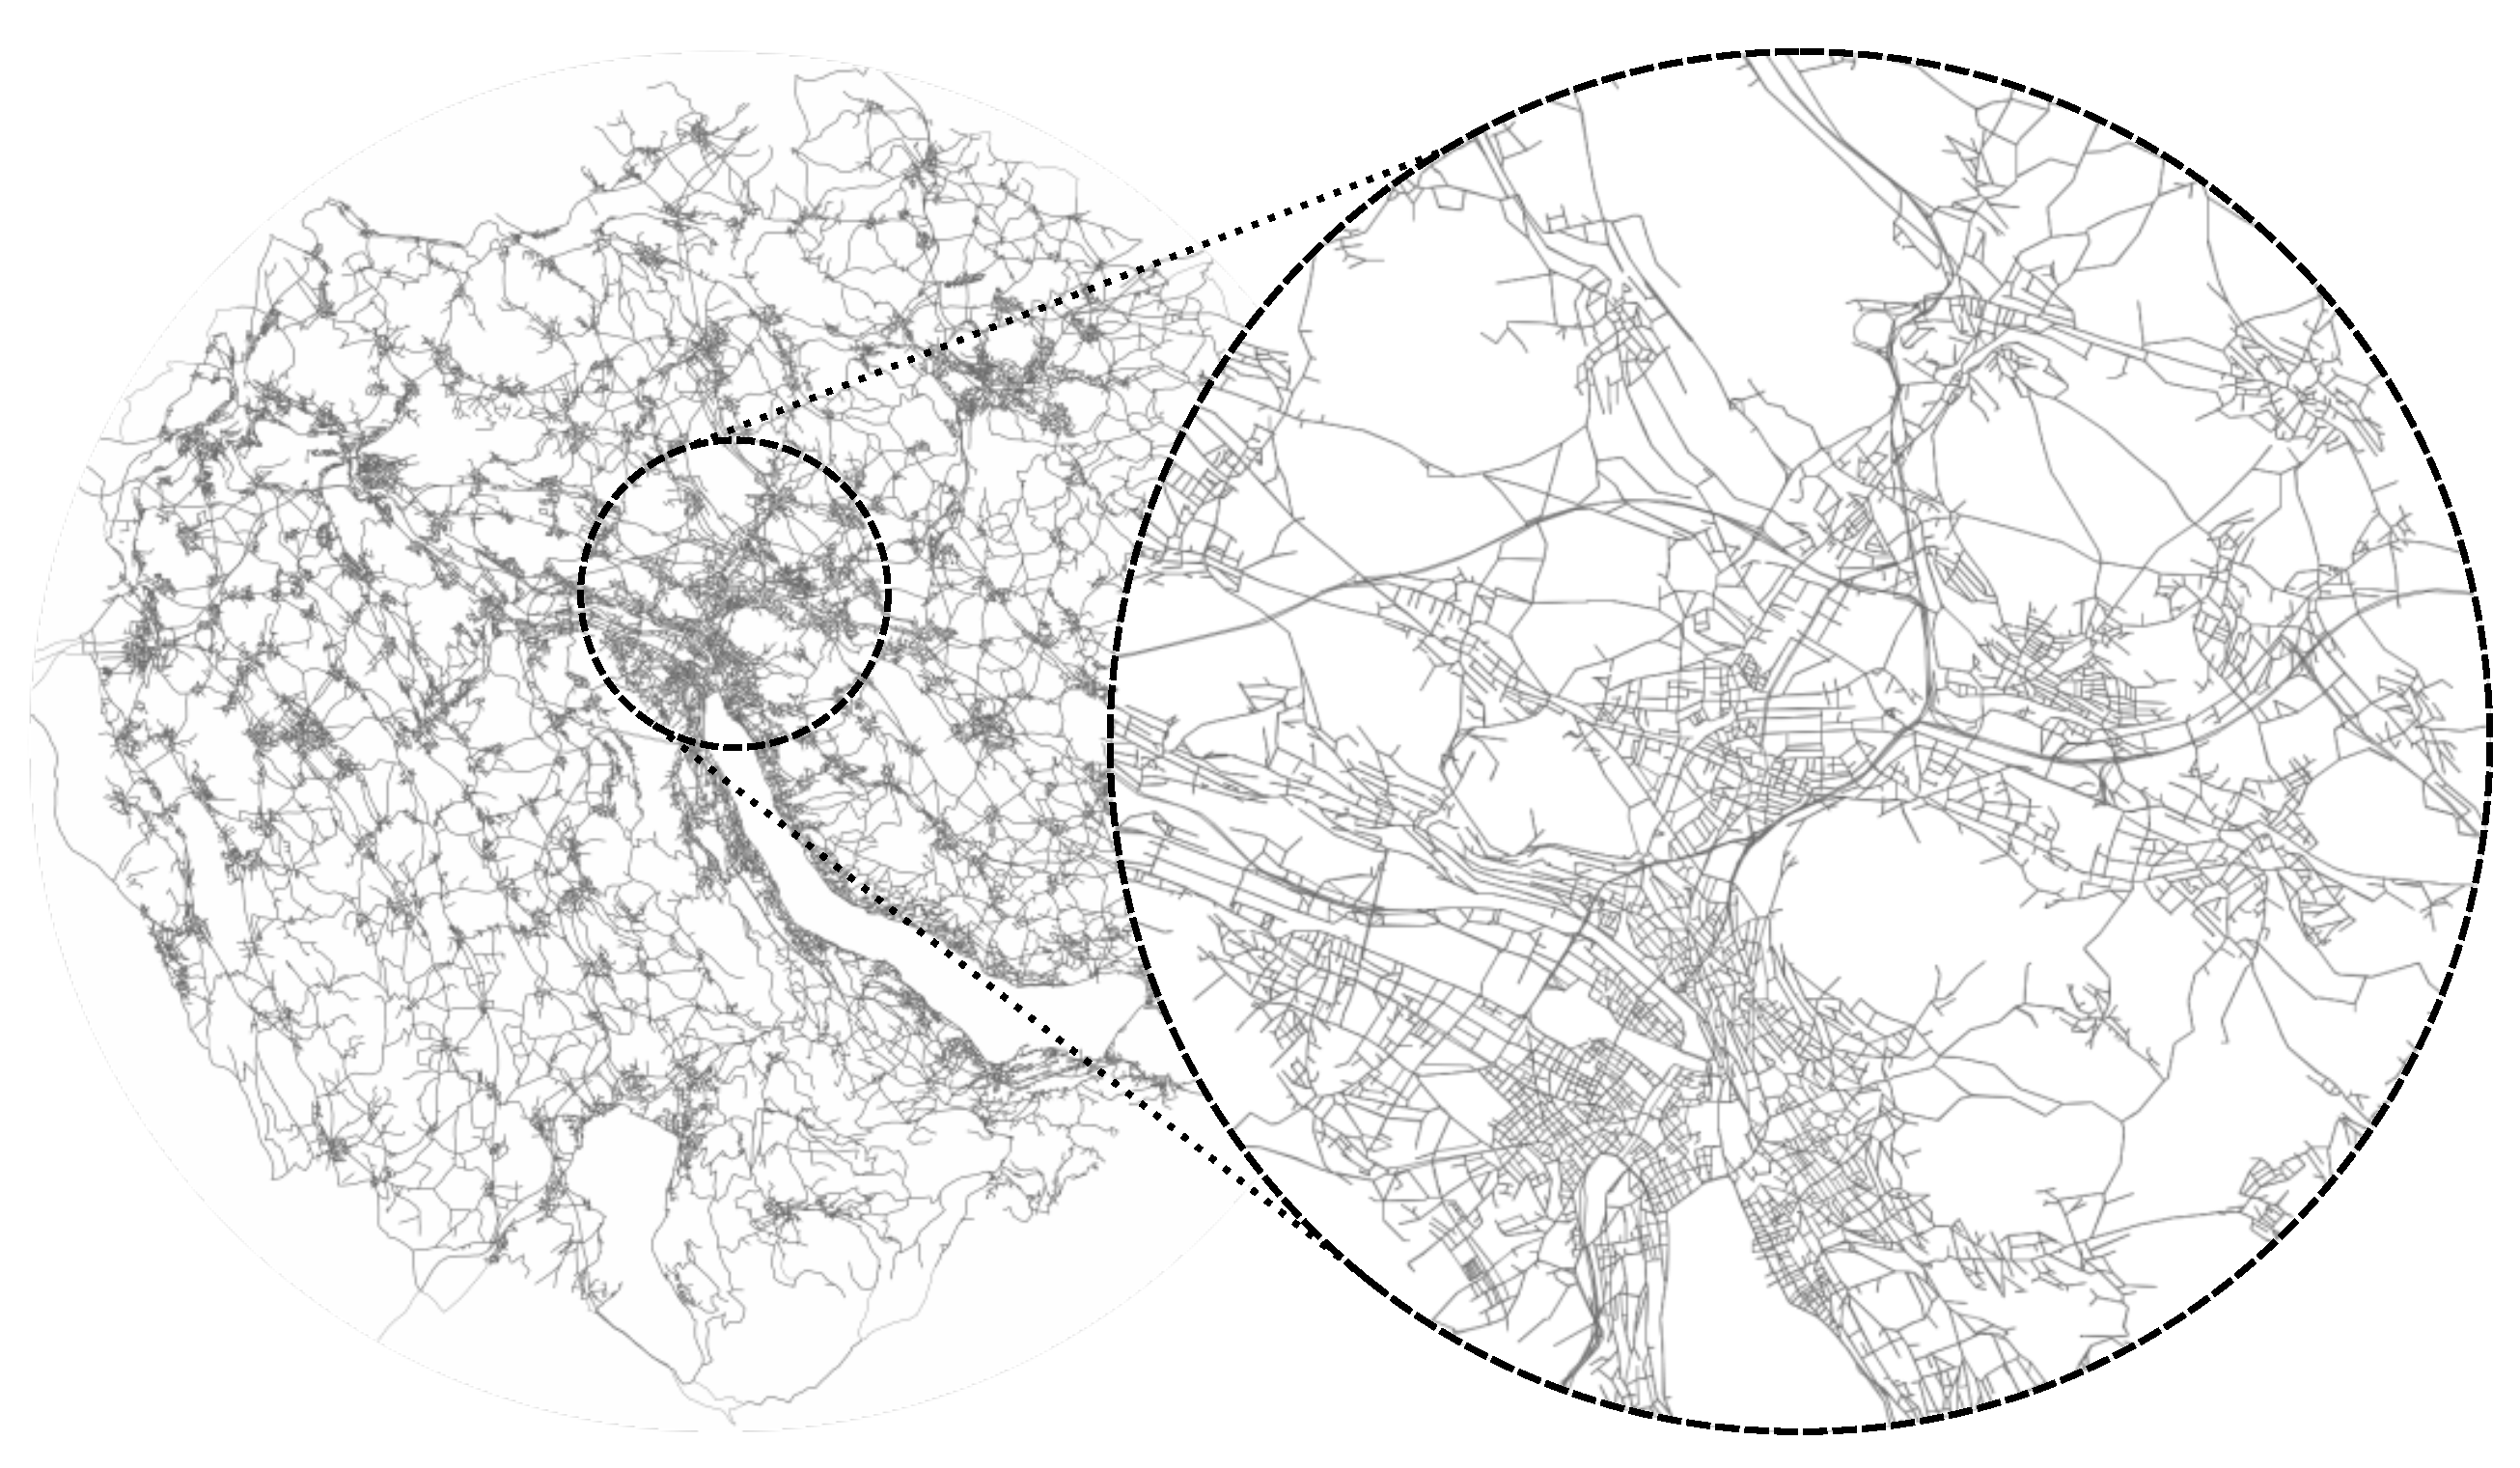
For implementation purposes, a simulation of a seasonal influenza outbreak in a human population located within the metropolitan area of Zurich, Switzerland, is used to implement and illustrate the methodological framework. The area surrounding Zurich is one of Europe’s economically strongest areas and Switzerland’s economic center. The area covered is approximately 2000 km and roughly 1.5 million people live there (see Figure 5).
Simulation of an influenza epidemic spread in a geographic area is computationally intensive and requires the use of georeferenced data sets and a limited number of individuals interacting in the urban space. Due to computational reasons, the entire population of the area cannot be taken into consideration. For illustration purpose a population as big as 1% of the real population is used, i.e., one agent represents 100 individuals. In total 15,286 agents are considered to be involved in an influenza epidemic at an urban scale. Since no behavioral changes of the agents are considered, the results of a single day traffic simulation are reused, only updating the stages (susceptible, infected, recovered) of the agents.
Two examples are designed to illustrate the use of the model:
- Numerical study: The first example is a numerical study where a series of simulations are performed with varying input parameters , and . The aim is to test the variability of the model and to investigate the sensitivity of the individual parameters. Furthermore, it serves as a basis for the second example and the identification of further research priorities.
- Historical event: While the first example gives a general insight into the model, this example aims at the best possible reproduction of a historical event with the gained knowledge. To achieve this, the agent-based epidemic spread model and the classical compartment SIR model are fitted to real data of seasonal influenza in the season 2016/2017 observed in the Zurich area [35].
4. Result and Discussion
4.1. Numerical Study
To simulate the movements and the activities of the agents a (stochastic) user equilibrium must be reached. Eventually, an equilibrium is reached, subject to constraints, where the agents cannot further improve their plans unilaterally. Starting with the initial demand, 1000 iterations are performed, where agents modify their routes, modes, and departure times. The outcome of the last iteration is considered to be in a stochastic user equilibrium and is used for further analysis.
4.1.1. Temporal-Spatial Resolution
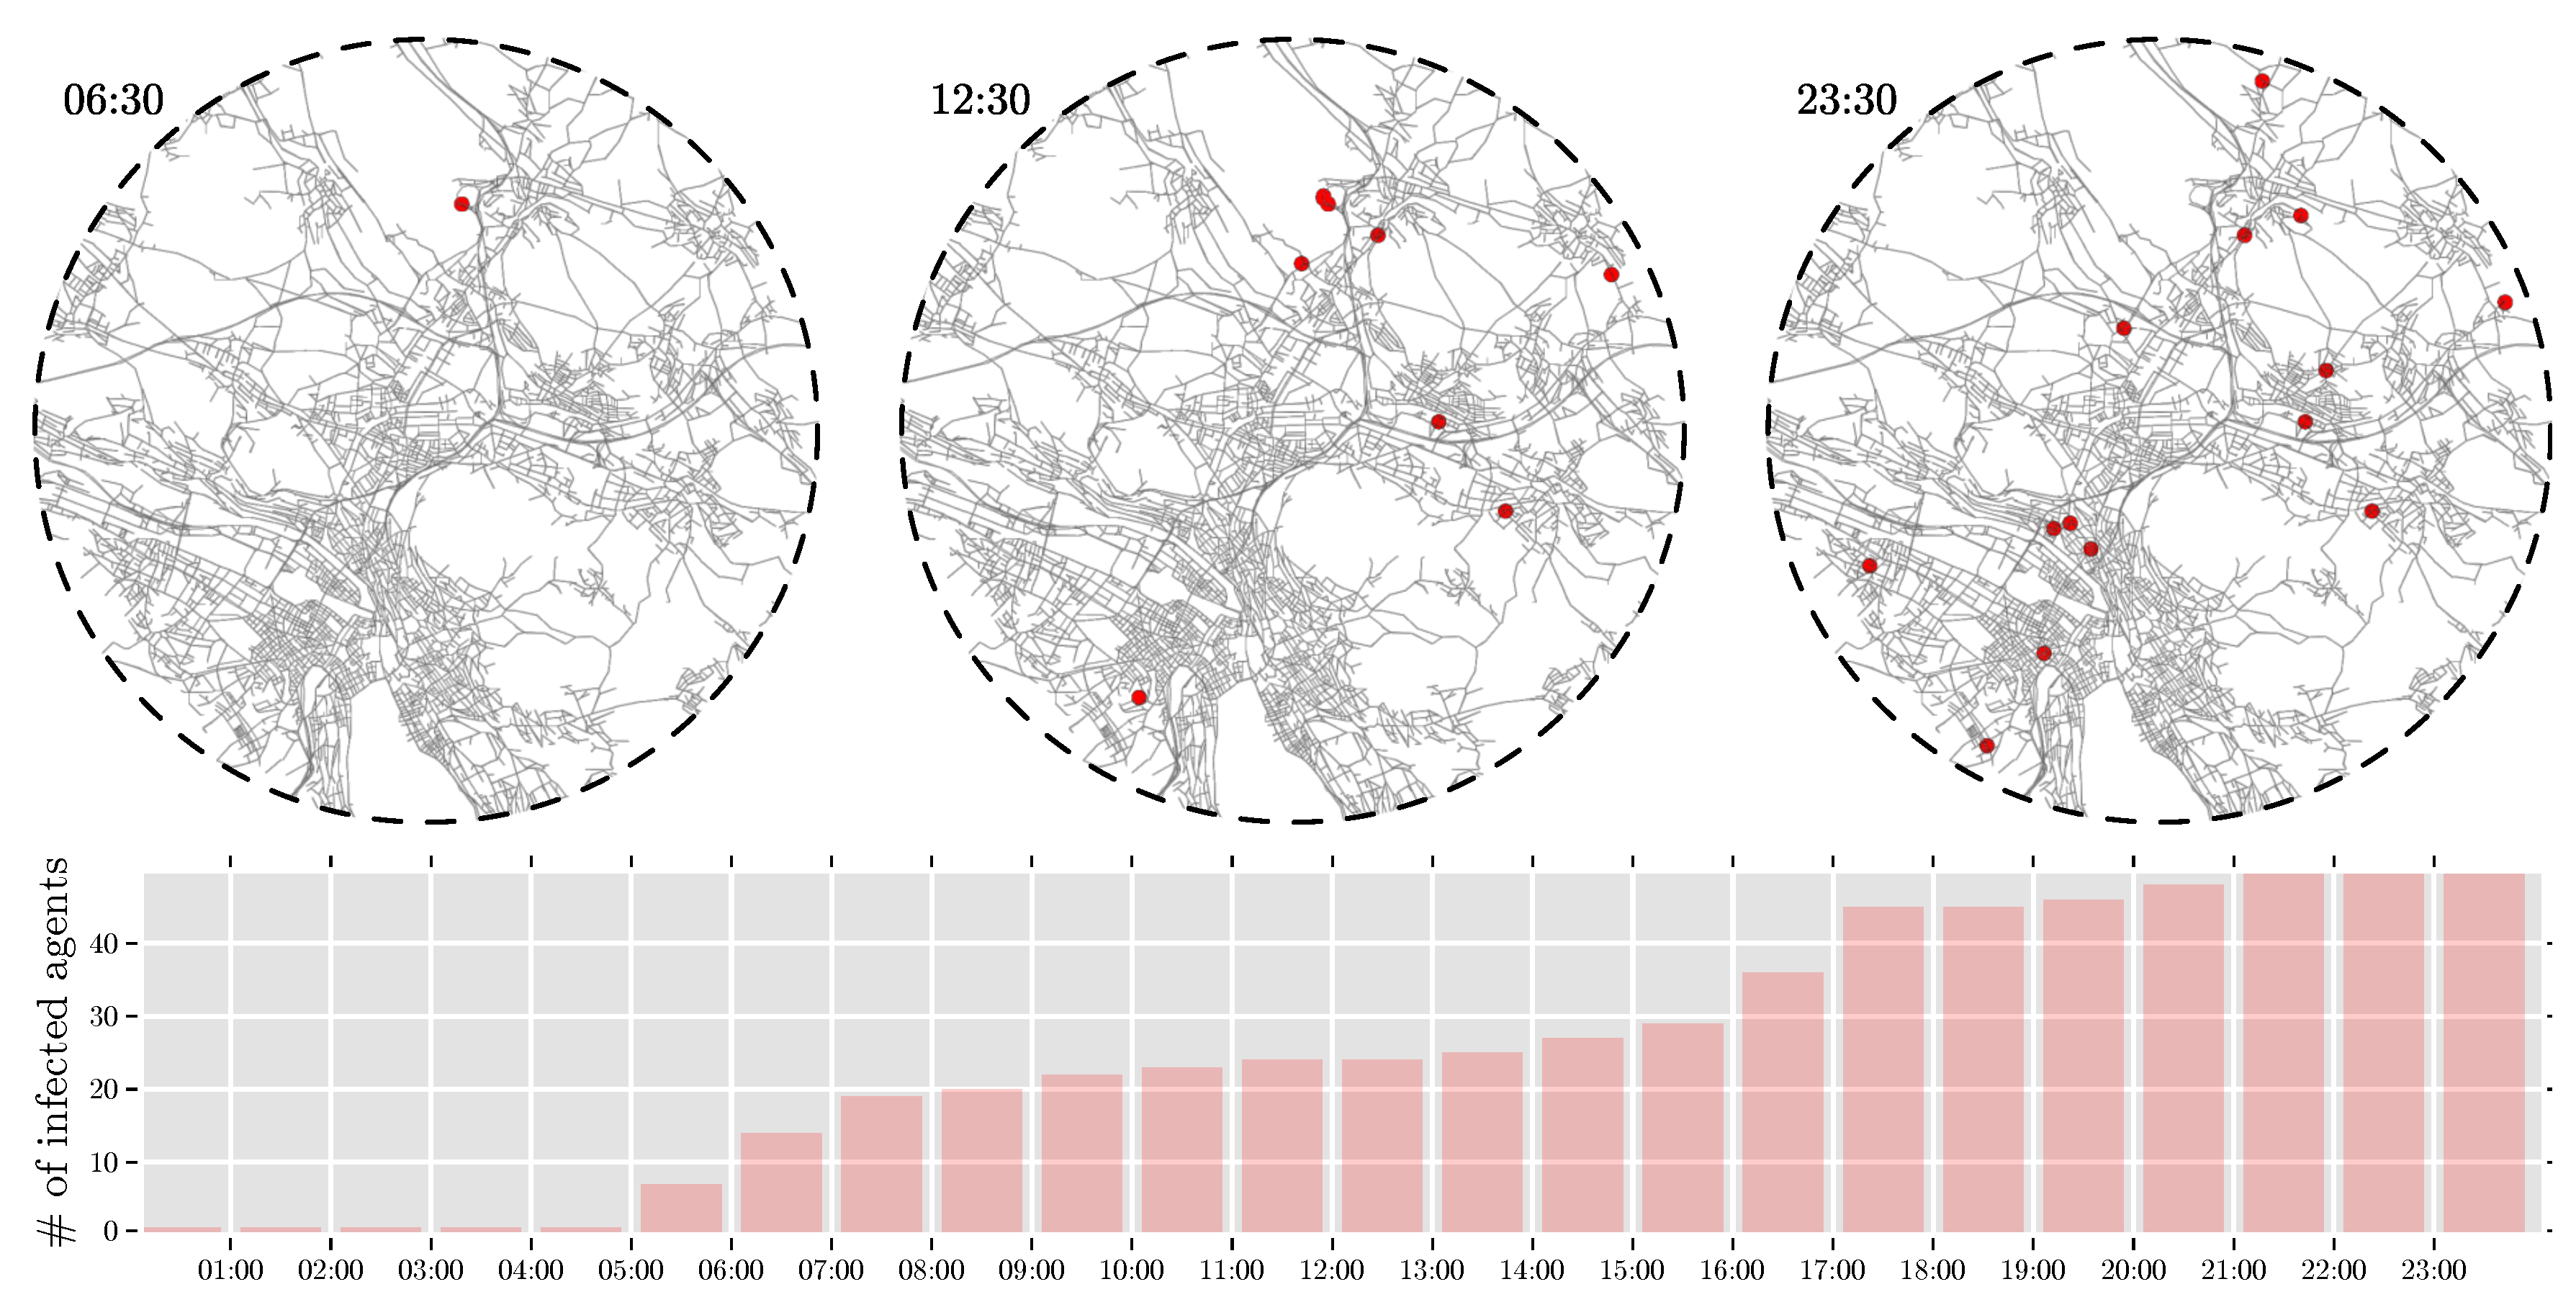
Among other parameters, the model provides the type, location, activity, and health status of each agent with a temporal resolution of one second. Figure 6 illustrate the temporal-spatial spread of the virus over one day. In this specific simulation result, the history of one agent is illustrated. At 6:30 he arrives at work where the virus spread to another agent at the facility. Around 12:30 some agents leave the workplace for lunch or end their shift and carries the virus further on. Finally, when the infected agents come home, there is a certain probability that also their families become infected. At the end of the day one 50 agents are infected. At the top of Figure 6, the spatial distribution of the infected agents in the center of Zurich is illustrated. At the bottom of Figure 6 a summary of the number of infected agents over the first 24 h is given.
4.1.2. Varying Parameters
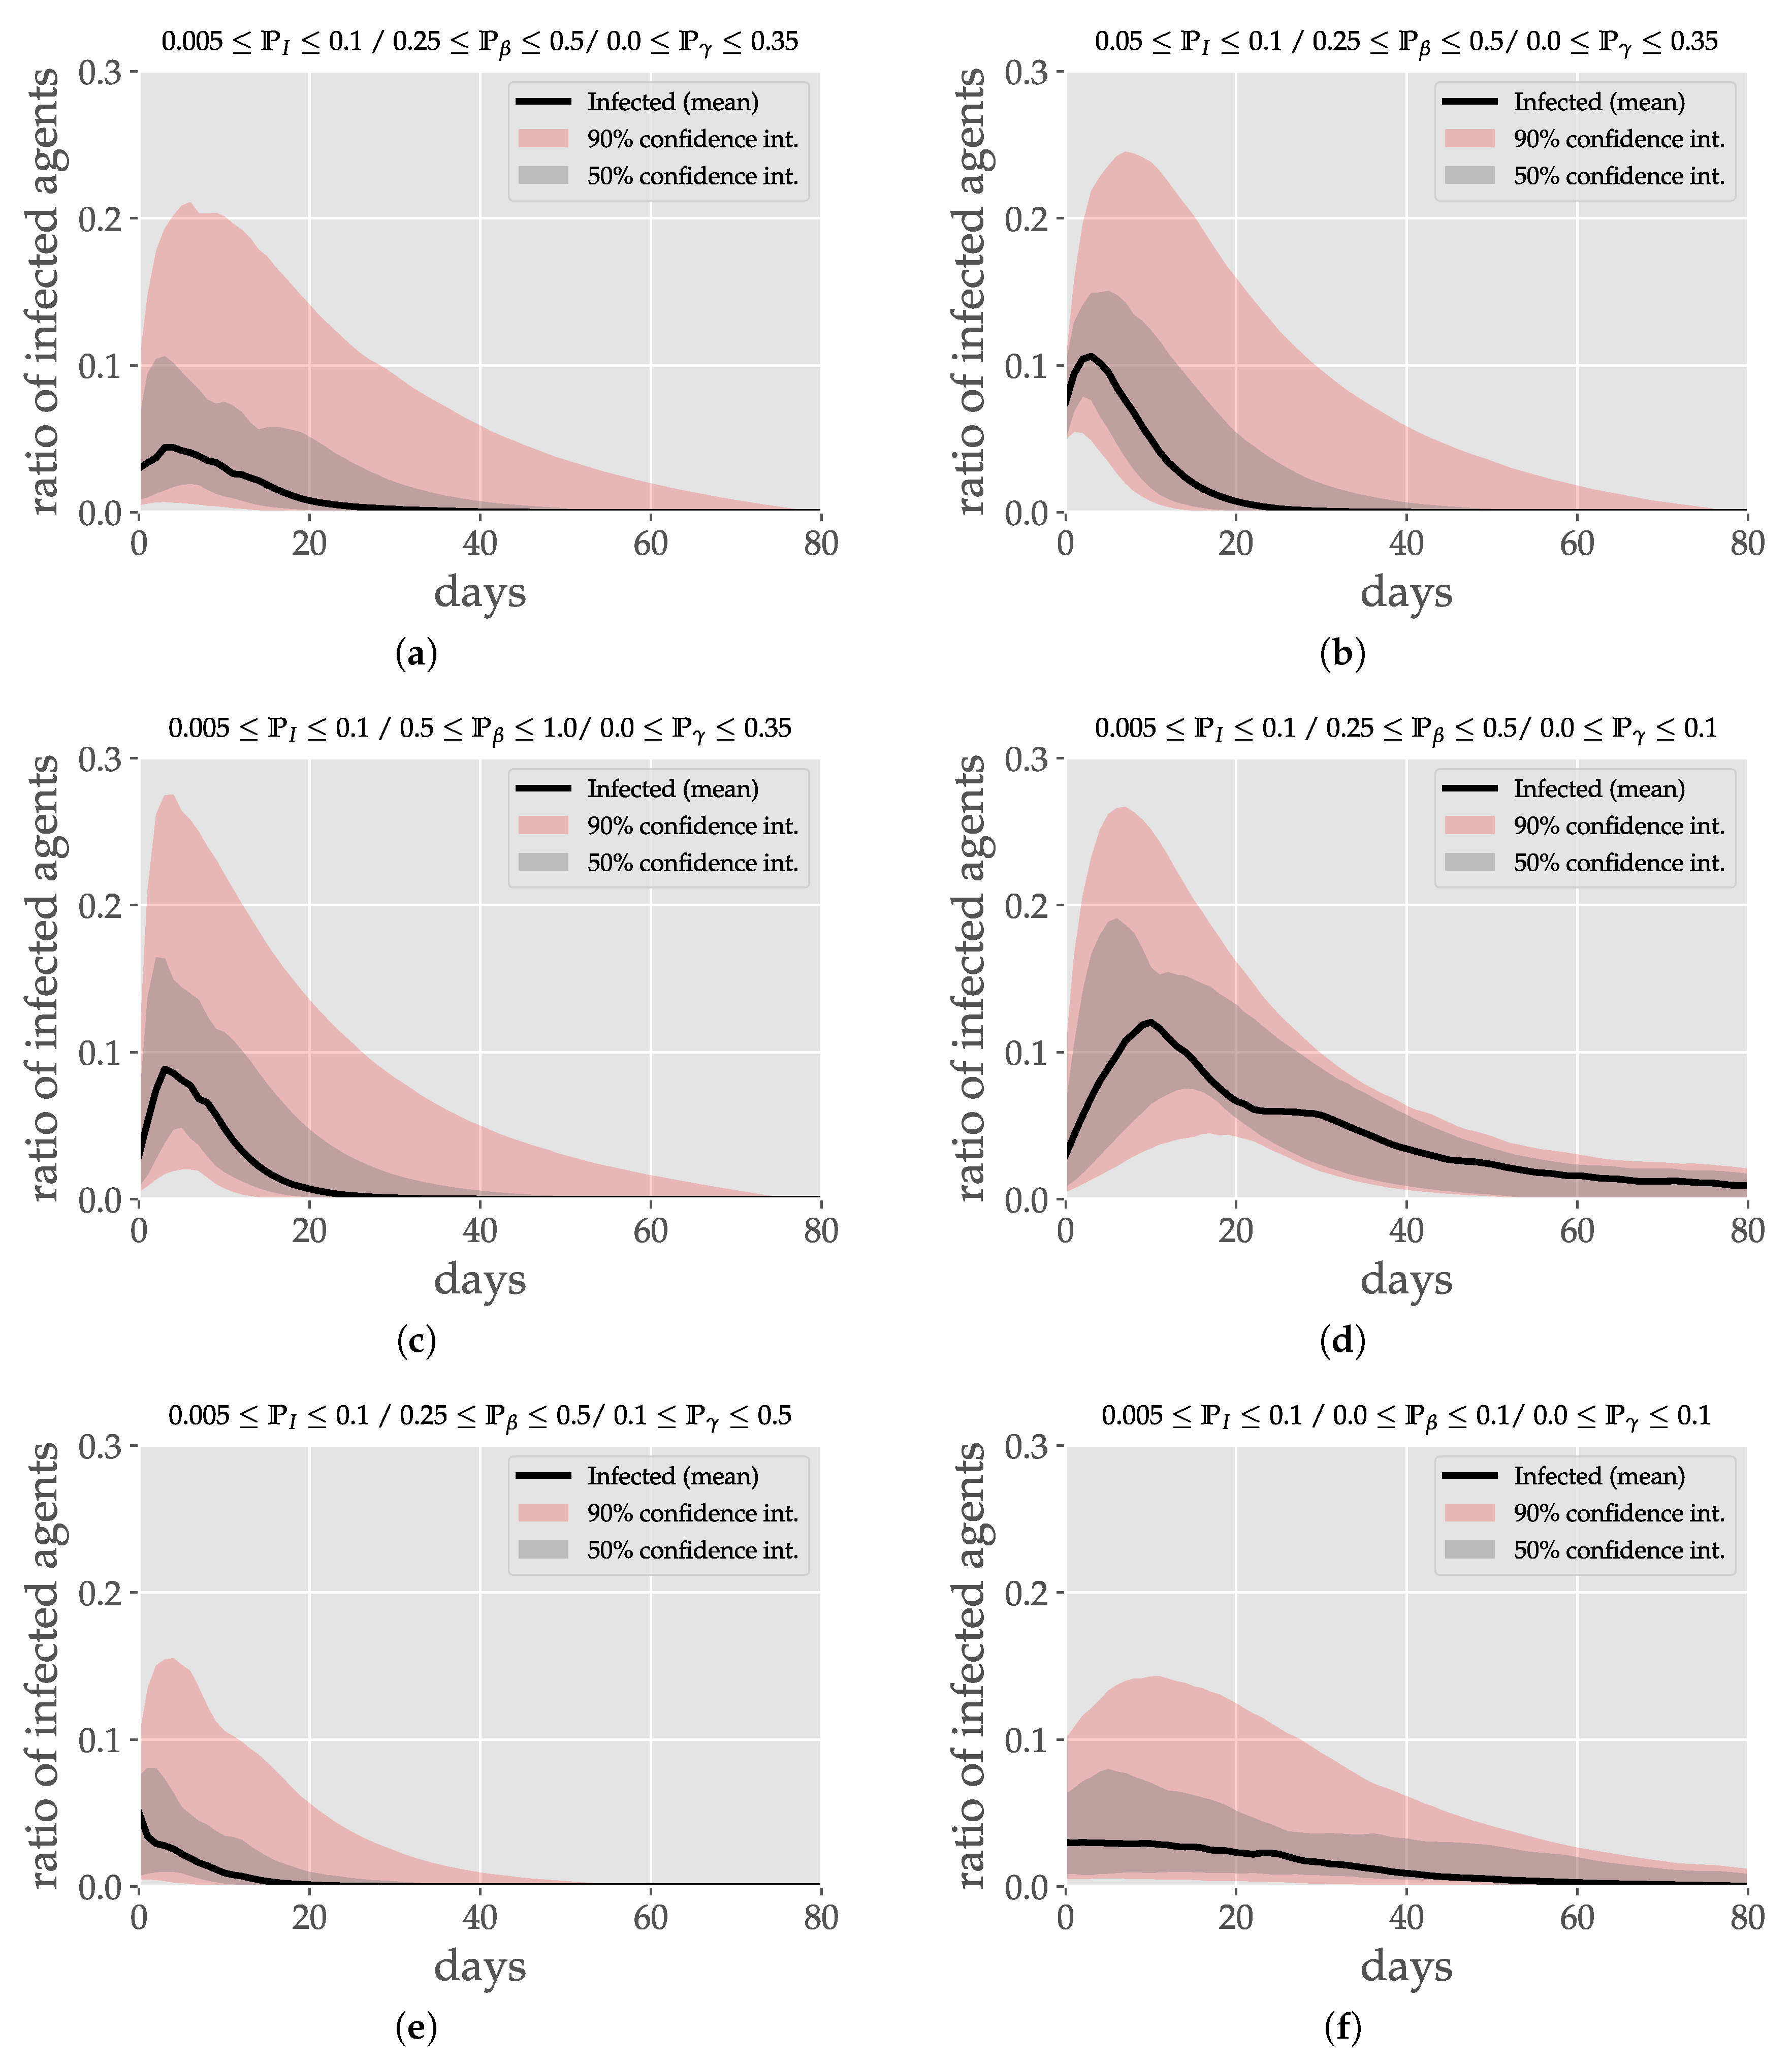
A series of simulation is performed with varying input parameters , and . The percentage of initially infected agents is considered to lie between and , while and vary between 0 and 1 with an increment of . For each triple six simulations are performed, resulting in a total amount of 21,600 simulations. To analyze these simulation results, the mean value of infected agents and the and confidence intervals are used.
Figure 7a illustrates the reference scenario for the remaining five figures. The initially infected population lies between of the total population, the probability of spreading the disease is in the range of , the probability to recover is in the range of . Similar to the simple SIR model in Section 2.1, the number of infected agents increase first, reach a peak and decline again. In Figure 7b, the range of the initially infected population is increased to , which results in a smooth curve with a clearly defined peak in an early phase of the epidemic. Increasing the infection probability (), lead also to a peak in the early phase as illustrated in Figure 7c, but compared to Figure 7b the maximum number of infected agents appear for the mean value, the and the confidence interval at the same time around day 4. If the probability of getting recovered is decreased to the range of (see Figure 7d), of the population is still not recovered after 80 days. Also, there is a shift in the mean peak to the 10th day in the simulation. In contrast, increasing the recovery probability () as illustrated in Figure 7e, results in a fast decay of the infected agents and the epidemic become extinct already after 15 days. Finally, Figure 7f illustrates the simulations where both the infection and the recovery probability lie in the range of to . In this case, no distinct peak of the influenza epidemic can be identified due to the low probability of infection. In combination with a similar recovery probability, the number of infected people is slowly declining since re-infection is not considered, i.e., agents get sick and recover but never at such a critical rate that an epidemic outbreak is observed.
4.2. Historical Event
To show the applicability of the model, the historical influenza event of the season 2016/2017 is recreated. The 2016/2017 season influenza epidemic in Switzerland lasted from week 50/2016 to week 8/2017. Extrapolated during the wave of influenza (i.e., during the period when the threshold was exceeded), around 2.75% of the Swiss population had visited a doctor for flu-like symptoms. In Switzerland, influenza A viruses of subtype H3N2 circulated almost exclusively throughout the season. It peaked in week 2/2017 with 372 consultations per 100,000 inhabitants. Within the metropolitan area of Zurich, the peak was at 360 consultations per 100,000 inhabitants [35].
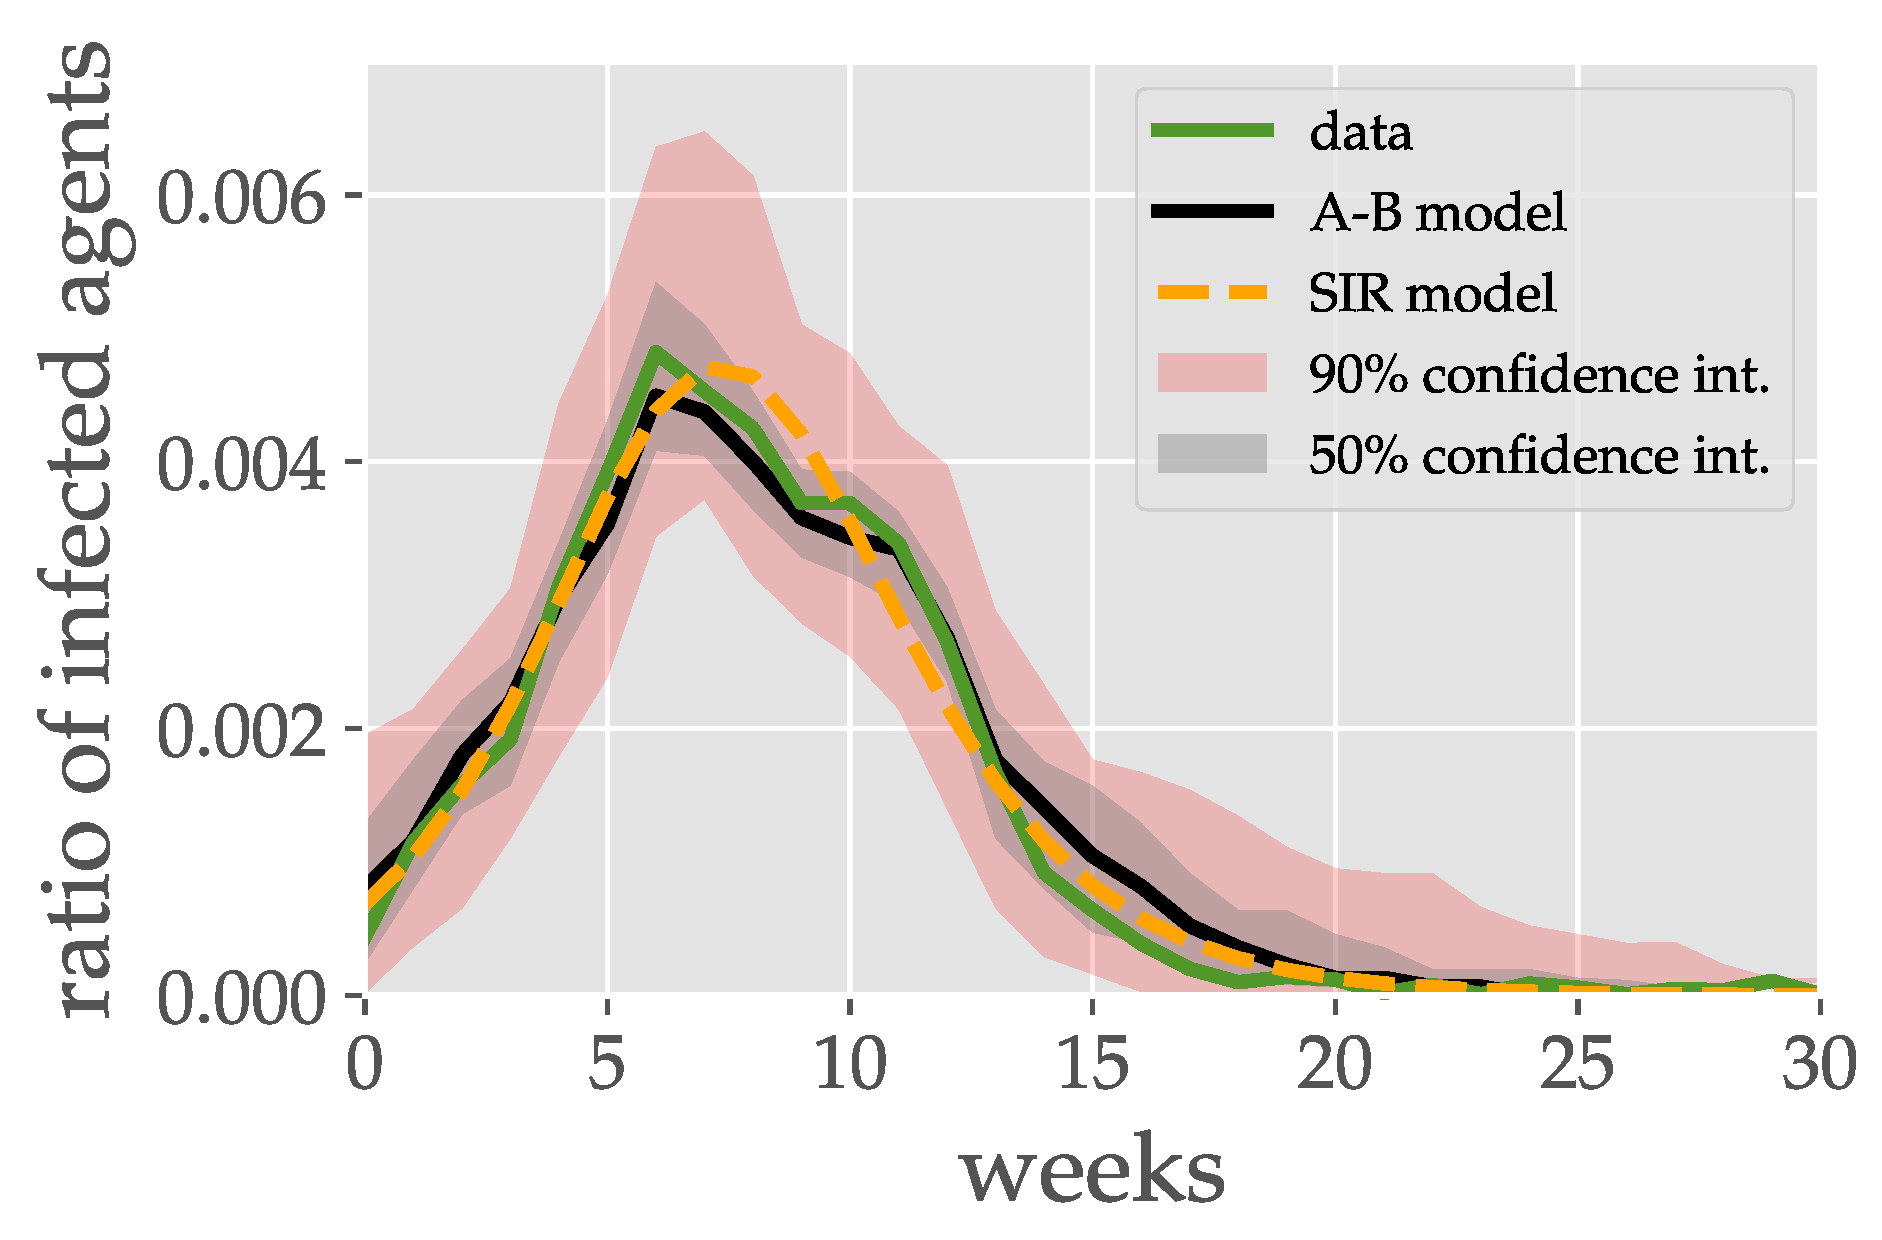
Based on the observed data the model parameters are estimated to (), () and (). Figure 8 shows the agent-based epidemic spread model and the classical compartment SIR model fitted to real data of seasonal influenza in the season 2016/2017 observed in the Zurich area. The fitted agent-based model has an average least square error of while the SIR model has . The SIR model approximates the data with a smooth function, caused by the underlying analytical form (see Section 2.1), while the agent-based model allows reproduction of the non-smooth behavior.
5. Conclusions and Future Work
This study proposes to link epidemiological modeling and transport modeling in a synergistic way to simulates the outbreak of a communicable disease, such as seasonal influenza, in an urban area where different activities take place during a daily citizens’ routine. The results of disease propagation simulation indicate that the model is successfully able to generate various scenarios of an outbreak in complex and realistic urban settings by incorporating movement in the agent entities. The addition of mobility allows realistic emulation of daily behaviors of individuals of a population that interact among themselves and that perform stationary activities in fixed spatially located areas after moving from one place to another. The dynamics of the epidemic spread were implemented for the case of a seasonal influenza virus propagation in the metropolitan area of Zurich and analyzed using the simulation outcomes. It could be shown that even with simple assumptions the agent-based model could give a good approximation of the observed event.
Some limitations of this model are with respect to the simplicity of the implemented epidemic spread model, which only account for susceptible, infected, and recovered individuals but do not consider effects such as vaccination, immunity, incubation periods, age, gender, .... Computational limitations are also an issue because not all the population can be considered given the limited computer memory capacity. This consequently affects the number of contacts between individuals within the city that can be simulated; increasing the interaction to such a point that the infection progress can appear faster than it may happen in reality, as individuals interact only through a limited social network. Hence, the model implemented in this study should be extended to incorporate parameters such as population gender, age, and ethnicity to introduce levels of susceptibility in different groups of individuals. Likewise, decisions taken by infected individuals such as stay at home to avoid the contact and spread of the disease can be included. A further improvement would be to consider the agent interactions during the daily commute using public transport since studies show that the risk of infection is almost six-fold increased [36].
Author Contributions
Conceptualization, J.H. and T.D.; Data curation, J.H. and T.D.; Formal analysis, J.H.; Investigation, J.H.; Methodology, J.H.; Resources, J.H. and T.D.; Software, J.H. and T.D.; Supervision, T.D.; Validation, J.H. and T.D.; Visualization, J.H.; Writing—original draft, J.H.; Writing—review & editing, J.H.
Funding
This research received no external funding.
Acknowledgments
We thank Patrik M. Bösch, Kirill Müller and Franscesco Ciari for preparing and providing the IVT 2015 baseline scenario. We also would like to thank the editor and the anonymous reviewers for their constructive comments and valuable suggestions to improve the quality of the article.
Conflicts of Interest
The authors declare no conflict of interest.
Abbreviations
The following abbreviations are used in this manuscript:
| S | Susceptible |
| I | Infected |
| R | Recoveredthree |
| MATSim | Multi-Agent Transport Simulation |
References
- Hackl, J.; Dubernet, T. Modelling epidemic spreading in urban areas with large-scale agent-based transport simulations. In Complex Networks and Their Applications—Volume 2, Proceedings the 7th International Conference on Complex Networks and Their Applications, Cambridge, UK, 11–13 December 2018; Cherifi, H., Aiello, L.M., Cherifi, C., Lio, P., Lambiotte, R., Rocha, L.M., Eds.; University of Cambridge: Cambridge, UK, 2018; pp. 85–87. [Google Scholar]
- Brockmann, D. Human Mobility and Spatial Disease Dynamics. Rev. Nonlinear Dyn. Complex. 2010, 2, 1–24. [Google Scholar] [CrossRef]
- Kermack, W.O.; McKendrick, A.G. A Contribution to the Mathematical Theory of Epidemics. Proc. R. Soc. A Math. Phys. Eng. Sci. 1927, 115, 700–721. [Google Scholar] [CrossRef] [Green Version]
- Anderson, R.M.; May, R.M. Population biology of infectious diseases: Part I. Nature 1979, 280, 361–367. [Google Scholar] [CrossRef]
- Balcan, D.; Colizza, V.; Gonclaves, B.; Hu, H.; Ramasco, J.J.; Vespignani, A. Multiscale mobility networks and the spatial. Proc. Natl. Acad. Sci. USA 2009, 106, 21484–21489. [Google Scholar] [CrossRef]
- Bajardi, P.; Poletto, C.; Ramasco, J.J.; Tizzoni, M.; Colizza, V.; Vespignani, A. Human mobility networks, travel restrictions, and the global spread of 2009 H1N1 pandemic. PLoS ONE 2011, 6, e16591. [Google Scholar] [CrossRef]
- Connell, R.; Dawson, P.; Skvortsov, A. Comparison of an Agent-Based Model of Disease Propagation with the Generalised SIR Epidemic Model; DSTO-TR-23; Defense Science and Technology Organisation: Canberra, Australia, 2009; pp. 1–22.
- Balcan, D.; Gonçalves, B.; Hu, H.; Ramasco, J.J.; Colizza, V.; Vespignani, A. Modeling the spatial spread of infectious diseases: The global epidemic and mobility computational model. J. Comput. Sci. 2010, 1, 132–145. [Google Scholar] [CrossRef] [PubMed]
- Frias-Martinez, E.; Williamson, G.; Frias-Martinez, V. An Agent-Based Model of Epidemic Spread using Human Mobility and Social Network Information. In Proceedings of the 3rd International Conference on Social Computing (SocialCom’11), Boston, MA, USA, 9–11 October 2011; pp. 49–56. [Google Scholar] [CrossRef]
- Smieszek, T.; Balmer, M.; Hattendorf, J.; Axhausen, K.W.; Zinsstag, J.; Scholz, R.W. Reconstructing the 2003/2004 H3N2 influenza epidemic in Switzerland with a spatially explicit, individual-based model. BMC Infect. Dis. 2011, 11, 115. [Google Scholar] [CrossRef] [PubMed]
- García-Magariño, I. Practical multi-agent system application for simulation of tourists in Madrid routes with INGENIAS. In Advances in Practical Applications of Heterogeneous Multi-Agent Systems. The PAAMS Collection, Proceedings of the 12th International Conference, PAAMS 2014, Salamanca, Spain, 4–6 June 2014; Lecture Notes in Computer Science (including subseries Lecture Notes in Artificial Intelligence and Lecture Notes in Bioinformatics); 8473 LNAI; Springer: Berlin, Germany, 2014; pp. 122–133. [Google Scholar] [CrossRef]
- García-Magariño, I. ABSTUR: An Agent-based Simulator for Tourist Urban Routes. Expert Syst. Appl. 2015, 42, 5287–5302. [Google Scholar] [CrossRef]
- Nicholls, S.; Amelung, B.; Student, J. Agent-Based Modeling. J. Travel Res. 2017, 56, 3–15. [Google Scholar] [CrossRef]
- García-Magariño, I.; Gutiérrez, C.; Fuentes-Fernández, R. The INGENIAS Development Kit: A Practical Application for Crisis-Management. In Bio-Inspired Systems: Computational and Ambient Intelligence IWANN 2009; Lecture Notes in Computer Science; Cabestany, J., Sandoval, F., Prieto, A., Corchado, J.M., Eds.; Springer: Berlin/Heidelberg, Germany, 2009; Volume 5517, pp. 537–544. [Google Scholar] [CrossRef]
- Kim, J.; Lee, S.; Lee, S. An evacuation route choice model based on multi-agent simulation in order to prepare Tsunami disasters. Transp. B Transp. Dyn. 2017, 5, 385–401. [Google Scholar] [CrossRef]
- Zhu, Y.; Xie, K.; Ozbay, K.; Yang, H. Hurricane Evacuation Modeling Using Behavior Models and Scenario-Driven Agent-based Simulations. Procedia Comput. Sci. 2018, 130, 836–843. [Google Scholar] [CrossRef]
- Horni, A.; Nagel, K.; Axhausen, K. (Eds.) The Multi-Agent Transport Simulation MATSim; Ubiquity Press: London, UK, 2016; p. 618. [Google Scholar] [CrossRef]
- Perez, L.; Dragicevic, S. An agent-based approach for modeling dynamics of contagious disease spread. Int. J. Health Geogr. 2009, 8, 1–17. [Google Scholar] [CrossRef]
- D’Onofrio, A. On pulse vaccination strategy in the SIR epidemic model with vertical transmission. Appl. Math. Lett. 2005, 18, 729–732. [Google Scholar] [CrossRef] [Green Version]
- Makinde, O. Adomian decomposition approach to a SIR epidemic model with constant vaccination strategy. Appl. Math. Comput. 2007, 184, 842–848. [Google Scholar] [CrossRef]
- Shang, Y. A lie algebra approach to susceptible-infected-susceptible epidemics. Electron. J. Differ. Equ. 2012, 2012, 1–7. [Google Scholar]
- Shang, Y. Analytical Solution for an In-host Viral Infection Model with Time-inhomogeneous Rates. Acta Phys. Pol. B 2015, 46, 1567. [Google Scholar] [CrossRef]
- Shang, Y. Modeling epidemic spread with awareness and heterogeneous transmission rates in networks. J. Biol. Phys. 2013, 39, 489–500. [Google Scholar] [CrossRef] [PubMed] [Green Version]
- Shang, Y. Degree distribution dynamics for disease spreading with individual awareness. J. Syst. Sci. Complex. 2015, 28, 96–104. [Google Scholar] [CrossRef]
- Colizza, V.; Vespignani, A. Epidemic modeling in metapopulation systems with heterogeneous coupling pattern: Theory and simulations. J. Theor. Biol. 2008, 251, 450–467. [Google Scholar] [CrossRef] [Green Version]
- Helbing, D.; Balietti, S. Agent-Based Modeling. In Social Self-Organization; Helbing, D., Ed.; Understanding Complex Systems, Springer: Berlin/Heidelberg, Germany, 2012; Chapter 2; pp. 25–70. [Google Scholar] [CrossRef]
- Eubank, S.; Guclu, H.; Anil Kumar, V.S.; Marathe, M.V.; Srinivasan, A.; Toroczkai, Z.; Wang, N. Modelling disease outbreaks in realistic urban social networks. Nature 2004, 429, 180–184. [Google Scholar] [CrossRef] [PubMed]
- Luo, Y.; Song, Z.; Sheng, K.; Duan, H.; Qiu, X. The Design of a Small-Scale Epidemic Spreading Simulation System. In Theory, Methodology, Tools and Applications for Modeling and Simulation of Complex Systems, Proceedings of the 16th Asia Simulation Conference and SCS Autumn Simulation Multi-Conference, AsiaSim/SCS AutumnSim 2016, Beijing, China, 8–11 October 2016; Zhang, L., Song, X., Wu, Y., Eds.; Springer: Singapore, 2016; pp. 201–215. [Google Scholar] [CrossRef]
- Müller, K. A Generalized Approach to Population Synthesis. Ph.D. Thesis, ETH Zurich, Zurich, Switzerland, 2017. [Google Scholar] [CrossRef]
- Bösch, P.M.; Müller, K.; Ciari, F. The IVT 2015 Baseline Scenario. In Proceedings of the 16th Swiss Transport Research Conference, Monte Verità, Switzerland, 18–20 May 2016. [Google Scholar] [CrossRef]
- Ruch, C.; Horl, S.; Frazzoli, E. AMoDeus, a Simulation-Based Testbed for Autonomous Mobility-on-Demand Systems. In Proceedings of the 2018 21st International Conference on Intelligent Transportation Systems (ITSC), Maui, HI, USA, 4–7 November 2018; IEEE: Piscataway, NJ, USA, 2018; pp. 3639–3644. [Google Scholar] [CrossRef]
- Rieser, M.; Métrailler, D.; Lieberherr, J. Adding Realism and Efficiency to Public Transportation in MATSim. In Proceedings of the 18th Swiss Transport Research Conference, Ascona, Switzerland, 16–18 May 2018; pp. 1–21. [Google Scholar]
- Wardrop, J.G. Some Theoretical Aspects of Road Traffic Research. Proc. Inst. Civ. Eng. 1952, 1, 325–362. [Google Scholar] [CrossRef]
- Chakirov, A.; Fourie, P.J. Enriched Sioux Falls Scenario with Dynamic and Disaggregate Demand; Technical Report; IVT, ETH Zurich: Zurich, Switherland, 2014. [Google Scholar]
- FOPH. Saisonbericht Grippe 2016 / 2017. BAG-Bulletin 31; Federal Office of Public Health (FOPH): Bern, Switzerland, 2017.
- Troko, J.; Myles, P.; Gibson, J.; Hashim, A.; Enstone, J.; Kingdon, S.; Packham, C.; Amin, S.; Hayward, A.; Van-Tam, J.N. Is public transport a risk factor for acute respiratory infection? BMC Infect. Dis. 2011, 11, 2–7. [Google Scholar] [CrossRef] [PubMed]
Figure 1.
Scheme of the basic SIR model. Boxes represent compartments, and arrows indicate flux between the compartments.
Figure 1.
Scheme of the basic SIR model. Boxes represent compartments, and arrows indicate flux between the compartments.

Figure 2.
Schematic representation of a metapopulation model. The system is composed of a heterogeneous network of subpopulations or patches, connected by migration processes. Each patch contains a population of individuals who are characterized with respect to their stage of the disease (e.g., susceptible, infected, removed), and identified with a different color in the picture. Individuals can move from a subpopulation to another on the network of connections among subpopulations. (Taken from Colizza and Vespignani [25]).

Figure 3.
Scheme of the generic epidemic spread model. Each agent can be assigned to a disease state (S, I, R). If a susceptible agent is in contact with an infected agent, with (transition) probability , the agent becomes infected. At the end of the day each infected agent has a (transition) probability to recover.

Figure 4.
MATSim loop.

Figure 5.
Road network of the metropolitan area of Zurich.

Figure 6.
Temporal-spatial epidemic spread. Red dots indicate infected agents.

Figure 7.
Some of the simulation results from the SIR model with varying input parameters , and . With: (a) reference scenario, (b) increased initially infected population, (c) increased infection probability, (d) decreased recovery probability, (e) increased recovery probability, and (f) decreased infection and recovery probabilities.

Figure 8.
Comparison of SIR and AB model with observed data.

© 2019 by the authors. Licensee MDPI, Basel, Switzerland. This article is an open access article distributed under the terms and conditions of the Creative Commons Attribution (CC BY) license (http://creativecommons.org/licenses/by/4.0/).
Share and Cite
MDPI and ACS Style
Hackl, J.; Dubernet, T. Epidemic Spreading in Urban Areas Using Agent-Based Transportation Models. Future Internet 2019, 11, 92. https://0-doi-org.brum.beds.ac.uk/10.3390/fi11040092
AMA Style
Hackl J, Dubernet T. Epidemic Spreading in Urban Areas Using Agent-Based Transportation Models. Future Internet. 2019; 11(4):92. https://0-doi-org.brum.beds.ac.uk/10.3390/fi11040092
Chicago/Turabian StyleHackl, Jürgen, and Thibaut Dubernet. 2019. "Epidemic Spreading in Urban Areas Using Agent-Based Transportation Models" Future Internet 11, no. 4: 92. https://0-doi-org.brum.beds.ac.uk/10.3390/fi11040092
Note that from the first issue of 2016, this journal uses article numbers instead of page numbers. See further details here.