E-Mail Network Patterns and Body Language Predict Risk-Taking Attitude


1
MIT Center for Collective Intelligence, MIT’s Sloan School of Management, Cambridge, MA 02142, USA
2
School of Electronics and Information Technology, Sun Yat-Sen University, Guangzhou 510275, China
*
Author to whom correspondence should be addressed.
Future Internet 2021, 13(1), 17; https://0-doi-org.brum.beds.ac.uk/10.3390/fi13010017
Submission received: 10 December 2020
/
Revised: 4 January 2021
/
Accepted: 11 January 2021
/
Published: 14 January 2021
(This article belongs to the Special Issue Information Processing and Management for Large and Complex Networks)
Abstract
:As the Enron scandal and Bernie Madoff’s pyramid scheme have shown, individuals’ attitude towards ethical risks can have a huge impact on society at large. In this paper, we compare risk-taking attitudes assessed with the Domain-Specific Risk-Taking (DOSPERT) survey with individual e-mail networking patterns and body language measured with smartwatches. We find that e-mail communication signals such as network structure and dynamics, and content features as well as real-world behavioral signals measured through a smartwatch such as heart rate, acceleration, and mood state demonstrate a strong correlation with the individuals’ risk-preference in the different domains of the DOSPERT survey. For instance, we found that people with higher degree centrality in the e-mail network show higher likelihood to take social risks, while using language expressing a “you live only once” attitude indicates lower willingness to take risks in some domains. Our results show that analyzing the human interaction in organizational networks provides valuable information for decision makers and managers to support an increase in ethical behavior of the organization’s members.
1. Introduction
The willingness of individuals to take ethical risks for personal gain has led to immense pain and loss for individuals and society. Understanding the behavior of Enron’s former CEO, Jeffrey Skilling and former CFO, Andrew Fastow in the Enron scandal, or of Bernie Madoff, the head of the largest pyramid scheme in world history, and their readiness to take large ethical risks illustrates that it is of huge importance for society to investigate what triggers such risky behavior. It would be of great value to get early warning signs based on hidden “honest signals” of people such as Fastow, Skilling, or Madoff, to discourage such behavior in the future or stop it from happening in the first place. Generally, the term “risk-preference” refers to the willingness to engage in rewarding activities which involve uncertain danger or harm [1]. Given that risk-preference is a fundamental construct characterizing human behaviors [2], psychologists have proposed many theoretical and empirical studies of the clues that contribute to individual differences of risk-preference, such as personality traits [3,4,5], gender [6,7,8,9], age [10,11], and national culture [12,13].
Yet, despite a large literature gauging interindividual differences of risk-preference in psychology, relatively little is known about the hidden cues and predictors for risk-preference in terms of human daily behavior. Humans’ survival, as an intensely social species, depends on effective social functioning [14], which is fully reflected in their interpersonal interaction, spoken language, as well as body language. In recent years, digital social media have become an indispensable part of modern society [15,16]. By applying the lens of Social Network Analysis (SNA) and text mining [17,18,19], seemingly unnoticeable patterns—“honest signals” embedded in the digital social media affords the researchers a deep view into the moods, personality, and social influence of people [20]. For instance, “honest signals” extracted from e-mail communication have successfully predicted personality characteristics, moral values, and “tribal affiliations” [18,21,22]. On the other hand, the rapid growth of sensor technology allows researchers to capture physical body signals through a variety of wearable sensors in many areas [23,24,25,26,27,28,29,30]. Recently, a body sensing system called “Happimeter” was proposed to extract “honest signals” in terms of body movement, physiology, and environmental information, which have been shown to be useful for predicting happiness, moral values, and creativity [25,31]. Leveraging well-established social networking and sensor technologies, and given their predictive power shown in many previous studies mentioned above, it would clearly be useful if we could utilize e-mail communication and body signals measured through sensors to predict the risk-taking attitude of an individual.
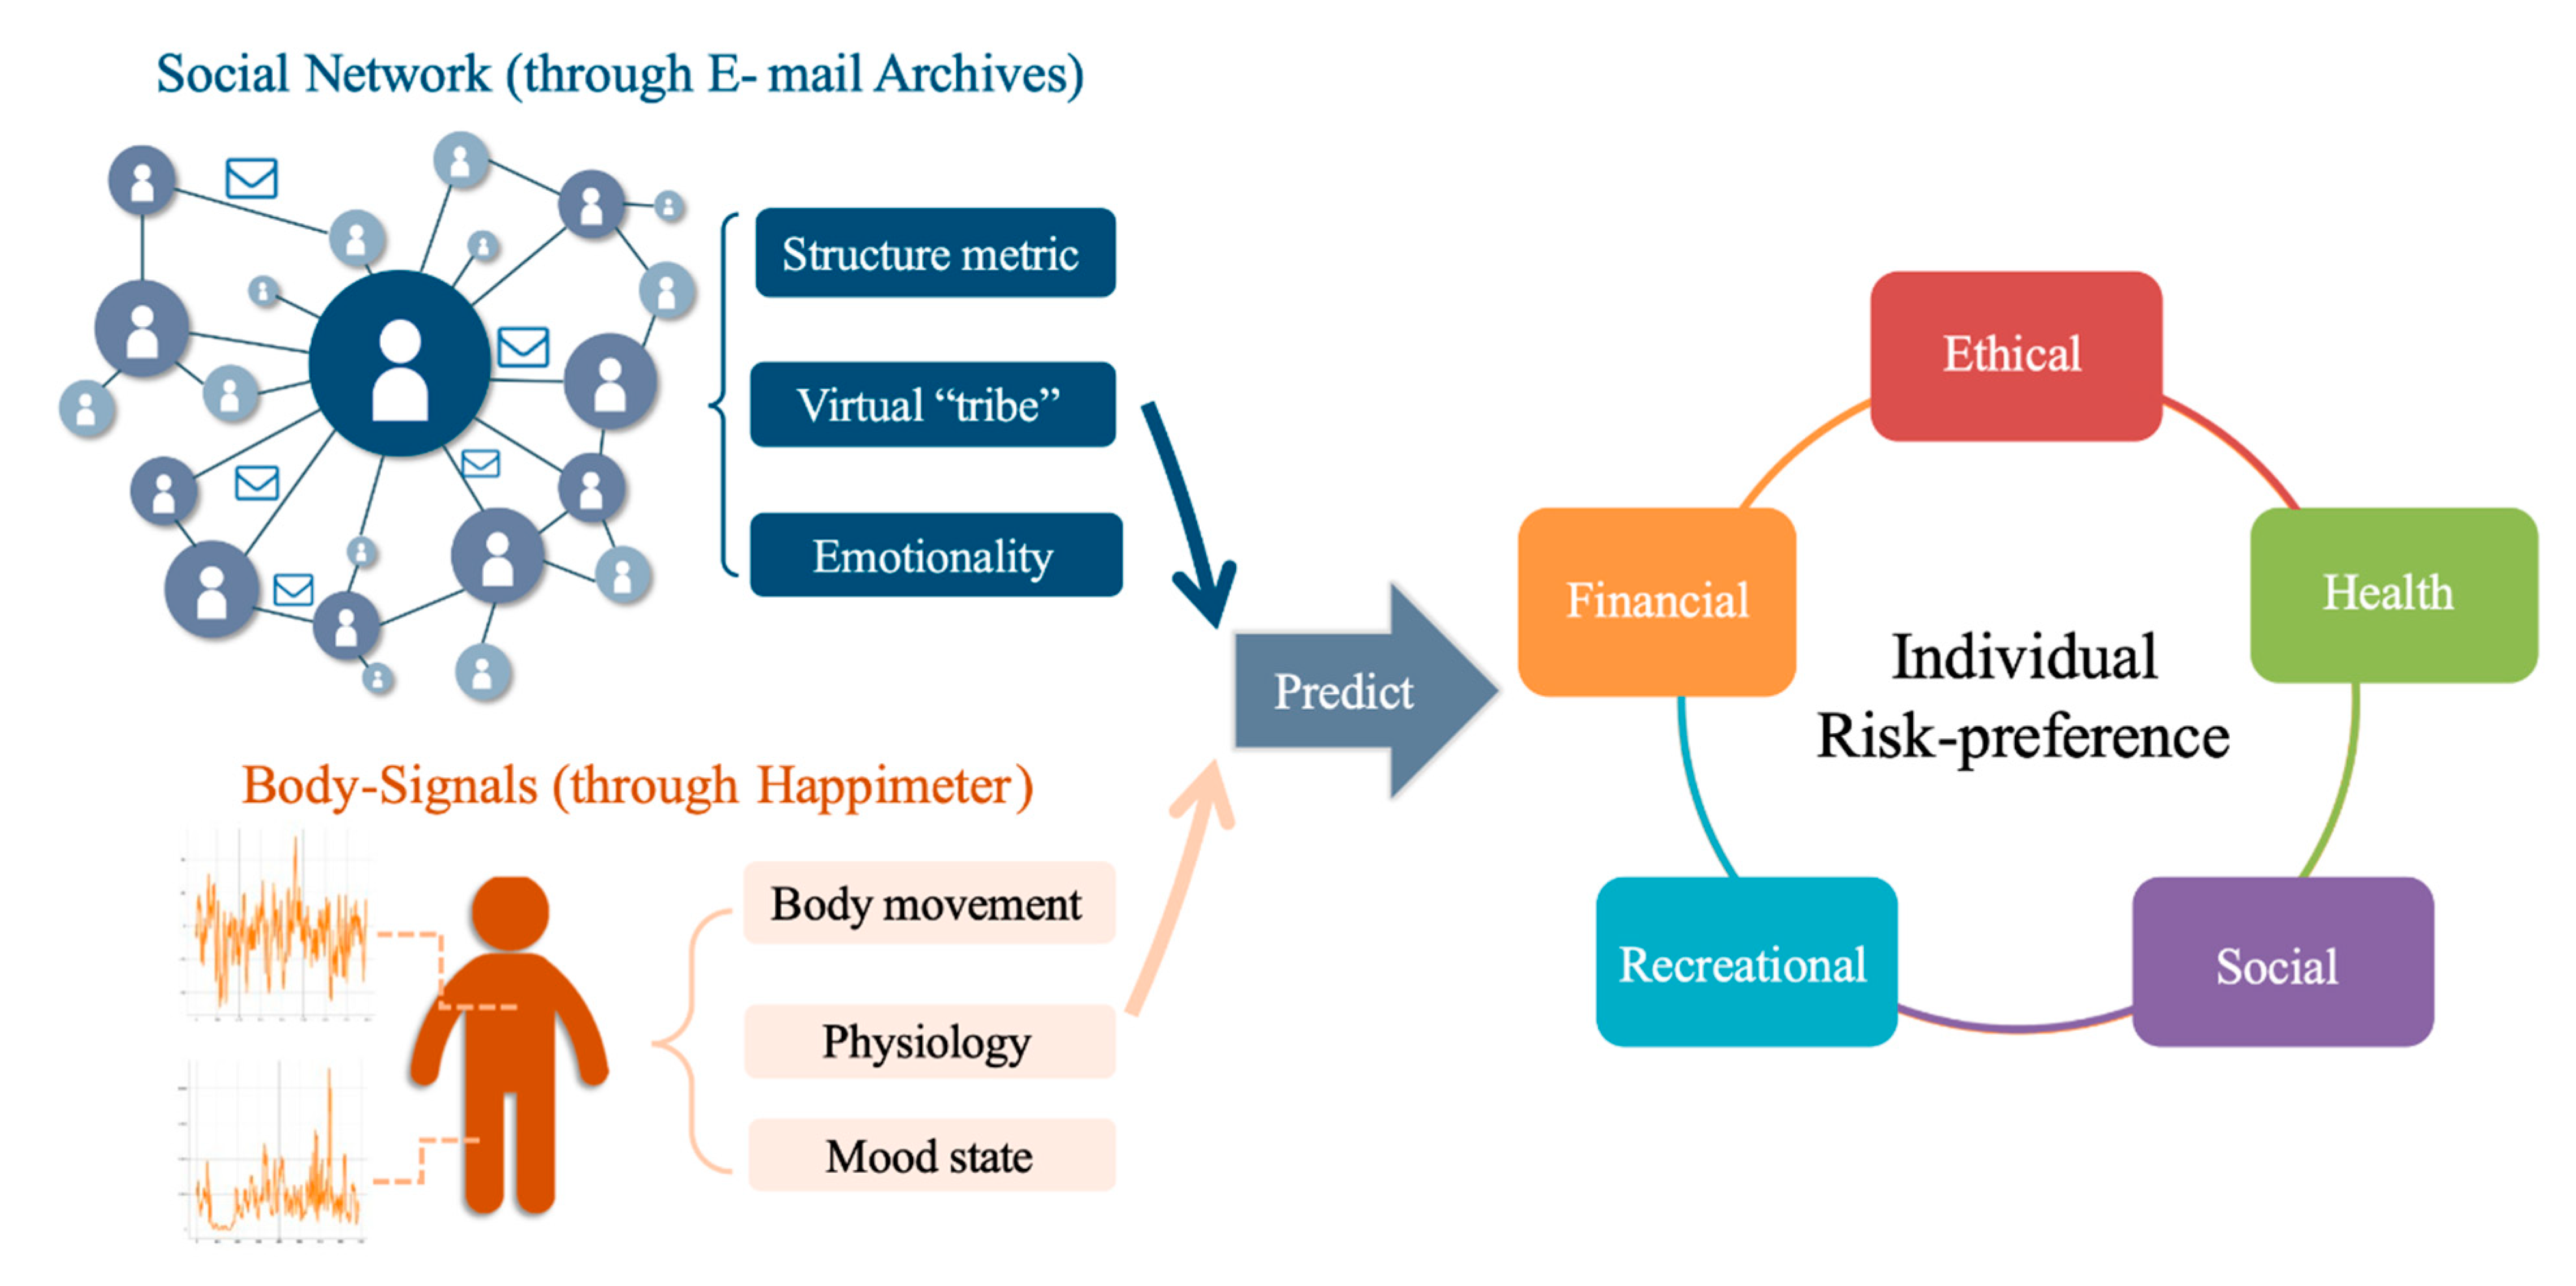
In this work, we systematically evaluate individuals’ risk-preference by combining SNA, text mining, body signals, and mood data, pursuing two different approaches documented in two empirical studies. In Study A, we investigate an e-mail communication network through the mailbox of an active participant, analyzing network structure, digital “tribes” features, and emotionality from word usage. In Study B, using the Happimeter system based on smartwatches [25], we collect individuals’ daily records including body movement, physiology, as well as self-reported mood states. Based on these empirical data, we find strong correlations between social networking and behavioral variables and risk-preference, which is measured by the Domain-Specific Risk-Taking (DOSPERT) survey [32,33] in five specific domains. Our regression results imply that properties obtained both from social networking and body signals can be good candidates to predict individual risk-preference. The overall theoretical framework for this study is shown in Figure 1.
The main contributions of this paper include:
- (1)
- Combining network theory, text mining, and body-sensing technology, we introduce a novel interdisciplinary research method for analyzing one’s attitude of risk-taking.
- (2)
- We validate the utility of the proposed method through two different empirical studies, using e-mail archives and the Happimeter sensing system, respectively. A strong correlation is found between the empirical signals and individual risk-preference in the different domains of the DOSPERT survey.
- (3)
- Through empirical evidence, we quantify significant predictors for one’s attitude of risk-taking based on tribal language features, emotionality, network structure metrics, and body sensors, which provide valuable information for decision makers and managers to support an increase in ethical behavior of the organization’s members
The rest of this paper is organized as follows. In Section 2, we introduce the measurement of risk-preference and the two empirical experiments. In Section 3, we present the numerical regression results. Discussions are presented in Section 4. Finally, Section 5 lists limitations and summarizes the paper.
2. Data and Methods
2.1. The Measurement of Risk-Preference
We access individual risk-preference through a 30-item version of DOSPERT [33], one of the most widely used questionnaires. In particular, DOSPERT measures two different risk-related metrics in five specific domains of life (ethical, financial, recreational, health, and social). One is the willingness for “risk-taking”, measuring that respondents might engage in risky behaviors using a 7-point rating scale where higher scores mean higher likelihood of risk-taking. The other is called “risk-perception”, corresponding to the gut level assessment of the riskiness of these behaviors, similarly measured from 1 (“not at all risky”) to 7 (“extremely risky”). Clearly, the sum of “risk-taking” and “risk-perception” is an intuitive indicator of risk-willingness, i.e., one’s intrinsic risk-preference being influenced by perception. For example, brave and witty people are generally aware of a risk (high risk-perception) and still take it (high risk-taking), leading to high risk-willingness. On the contrary, low risk-willingness corresponds either to someone of impulse and ignorance who takes a risk without being aware of it, or someone who acts with caution, i.e., fully aware of a risk and not taking it. Therefore, in this study we extend the original DOSPERT risk-taking survey and define the individual degree of “risk-willingness” as the sum of the score of “risk-taking” and that of “risk-perception”.
In the following analysis, we investigate the original DOSPERT risk-taking, as well as the risk-willingness in five domains separately. Additionally, since DOSPERT also permits the researcher to capture the general dimension of risk-preference [34], we include it in the analysis by adding the construct of general risk-willingness and risk-taking as the average value in the five domains.
2.2. Study A: E-Mail Analysis
2.2.1. Data
E-mail data are collected from the personal mailbox of an active participant, as a proxy for the organizational memory of his community, which mainly consists of academic/business collaborators in dozens of teams with a variety of topics. The study period is from 2 January 2019 to 2 February 2020. After removing some invalid and junk e-mail addresses, there are 912 e-mail accounts including the mailbox owner and 8074 exchanges of at least one e-mail between two users, which are used to reconstruct the e-mail social network. Further, we identified 72 active users who have sent at least 50 e-mail messages during the study period and invited them to complete the online DOSPERT survey on https://www.happimeter.org/, 34 of whom returned the survey (16 men and 18 women). We measured the e-mail behavior of these 34 users by analyzing their network structure and content.
2.2.2. Structure Variables
We employed the dynamic social network analysis tool Condor [18] to calculate the following three kinds of structure variables: Position, contribution, and dynamic signals.
- Position signals
A static e-mail social network is reconstructed using the filtered 912 nodes (users) and 8074 unique links (the exchange of at least one e-mail between two nodes). The position of a given node in the network can be characterized by its nodal centrality, which has been found to be useful in predicting productivity [35], job turnover [36], and individual performance [37]. In particular, we consider three well-known nodal centralities: (1) Degree centrality, i.e., the number of links connected to it, (2) betweenness centrality [38], measuring the probability with which a node is on the shortest path between other nodes, and (3) closeness centrality [39], measuring the mean distance from a node to other nodes. Apart from the nodal centrality, we also calculate reach-2 as a proxy for individual social capital [40], which is the number of other nodes a given node can reach with two steps.
- Contribution signals
The amount of information contributed by an individual in the e-mail network is calculated as the number of e-mails sent and received by the individual. Hence, we use the contribution index metric [18] defined as the balance of messages sent and received by a user during the study period. It is calculated by subtracting messages received from the messages sent and then dividing the result by the messages sent added to the messages received [18].
- Dynamic signals
E-mail communication is generally a dynamic process, implying that an individual’s position in the network may change continuously over time. To allow for this, we reconstruct day-by-day networks by merely including the communications (links) happening on that particular day, leading to e-mail social networks per day. Based on these networks, we calculate individual betweenness oscillation [18] by quantifying the number of local maxima and minima in the betweenness centrality curve. We also calculate the contribution index oscillation in a similar way. These metrics’ utility have been validated repeatedly [41,42]. In addition, we investigate individual responsiveness in e-mail communication, i.e., how fast a responder replies to a sender, which plays an important role in dynamic communications analysis [43,44]. Specifically, for each user we consider two different variables, the Average Response Time (ART) defined as the average time needed for the given user to respond to an e-mail, and the nudges defined as the average number of pings (e-mails sent) needed to get a response [18].
2.2.3. Content Variables
Similar to the structure variables, we employ Condor to calculate content variables based on the participants’ e-mail messages, which contain virtual “tribe” signals and emotion signals.
- Virtual tribe signals
Tribes are groups of people homogenous within themselves and heterogeneous to other groups. Given that a tribe is generally helpful for reflecting one’s identity, place in society, and ethnic partiality [45,46,47], and has demonstrated usefulness in different scenarios such as marketing [47] and human resource management [22], it is important to investigate correlations between the users’ risk-preference and their underlying virtual tribe. To identify the tribes of users in the e-mail network, we employ TribeFinder [47], which is a novel AI-based tool trained on Twitter. Specifically, TribeFinder finds the different types of tribes and their leaders on Wikipedia, then looks at the language of the leaders on Twitter. People are then assigned to tribes if their word usage is similar to the aggregate of all “leaders” of a tribe. We identify tribes for e-mail users according to words usage in their e-mails, using five pre-existing macro-categories [22]: Alternative Realities, Personality, Recreation, Ideology, and Lifestyle [47], each of which consists of four dimensions (see detailed explanations for each dimension within each macro-category in Table 1). For each user, TribeFinder computes his/her probability of being in a certain dimension.
- Emotion signals
To calculate the e-mail sentiment, we employ Condor’s built-in sentiment analysis function, which is a Bayesian-based classifier trained on billions of tweets achieving over 80% accuracy on English e-mail corpora [47]. The sentiment score of each e-mail ranges from 0 (negative) to 1 (positive). A user’s average sentiment is denoted as the mean value of all sentiment scores from her/his e-mails. In addition, we use TribeFinder to further quantify each user’s explicit mood state. Similarly, we set up an additional mood “tribe”, which depicts the individual’s mood by four dimensions (happy, sad, angry, and fear) through assigning a likelihood of belonging for each dimension.
2.3. Study B: Body Sensing Analysis
2.3.1. Data
To achieve body sensing, we employ an existing app called Happimeter [25] that allows tracking of instant body physical signals and mood states. We conducted an experiment with participants at a 3-day international academic conference from 14 to 17 September, 2017. During this period, the participants wore Android smartwatches provided by our research group with the Happimeter app installed and linked to their smartphones. Similar to Study A, they were asked to complete the online DOSPERT test. A total of 23 user’s risk-preference results were collected, from whom three participants had technical issues connecting the smartwatch to their phones, and five participants have a negligibly small number of recorded sensor data. Hence, these users were excluded from the body sensing analysis. From the remaining 15 users (8 men and 7 women), we obtained a total of 4339 sensor records and 2450 affective records.
2.3.2. Variable
The Happimeter app regularly collects the wearer’s sensor data through all the available sensors of the smartwatch, such as heart rate, accelerometer, GPS coordinates, and light level. To access a user’s body language, we consider two kinds of sensors. One is the accelerometer, the most widely used movement sensors for human physical activity monitoring [24]. Specifically, the built-in three-axis accelerometer on the smartwatch captures the users’ acceleration average magnitude per minute, which are measured simultaneously in three dimensions of physical space (usually labelled as x, y, and z), resulting in three specific values. The other is the heart rate sensor, i.e., the average number of heart beats per minute [24]. This is achieved by detecting the amount of blood flowing through the wearer’s wrist through a green LED light paired with light-sensitive photodiodes on the smartwatch.
In addition, we collect the participant’s momentary self-reports of their mood states through the Happimeter app. In particular, a user’s affective state is recorded by answering the following two questions [48] which appear on the smart watch screen: (1) “How pleasant do you feel?” and (2) “How active do you feel?” The user then chooses his/her pleasance and activation level with a scale from 0–2, where 0 represents the lowest pleasance/activation and 2 represents the highest pleasance/activation [25], resulting in two affective values.
To correlate each user’s DOSPERT survey result with his/her multiple records of sensor values and mood values which are generated across time, we first aggregate the Happimeter values by computing the average level of each value for each hour, given that the participants may not provide their affective information at the same frequency as their sensor data. Then, for each user, we calculate the mean and variance of each aggregated value, resulting in a total of 12 Happimeter variables (see Table 2), which are used for further analysis.
3. Results
3.1. E-Mail Results
First, we present the qualitative findings of Study A (N = 34). We report the statistical description of variables in Supplementary Table S1. By correlating the position, content, and emotion variables computed from the e-mail data with the individual risk-taking and risk-willingness over six domains, we find strong and significant correlations (see the Pearson coefficient in Supplementary Table S2), implying a potentially linear relationship among the variables considered. Then, we employ the Ordinary Least Squares (OLS) regression to predict the 12 subscales of risk-preference (six for risk taking, six for risk willingness) separately, by choosing corresponding significant variables as predictors. Table 3 reports the regression results, along with the Breusch-Pagan/Cook-Weisberg test [49,50] employed to check the variance homoscedasticity of the fitted OLS model.
Importantly, from Table 3 we find several significant e-mail-based predictors for risk-preference scores in certain domains. For example, a faster responsiveness in e-mail message (i.e., smaller ART) and more stable contribution in the e-mail network (i.e., smaller contribution index oscillation) correspond to more risk-taking both in general and in the recreational domain. On the other hand, higher degree centrality in the e-mail network, i.e., communicating with more different people, indicates higher likelihood to take social risks. One of the most interesting findings of the virtual tribes is that a more “you live only once” lifestyle reflected by the e-mail content actually causes less willingness to show risky behavior in the ethical, financial, and health domains. This means that their assessment of risk and their willingness to take that risk are more aligned. In other words, “they are willing to put their money where their mouth is”. As for emotion, we find that participants who are happier (or less sad) in words are more risk-seeking in recreational activities and show a greater willingness to take risks in general.
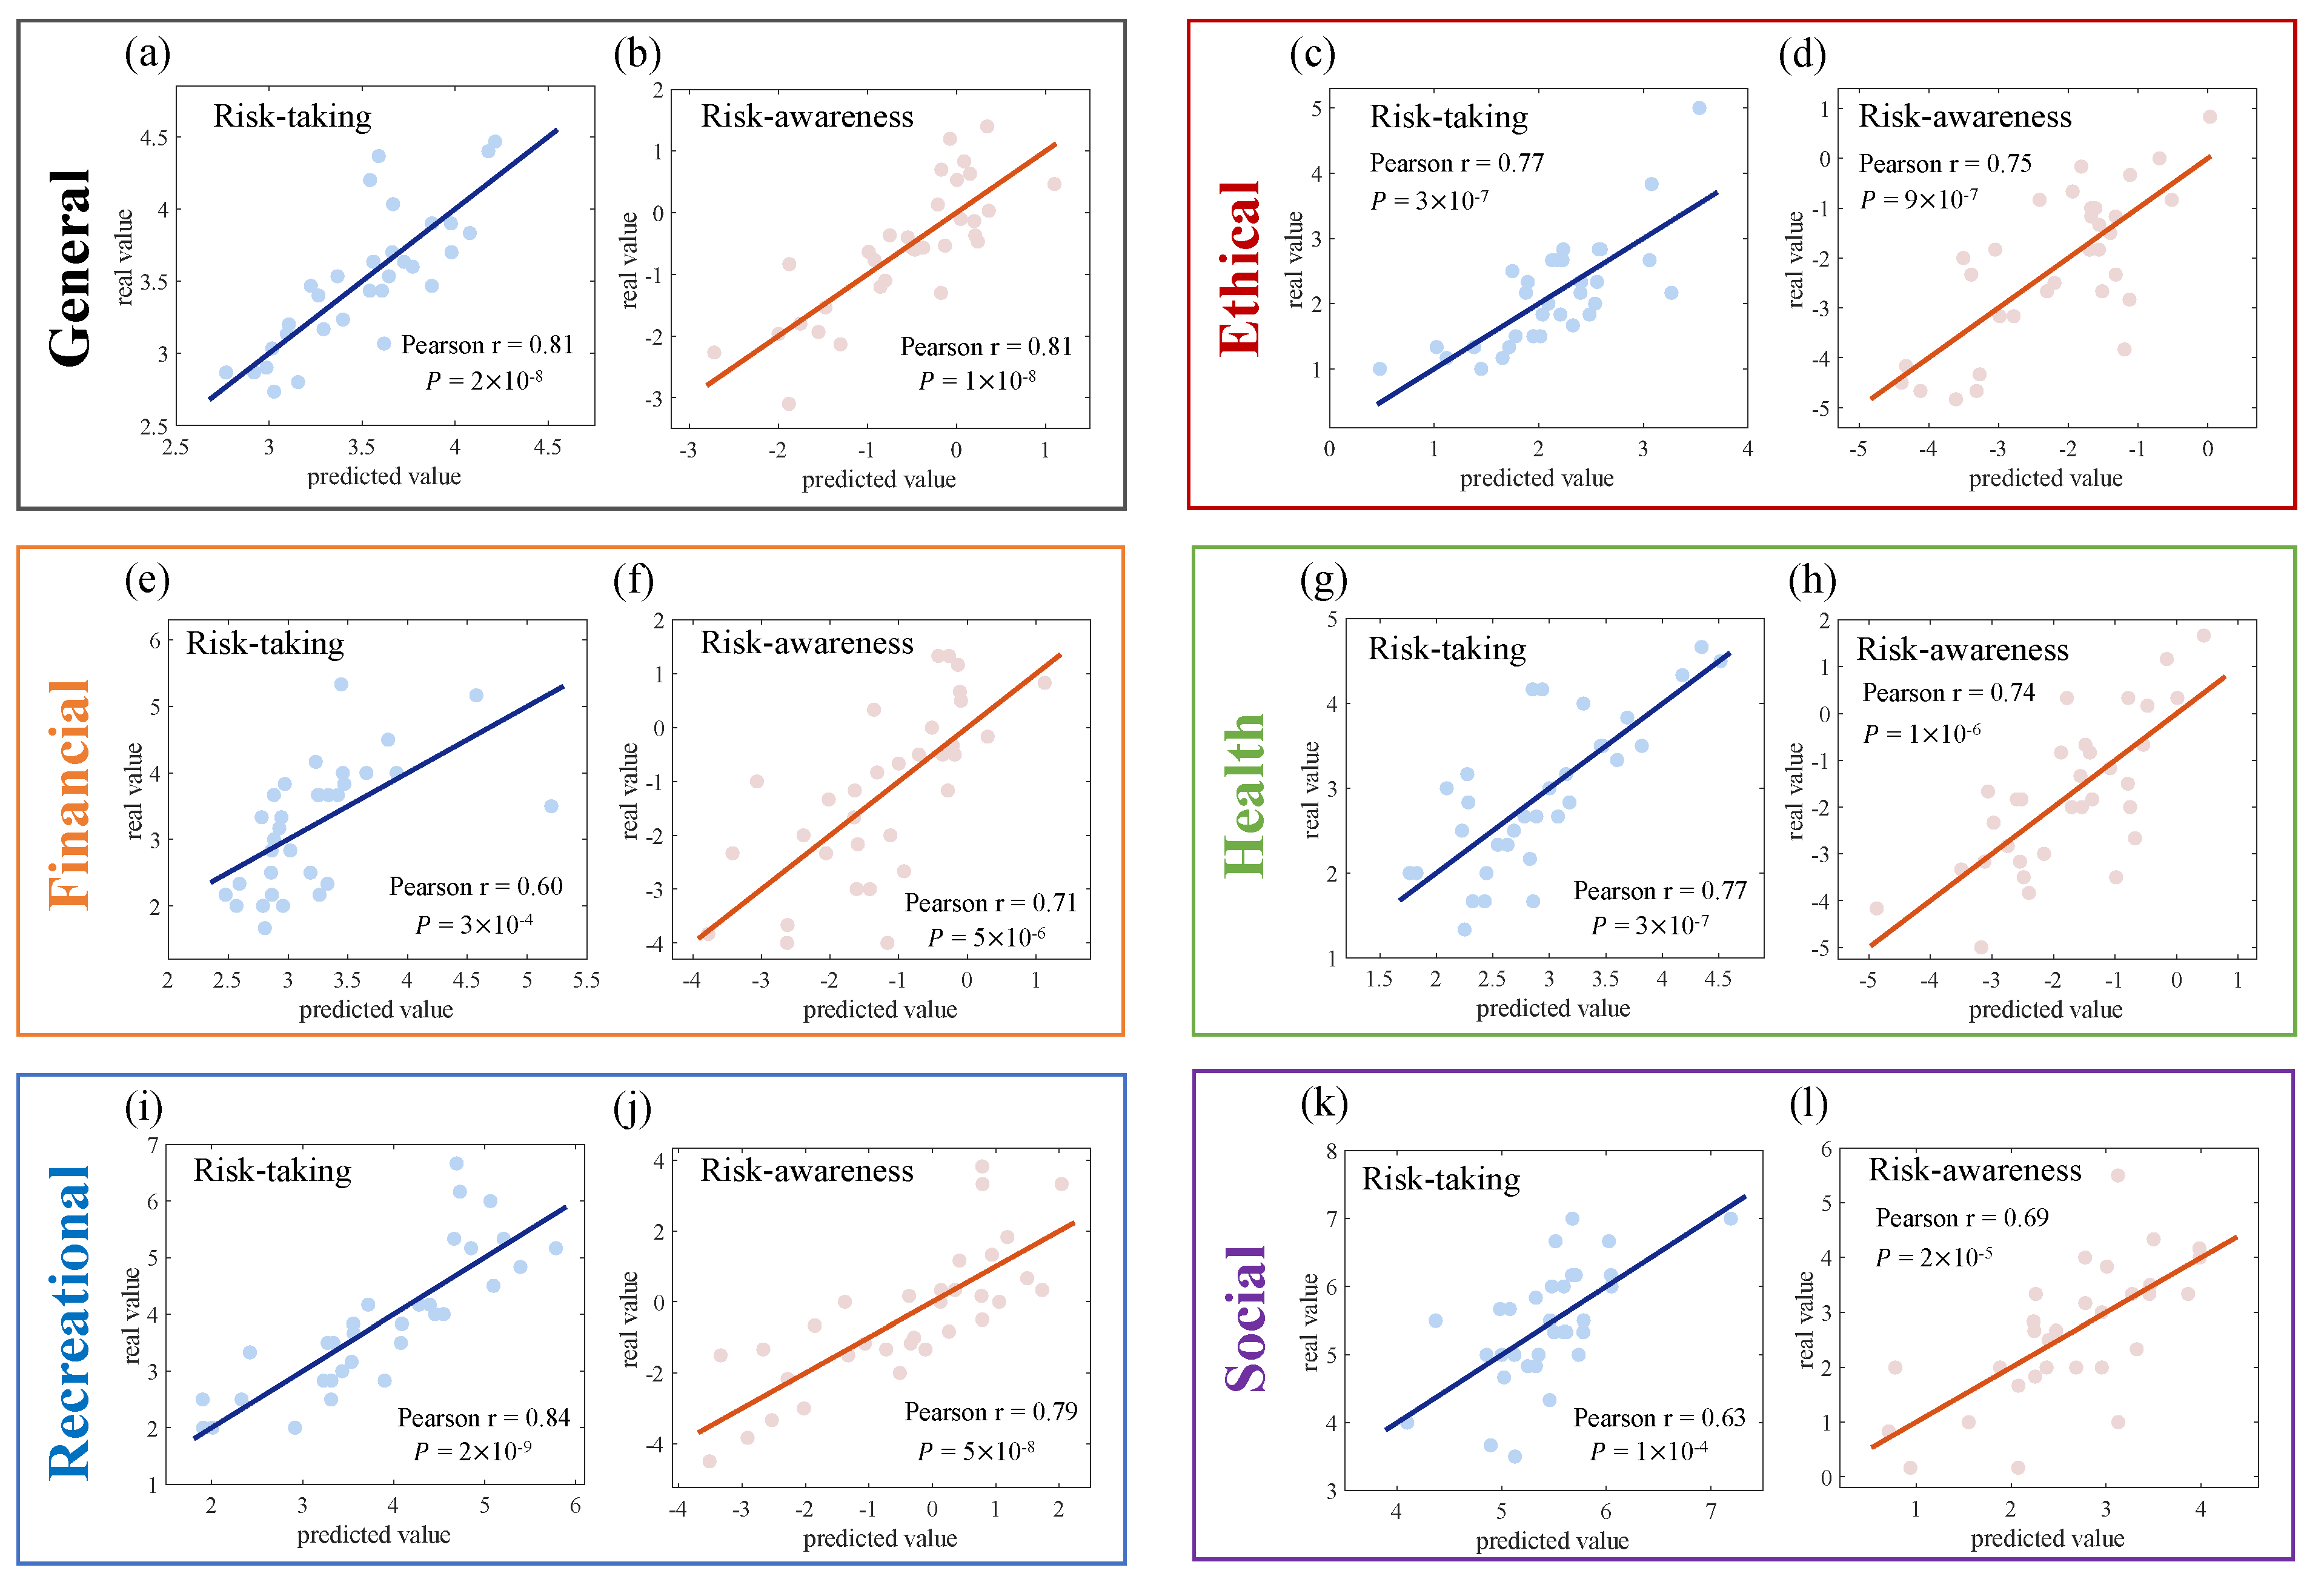
Overall, the high adjusted R2 and low RMSE reported in Table 3 demonstrate that the combinations of these variables indeed forecasts the individuals’ risk-preference effectively. In addition, the Breusch-Pagan/Cook-Weisberg test shows a small chi-2 and corresponding large probability, indicating that the variance is homogenous and thus OLS’s validity is confirmed. Figure 2 shows the specific predicted result of each participant compared with the real value over the six domains.
3.2. Body Sensor Results
In this section, we demonstrate the predictive effect of the body signals on individuals’ attitude towards the risk of Study B. The dependent variables are the mean and variance calculated from 4339 sensor records and 2450 affective records of 15 participants. Again, these variables show a strong correlation with the risk-preference scores in certain domains (see statistical description of the data and the Pearson coefficient between the body signals and the risk-preference in Supplementary Tables S3 and S4, respectively). Similar to Study A, we employ the OLS regression with these significant variables to predict the individuals’ risk-preference. We report the OLS results of Study B in Table 4.
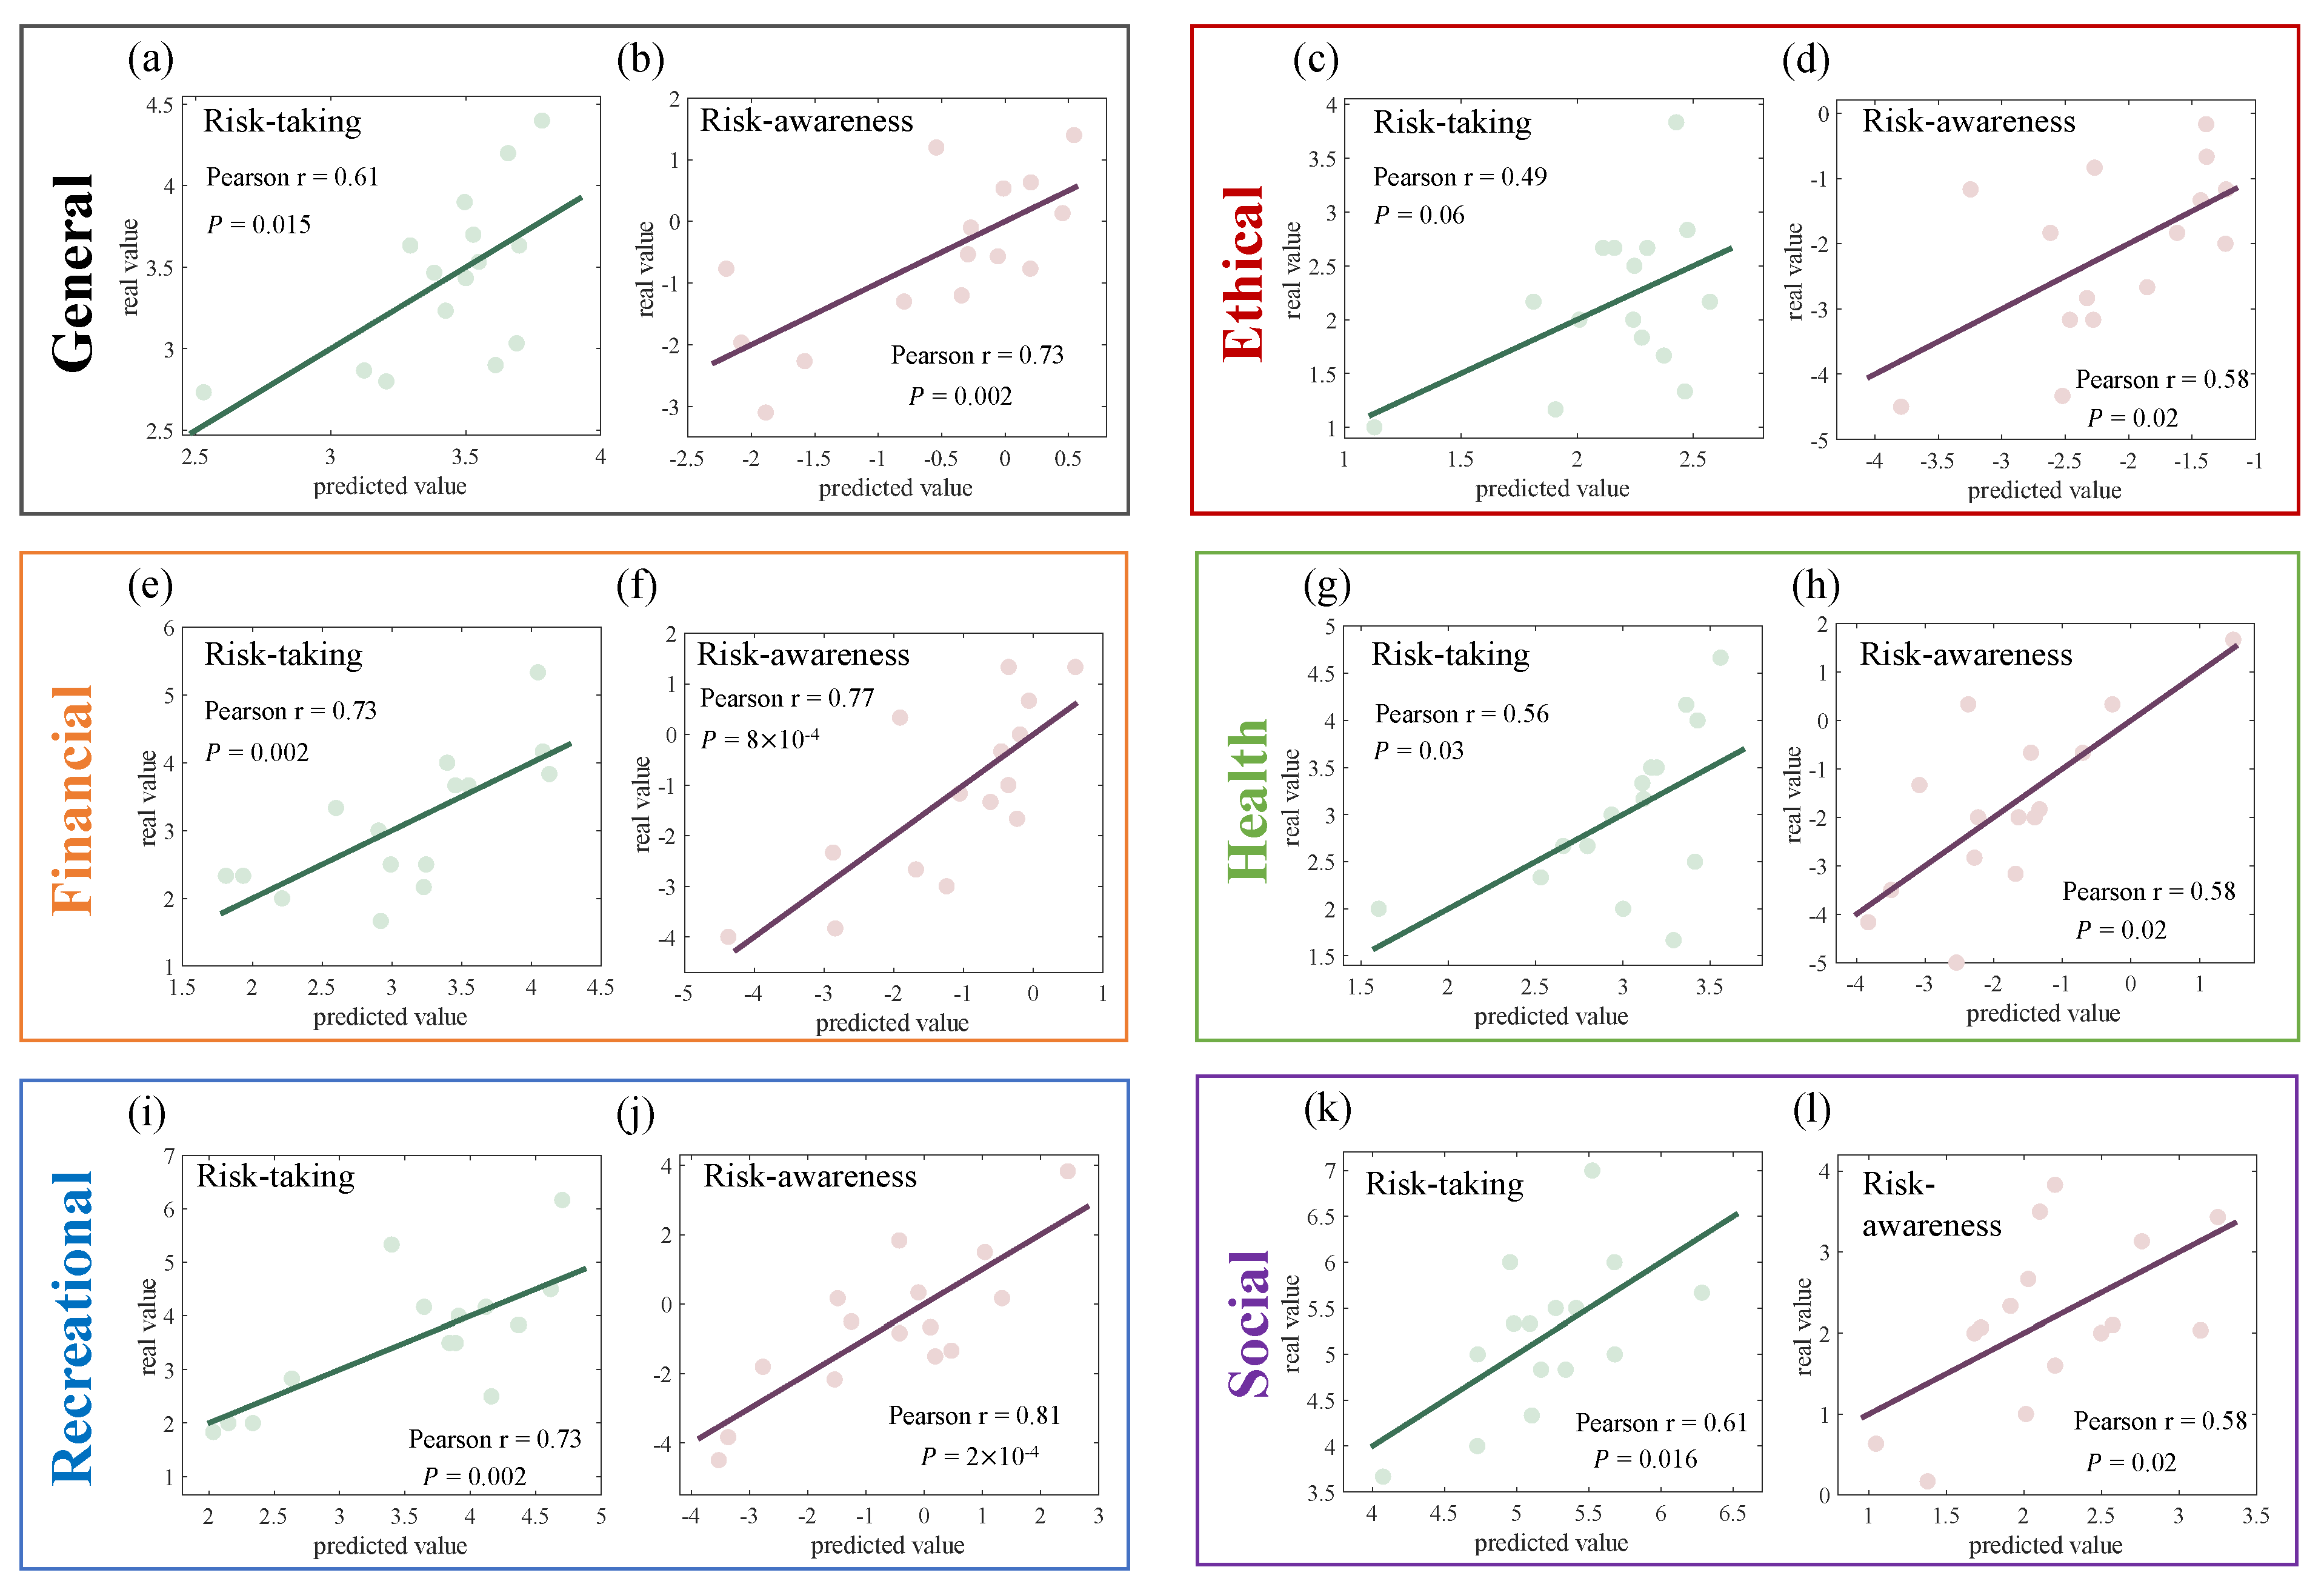
We find that the sensor features can reliably distinguish high risk-preference individuals from low risk-preference ones. Specifically, the variability of the heart rate is found to be a significant indicator to measure one’s risk-preference in the recreational domain. In addition, participants exhibiting a higher average heart rate show stronger willingness to take ethical risks. The acceleration-related variables also show a significant relationship with risk-preference. For instance, the less consistent the body movement of a participant is (i.e., high variance of acceleration’s magnitude), the more likely they will take risks in the ethical and health domains. Regarding the affective states, we find that participants with a more active sense of self are risk-seeking in financial activities. Finally, we compare the predicted values of the above variables with the real ones (see Figure 3). It can be seen that the statistics from sensor and mood data predict well in the general, financial, and recreational domains, while the prediction is comparatively poorer in the three other domains.
4. Discussion and Limitations
By measuring features of individual language, both verbal and as body language, we propose a novel way to measure attitudes towards risk. The same approach can also be used to measure other “soft” personality characteristics such as ethical and moral values [21,22]. We find, for instance, that someone using a language indicating a fitness-aware lifestyle is less willing to take general risks, while someone using a language indicating a preference for “yolo” is less willing to take ethical risks. On the other hand, people who use a “journalist” such as “matter of fact” language are more willing to take ethical risks. Similar insights can also be gleaned from the body language of individuals. For instance, the less consistent they move their bodies, i.e., the higher the variance of their arm movement over time, the higher their willingness to take general risks. On the theoretical side, insights such as these offer valuable suggestions for personality researchers. On the practical side, these results permit HR managers to better understand the culture of their organizations, based on the words that the members of their organization use.
The presented study has some potential areas in need of further investigation. First, individual risk-preference is measured through self-reported questionnaires, which may introduce a subjective bias of observed relations due to the common method variance [51]. A more objective alternative is to expose participants to gaming tasks (e.g., the ultimatum game [52]). Second, a relatively small number of participants inevitably restrict the validity generalization of our results. Therefore, a larger-scale experiment involving more participants from a wider range of backgrounds should be done to provide further evidence of the robustness of our results. In addition, in the social networking part (Study A) of this study we have mainly focused on e-mail networks, but the proposed methodology could be extended to online social networks from practically any discipline, such as Facebook and microblogging platforms.
5. Conclusions
Overall, this study makes contributions both to research with direct implications for current theories of risk-preference in scientific settings and to practice in different applied settings. In particular, we introduced a novel interdisciplinary research method for analyzing one’s attitude of risk-taking. To the best of our knowledge, this is the first empirical analysis to combine network theory, text mining, and body-sensing technology to access the individuals’ attitude towards risk. Most importantly, through the empirical evidence of two presented studies, we have shown that one can efficiently predict both the original DOSPERT risk-taking and the intrinsic risk-willingness in six domains (general, ethical, health, financial, recreation, social) based on tribal language features, emotionality, network structure metrics, and body sensors (see the summarized predictors in Figure 4).
In conclusion, we have introduced a novel system of practical value both for risk researchers and decision makers in organizations. For researchers, we provide a novel way based on “honest signals” [20] to measure “soft” attributes such as attitude towards risk and ethical values, permitting them to study these personal characteristics without the need to ask survey questions. Using “honest signals” to predict risk attitudes will also eliminate the subjectivity bias inherent in surveys. For managers, identifying the risk-preferences of the members of an organization based on their e-mail networking behavior and body language enables them to develop risk-mitigation strategies to create more risk-aware and ethical organizations.
Supplementary Materials
The following are available online at https://0-www-mdpi-com.brum.beds.ac.uk/1999-5903/13/1/17/s1. Table S1: Descriptive analysis of variables of Study A; Table S2: Pearson correlation between risk-preference scores as dependent variables and communication signals as independent variables; Table S3: Descriptive analysis of variables of Study B; Table S4: Pearson correlation between risk-preference scores and body signals in terms of sensor data and mood data.
Author Contributions
P.G. conceived the project; J.S. designed the experiments and analyzed the results; J.S. and P.G. wrote the manuscript. All authors have read and agreed to the published version of the manuscript.
Funding
This research was partially funded by Signify (Philips Research), grant number 024826-00013 and the China Scholarship Council Program, grant number 201906380135.
Institutional Review Board Statement
The study was conducted according to the guidelines of the Declaration of Helsinki, and approved by the Institutional Review Board of MIT (protocol code 170181783) on 16 Feburary 2017.
Informed Consent Statement
Informed consent was obtained from all subjects involved in the study.
Data Availability Statement
The data presented in this study are available on request from the corresponding author. The data are not publicly available due to privacy reasons.
Acknowledgments
All the experiments conducted in this work have been approved by the Institutional Review Board (IRB) of the Massachusetts Institute of Technology (MIT).
Conflicts of Interest
The authors declare no conflict of interest.
References
- Kahneman, D.; Tversky, A. Prospect theory: An analysis of decision under risk. In Handbook of the Fundamentals of Financial Decision Making: Part I; World Scientific: Singapore, 2013; pp. 99–127. [Google Scholar]
- Ariely, D. Predictably Irrational; American Psychological Association: Worcester, MA, USA, 2013. [Google Scholar]
- Zuckerman, M.; Kuhlman, D.M. Personality and Risk-Taking: Common Bisocial Factors. J. Pers. 2000, 68, 999–1029. [Google Scholar] [CrossRef]
- Hoyle, R.H.; Fejfar, M.C.; Miller, J.D. Personality and Sexual Risk Taking: A Quantitative Review. J. Pers. 2000, 68, 1203–1231. [Google Scholar] [CrossRef]
- Foster, J.D.; Shenesey, J.W.; Goff, J.S. Why do narcissists take more risks? Testing the roles of perceived risks and benefits of risky behaviors. Pers. Individ. Differ. 2009, 47, 885–889. [Google Scholar] [CrossRef]
- Byrnes, J.P.; Miller, D.C.; Schafer, W.D. Gender differences in risk taking: A meta-analysis. Psychol. Bull. 1999, 125, 367. [Google Scholar] [CrossRef]
- Harris, C.R.; Jenkins, M. Gender differences in risk assessment: Why do women take fewer risks than men? Judgm. Decis. Mak. 2006, 1, 48–63. [Google Scholar]
- Daruvala, D. Gender, risk and stereotypes. J. Risk Uncertain. 2007, 35, 265–283. [Google Scholar] [CrossRef] [Green Version]
- Czerwonka, M. Cultural, cognitive and personality traits in risk-taking behaviour: Evidence from Poland and the United States of America. Econ. Res. Ekon. Istraživanja 2019, 32, 894–908. [Google Scholar] [CrossRef]
- Wang, X. Evolutionary hypotheses of risk-sensitive choice: Age differences and perspective change. Evol. Hum. Behav. 1996, 17, 1–15. [Google Scholar] [CrossRef]
- Gardner, M.; Steinberg, L. Peer Influence on Risk Taking, Risk Preference, and Risky Decision Making in Adolescence and Adulthood: An Experimental Study. Dev. Psychol. 2005, 41, 625–635. [Google Scholar] [CrossRef] [PubMed] [Green Version]
- Kreiser, P.M.; Marino, L.D.; Dickson, P.; Weaver, K.M. Cultural Influences on Entrepreneurial Orientation: The Impact of National Culture on Risk Taking and Proactiveness in SMEs. Entrep. Theory Pr. 2010, 34, 959–983. [Google Scholar] [CrossRef]
- Ashraf, B.N.; Zheng, C.; Arshad, S. Effects of national culture on bank risk-taking behavior. Res. Int. Bus. Financ. 2016, 37, 309–326. [Google Scholar] [CrossRef]
- Adolphs, R. Cognitive neuroscience of human social behaviour. Nat. Rev. Neurosci. 2003, 4, 165–178. [Google Scholar] [CrossRef] [PubMed]
- Lazer, D.; Pentland, A.S.; Adamic, L.; Aral, S.; Barabasi, A.L.; Brewer, D.; Jebara, T. Life in the network: The coming age of computational social science. Science 2009, 323, 721–723. [Google Scholar] [CrossRef] [PubMed] [Green Version]
- Kumar, R.; Novak, J.; Tomkins, A. Structure and Evolution of Online Social Networks. In Link Mining: Models, Algorithms, and Applications; Springer Science and Business Media LLC: New York, NY, USA, 2010; pp. 337–357. [Google Scholar]
- Otte, E.; Rousseau, R. Social network analysis: A powerful strategy, also for the information sciences. J. Inf. Sci. 2002, 28, 441–453. [Google Scholar] [CrossRef]
- Gloor, P.A. Sociometrics and Human Relationships; Emerald: Bingley, UK, 2017; pp. 1–23. [Google Scholar]
- Newman, M. Networks; Oxford University Press: Oxford, UK, 2018. [Google Scholar]
- Pentland, A. Honest Signals: How They Shape our World; MIT Press: Cambridge, MA, USA, 2010. [Google Scholar]
- Gloor, P.; Colladon, A.F. Heart Beats Brain: Measuring Moral Beliefs Through E-mail Analysis. In Digital Transformation of Collaboration; Przegalinska, A., Grippa, F., Gloor, P.A., Eds.; Springer Science and Business Media LLC: Berlin, Germany, 2020; pp. 85–93. [Google Scholar]
- Morgan, L.; Gloor, P. Identifying Virtual Tribes by Their Language in Enterprise Email Archives. In Digital Transformation of Collaboration; Przegalinska, A., Grippa, F., Gloor, P.A., Eds.; Springer Science and Business Media LLC: Berlin, Germany, 2020; pp. 95–110. [Google Scholar]
- Eagle, N.; Pentland, A. (Sandy) Reality mining: Sensing complex social systems. Pers. Ubiquitous Comput. 2005, 10, 255–268. [Google Scholar] [CrossRef]
- Chen, K.Y.; Janz, K.F.; Zhu, W.; Brychta, R.J. Re-defining the roles of sensors in objective physical activity monitoring. Med. Sci. Sports Exerc. 2012, 44 (Suppl. 1), S13. [Google Scholar] [CrossRef] [Green Version]
- Gloor, P.A.; Colladon, A.F.; Grippa, F.; Budner, P.; Eirich, J. Aristotle said “happiness is a state of activity”—Predicting mood through body sensing with Smartwatches. J. Syst. Sci. Syst. Eng. 2018, 27, 586–612. [Google Scholar] [CrossRef]
- Kreuter, F.; Haas, G.-C.; Keusch, F.; Bähr, S.; Trappmann, M. Collecting Survey and Smartphone Sensor Data with an App: Opportunities and Challenges around Privacy and Informed Consent. Soc. Sci. Comput. Rev. 2018, 38, 533–549. [Google Scholar] [CrossRef] [Green Version]
- Akhbarifar, S.; Javadi, H.H.S.; Rahmani, A.M.; Hosseinzadeh, M. A secure remote health monitoring model for early disease diagnosis in cloud-based IoT environment. Pers. Ubiquitous Comput. 2020, 1–17. [Google Scholar] [CrossRef]
- Shadroo, S.; Rahmani, A.M.; Rezaee, A. The two-phase scheduling based on deep learning in the Internet of Things. Comput. Netw. 2020, 107684, 107684. [Google Scholar] [CrossRef]
- Ali, F.; El-Sappagh, S.; Islam, S.M.R.; Ali, A.; Attique, M.; Imran, M.; Kwak, K.-S. An intelligent healthcare monitoring framework using wearable sensors and social networking data. Futur. Gener. Comput. Syst. 2021, 114, 23–43. [Google Scholar] [CrossRef]
- Ali, F.; El-Sappagh, S.; Islam, S.R.; Kwak, D.; Ali, A.; Imran, M.; Kwak, K. A smart healthcare monitoring system for heart disease prediction based on ensemble deep learning and feature fusion. Inf. Fusion 2020, 63, 208–222. [Google Scholar] [CrossRef]
- Sun, L.; Gloor, P. Measuring Moral Values with Smartwatch-Based Body Sensors. In Digital Transformation of Collaboration; Przegalinska, A., Grippa, F., Gloor, P.A., Eds.; Springer Science and Business Media LLC: Berlin, Germany, 2020; pp. 51–66. [Google Scholar]
- Weber, E.U.; Betz, N.E. A domain-specific risk-attitude scale: Measuring risk perceptions and risk behaviors. J. Behav. Decis. Mak. 2002, 15, 263–290. [Google Scholar] [CrossRef]
- Blais, A.R.; Weber, E.U. A domain-specific risk-taking (DOSPERT) scale for adult populations. Judgm. Decis. Mak. 2006, 1, 33–47. [Google Scholar]
- Highhouse, S.; Nye, C.D.; Zhang, D.C.; Rada, T.B. Structure of the Dospert: Is There Evidence for a General Risk Factor? J. Behav. Decis. Mak. 2017, 30, 400–406. [Google Scholar] [CrossRef]
- Aral, S.; Brynjolfsson, E.; Van Alstyne, M. Information, Technology, and Information Worker Productivity. Inf. Syst. Res. 2012, 23, 849–867. [Google Scholar] [CrossRef] [Green Version]
- Gloor, P.; Colladon, A.F.; Grippa, F.; Giacomelli, G. Forecasting managerial turnover through e-mail based social network analysis. Comput. Hum. Behav. 2017, 71, 343–352. [Google Scholar] [CrossRef]
- Ahuja, M.K.; Galletta, D.F.; Carley, K.M. Individual Centrality and Performance in Virtual R&D Groups: An Empirical Study. Manag. Sci. 2003, 49, 21–38. [Google Scholar] [CrossRef] [Green Version]
- Freeman, L.C. A Set of Measures of Centrality Based on Betweenness. Sociometry 1977, 40. [Google Scholar] [CrossRef]
- Bavelas, A. Communication Patterns in Task-Oriented Groups. J. Acoust. Soc. Am. 2005, 22, 725–730. [Google Scholar] [CrossRef]
- Hadley, B.; Gloor, P.A.; Woerner, S.L.; Zhou, Y. Analyzing vc influence on startup success: They might not be good for you. In Proceedings of the COINs Conference, Detroit, MI, USA, 14–16 September 2017; Volume 2017, p. 187. [Google Scholar]
- Kidane, Y.H.; Gloor, P. Correlating temporal communication patterns of the Eclipse open source community with performance and creativity. Comput. Math. Organ. Theory 2006, 13, 17–27. [Google Scholar] [CrossRef] [Green Version]
- Antonacci, G.; Colladon, A.F.; Stefanini, A.; Gloor, P. It is rotating leaders who build the swarm: Social network determinants of growth for healthcare virtual communities of practice. J. Knowl. Manag. 2017, 21, 1218–1239. [Google Scholar] [CrossRef] [Green Version]
- Jackson, T.; Dawson, R.; Wilson, D. Reducing the effect of email interruptions on employees. Int. J. Inf. Manag. 2003, 23, 55–65. [Google Scholar] [CrossRef] [Green Version]
- Kushlev, K.; Dunn, E.W. Checking email less frequently reduces stress. Comput. Hum. Behav. 2015, 43, 220–228. [Google Scholar] [CrossRef]
- Maffesoli, M. The Time of the Tribes: The Decline of Individualism in Mass Society; Sage: Thousand Oaks, CA, USA, 1995. [Google Scholar]
- Garry, T.; Broderick, A.J.; Lahiffe, K. Tribal motivation in sponsorship and its influence on sponsor relationship development and corporate identity. J. Mark. Manag. 2008, 24, 959–977. [Google Scholar] [CrossRef]
- Gloor, P.; Colladon, A.F.; De Oliveira, J.M.; Rovelli, P. Put your money where your mouth is: Using deep learning to identify consumer tribes from word usage. Int. J. Inf. Manag. 2020, 51, 101924. [Google Scholar] [CrossRef]
- Russell, J.A. A circumplex model of affect. J. Personal. Soc. Psychol. 1980, 39, 1161. [Google Scholar] [CrossRef]
- Breusch, T.S.; Pagan, A.R. A Simple Test for Heteroscedasticity and Random Coefficient Variation. Econometrica 1979, 47, 1287. [Google Scholar] [CrossRef]
- Cook, R.D.; Weisberg, S. Diagnostics for heteroscedasticity in regression. Biometrika 1983, 70, 1–10. [Google Scholar] [CrossRef]
- Podsakoff, P.M.; MacKenzie, S.B.; Lee, J.Y.; Podsakoff, N.P. Common method biases in behavioral research: A critical review of the literature and recommended remedies. J. Appl. Psychol. 2003, 88, 879. [Google Scholar] [CrossRef]
- Nowak, M.A.; Page, K.M.; Sigmund, K. Fairness versus reason in the ultimatum game. Science 2000, 289, 1773–1775. [Google Scholar] [CrossRef] [PubMed] [Green Version]
Figure 1.
Theoretical framework. In this work we conduct two different case studies. On the one hand, a social network through e-mail archives is studied by analyzing structural metrics, virtual features, and emotionality. On the other hand, body-signal data are collected by using the Happimeter system. We then used both data separately to predict each person’s risk-preference through the DOSPERT survey [32,33], in five specific domains.

Figure 2.
Comparison between the predicted risk-preference score and the real self-reported value (N = 34) in the general (a,b), ethical (c,d), financial (e,f), health (g,h), recreational (i,j), and social domains (k,l). Each point corresponds to a specific participant. The predicted value is calculated by using significant predictors and the corresponding coefficients reported in Table 3.

Figure 3.
Comparison between the predicted risk-preference score and the realistic self-reported value (N = 15) over six domains of Study B (a,b for general, c,d for ethical, e,f for financial, g,h for health, i,j for recreational, k,l for social). The predicted value is calculated using significant predictors and the corresponding coefficients reported in Table 4.

Figure 4.
Significant predictors of risk-preference.


Table 1.
Explanation of five macro-categories of tribe used in this paper, each of them includes four dimensions.
Table 1.
Explanation of five macro-categories of tribe used in this paper, each of them includes four dimensions.
| Macro-Category | Dimension | Explanation |
|---|---|---|
| Alternative Realities | fatherlanders | extreme patriots whose vision is a recreation of the national states from the 1900s |
| spiritualism | people who focus on all things spiritual such as soul and mindfulness | |
| nerds | people who believe in advances in technology as a solution for a better future | |
| tree huggers | environmentalists who strive to protect nature from phenomena such as global warming | |
| Personality | stock-traders | people who are willing to take risks to grow their capital |
| politicians | people who use “political language” rather than simply saying the truth and sticking to the facts | |
| journalists | people who use direct language to report actual events as the opposite to politicians | |
| risk-takers | people who make daring decisions (trained with tweets of wing-suit flyers and cave divers) | |
| Recreation | fashion | people who focus on new fashion styles |
| art | people who have an interest in art, such as music or painting | |
| travel | people who enjoy travelling around the world | |
| sport | people who enjoy actively engaging in sports | |
| Ideology | liberalism | liberals focusing on enhancing and protecting the freedom of individuals |
| socialism | people who advocate for more government control to better distribute shared resources | |
| capitalism | people arguing for letting the “invisible hand” take its course through minimal government intervention in markets | |
| complainers | people who frequently voice their protests and vent their frustrations in public | |
| Lifestyle | yolo | “You only live once” people who want to live life to its fullest extent, even embracing behavior carrying inherent risk |
| sedentary | people who spend too much time seated with little exercise or physical activity | |
| fitness | people who favor fitness such as strength training, cardio, and yoga | |
| vegan | people who eat no animal-derived products |
Table 2.
Explanation of Happimeter variables.
| Category | Variable | Definition |
|---|---|---|
| Movement sensor | avg-AccX | The mean of user’s acceleration magnitude (aggregated by day) in the physical space along the x axis |
| avg-AccY | Similar to avgAcc-x but measured along the y axis | |
| avg-AccZ | Similar to avgAcc-x but measured along the z axis | |
| var-AccX | The variance of acceleration magnitude (aggregated by day) along the x axis | |
| var-AccY | Similar to varAcc-x but measured along the y axis | |
| var-AccZ | Similar to varAcc-x but measured along the z axis | |
| Physiological sensor | avg-bpm | The average number of aggregated-by-day heart rate |
| var-bpm | The variance of aggregated-by-day heart rate | |
| Mood state | avg-pleasant | The mean value of day-level scores for self-reported pleasance |
| avg-active | Similar to avg-pleasant but measured for active scores | |
| var-pleasant | The variance of day-level scores for self-reported pleasance | |
| var-active | Similar to var-pleasant but measured for active scores |
Table 3.
Ordinary least squares (OLS) regression on the risk-taking and risk-willingness of Study A (N = 34). The stars within the bracket correspond to the predictor’s significance level: * p < 0.1, ** p < 0.05, *** p < 0.01.
Table 3.
Ordinary least squares (OLS) regression on the risk-taking and risk-willingness of Study A (N = 34). The stars within the bracket correspond to the predictor’s significance level: * p < 0.1, ** p < 0.05, *** p < 0.01.
| Dependent Variable | Significant Predictor (Coefficient) | Adj. R2 | RMSE | Chi-2 (Prob. > Chi-2) |
|---|---|---|---|---|
| (a) Risk-taking | ||||
| 1. general | Lifestyle-Fitness (−1.27 ***), Contribution index oscillation (−0.003 **), ART (−0.01 **), Recreation-Sport (0.91 **) | 0.60 | 0.27 | 0.88 (0.35) |
| 2. ethical | Lifestyle-Yolo (−2.37 **), Personality-Journalist (3.85 **), Recreation-Sport (1.50 **), Alternative Realities-Spiritualism (1.41 **) | 0.53 | 0.53 | 1.26 (0.26) |
| 3. financial | Recreation-Arts (2.88 ***) | 0.33 | 0.74 | 0.10 (0.76) |
| 4. health | Recreation-Sport (2.91 ***), Lifestyle-Yolo (−2.32 **), Lifestyle-Fitness (−1.78 *) | 0.54 | 0.57 | 1.94 (0.20) |
| 5. recreational | ART (−0.04 ***), Personality-Politician (−2.69 ***), Emotion-Happy (1.79 **), Contribution index oscillation (−0.006 *) | 0.65 | 0.67 | 0.72 (0.40) |
| 6. social | Degree centrality (0.003 **), Alternative Realities-Spiritualism (−1.80 ***) | 0.36 | 0.66 | 0.63 (0.43) |
| (b) Risk-willingness | ||||
| 1. general | Lifestyle-Yolo (−4.17 ***), Ideology-Complainer (13.55 **), Emotion-Sad (−1.65 **), Ideology-Liberalism (1.11 **) | 0.61 | 0.60 | 0.05 (0.82) |
| 2. ethical | Lifestyle-Yolo (−4.83 **), Personality-Journalist (5.95 **), Ideology-Complainer (26.37 ***) | 0.51 | 1.00 | 0.18 (0.67) |
| 3. financial | Lifestyle-Yolo (−6.10 **), Recreation-Arts (3.26 **), Reach-2 (−0.01 *) | 0.45 | 1.10 | 0.39 (0.53) |
| 4. health | Lifestyle-Sedentary (3.77 ***), Lifestyle-Yolo (−5.09 **), Lifestyle-Fitness (−3.36 **) | 0.50 | 1.06 | 0.26 (0.61) |
| 5. recreational | ART (−0.05 ***), Personality-Politician (−6.77 ***) | 0.60 | 1.16 | 0.43 (0.51) |
| 6. social | Alternative Realities-Spiritualism (−4.18 ***), Nudges (−1.53 *) | 0.44 | 0.89 | 0.03 (0.87) |
Table 4.
OLS regression analysis of Study B based on 4339 sensor records and 2450 affective records from 15 participants. The stars within the bracket correspond to the predictor’s significance level: * p < 0.1, ** p < 0.05, *** p < 0.01.
Table 4.
OLS regression analysis of Study B based on 4339 sensor records and 2450 affective records from 15 participants. The stars within the bracket correspond to the predictor’s significance level: * p < 0.1, ** p < 0.05, *** p < 0.01.
| Dependent Var. | Significant Predictor (Coefficient) | Adj. R2 | RMSE | Chi-2 (Prob. > Chi-2) |
|---|---|---|---|---|
| (a) Risk-taking | ||||
| 1. general | var-AccX (0.41 **) | 0.33 | 0.42 | 1.53 (0.22) |
| 2. ethical | var-AccX (0.47 *) | 0.18 | 0.67 | 1.67 (0.20) |
| 3. financial | avg-active (1.73 **), var-AccY (−0.89 *) | 0.45 | 0.75 | 0.25 (0.62) |
| 4. health | var-AccX (0.63 **) | 0.27 | 0.74 | 2.38 (0.12) |
| 5. recreational | var-bpm (−0.54 ***) | 0.50 | 0.88 | 1.08 (0.30) |
| 6. social | avg-AccX (0.35 **) | 0.37 | 0.65 | 0.23 (0.63) |
| (b) Risk-willingness | ||||
| 1. general | var-bpm (−0.55 **) | 0.49 | 0.90 | 0.95 (0.33) |
| 2. ethical | avg-bpm (0.11 **) | 0.29 | 1.10 | 1.99 (0.16) |
| 3. financial | avg-active (3.00 **), avg-AccY (−1.03 **) | 0.52 | 1.20 | 0.01 (0.95) |
| 4. health | avg-AccY (−1.12 **) | 0.23 | 1.32 | 0.01 (0.93) |
| 5. recreational | var-bpm (−0.87 ***), avg-AccY (−0.82 *) | 0.60 | 1.33 | 0.35 (0.55) |
| 6. social | avg-AccX (0.39 **) | 0.35 | 0.89 | 0.24 (0.62) |
Publisher’s Note: MDPI stays neutral with regard to jurisdictional claims in published maps and institutional affiliations. |
© 2021 by the authors. Licensee MDPI, Basel, Switzerland. This article is an open access article distributed under the terms and conditions of the Creative Commons Attribution (CC BY) license (http://creativecommons.org/licenses/by/4.0/).
Share and Cite
MDPI and ACS Style
Sun, J.; Gloor, P. E-Mail Network Patterns and Body Language Predict Risk-Taking Attitude. Future Internet 2021, 13, 17. https://0-doi-org.brum.beds.ac.uk/10.3390/fi13010017
AMA Style
Sun J, Gloor P. E-Mail Network Patterns and Body Language Predict Risk-Taking Attitude. Future Internet. 2021; 13(1):17. https://0-doi-org.brum.beds.ac.uk/10.3390/fi13010017
Chicago/Turabian StyleSun, Jiachen, and Peter Gloor. 2021. "E-Mail Network Patterns and Body Language Predict Risk-Taking Attitude" Future Internet 13, no. 1: 17. https://0-doi-org.brum.beds.ac.uk/10.3390/fi13010017
Note that from the first issue of 2016, this journal uses article numbers instead of page numbers. See further details here.