Article

The Effects of the Content Elements of Online Banner Ads on Visual Attention: Evidence from An-Eye-Tracking Study

by
Serhat Peker
1,
Gonca Gokce Menekse Dalveren
2 and
Yavuz İnal
3,*
1
Department of Management Information Systems, İzmir Bakirçay University, 35665 İzmir, Turkey
2
Department of Information Systems Engineering, Atilim University, 06830 Ankara, Turkey
3
Department of Information Science and Media Studies, University of Bergen, 5007 Bergen, Norway
*
Author to whom correspondence should be addressed.
Future Internet 2021, 13(1), 18; https://0-doi-org.brum.beds.ac.uk/10.3390/fi13010018
Submission received: 12 December 2020 / Revised: 6 January 2021 / Accepted: 12 January 2021 / Published: 15 January 2021
(This article belongs to the Special Issue Human-Computer Interaction Theory and Applications)

Abstract

:
The aim of this paper is to examine the influence of the content elements of online banner ads on customers’ visual attention, and to evaluate the impacts of gender, discount rate and brand familiarity on this issue. An eye-tracking study with 34 participants (18 male and 16 female) was conducted, in which the participants were presented with eight types of online banner ads comprising three content elements—namely brand, discount rate and image—while their eye movements were recorded. The results showed that the image was the most attractive area among the three main content elements. Furthermore, the middle areas of the banners were noticed first, and areas located on the left side were mostly noticed earlier than those on the right side. The results also indicated that the discount areas of banners with higher discount rates were more attractive and eye-catching compared to those of banners with lower discount rates. In addition to these, the participants who were familiar with the brand mostly concentrated on the discount area, while those who were unfamiliar with the brand mostly paid attention to the image area. The findings from this study will assist marketers in creating more effective and efficient online banner ads that appeal to customers, ultimately fostering positive attitudes towards the advertisement.

1. Introduction

With the penetration of the internet and the ever-growing popularity of digital platforms, the web is, today, an important advertising medium. Increasingly, companies are employing online advertising in the marketing and sales of products. A recent study of the Interactive Advertising Bureau [1] revealed that the US Internet advertising market has grown to $107.5 billion USD in 2018 by increasing by $19.2 billion USD (21.8%) over 2017, while European digital advertising has reached a market value of €55.0 billion in the same year according to the AdEx Benchmark report commissioned by IAB (Interactive Advertising Bureau) Europe [2]. This impressive growth is also expected to continue in the coming years, and the digital advertising market worldwide is predicted to be worth more than $490 billion USD up to 2025 [3]. All of these figures reflect that online advertising has grown to become one of the most important forms of marketing.
Among many different digital advertising forms, banner advertising has become one of the most prevalent and leading advertising instruments on the Internet since its first appearance in 1994 [4]. According to the data reported by Statista [5], the global banner advertising market size was about $55 billion USD in 2018, and it is the third biggest market within Digital Advertising. Furthermore, it will continue to be one of the most effective types of online advertising in the next few years, with an estimation of a market volume of $73.2 billion USD in 2025 [5]. Given its ongoing explosive growth and its volume in the market, banner ads are a profitable way of advertising for marketing practitioners.
An online banner ad, which is displayed on a website accessed via desktop PCs, on a mobile-enabled website, or in an app, consists of a combination of graphics and textual content, and usually redirects the user to a landing page of the advertiser when they are clicked. Research has shown that banner advertisements are key tools for advertising products by providing information and raising customer purchase intentions [6]. Moreover, banner advertising enhances brand awareness, and contributes to brand attitude in a positive manner [7]. Thus, in advertising, it is essential to form effective banners that are appealing to users and increase the chance of their positive attitudes towards the advertisement. In this regard, visual attention plays a crucial role in the assessment of the effectiveness of the banner advertising. According to Lee and Ahn [8], measuring consumer’s visual attention accurately estimates advertising effectiveness. Additionally, Thorson et al. [9] confirm that a higher level of attention to stimuli results in a more favorable attitude towards advertisements. Krajbich et al. [10] also demonstrate the importance of visual attention in banner effectiveness by proposing that the more attention is paid to advertisements, the higher the likelihood of a purchase.
On the other hand, conventional methods (e.g., interviews, focus group, questionnaires, etc.) have been widely applied in order to measure people’s attention during their exposure to a stimulus. In these methods, participants are presented with a visual stimulus, and then they are asked to indicate their first thoughts and express their feelings about the stimulus. These traditional techniques are generally limited in reflecting the overt and covert attention of individuals, since they depend on individuals’ willingness and competency to describe how they feel about the stimulus [11,12]. In contrast, eye movements are strongly associated with visual attention [13], and they provide an objective indicator of individuals’ overt and covert attention [14]. In this regard, the eye-tracking method can eliminate the problems of conventional methods by gathering individuals’ real-time and objective visual behavior with regard to the stimulus efficiently [15]. With the above advantages and the technological advances made in eye-tracking software development, the eye-tracking method has become increasingly popular in the fields of consumer research and marketing in recent years as a means of exploring the ways in which consumers view visual stimuli in real-world conditions [16]. In this context, many studies have utilized this method to examine customers’ attention to marketing stimuli, such as products or product packages [17,18,19,20,21,22,23], print advertisements [24,25,26,27,28,29], and online advertisements [30,31,32,33,34,35], evidencing that it is a valid and efficient method.
Therefore, by using the eye-tracking technique, the present study mainly aims to investigate how the content elements of online banner ads influence customers’ attention. Additionally, the paper examines the effects of gender, discount rate and brand familiarity on the visual attention to banner elements. In order to achieve these objectives, we selected banner ads from the apparel category, because the goods in this category were the most popular ones purchased online in the EU in 2019 according to a recent report of individuals’ e-commerce statistics [36]. Online banner ads in this field contain a variety of different contents, which are tailored to retain effectiveness and draw customers’ visual attention. However, Pieters and Wedel [37] found that there are three main elements of banner ads, namely brand, pictorial and text elements, which have remarkable influences on visual attention to advertisements. In this respect, the content elements of banner ads—which are image (as a pictorial element), discount information (as a text element), and brand—were considered, and eight distinct online banner ads comprised of these three components were used in this study. Experiments were conducted in order to measure the participants’ attention using eye-tracking technology. The eye-tracking data gathered from the banner ads’ exposure to the participants were analyzed through statistical tests, and the results were interpreted.
This research makes the following contributions. First, the present study further extends earlier work by examining the impact of the content elements of online banner ads on visual attention. Second, this paper explores the effects of gender, discount rate and brand familiarity on visual attention to banner elements. Third, it serves a valuable reference for researchers in designing eye-tracking experiments and data analysis for the investigation of online banner ads. Finally, this study provides marketers and advertisers with guidelines on the optimization of the content elements of banner ads in order to design effective online banner ads, which lead to more visual attention.

2. Literature Review

Internet advertising has become increasingly popular in recent years, and advertisers are widely using online advertising tools to provide information about their company and products [38,39]. These tools also enable enterprises to create advertisement awareness, brand awareness, and purchase intention in consumers [40,41,42]. On the web, various types of online advertisements forms exist. Among them, the simple banner advertisement has been the most enduring format since its initial appearance in 1994 [43], and it is a widely-used form of online advertising due to its effectiveness in influencing consumers’ interests in the advertised products and brands [44].
Online banner ads come in various shapes, sizes and formats. Interactive elements such as color, image and animation are also often included in the design of banners in order to draw users’ visual attention. Prior studies have highlighted that all of these design properties of banners can play a crucial role in banner effectiveness [32,44,45,46,47,48]. Understanding which design properties and other factors influence banner effectiveness is significantly important for advertising practitioners and academics, and in line with this, research efforts are continuously trying to find new ways to design effective banner ads that capture consumers’ attention and thereby raise their positive attitudes towards products or brands [49].
Many studies have explored how the shape of banner ads influences banner effectiveness. A pioneer piece of research [50] on this topic reported that vertical banner advertisements, which are aligned in an up-down position, may attract more consumer attention than do horizontal ads. Similarly, Sigel et al. [51] indicated that users are more frequently attracted by vertical banners, and Burns and Lutz [52] reported that vertical banner ads are more informative and effective than horizontal ones. In contrast, Goodrich [53] illustrated that users may have more positive attitude towards the brand if a horizontal banner ad is used. Li et al. [32] also reported that horizontal banners attract more attention relative to vertical ads.
Various studies have examined the influence of banner types (static or animated) on banner effectiveness. One stream of prior studies found that animated banners have less attention-grabbing capability than static banners, and create a negative impact on the attitude and response to the advertisement [32,37,54,55]. Conversely, the other stream of past research indicated that animated banners attract greater, earlier, and more frequent attention, and significantly increase advertising effectiveness as well [56,57,58,59]. In addition to these, empirical evidence shows that there is no significant difference in users’ visual attention between static banners and animated ones [46].
Past research has also investigated how the location of a banner can influence visual attention. For example, research conducted by Simola et al. [60] found that banner advertisements which are placed on the right side of a webpage capture more customer attention. In contrast, Resnick and Albert [48] indicated that banner advertisements located on the right side of a webpage attract less visual attention and cause stronger banner-blindness. Furthermore, research regarding the influence of the size factor on banner effectiveness has shown that larger banners infer more user attention than smaller banners [61,62]. It was also asserted that the size of the banner is much less relevant than its content in the banner effectiveness [50].
Traditional banner ads were typically designed as an advertisement tool including graphics and sometimes photographs along with text. However, a number of studies have demonstrated that pictorial ads are more eye-catching to consumers than text-only ads [37,63]. In this context, previous research has also examined the effect of image/photo usage on banner effectiveness. For example, Flores et al. [64] revealed that consumers significantly pay more attention to a high-involvement product (e.g., a smartphone) than a low-involvement product (e.g., a news magazine). Moreover, empirical evidence shows that placing human faces in banner ads attracts more visual attention of users, and contributes banner effectiveness [65]. Palcu et al. [66] recently proposed that using models who direct their gaze toward a product in a banner advertisement can grab more attention from customers toward the product region of the advertisement compared to one with a direct gaze turned.
For the inclusion of brand information in the banner ads, some evidence indicates that consumers can display stronger attention towards unbranded banners than towards the ones which are branded [55,67]. Research conducted by Robinson et al. [68] support the argument that a brand logo is ineffective in capturing the visual attention of customers. Additionally, price, discount and promotion are other pieces of information which are included in banner ads, and prior research has investigated the impact of such information. While a number of previous studies indicate that the inclusion of promotional incentives and discounts in banner advertising negatively influences effectiveness [68,69], recent empirical evidence has suggested that banner ads that contain discount information draw more customer attention than banner ads that do not have discount information [70].
While there exists a large body of literature which has examined several aspects of banner advertising on visual attention, very little research appears to have been undertaken in order to explore the influence of banner content elements. One relevant study was reported by Calisir and Karaali [45], who investigated three content elements of a bank banner, which were the bank’s name, URL address, and service information. This study used three distinct banners consisting of one or two of these elements in order to examine their effects on attention. A recent study proposed by Hernández-Méndez and Muñoz-Leiva [31] also examined the impact of text and image components on attention using a banner from the tourism industry. Another recent study [70] investigated the effective combination of the banner ads’ content elements (e.g., discount information, image of models) and ad slot position in order to capture visual attention. The focus of this study was mainly to understand how different content compositions influence the attention of female consumers.
Despite the above-mentioned studies, there is still a very limited understanding of how the different content elements of online banner ads influence visual attention. In fact, banner ads typically include a combination of various elements—like a message, image, brand, price, discount, etc.—and a broad exploration of banner content elements that attract customers’ visual attention is paramount for both practitioners and academics. In this way, advertisers can create effective online banner ads that are appealing to users, resulting in the achievement of a favorable attitude towards a target product or brand. Therefore, this research endeavors to fill this gap, and focuses on how the content elements of online banner ads influence customers’ attention through the analysis of eye-tracking data.

3. Materials and Methods
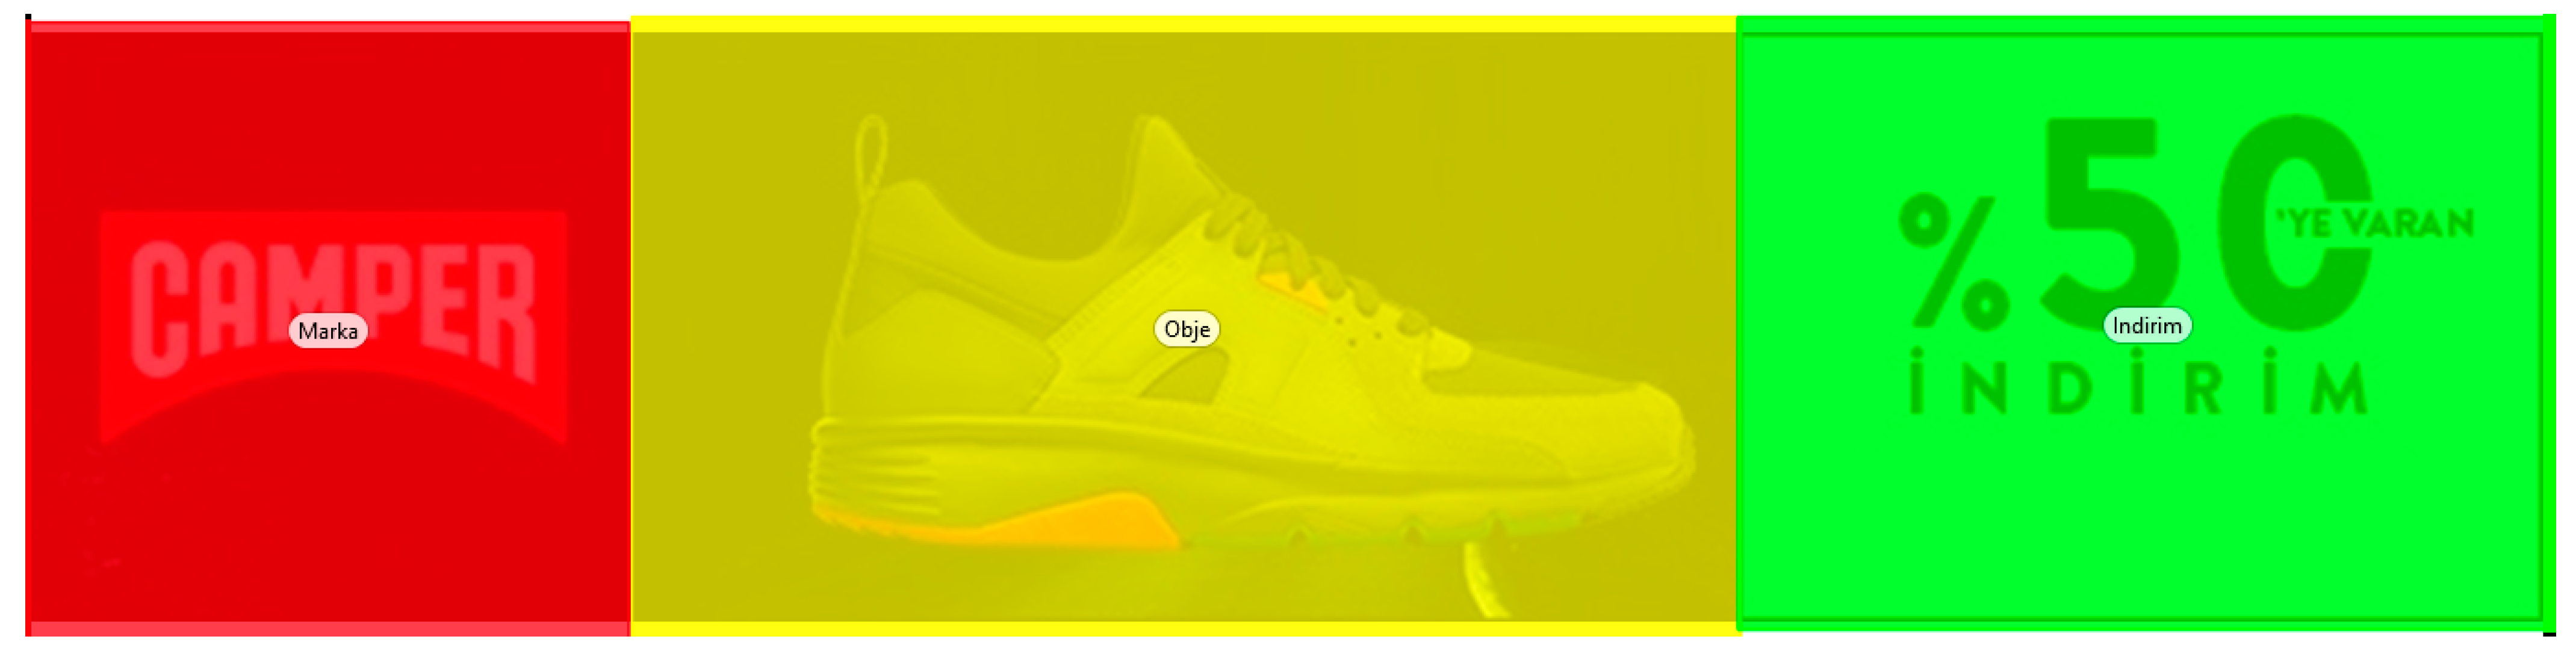
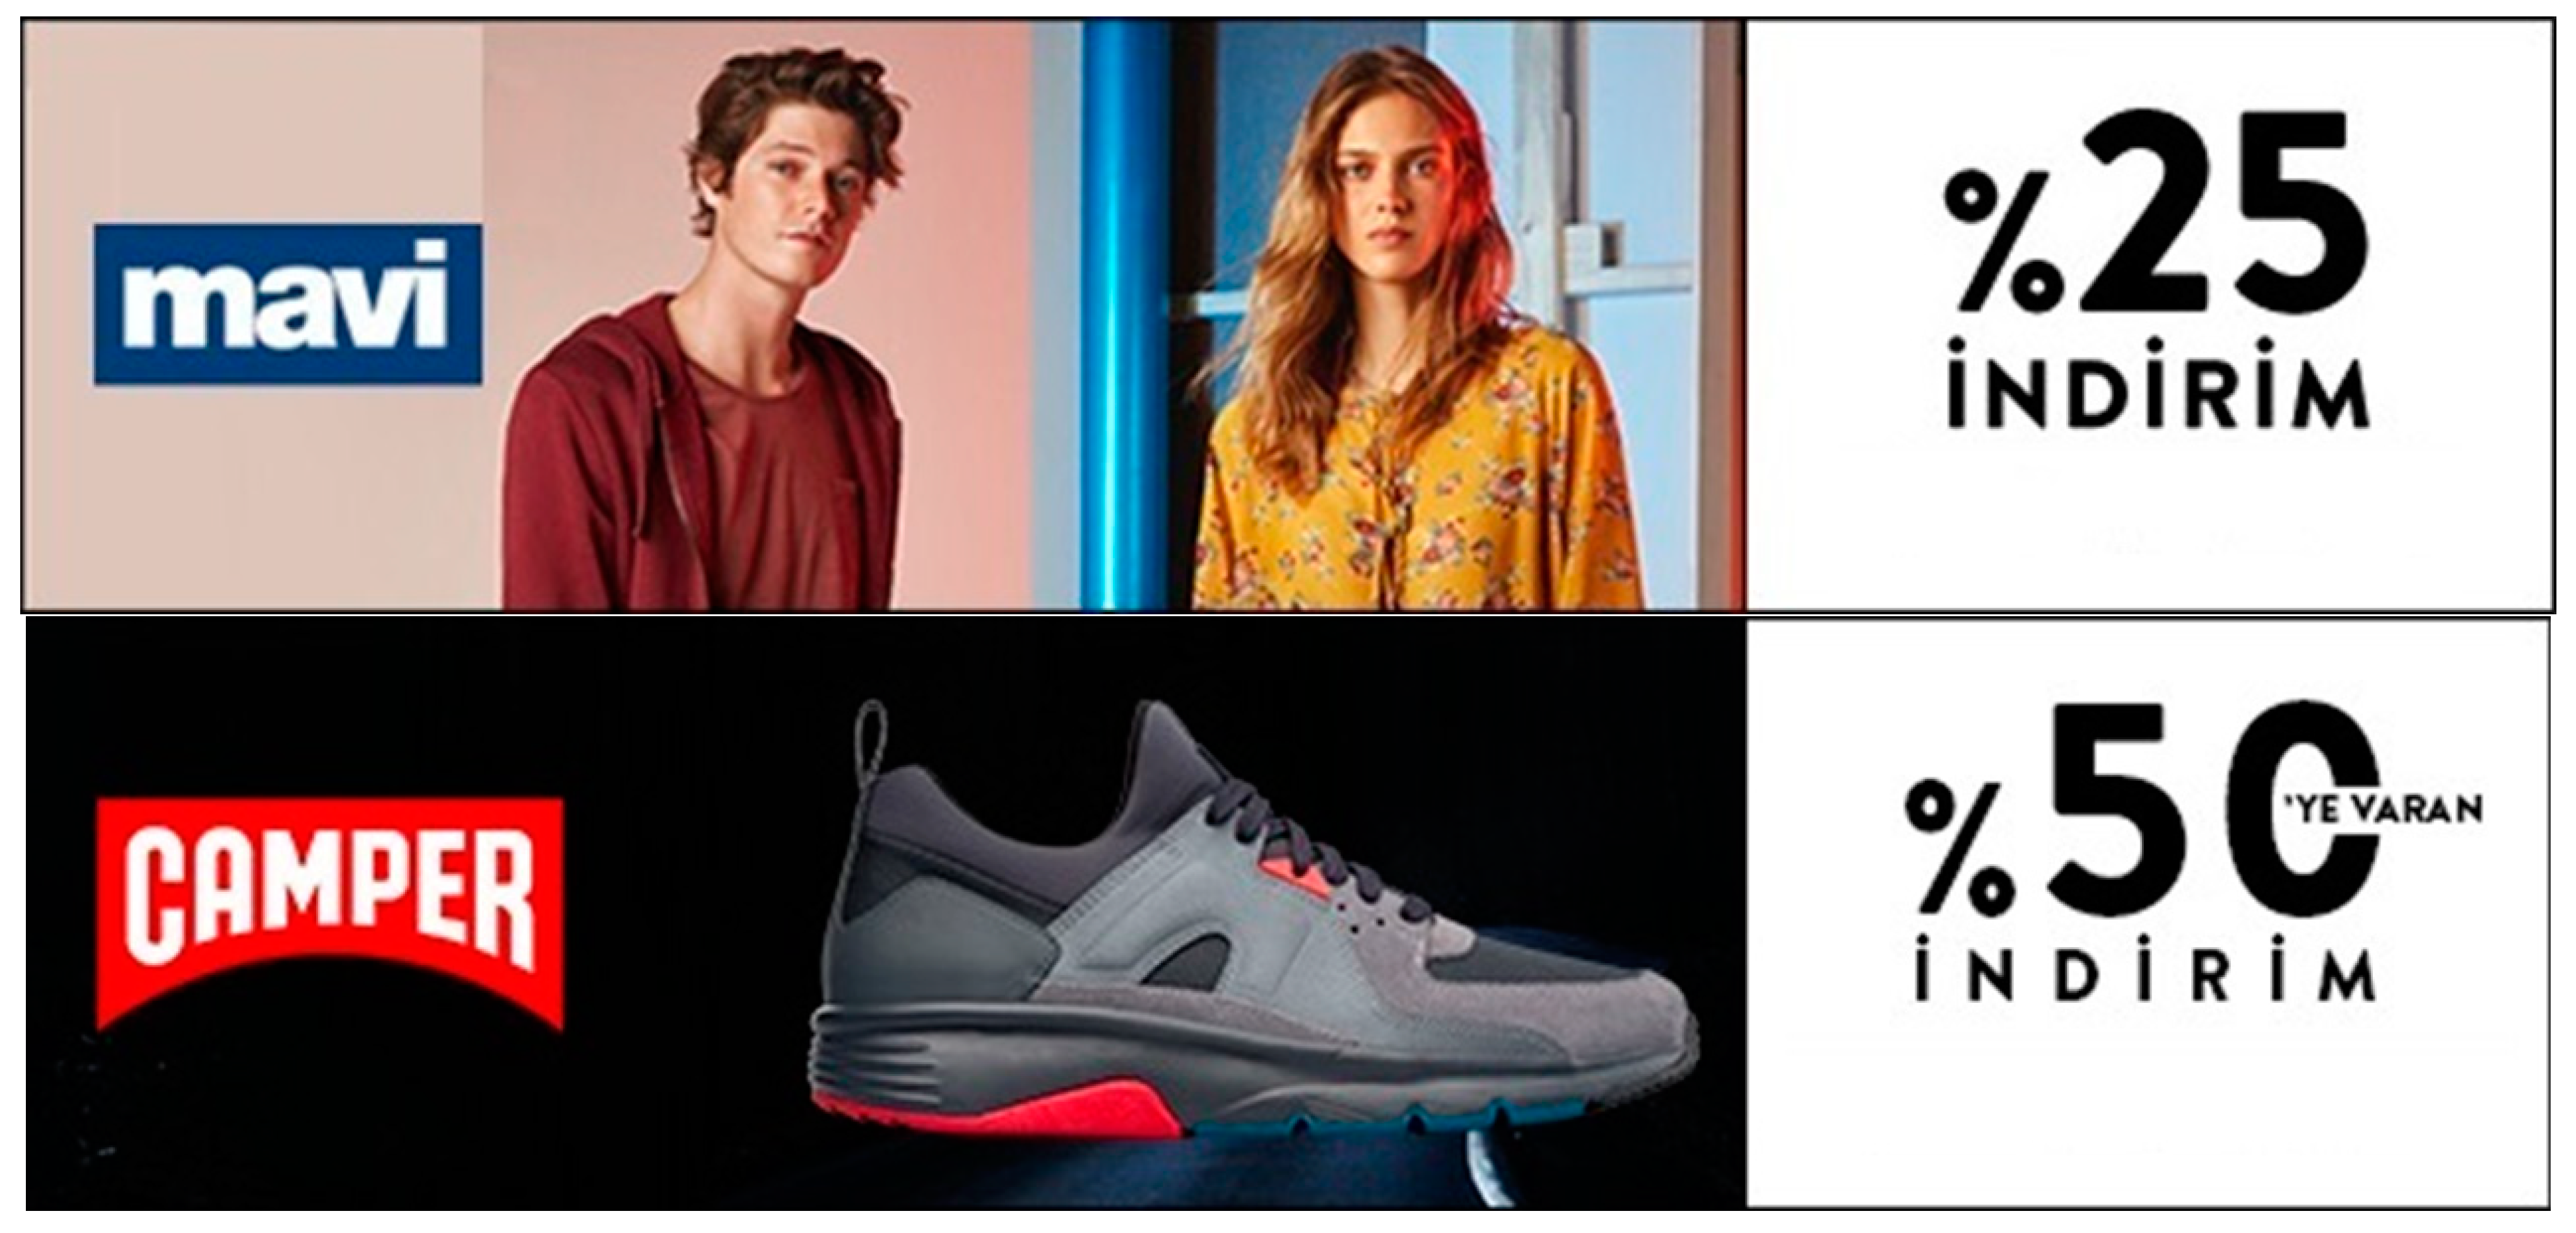
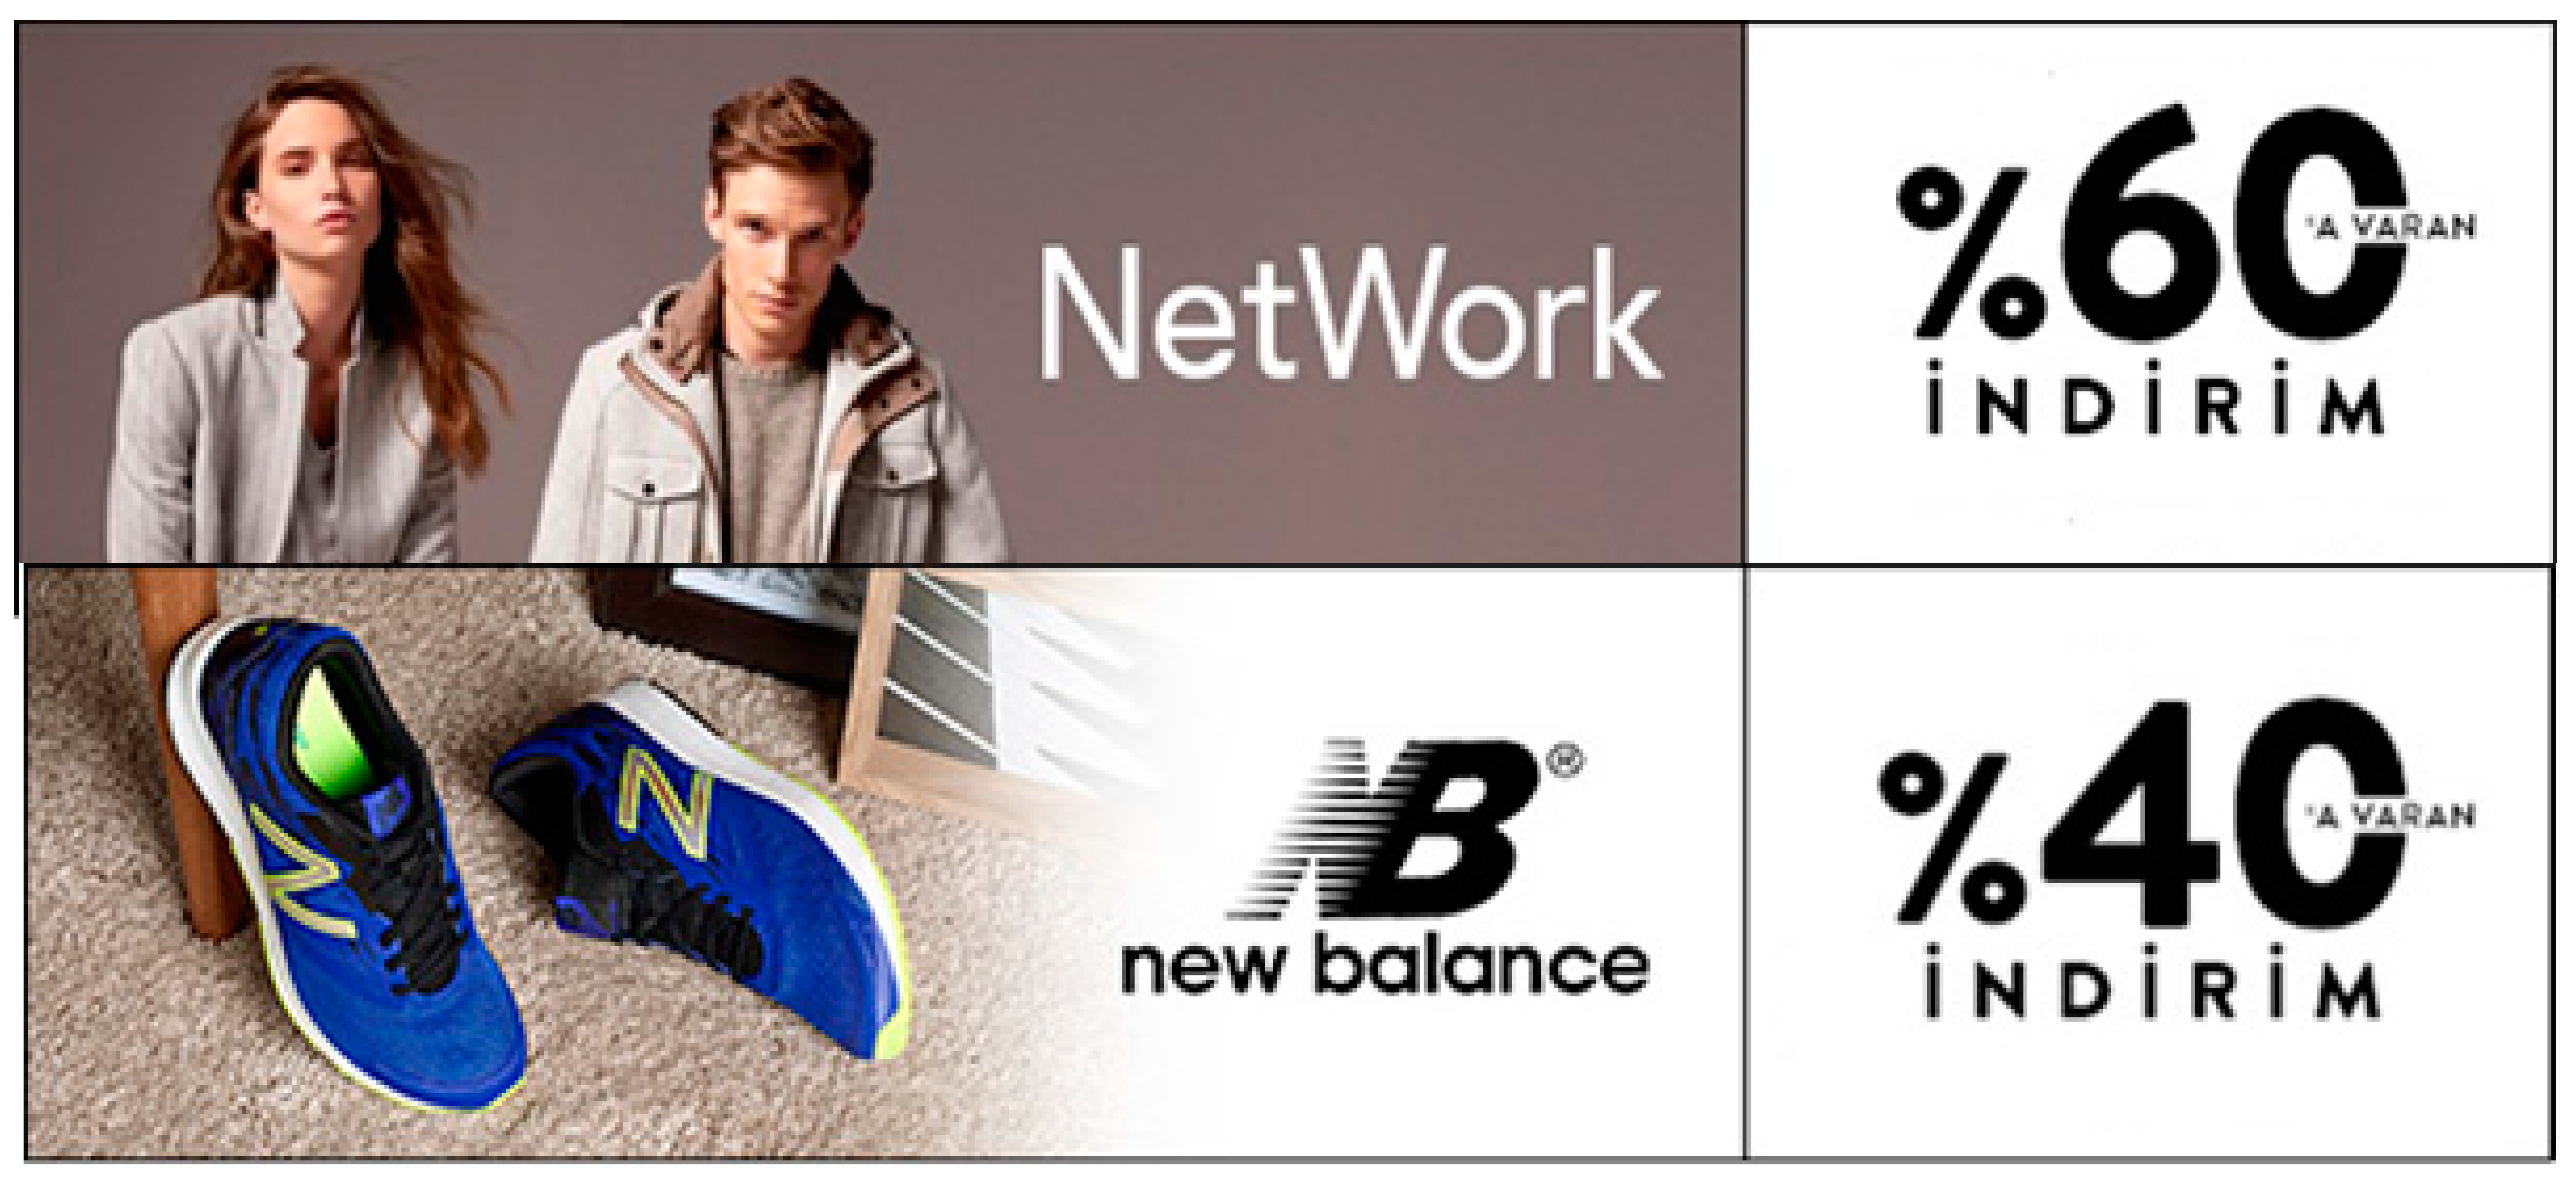
3.1. Stimuli

The stimulus materials were banner ads placed on the homepage of e-commerce websites. The banner ads were evaluated separately and not as a part of such websites in order to eliminate the effect of browsing and the position on the page. The online banner ads used in this study were related to the apparel sector, and consisted of three main components: (1) ‘Brand’—the brand associated with the discount; (2) ‘Discount rate’—the discount rate related to the brand; (3) ‘Image’—the photo of a garment or the picture of a model/models wearing a garment of the corresponding brand. They were collected from the 50 most popular e-commerce websites in Turkey—such as Hepsiburada, Boyner and Trendyol—according to Alexa (alexa.com). We analyzed various banner ads in these websites, and identified the four most widely-used unique banner layouts comprising three content elements, which are image, discount rate, and brand. Hence, a total of eight banner ads were selected, with two different versions for each of four layouts. All of the banner ads selected for this study are presented in Appendix A, and the layout details of them are also listed in Table 1.
As shown in Table 1, the selected banners are pertain to four layouts that differ with respect to the positions of three content elements. For example, in ‘banner 1a’ the image is placed in the middle, the discount rate is positioned on the left, and the brand name is located on the right-hand side. Moreover, for each layout, there are two versions of the banner advertisement. One contains object image (the photo of a garment), while the other contains a picture of models (the photo of models wearing garments). For instance, ‘banner 1a’ has a model image, whereas ‘banner 1b’ has an object image (please see Appendix A, Figure A1). In addition to these, banners for distinct brands were chosen, and they were selected to investigate the effect of the discount rate, as the pairs of each combination have different discount rates.
The banners were typically a horizontal rectangle, and were fixed at same the original sizes as those in the corresponding websites from which they retrieved. In order to avoid capturing biased eye-movement data, as in these banners, for the banners with the model image, we selected the ones with two models (a woman, and a man), whereas we selected ones with sports shoes for the banners with the object image (please see Appendix A). In this regard, we also selected banners from the brands with products for both genders.

3.2. Participants

Since the online banner ads were chosen from the apparel category, the sample of this research was selected from the 16–24 age-group, which make up the highest share in online buyers purchasing apparel products in the EU [36]. Thus, this study was conducted with a total of 35 participants who were undergrad students from Atilim University. They were recruited using an online research participation system. For only one participant, no complete eye-tracking data could be acquired. This was excluded from the analysis, and all of the statistical analyses were conducted based on the experimental data of the remaining 34 participants, of which 18 were males and 16 were females. This sample size can be considered sufficient for qualitative and explorative eye-tracking studies, which are generally conducted with relatively small sample sizes of participants [71]. The participants’ ages ranged from 19 to 26, with a mean of 22.39 (SD = 2.37), which is a reasonable sample to reduce the potential extraneous effects of age on the results. All of the participants had normal vision, or vision corrected by wearing glasses or contact lenses. Furthermore, all are right-handed, and they have left-to-right reading behavior, such as in the Western system.

3.3. Apparatus

The experiments were performed in a quiet room in the SimLab of Atilim University. The apparatus in this room was comprised of a Tobii X60 eye tracker, a desktop computer, and an 18.5” LED monitor, with a screen resolution of 1366-768 pixels. All of these devices were connected to each other. The eye tracker had a sampling frequency of 60 Hz and an accuracy level of 0.5 degrees. Moreover, Tobii Studio Software was used to present the stimuli, to calibrate the eye tracker, to record the data related to participant eye movements and fixation behavior, and to form descriptive statistics.

3.4. Procedure

In order to investigate the influence of the banner ads’ content elements on the visual attention, experiments were conducted to measure the participants’ attention—using eye-tracking technology—while they were looking at banner ads with different layouts. The study was approved by the Human Research Ethics Board of Atilim University, and all of the experiments were carried out in accordance with the relevant ethical principles and standards. Prior to the formal experiments, a pilot study was carried out with five participants in order to evaluate the experimental environment and conditions, and more importantly, to decide how long each banner advertisement should be shown. The pilot study was identical to the formal experiments. The only difference was that the participants were free to view each banner ad for as much time as they wished.
The formal experiments consisted of a set of steps. First, the participants were informed of the experimental procedure and the eye tracker. After receiving the informed consent of participants to voluntarily take part in the study, they were seated at a table in front of a computer screen, and their seating position was adjusted to stay centered in front of the monitor at a distance of 70 cm. A standardized screen brightness and ambient light were ensured, and the participants were instructed to look at the screen during the experiment. The eye tracker device was located under the monitor, and a calibration process was performed in order to ensure that the eye tracker accurately recorded the participants’ eye movements.
Once the calibration results reached the standards, the participants were exposed to visual marketing stimuli. The participants were not required to carry out any particular task, and they were only requested to watch the banner ads that would appear on the screen. Each of the eight banner ads were automatically displayed for 5 s, since this is the average amount of time spent by participants while viewing the banner ads in the pilot study. In this manner, viewing periods longer than 5 s might cause the participants to become bored, to become visually fatigued, or to lose their concentration. Furthermore, the order of the stimuli was kept constant during the experiments, and in this fixed sequence, two different banner ads of each layout were placed so that they did not appear back to back. Before each banner ad appeared on the screen, an image of a black background was presented for 3 s in order to prevent the participants from initially fixating on the specific point of the banner ads. During the exposure to the banner ads, the eye tracker recorded the participants’ eye movements. After the participants completed the viewing of all of the banner ad stimuli, they were asked to fill out a questionnaire regarding their demographic characteristics and familiarity with the brands that were in the banner ads.

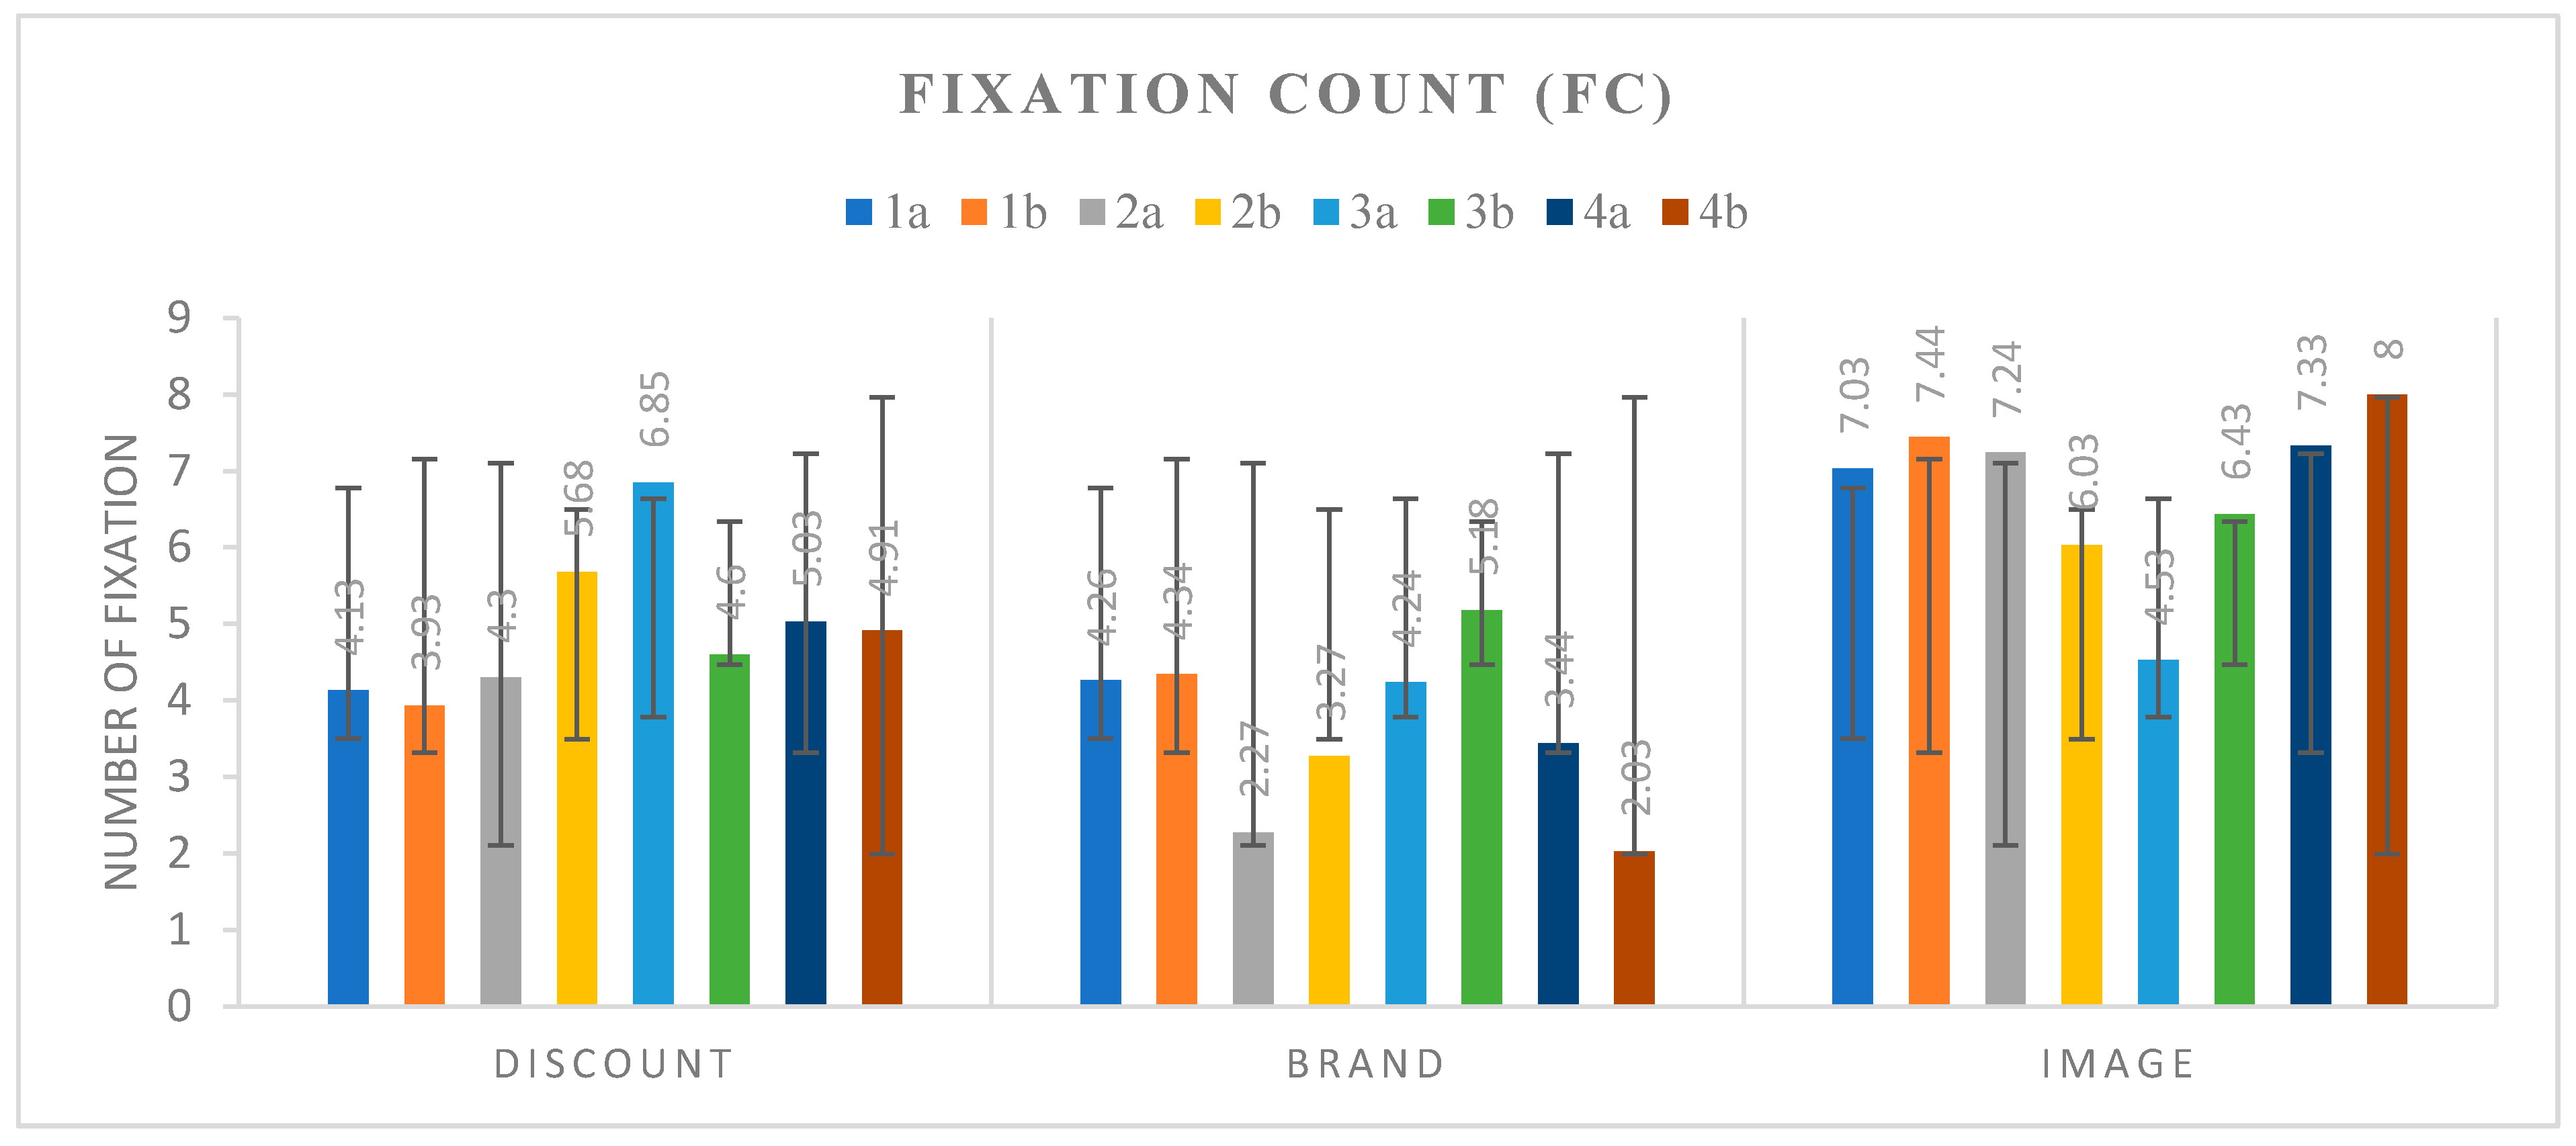
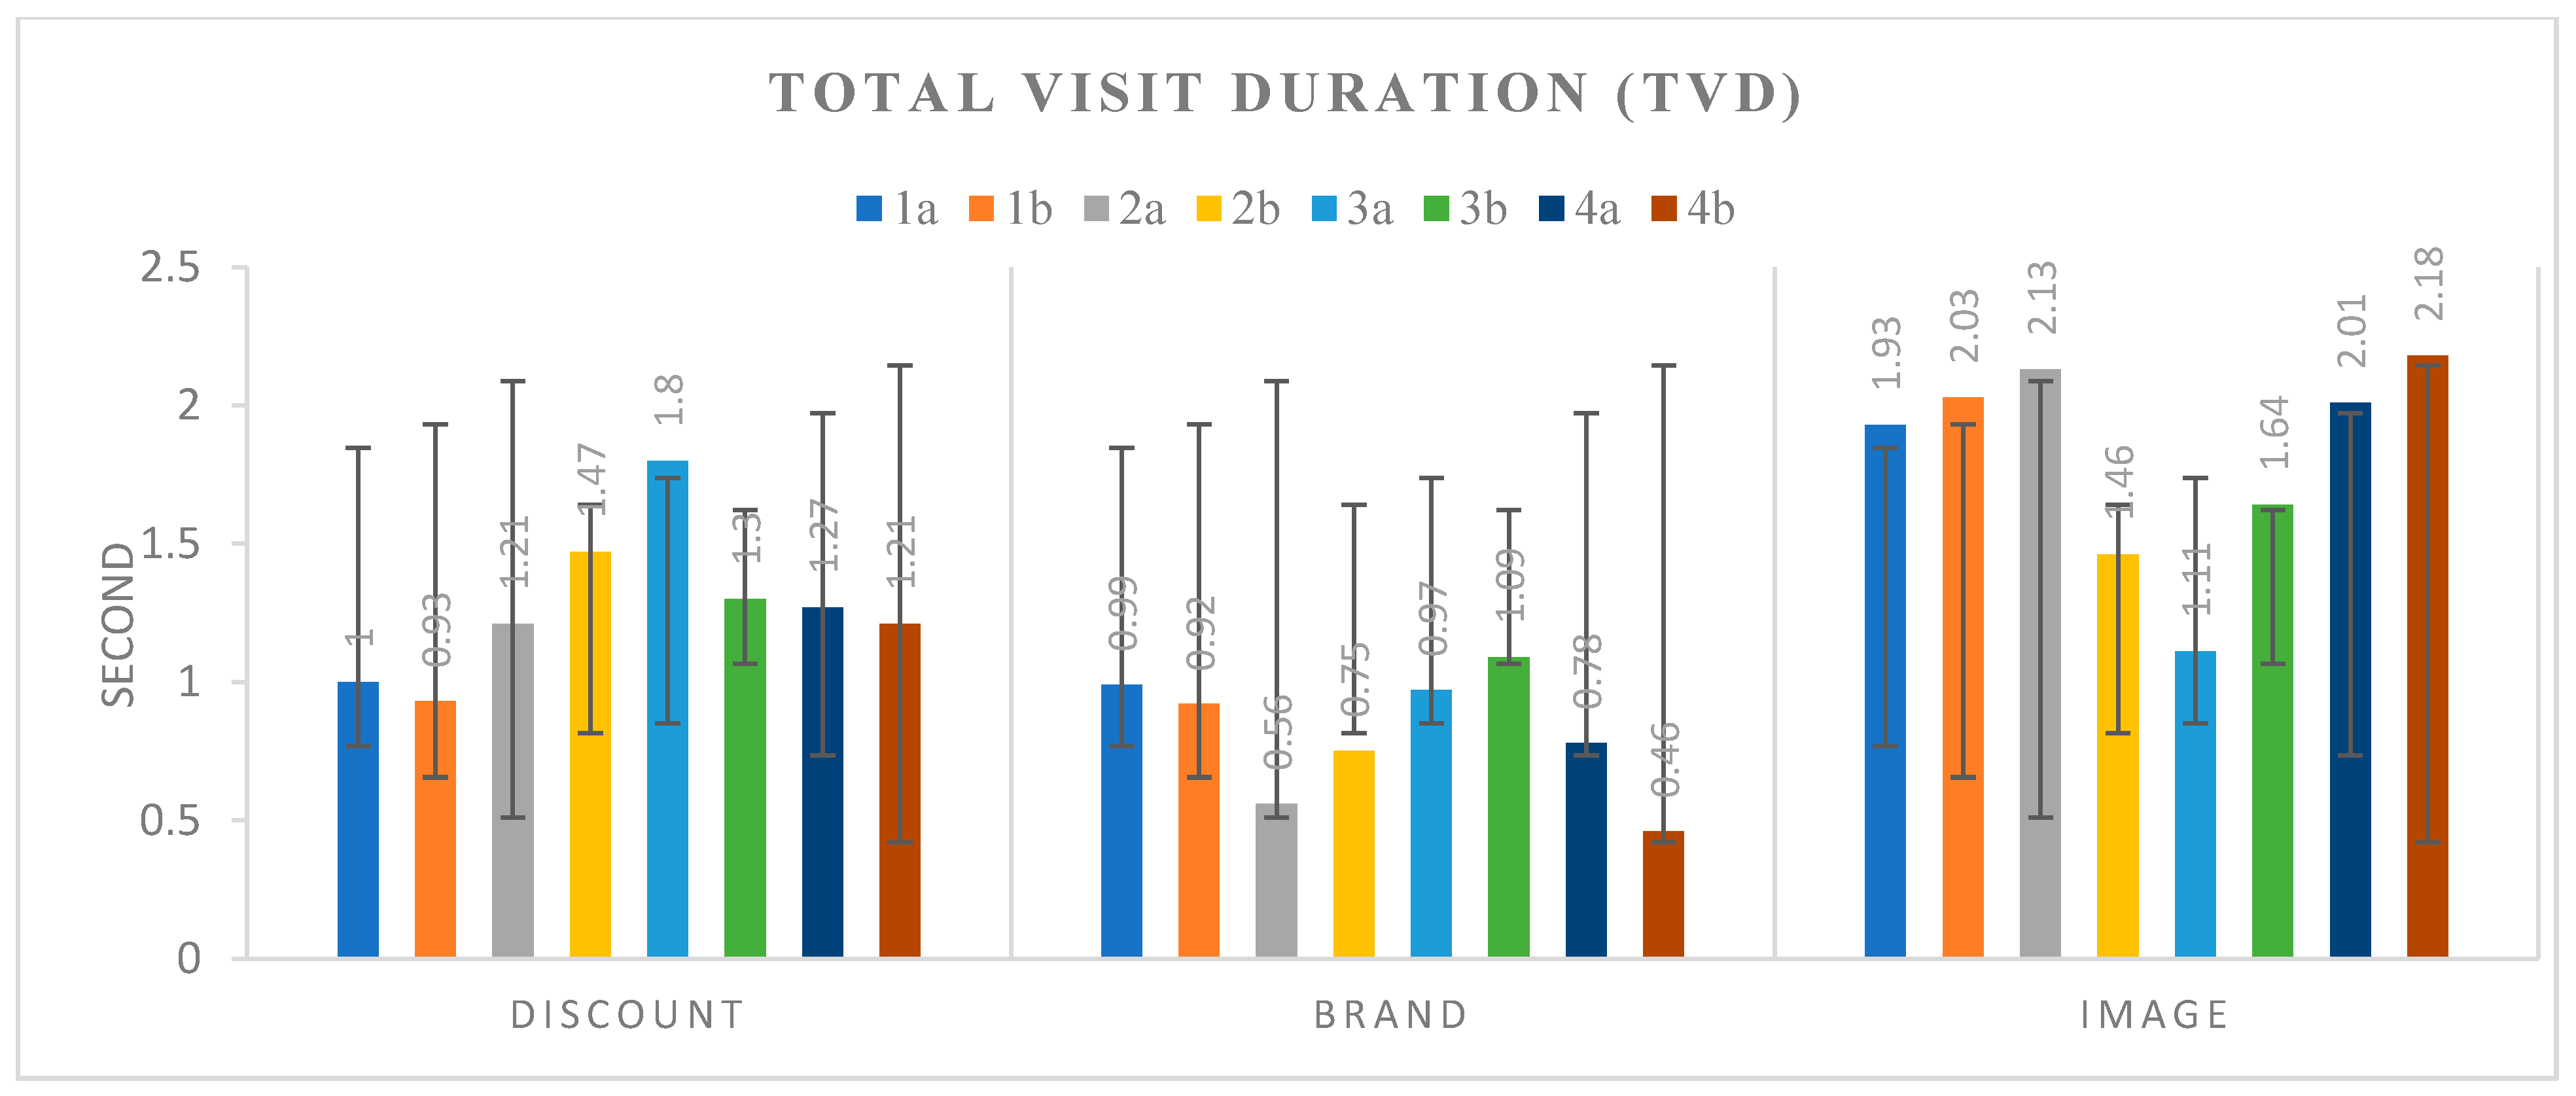
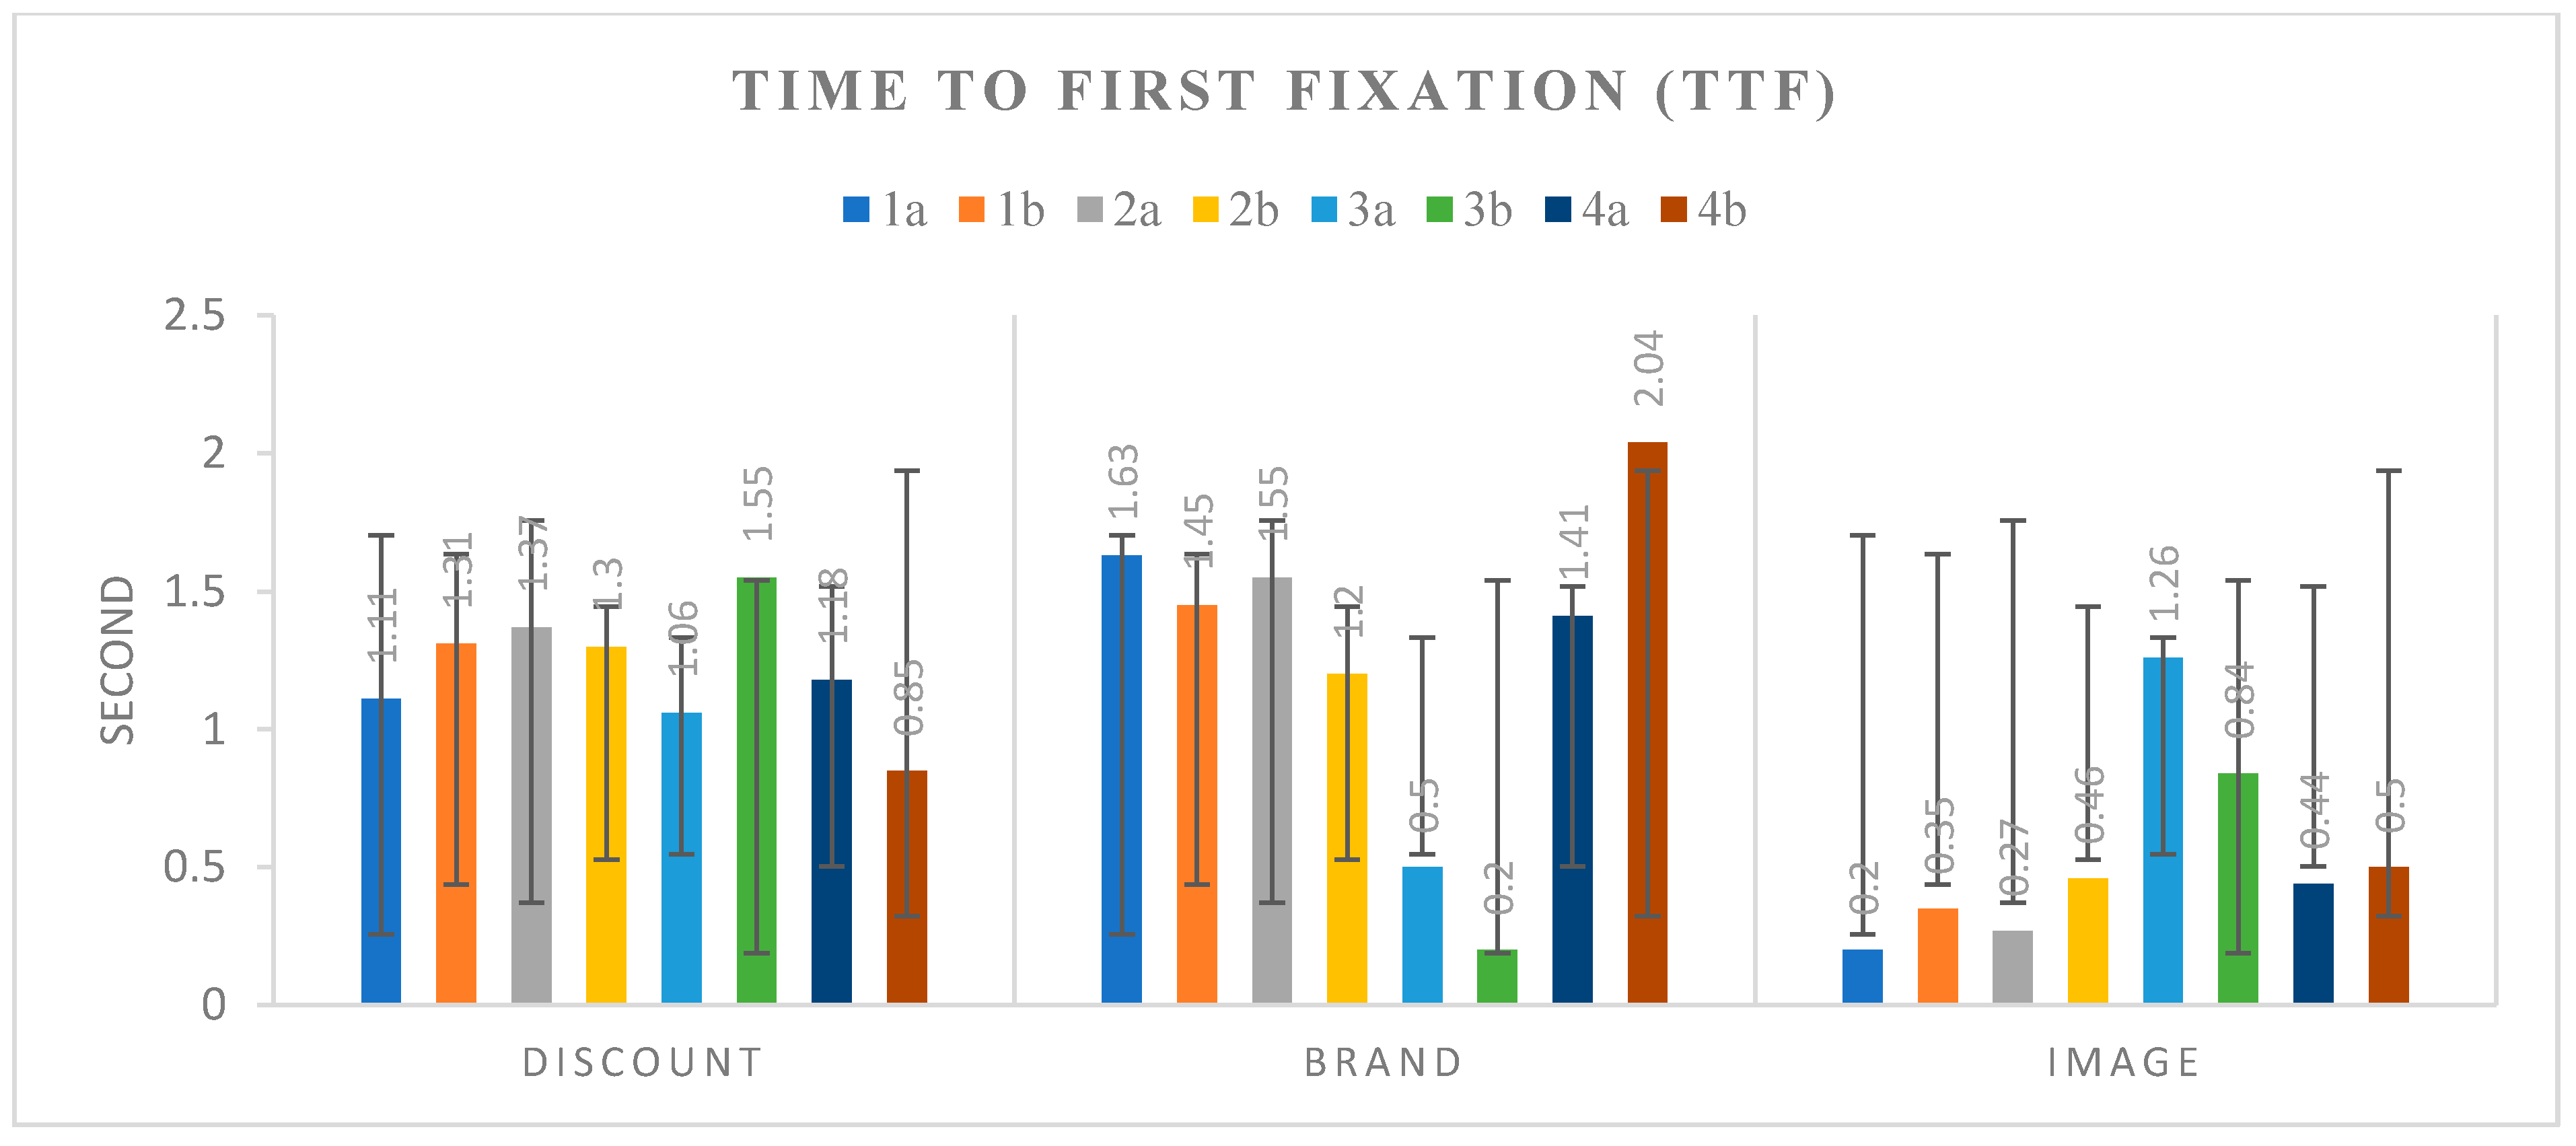
3.5. Eye-Tracking Measures and Data Analysis

Attention was measured using gaze-related variables, which are based on the eye movement data of the previously-defined areas of interest (AOIs). In all research areas, AOIs are used to associate eye movement measures to parts of the stimulus presented, and they are defined separately in order to determine the most relevant parts of the stimuli [72]. In this study, the AOIs were identified at the experiment design phase. The Tobii Studio Software enables researchers to define the AOIs in order to use these areas for the analysis. The AOIs were the small sections and geometric areas of a banner that correspond to the specific content; as an example, the identified AOIs for banner 2b are illustrated in Figure 1. In order to analyze the eye movements, AOIs were defined for each banner ad before the experiments. The defined AOIs were as follows: ‘brand’, ‘discount’, and ‘image’. The participants’ scan-path during the banner ad viewing was tracked through fixation points and saccadic movements. In eye-tracking studies, fixation refers to when a participant’ eye pauses on a specific AOI for more than a certain amount of time.
In order to evaluate the attention participants paid to each AOI, we used three eye movement variables, namely, fixation count (FC), time to first fixation (TTF) and total visit duration (TVD), which are the most common eye-tracking indices used in visual behavior observations [73]. FC is the number of fixations on a specific AOI. The higher the FC of an AOI is, the more attractive it is to the viewer. TTF is the time from the start of the display of a stimulus until the participant fixates on the AOI for the first time. If the TTF of an AOI is short, it suggests that this region is very eye-catching. TVD is the duration of all of the visits within a specific AOI, and a longer TVD on a particular AOI indicates a greater amount of attention for that area.
The data of the corresponding eye movement indices were generated using Tobii Studio Software. The data were pre-processed for analysis, and then a statistical analysis was performed using the Statistical Package for the Social Sciences (SPSS) for Windows software package (version 22; IBM Corporation, New York, NY, USA). In order to evaluate the influence of banner ads on the visual attention paid to banner elements, a series of repeated measure analyses of variance (RM-ANOVA, for the within-subjects factor) tests were conducted on the all of the participants’ eye movement data for each of the three content elements. Similarly, in order to analyze the influence of brand familiarity on the visual attention paid to the different AOIs, two separate RM-ANOVAs with within-subjects factors were also performed on the participants who were already familiar with the brand, and on those who were unfamiliar with the brand. In addition to these, an RM-ANOVA with a between-subjects factor was employed in order to evaluate the effects of gender on the attention paid to the different AOIs of the banners. Given the significant ANOVA results, post hoc tests followed in order to investigate paired comparisons of differences. For the statistical analysis, an alpha level of 0.05 was used. The RM-ANOVA measures are solely prone to the violation of the assumption of sphericity. The violation of sphericity causes an increase in the Type I error rate. Therefore, the assumption of sphericity is very important for RM-ANOVA. All of the post hoc tests were adjusted according to Bonferroni, and only test statistics in which Mauchly’s test indicated that the assumption of sphericity was not violated were reported.

4. The results

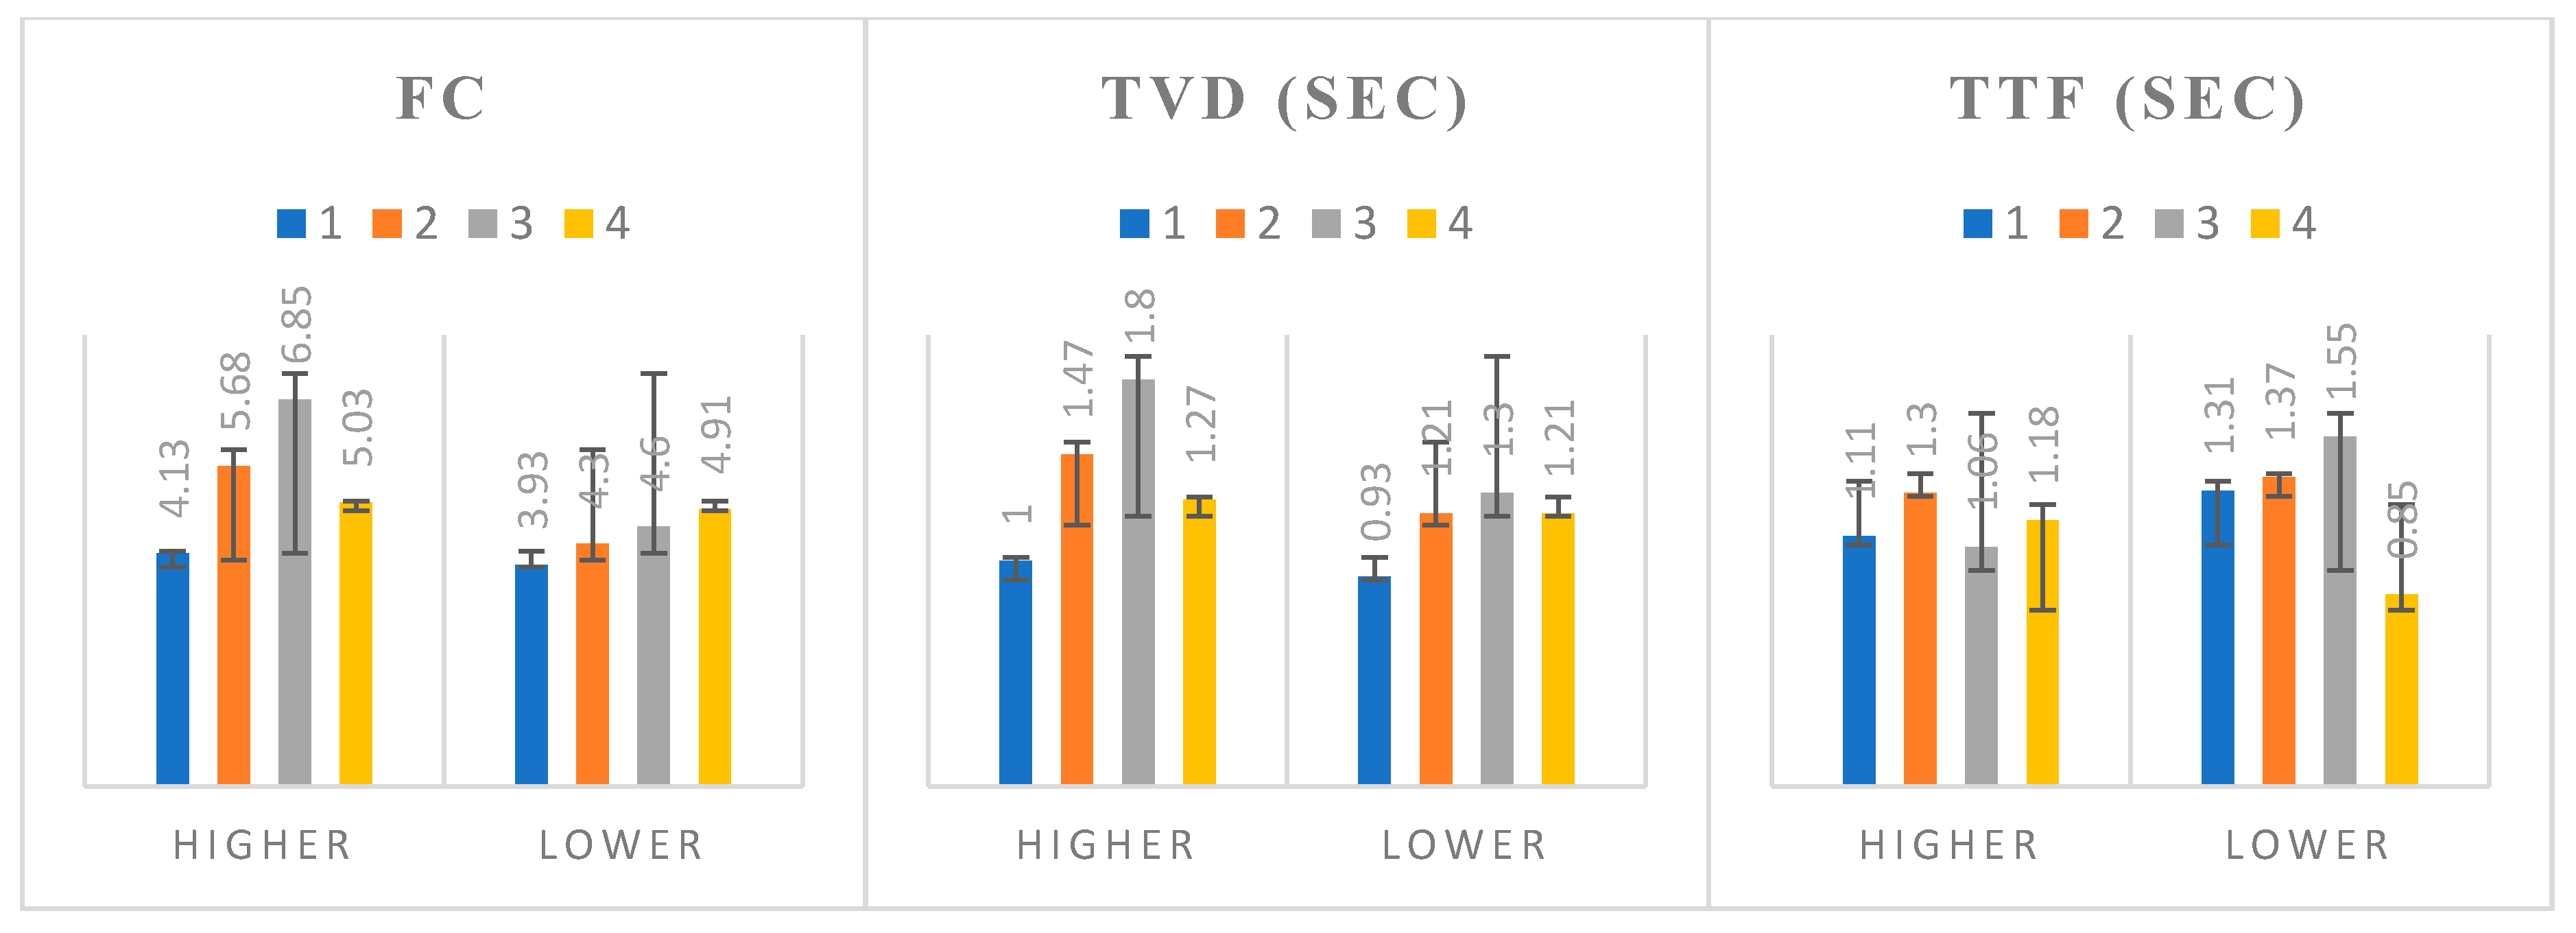
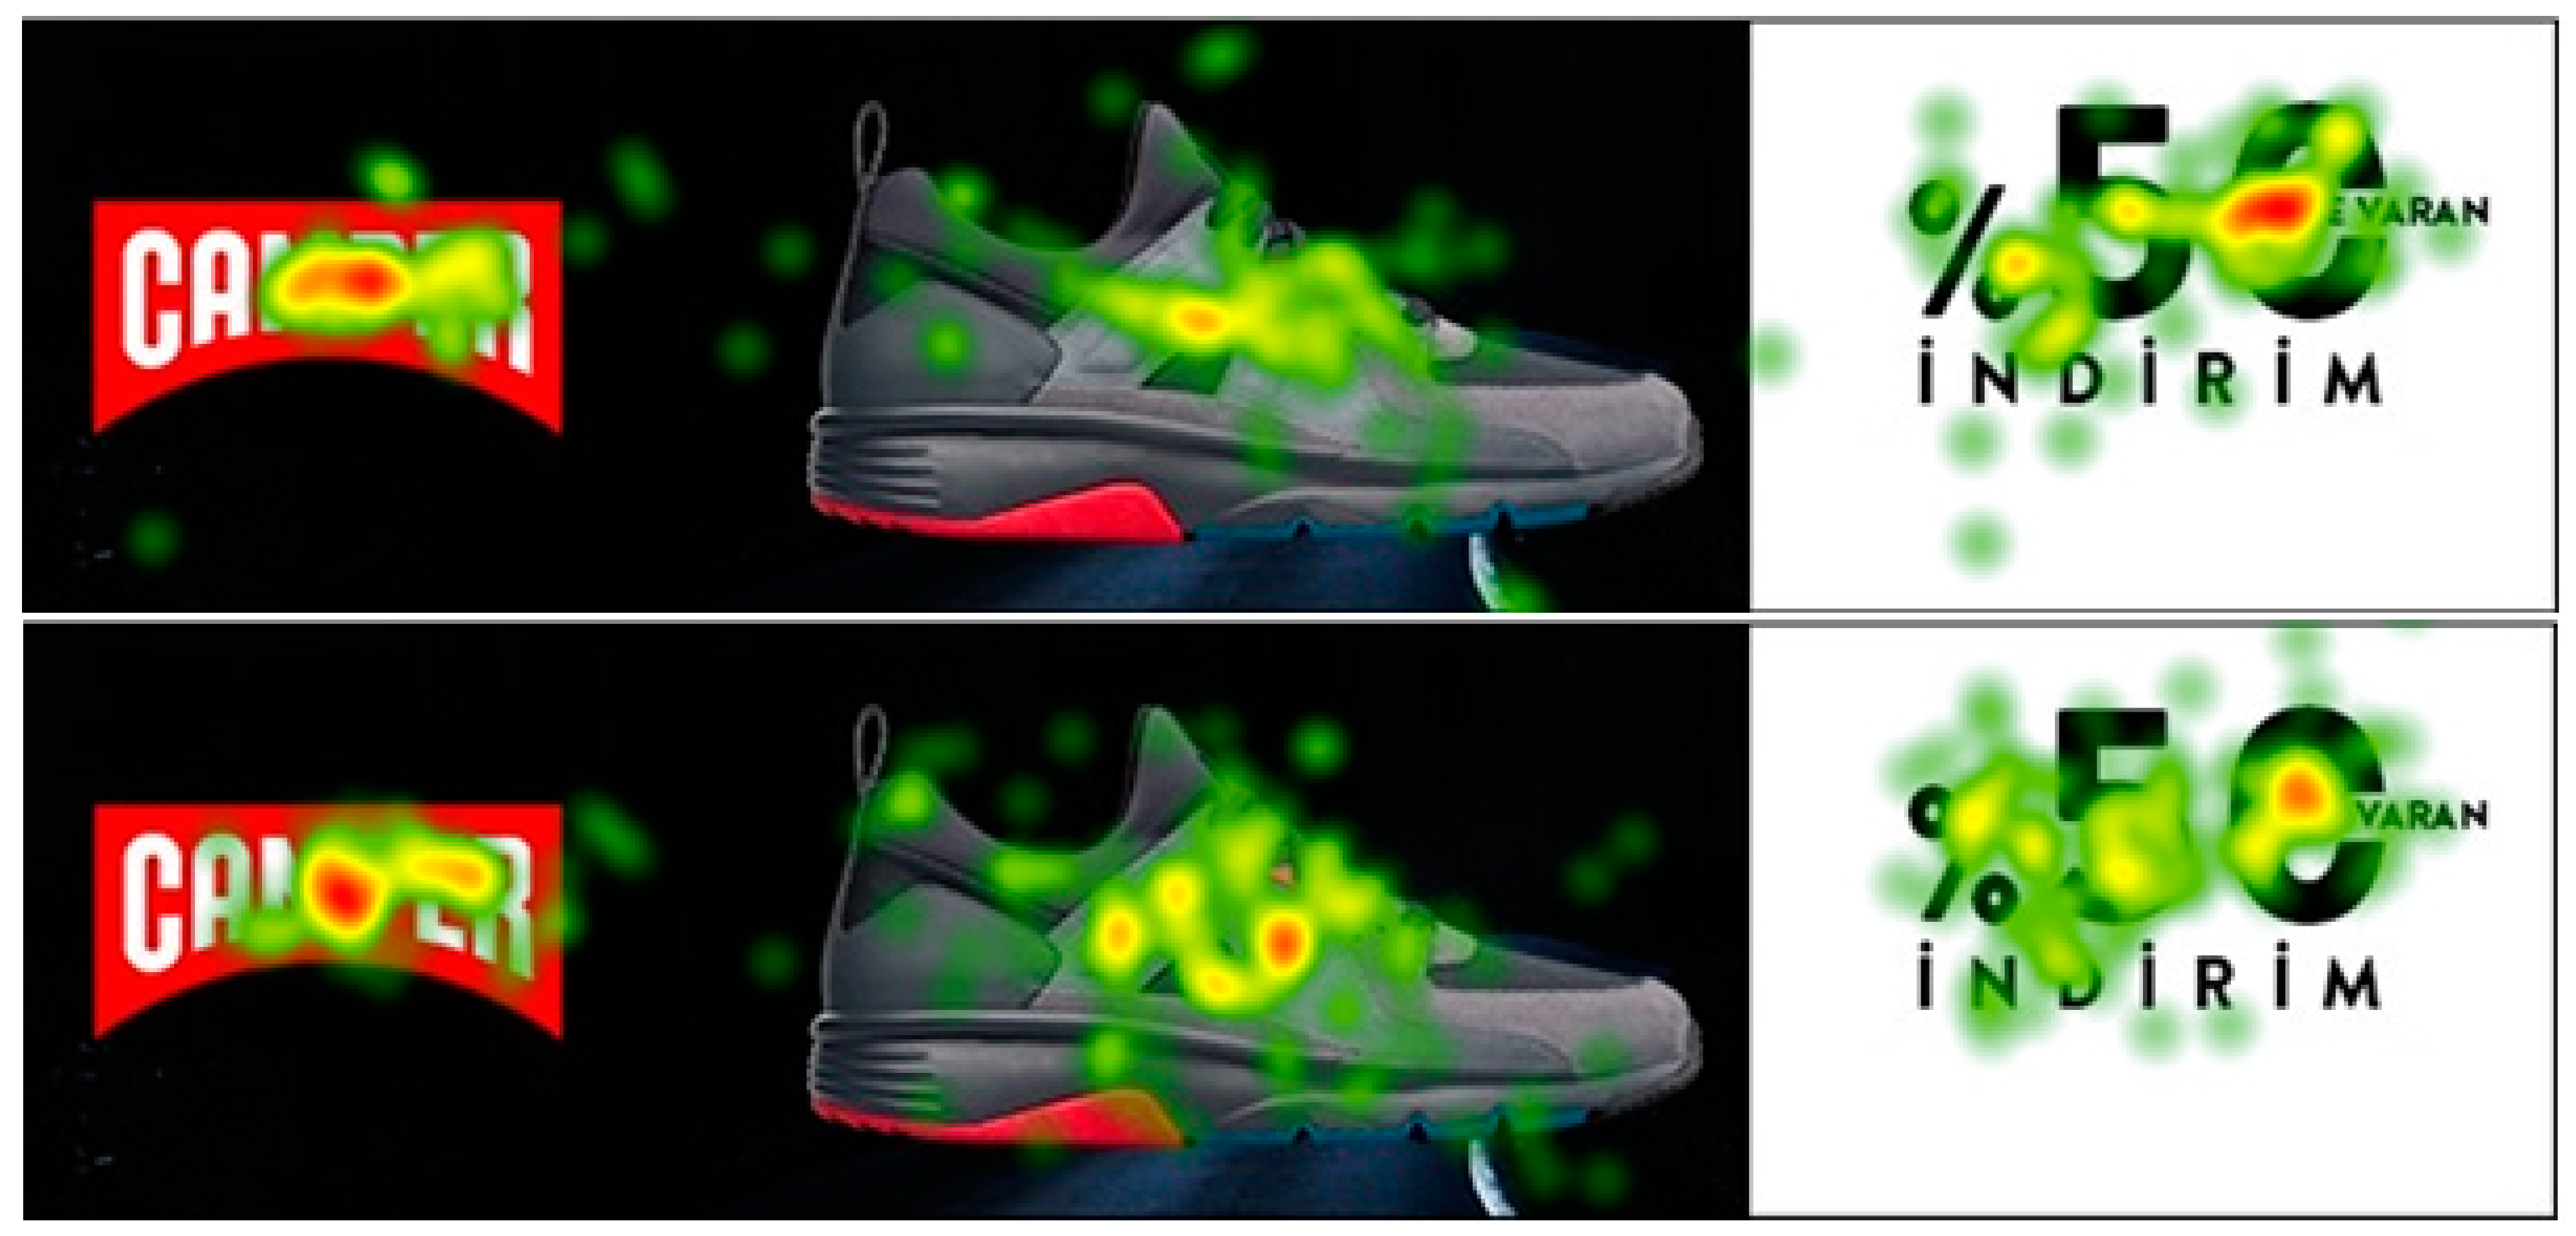
4.1. Influence of Banner Content Elements on Visual Attention

The means of the FC, TVD and TTF measures for each AOI of all eight banners are il-lustrated in Figure 2, Figure 3 and Figure 4. Figure 2 and Figure 3 show that the image was the area that had the highest fixation count and visit duration, while the brand was the AOI that had the lowest fixation count and visit duration. This indicates that the image was the most attractive area among the three main content elements, whereas the brand was the area that received the least attention in the banner ads. Besides this, the area of the image was fixated on more frequently and for a longer duration in the banners with an object image than it was in those with a model image.
The results of the TTF values of the banners’ AOIs revealed that the brand area of the banners of layout 3 had the lowest TTF values, while the banners of layouts 1, 2 and 4 had the lowest TTF values for the image area. This result suggested that the middle areas of the banners were noticed first, and were therefore more eye-catching. The TTF analysis results also showed that the areas located on the left side were mostly noticed earlier than those on the right side. The Western reading process, which goes from left to right, might be effective in this result.
In order to determine whether the banner types had a significant impact on the attention captured by each AOI, RM-ANOVAs were performed on the eye-tracking data for each of the three defined AOIs. The results of the RM-ANOVAs of which the related assumptions were confirmed, and the post hoc tests reflecting a significant difference are given in the column of post-hoc comparisons in Table 2. The results revealed significant differences across the eight banners for all three banner content elements, namely discount information, image, and brand. As indicated in the table, concerning the FC and TVD measures, there was a significant effect of banner type on the visual attention paid to the discount information (F (7,175) = 6.995, p < 0.001), F (7,175) = 6.497, p < 0.001)) and image (F (7,182) = 5.798, p < 0.001), F (7,182) = 8.233, p < 0.001)) areas, respectively. Besides this, regarding the TTF measure, the results showed that there was a significant effect of the banner type on the visual attention paid to the brand area (F (7, 119) = 10.244, p < 0.001)).
The post hoc tests analyzing both FC and TVD revealed that the discount area in banners 2b (MFC = 5.68, SDFC = 2.64, MTVD = 1.47, SDTVD = 0.87) and 3a (MFC = 6.85, SDFC = 2.95, MTVD = 1.80, SDTVD = 1.06) received significantly more attention than those in banners 1a (MFC = 4.13, SDFC = 2.34, MTVD = 1.00, SDTVD = 0.58) and 1b (MFC = 3.93, SDFC = 1.90, MTVD = 0.93, SDTVD = 0.52). The post hoc test results regarding TVD also showed that the discount area in banner 3a (MTVD = 1.80, SDTVD = 1.06) attracted significantly more attention compared to the discount area in banner 2a (MTVD = 1.21, SDTVD = 0.84).
The results from the post hoc tests analyzing both FC and TVD indicated that the image area in banners 1a (MFC = 7.03, SDFC = 3.13, MTVD = 1.93, SDTVD = 0.92), 1b (MFC = 7.44, SDFC = 3.19, MTVD = 2.03, SDTVD = 1.05), 2a (MFC = 7.24, SDFC = 3.17, MTVD = 2.13, SDTVD = 0.95), 4a (MFC = 7.33, SDFC = 2.45, MTVD = 2.01, SDTVD = 0.81) and 4b (MFC = 8.00, SDFC = 3.60, MTVD = 2.18, SDTVD = 1.02) were significantly more attractive than that in banner 3a (MFC = 4.53, SDFC = 2.95, MTVD = 1.11, SDTVD = 0.76). Additionally, the post hoc tests regarding FC showed that the image area in banner 3b (MFC = 6.43, SDFC = 2.84) was significantly more attractive compared to the image area in banner 3a (MFC = 4.53, SDFC = 2.95). The post hoc test results regarding TVD also showed that the image area in banner 4a (MTVD = 2.01, SDTVD = 0.81) received significantly more attention than that in banner 2b (MTVD = 1.46, SDTVD = 0.71), whereas the image area in banner 4b (MTVD = 2.18, SDTVD = 1.02) was significantly more attractive than those in banners 2b (MTVD = 1.46, SDTVD = 0.71), 3a (MTVD = 1.11, SDTVD = 0.76) and 3b (MTVD = 1.64, SDTVD = 0.83).
The post hoc tests analyzing TTF revealed that the brand area in banners 3a (MTTF = 0.50, SDTTF = 0.58) and 3b (MTTF = 0.20, SDTTF = 0.34) were significantly more eye-catching than those in banners 1a (MTTF = 1.63, SDTTF = 0.92), 1b (MTTF = 1.45, SDTTF = 0.73), 2a (MTTF = 1.55, SDTTF = 0.96) and 4b (MTTF = 2.04, SDTTF = 1.24). However, the brand area in banner 3b (MTTF = 0.20, SDTTF = 0.34) was significantly more eye-catching compared to the brand areas in banners 2b (MTTF = 1.20, SDTTF = 0.79) and 4a (MTTF = 1.41, SDTTF = 1.06).

4.2. Effect of Gender, Discount Rate and Brand Familiartiy on Visual Attention to the Content Elements

4.2.1. Gender

A repeated measure ANOVA with a between-subjects factor was employed in order to evaluate the effects of gender on the attention paid to the different AOIs of the banners. For this purpose, nine separate ANOVAs (three eye-tracking measures for 3 AOIs) were conducted with gender. According to the results, there was no significant interaction between gender and the attention paid to three AOIs of the banners concerning the eye-tracking measures, FC, TVD, and TTF.
The FC and TVD, as dependent variables, generated strong main effects for the AOI, discount information, F (7,168) = 7.625, p < 0.05, and F (7,168) = 7.624, p < 0.05, respectively. However, the dependent variable, TTF, did not generate a significant main effect of gender on the attention paid to the discount AOI. For the image AOI, a significant main effect between gender and attention was found for the FC, F (7,175) = 5.896, p < 0.05, effect size d = 0.86, whereas TVD and TTF, as dependent variables, did not generate a strong main effect for that AOI. Moreover, the ANOVA, using TTF as a dependent variable, yielded a strong main effect for the brand AOI, F (7,112) = 7.899, p < 0.05, effect size d = 0.95, while there were no significant main effects of gender and attention to this AOI on the dependent variables FC and TVD.

4.2.2. Discount Rate

Figure 5 plots the means of the FC, TVD and TTF measures for the discount area of all eight banners. In the figure, for each banner, four layouts were grouped as lower or higher according to the discount rates they had. The histograms of the FC and TVD measures revealed that participants fixated on the discount area more frequently and for a longer duration in banners with higher discount rates than in ones with lower discount rates. Furthermore, the histograms of TFF demonstrated that—except for those of layout 4—the discount area was noticed earlier in banners with higher discount rates than in those with lower discount rates. Therefore, these results indicate that discount rate influences the visual attention to the content elements of banner ads, and it might be concluded that, if the discount rate in a banner ad increases, the discount area becomes more attractive and mostly more eye-catching.

4.2.3. Brand Familiarity

Almost all of the participants were familiar with seven of the brands placed in the banners. However, more than half of them (nearly 60%) were not familiar with the brand called ‘Camper’. Therefore, we focused on Camper (banner 2b) in order to analyze the influence of brand familiarity on the visual attention to the content elements of banner ads. Figure 6 presents the heat maps of the banner for the participants who were familiar with the brand and those who were unfamiliar with the brand separately. The heat maps represent the total fixation duration of the subjects on each pixel of the image. In this manner, the lowest value in the heat map is green, the highest value is red, and mid-range values are yellow. For instance, when the color of a pixel is red, the time spent looking at this pixel (area) is greater.
The results of the heat maps show that the participants who were familiar with the brand spent more time looking at discount area than those who were unfamiliar, whereas the participants who were unfamiliar with the brand spent more time viewing the image area than those who were familiar. Besides this, the attention for the brand was nearly the same for both groups. We can conclude that the participants who were familiar with the brand mostly concentrated on the discount area, while the participants who were unfamiliar with the brand mostly paid attention to the image area.
In order to conduct a more in-depth analysis, an RM-ANOVA was employed for the participants who were familiar with the brand and for those who were unfamiliar with the brand separately. The results of which the related assumptions were confirmed and post hoc tests reflecting a significant difference are given in the column of the post-hoc comparisons in Table 3.
The results revealed significant differences across all of the banner content elements for the participants who were familiar with the brand and those who were unfamiliar with the brand. As shown in the table, for the participants who were familiar with the brand, there were significant effects of the banner elements on the visual attention regarding the FC and TVD measures (F (2,24) = 6.321 p < 0.05, F (2,24) = 4.549 p < 0.05, respectively). The banner elements also had significant effects on the visual attention of the participants who were unfamiliar with the brand regarding the FC and TVD measures (F (2,38) = 10.406 p < 0.001, F (2,38) = 7.375 p < 0.05, respectively).
The post hoc tests analyzing FC and TVD revealed that, for the participants who were familiar with the brand, both the discount information (MFC = 6.23, SDFC = 1.83, MTVD = 1.63, SDTVD = 0.77) and image (MFC = 5.62, SDFC = 2.18, MTVD = 1.34, SDTVD = 0.62) areas received significantly more attention compared to the brand area (MFC = 3.15, SDFC = 1.35, MTVD = 0.73, SDTVD = 0.38). Additionally, for the participants who were unfamiliar with the brand, the results of the post hoc tests analyzing the FC and TVD showed that the image area (MFC = 6.55, SDFC = 2.65, MTVD = 1.61, SDTVD = 0.74) attracted significantly greater attention than the discount information area (MFC = 4.85, SDFC = 2.21, MTVD = 1.24, SDTVD = 0.73).

5. Discussion and Conclusions

In today’s world, most companies spend a significant amount of money to access their target audience and convince them to purchase their products. Banner advertisements are used as a major online advertising tool for companies. Despite the large number of online marketing advertisements to which customers are exposed daily, their effectiveness remains debatable. However, the effectiveness of advertising with promotional banners is a critical part of online marketing that companies need to consider carefully. Therefore, it is important to understand the customer’s behavior during the investigation of online banners. This information can be useful to improve the presentation of content elements which attract the customer’s attention. With the help of eye-tracking technology, it is possible to track customer’s eye movements while they are investigating online banners. To the best of our knowledge, there are not many studies conducted on the effect of online banner content elements on visual attention carried out by analyzing eye movements. According to [13], there is a strong association between eye movements and visual attention. With the help of eye movements, it is possible to understand individuals’ overt and covert attention objectively [14]. In this respect, this study aims to understand how customers view the content elements of online banner ads in different layouts, and how these banner components influence customers’ visual attention by analyzing their eye movements. We also attempted to figure out the effects of gender, discount rate and brand familiarity on visual attention to banner elements.
The results of the study show that, according to the means of the FC, TVD and TTF measures for each AOI of the banners, the image area had the highest fixation count and visit duration, whereas the brand had the lowest. Thus, it could be inferred from this result that, while the brand is the area that receives the least attention, the image is the most attractive among the three AOIs. This supports the findings derived from the previous studies [29,31,74] which stated that customers focus on the image more than the text. On the other hand, Huang [70] found that the visual attention to banner ads increases with the presence of model images. In this study, the results demonstrated that participants fixated on the image area more frequently and for a longer period of time when an object image was used in the banner ads, compared to ones with a model image. Moreover, the middle areas of the banners were noticed first according to the TTF analysis results, and following the middle, areas located on the left side were mostly noticed earlier than those on the right-hand side. This might be because of the participants’ Western reading style, which goes from left to right. There is also a possibility that it might be because the image was mostly placed in the middle of the visual stimulus, and participants tend to fixate first in the center of the visual stimulus.
Although some of the previous research on banner advertisements found that male and female consumers differ in their viewing behavior [75,76], the results of this study show that there was no significant interaction between gender and the attention paid to the three content elements (brand, discount information, and image). On the other hand, Chtourou et al. [69] indicated that discount information is not critical in conventional marketing banners, which are not personalized, and rather target all of the market audience. In a more recent study conducted by [70], the results of eye-tracking measures on the visual attention of customers with regard to banner ads reported that banner ads containing discount information are more attractive and eye-catching to customers than those without discount information. Similarly, the results of the present study showed that the discount area of banners with higher discount rates was more attractive and mostly more eye-catching compared to those of banners with lower discount rates. These findings confirm the association between discount information and customers’ visual attention to the banner ads.
The familiarity with a brand is an important factor affecting customers’ visual attention. In a similar vein, this study showed that brand familiarity affected customers’ visual attention to the content elements of banner ads. When customers see an advertisement including a brand which they are familiar with, they may assume that they already know the information presented in the ad; this might affect the amount of attention paid to the ads negatively [77]. Similarly, Pieters and Wedel [37] reported that customers who are familiar with a brand spend noticeably less time on advertisements compared to those who are unfamiliar with a brand. However, the results of this study showed that the participants who were familiar with the brand spent more time looking at the discount area, while spending less time on the brand information and image areas when compared to the participants who were unfamiliar with the brand. This means that the participants who were familiar with the brand paid more attention to the promotion itself than the rest of the AOIs, whereas the participants who were unfamiliar with the brand mostly focused on the image area. These results are consistent with those of Pieters et al. [78], who found that the brand area receives the least attention in marketing banners when customers are familiar with the brand.
The findings from this study contribute to the current literature investigating the design of online banner ads by highlighting the impact of content elements on visual attention with the help of eye-tracking technology. This study also offers important implications for advertising and marketing agencies. For these stakeholders, the findings reported here point to the role of content elements in the online banner ads, including their placement, the image type (object or model) used, and the discount rate. In this manner, they can employ these findings in order to design effective online banner ads that are appealing to customers and, therefore, able to get their attention. On the other hand, the existing literature clearly supports the importance of effective marketing communications on the new product’s launch and success (e.g., [79]). Keller [80] also advocates that marketing strategy can influence a brand’s performance directly. In addition to these, Briggs and Hollis [81] suggest that banner ads can create brand perception and awareness, and foster favorable attitudes towards the advertised products. In line with these studies, our results may also provide marketers and advertisers with valuable insights on how to utilize content elements to influence customers to have a positive attitude towards the advertised products and brands.

6. Limitations and Directions for Future Research

This study has some limitations that need to be discussed and used as input for further research. First, in this study, we examined three content elements of banner ads pertaining to four layouts, and these banner ads were obtained from the online apparel sector. In further studies, banner ads prepared for different markets could be investigated. It would also be interesting to use online banner ads presented in various forms, as well as to investigate the influence of other content elements on visual attention. In addition, it will be beneficial to use more stimuli to improve the statistical power. Moreover, the size of the banner elements, color and font type used in banner ads are factors that were not examined in this study, which might influence visual behavior. In this manner, a possible direction for future research might be to complement this study with such visual salience factors in order to develop a more in-depth analysis. Additionally, the focus of the present study was the investigation of the effect of the content elements of banner ads on visual attention through the measurement of customers’ eye movements and fixation behavior. In the future, this study may be further enhanced in order to evaluate the ultimate effects of the resulting visual attention by employing other measures of advertising effectiveness, such as the click-through rate and saccadic eye movements. Finally, while this study was carried out with an adequate number of participants compared to previous eye-tracking studies, in which small samples are typically widespread [71], it would be worthwhile to replicate it in cultures with right-to-left reading patterns, such as in Arabic countries, in order to ascertain whether the findings are consistent and what can be done to make them more generalizable.

Author Contributions

Conceptualization, S.P.; Data curation, G.G.M.D. and Y.İ.; Formal analysis, Y.İ.; Methodology, G.G.M.D. and Y.İ.; Writing—original draft, S.P., G.G.M.D. and Y.İ.; Writing—review & editing, S.P., G.G.M.D. and Y.İ. All authors have read and agreed to the published version of the manuscript.

Funding

This research received no external funding.

Institutional Review Board Statement

The study was conducted according to the guidelines of the Declaration of Helsinki, and approved by the Ethics Committee of Atilim University (E-59394181-604.01.02-4912, 19.08.2020).

Informed Consent Statement

Informed consent was obtained from all subjects involved in the study.

Conflicts of Interest

The authors declare no conflict of interest.

Appendix A

Figure A1. The banner ads numbered 1a (above) and 1b (below).
Futureinternet 13 00018 g0a1
Figure A2. The banner ads numbered 2a (above) and 2b (below).
Futureinternet 13 00018 g0a2
Figure A3. The banner ads numbered 3a (above) and 3b (below).
Futureinternet 13 00018 g0a3
Figure A4. The banner ads numbered 4a (above) and 4b (below).
Futureinternet 13 00018 g0a4

References

  1. IAB. Iab Internet Advertising Revenue Report 2018 Full Year Results. Available online: https://www.iab.com/wp-content/uploads/2019/05/Full-Year-2018-IAB-Internet-Advertising-Revenue-Report.pdf (accessed on 12 December 2020).
  2. Europe, I. Adex Benchmark 2018. Available online: https://iabeurope.eu/research-thought-leadership/iab-europe-report-adex-benchmark-2018/ (accessed on 12 December 2020).
  3. Statista. Digital Advertising Report 2020. Available online: https://0-www-statista-com.brum.beds.ac.uk/study/42540/digital-advertising-report/ (accessed on 12 December 2020).
  4. Cho, C.-H.; Lee, J.-G.; Tharp, M. Different forced-exposure levels to banner advertisements. J. Advert. Res. 2001, 41, 45–56. [Google Scholar] [CrossRef]
  5. Statista. Digital Advertising Report 2020—Banner Advertising. Available online: https://0-www-statista-com.brum.beds.ac.uk/study/38344/digital-advertising-report-banner-advertising/ (accessed on 12 December 2020).
  6. Saadeghvaziri, F.; Dehdashti, Z.; Askarabad, M.R.K. Web advertising: Assessing beliefs, attitudes, purchase intention and behavioral responses. J. Econ. Adm. Sci. 2013, 29, 99–112. [Google Scholar] [CrossRef]
  7. Yoo, C.Y. Effects beyond click-through: Incidental exposure to web advertising. J. Mark. Commun. 2009, 15, 227–246. [Google Scholar] [CrossRef]
  8. Lee, J.; Ahn, J.-H. Attention to Banner Ads and Their Effectiveness: An Eye-Tracking Approach. Int. J. Electron. Commer. 2012, 17, 119–137. [Google Scholar] [CrossRef] [Green Version]
  9. Thorson, E.; Chi, A.; Leavitt, C. Attention, Memory, Attitude and Conation: A Test of the Advertising Hierarchy. Adv. Consum. Res. 1992, 19, 366–379. [Google Scholar]
  10. Krajbich, I.; Armel, C.; Rangel, A. Visual fixations and the computation and comparison of value in simple choice. Nat. Neurosci. 2010, 13, 1292–1298. [Google Scholar] [CrossRef]
  11. Wedel, M.; Pieters, R. A review of eye tracking research in marketing. Rev. Mark. Res. 2008, 4, 123–147. [Google Scholar] [CrossRef]
  12. Ariely, D.; Berns, G.S. Neuromarketing: The hope and hype of neuroimaging in business. Nat. Rev. Neurosci. 2010, 11, 284–292. [Google Scholar] [CrossRef] [Green Version]
  13. Orquin, J.L.; Mueller Loose, S. Attention and choice: A review on eye movements in decision making. Acta Psychol. 2013, 144, 190–206. [Google Scholar] [CrossRef] [Green Version]
  14. Hoffman, J.E.; Subramaniam, B. The role of visual attention in saccadic eye movements. Percept. Psychophys. 1995, 57, 787–795. [Google Scholar] [CrossRef] [Green Version]
  15. Duchowski, A.T. A breadth-first survey of eye-tracking applications. Behav. Res. Methods Instrum. Comput. 2002, 34, 455–470. [Google Scholar] [CrossRef] [PubMed]
  16. Wedel, M. Attention research in marketing: A review of eye-tracking studies. Handb. Atten. 2013, 569–588. [Google Scholar] [CrossRef]
  17. Ares, G.; Giménez, A.; Bruzzone, F.; Vidal, L.; Antúnez, L.; Maiche, A. Consumer Visual Processing of Food Labels: Results from an Eye-Tracking Study. J. Sens. Stud. 2013, 28, 138–153. [Google Scholar] [CrossRef]
  18. Piqueras-Fiszman, B.; Velasco, C.; Salgado-Montejo, A.; Spence, C. Using combined eye tracking and word association in order to assess novel packaging solutions: A case study involving jam jars. Food Qual. Prefer. 2013, 28, 328–338. [Google Scholar] [CrossRef]
  19. Rebollar, R.; Lidón, I.; Martín, J.; Puebla, M. The identification of viewing patterns of chocolate snack packages using eye-tracking techniques. Food Qual. Prefer. 2015, 39, 251–258. [Google Scholar] [CrossRef]
  20. Ho, H.F. The effects of controlling visual attention to handbags for women in online shops: Evidence from eye movements. Comput. Hum. Behav. 2014, 30, 146–152. [Google Scholar] [CrossRef]
  21. Bogomolova, S.; Oppewal, H.; Cohen, J.; Yao, J. How the layout of a unit price label affects eye-movements and product choice: An eye-tracking investigation. J. Bus. Res. 2020, 11, 102–116. [Google Scholar] [CrossRef]
  22. Husić-Mehmedović, M.; Omeragić, I.; Batagelj, Z.; Kolar, T. Seeing is not necessarily liking: Advancing research on package design with eye-tracking. J. Bus. Res. 2017, 80, 145–154. [Google Scholar] [CrossRef]
  23. Wästlund, E.; Shams, P.; Löfgren, M.; Witell, L.; Gustafsson, A. Consumer perception at point of purchase: Evaluating proposed package designs in an eye-tracking lab. J. Bus. Retail Manag. Res. 2010, 5, 42–51. [Google Scholar]
  24. Ju, H.W.; Johnson, K.K.P. Fashion Advertisements and Young Women: Determining Visual Attention Using Eye Tracking. Cloth. Text. Res. J. 2010, 28, 159–173. [Google Scholar] [CrossRef]
  25. Lohse, G.L. Consumer eye movement patterns on yellow pages advertising. J. Advert. 1997, 26, 61–73. [Google Scholar] [CrossRef]
  26. Pieters, R.; Rosbergen, E.; Wedel, M. Visual Attention to Repeated Print Advertising: A Test of Scanpath Theory. J. Mark. Res. 1999, 36, 424–438. [Google Scholar] [CrossRef]
  27. Wedel, M.; Pieters, R. Eye Fixations on Advertisements and Memory for Brands: A Model and Findings. Mark. Sci. 2000, 19, 297–312. [Google Scholar] [CrossRef] [Green Version]
  28. Rayner, K.; Rotello, C.M.; Stewart, A.J.; Keir, J.; Duffy, S.A. Integrating text and pictorial information: Eye movements when looking at print advertisements. J. Exp. Psychol. Appl. 2001, 7, 219–226. [Google Scholar] [CrossRef] [PubMed]
  29. Rayner, K.; Miller, B.; Rotello, C.M. Eye movements when looking at print advertisements: The goal of the viewer matters. Appl. Cogn. Psychol. 2008, 22, 697–707. [Google Scholar] [CrossRef] [Green Version]
  30. Kong, S.; Huang, Z.; Scott, N.; Zhang, Z.; Shen, Z. Web advertisement effectiveness evaluation: Attention and memory. J. Vacat. Mark. 2019, 25, 130–146. [Google Scholar] [CrossRef]
  31. Hernández-Méndez, J.; Muñoz-Leiva, F. What type of online advertising is most effective for eTourism 2.0? An eye tracking study based on the characteristics of tourists. Comput. Hum. Behav. 2015, 50, 618–625. [Google Scholar] [CrossRef]
  32. Li, K.; Huang, G.; Bente, G. The impacts of banner format and animation speed on banner effectiveness: Evidence from eye movements. Comput. Hum. Behav. 2016, 54, 522–530. [Google Scholar] [CrossRef]
  33. Wang, Q.; Xu, Z.; Cui, X.; Wang, L.; Ouyang, C. Does a big Duchenne smile really matter on e-commerce websites? An eye-tracking study in China. Electron. Commer. Res. 2017, 17, 609–626. [Google Scholar] [CrossRef]
  34. Chiu, Y.-P.; Chang, S.-C. Using Eye-Tracking to Measure the Influence of Banner Ads’ Browsing Behavior and Attitude on Host Websites. Contemp. Manag. Res. 2020, 16, 35–54. [Google Scholar] [CrossRef] [Green Version]
  35. Seo, Y.N.; Kim, M.; Lee, D.; Jung, Y. Attention to eSports advertisement: Effects of ad animation and in-game dynamics on viewers’ visual attention. Behav. Inf. Technol. 2018, 37, 1194–1202. [Google Scholar] [CrossRef]
  36. Eurostat Statistics Explained. E-commerce Statistics for Individuals. Available online: http://ec.europa.eu/eurostat/statistics-explained/index.php/E-commerce_statistics_for_individuals (accessed on 12 December 2020).
  37. Pieters, R.; Wedel, M. Attention Capture and Transfer in Advertising: Brand, Pictorial, and Text-Size Effects. J. Mark. 2004, 68, 36–50. [Google Scholar] [CrossRef]
  38. Chiang, I.P.; Lo, S.H.; Wang, L.-H. Customer Engagement Behaviour in Social Media Advertising: Antecedents and Consequences. Contemp. Manag. Res. 2017, 13. [Google Scholar] [CrossRef] [Green Version]
  39. Voorveld, H.A.M.; van Noort, G.; Muntinga, D.G.; Bronner, F. Engagement with Social Media and Social Media Advertising: The Differentiating Role of Platform Type. J. Advert. 2018, 47, 38–54. [Google Scholar] [CrossRef] [Green Version]
  40. Chiu, Y.P. Do social and competitive advergames affect brand attitude in Asia? Int. J. Electron. Commer. Stud. 2019, 10, 23–41. [Google Scholar] [CrossRef]
  41. Hsu, C.L.; Chang, K.C.; Kuo, N.T.; Cheng, Y.S. The mediating effect of flow experience on social shopping behavior. Inf. Dev. 2017, 33, 243–256. [Google Scholar] [CrossRef]
  42. Kang, M.Y. Advertising allocation and impact of advertising on event ticket sales: Which product, where, and when. Int. J. Mark. Res. 2019, 62, 483–498. [Google Scholar] [CrossRef]
  43. Cho, C.-H. The effectiveness of banner advertisements: Involvement and click-through. J. Mass Commun. Q. 2003, 80, 623–645. [Google Scholar] [CrossRef]
  44. Hamborg, K.C.; Bruns, M.; Ollermann, F.; Kaspar, K. The effect of banner animation on fixation behavior and recall performance in search tasks. Comput. Hum. Behav. 2012, 28, 576–582. [Google Scholar] [CrossRef]
  45. Calisir, F.; Karaali, D. The impacts of banner location, banner content and navigation style on banner recognition. Comput. Hum. Behav. 2008, 24, 535–543. [Google Scholar] [CrossRef]
  46. Kuisma, J.; Simola, J.; Uusitalo, L.; Öörni, A. The Effects of Animation and Format on the Perception and Memory of Online Advertising. J. Interact. Mark. 2010, 24, 269–282. [Google Scholar] [CrossRef]
  47. Lee, J.; Ahn, J.H.; Park, B. The effect of repetition in Internet banner ads and the moderating role of animation. Comput. Hum. Behav. 2015, 46, 202–209. [Google Scholar] [CrossRef]
  48. Resnick, M.; Albert, W. The Impact of Advertising Location and User Task on the Emergence of Banner Ad Blindness: An Eye-Tracking Study. Int. J. Hum. Comput. Interact. 2014, 30, 206–219. [Google Scholar] [CrossRef]
  49. Brajnik, G.; Gabrielli, S. A review of online advertising effects on the user experience. Int. J. Hum. Comput. Interact. 2010, 26, 971–997. [Google Scholar] [CrossRef] [Green Version]
  50. Drèze, X.; Hussherr, F. Internet advertising: Is anybody watching? J. Interact. Mark. 2003, 17, 8–23. [Google Scholar] [CrossRef] [Green Version]
  51. Sigel, A.; Braun, G.; Sena, M. The Impact of Banner Ad Styles on Interaction And Click-Through Rates. Issues Inf. Syst. 2008, 9, 337–342. [Google Scholar]
  52. Burns, K.S.; Lutz, R.J. The function of format: Consumer responses to six on-line advertising formats. J. Advert. 2006, 35, 53–63. [Google Scholar] [CrossRef]
  53. Goodrich, K. What’s up? exploring upper and lower visual field advertising effects. J. Advert. Res. 2010, 50, 91–106. [Google Scholar] [CrossRef]
  54. Bayles, M.E. Designing Online Banner Advertisements: Should We Animate? In Proceedings of the Proceedings of the SIGCHI Conference on Human Factors in Computing Systems, Minneapolis, MN, USA, 20–25 April 2002; pp. 363–366. [Google Scholar]
  55. Baltas, G. Determinants of internet advertising effectiveness: An empirical study. Int. J. Mark. Res. 2003, 45, 505–513. [Google Scholar] [CrossRef]
  56. Yoo, C.Y.; Kim, K.; Stout, P.A. Assessing the Effects of Animation in Online Banner Advertising. J. Interact. Advert. 2004, 4, 49–60. [Google Scholar] [CrossRef]
  57. Yun Yoo, C.; Kim, K. Processing of animation in online banner advertising: The roles of cognitive and emotional responses. J. Interact. Mark. 2005, 19, 18–34. [Google Scholar] [CrossRef]
  58. Namin, A.; Hamilton, M.L.; Rohm, A.J. Impact of message design on banner advertising involvement and effectiveness: An empirical investigation. J. Mark. Commun. 2020, 26, 115–129. [Google Scholar] [CrossRef]
  59. Liu, W.; Liang, X.; Liu, F. The Effect of Webpage Complexity and Banner Animation on Banner Effectiveness in a Free Browsing Task. Int. J. Hum. Comput. Interact. 2018, 35, 1192–1202. [Google Scholar] [CrossRef]
  60. Simola, J.; Kuisma, J.; Öörni, A.; Uusitalo, L.; Hyönä, J. The Impact of Salient Advertisements on Reading and Attention on Web Pages. J. Exp. Psychol. Appl. 2011, 17, 174–190. [Google Scholar] [CrossRef] [PubMed] [Green Version]
  61. Li, H.; Bukovac, J.L. Cognitive impact of banner ad characteristics: An experimental study. J. Mass Commun. Quaterly 1999, 76, 341–353. [Google Scholar] [CrossRef]
  62. Ahn, E.; Edwards, S.M. Does size really matter? Brand attitude versus click-through in response to banner ads. In Proceedings of the Conference-American Academy of Advertising; American Academy of Advertising: Pullman, WA, USA, 1999; pp. 8–9. [Google Scholar]
  63. Goodrich, K. Anarchy of effects? Exploring attention to online advertising and multiple outcomes. Psychol. Mark. 2011. [Google Scholar] [CrossRef]
  64. Flores, W.; Chen, J.C.V.; Ross, W.H. The effect of variations in banner ad, type of product, website context, and language of advertising on Internet users’ attitudes. Comput. Hum. Behav. 2014, 31, 37–47. [Google Scholar] [CrossRef]
  65. Sajjacholapunt, P.; Ball, L.J. The influence of banner advertisements on attention and memory: Human faces with averted gaze can enhance advertising effectiveness. Front. Psychol. 2014, 5, 1–16. [Google Scholar] [CrossRef] [Green Version]
  66. Palcu, J.; Sudkamp, J.; Florack, A. Judgments at gaze value: Gaze cuing in banner advertisements, its effect on attention allocation and product judgments. Front. Psychol. 2017, 8, 1–13. [Google Scholar] [CrossRef] [Green Version]
  67. Chandon, J.L.; Chtourou, M.S.; Fortin, D.R. Effects of configuration and exposure levels on responses to web advertisements. J. Advert. Res. 2003, 43, 217–227. [Google Scholar] [CrossRef]
  68. Robinson, H.R.; Wysocka, A.; Hand, C. Internet advertising effectiveness: The effect of design on click-through rates for banner ads. Int. J. Advert. 2007, 26, 527–541. [Google Scholar] [CrossRef]
  69. Chtourou, M.S.; Chandon, J.L.; Zollinger, M. Effect of price information and promotion on click-through rates for internet banners. J. Euromark. 2002, 11, 23–40. [Google Scholar] [CrossRef]
  70. Huang, Y.T. The female gaze: Content composition and slot position in personalized banner ads, and how they influence visual attention in online shoppers. Comput. Hum. Behav. 2018, 82, 1–15. [Google Scholar] [CrossRef]
  71. Wedel, M.; Pieters, R. Eye Tracking for Visual Marketing. Found. Trends Mark. 2008, 1, 231–320. [Google Scholar] [CrossRef] [Green Version]
  72. Hessels, R.S.; Kemner, C.; van den Boomen, C.; Hooge, I.T.C. The area-of-interest problem in eyetracking research: A noise-robust solution for face and sparse stimuli. Behav. Res. Methods 2016, 48, 1694–1712. [Google Scholar] [CrossRef] [Green Version]
  73. Calvo, M.G.; Lang, P.J. Gaze patterns when looking at emotional pictures: Motivationally biased attention. Motiv. Emot. 2004, 28, 221–243. [Google Scholar] [CrossRef]
  74. Riegelsberger, J.; Sasse, M.A.; McCarthy, J.D. Eye-catcher or blind spot? In Proceedings of the IFIP Advances in Information and Communication Technology; Springer: Boston, MA, USA, 2003; Volume 105, pp. 383–398. [Google Scholar]
  75. Richard, M.-O.; Chebat, J.-C.; Yang, Z.; Putrevu, S. A proposed model of online consumer behavior: Assessing the role of gender. J. Bus. Res. 2010, 63, 926–934. [Google Scholar] [CrossRef]
  76. Shaouf, A.; Lü, K.; Li, X. The effect of web advertising visual design on online purchase intention: An examination across gender. Comput. Hum. Behav. 2016, 60, 622–634. [Google Scholar] [CrossRef]
  77. Wilson, R.T.; Baack, D.W.; Till, B.D. Creativity, attention and the memory for brands: An outdoor advertising field study. Int. J. Advert. 2015, 34, 232–261. [Google Scholar] [CrossRef]
  78. Pieters, R.; Warlop, L.; Wedel, M. Breaking Through the Clutter: Benefits of Advertisement Originality and Familiarity for Brand Attention and Memory. Manag. Sci. 2002, 48, 765–781. [Google Scholar] [CrossRef] [Green Version]
  79. Cooper, R.G.; Kleinschmidt, E.J. Determinants of Timeliness in Product Development. J. Prod. Innov. Manag. 1994, 11, 381–396. [Google Scholar] [CrossRef]
  80. Keller, K.L. The Brand Report Card. Harv. Bus. Rev. 2000, 147–157. [Google Scholar] [CrossRef] [Green Version]
  81. Briggs, R.; Hollis, N. Advertising on the web: Is there response before click-through? J. Advert. Res. 1997, 37, 33–45. [Google Scholar]
Figure 1. Areas of Interest (AOIs) for banner 2b.
Futureinternet 13 00018 g001
Figure 2. Distribution of the Fixation Count for the banners in the three AOIs.
Futureinternet 13 00018 g002
Figure 3. Distribution of the Total Visit Duration in seconds for the banners in the three AOIs.
Futureinternet 13 00018 g003
Figure 4. Distribution of Time to First Fixation in seconds for the banners in the three AOIs.
Futureinternet 13 00018 g004
Figure 5. Distribution of the FC, TVD, and TTF by layouts in the two promotion groups.
Futureinternet 13 00018 g005
Figure 6. Heat maps for the participants who were familiar (above) and unfamiliar with the brand (below).
Futureinternet 13 00018 g006
Table 1. Layouts and details of the eight banners selected for this study.
BannerImageDiscountBrand
PositionTypePositionRate (%)PositionName
1aMiddleModelLeft80RightArmani
1bMiddleObjectLeft70RightSkechers
2aMiddleModelRight25LeftMavi
2bMiddleObjectRight50LeftCamper
3aLeftModelRight60MiddleNetwork
3bLeftObjectRight40MiddleNB
4aRightModelBottom left70Upper leftTommy
4bRightObjectBottom left50Upper leftNike
Table 2. Test results demonstrating the influence of the banner types on the visual attention.
AOIMeasureFPost-Hoc Comparisons a
DiscountFC6.9951a < 2b, 1a < 3a, 1b < 2b, 1b < 3a, 2a < 3a
TVD6.4971a < 2b, 1a < 3a, 1b < 2b, 1b < 3a
ImageFC5.7983a < 1a, 3a < 1b, 3a < 2a, 3a < 3b, 3a < 4a, 3a < 4b
TVD8.2333a < 1a, 3a < 1b, 3a < 2a, 3a < 4a, 3a < 4b, 2b < 4a, 2b < 4b, 3a < 4b, 3b < 4b
BrandTTF10.2443a < 1a, 3b < 1a, 3a < 1b, 3b < 1b, 3a < 2a, 3b < 2a, 3b < 2b, 3b < 4a, 3a < 4b, 3b < 4b
a < reflects a significant difference. p < 0.001.
Table 3. ANOVA results demonstrating the influence of brand familiarity on visual attention.
FamiliarityMeasureFPost-Hoc Comparisons a
FamiliarFC6.321 *Brand < Discount, Brand < Image
TVD4.549 *Brand < Discount, Brand < Image
UnfamiliarFC10.406 **Brand < Image
TVD7.375 * Brand < Image
a < reflects a significant difference. * p < 0.05; ** p < 0.001.
Publisher’s Note: MDPI stays neutral with regard to jurisdictional claims in published maps and institutional affiliations.

