
Fine-Scale Population Estimation Based on Building Classifications: A Case Study in Wuhan


1
State Key Laboratory of Information Engineering in Surveying, Mapping and Remote Sensing, Wuhan University, Wuhan 430079, China
2
School of Geomatics and Urban Spatial Informatics, Beijing University of Civil Engineering and Architecture, Beijing 102249, China
3
School of Non-Commissioned Officer, Space Engineering University, Beijing 102249, China
*
Authors to whom correspondence should be addressed.
Future Internet 2021, 13(10), 251; https://0-doi-org.brum.beds.ac.uk/10.3390/fi13100251
Submission received: 2 September 2021
/
Revised: 20 September 2021
/
Accepted: 23 September 2021
/
Published: 28 September 2021
(This article belongs to the Section Big Data and Augmented Intelligence)
Abstract
:In the context of rapid urbanization, the refined management of cities is facing higher requirements. In improving urban population management levels and the scientific allocation of resources, fine-scale population data plays an increasingly important role. The current population estimation studies mainly focus on low spatial resolution, such as city-scale and county scale, without considering differences in population distributions within cities. This paper mines and defines the spatial correlations of multi-source data, including urban building data, point of interest (POI) data, census data, and administrative division data. With populations mainly distributed in residential buildings, a population estimation model at a subdistrict scale is established based on building classifications. Composed of spatial information and attribute information, POI data are spaced irregularly. Based on this characteristic, the text classification method, frequency-inverse document frequency (TF-IDF), is applied to obtain functional classifications of buildings. Then we screen out residential buildings, and quantify characteristic variables in subdistricts, including perimeter, area, and total number of floors in residential buildings. To assess the validity of the variables, the random forest method is selected for variable screening and correlation analysis, because this method has clear advantages when dealing with unbalanced data. Under the assumption of linearity, multiple regression analysis is conducted, to obtain a linear model of the number of buildings, their geometric characteristics, and the population in each administrative division. Experiments showed that the urban fine-scale population estimation model established in this study can estimate the population at a subdistrict scale with high accuracy. This method improves the precision and automation of urban population estimation. It allows the accurate estimation of the population at a subdistrict scale, thereby providing important data to support the overall planning of regional energy resource allocation, economic development, social governance, and environmental protection.
1. Introduction
Population growth is one of the five major problems facing the world today [1]. It is also an important strategic problem in China during this century. Population growth is closely related to national economic development, social stability, and living standards. Population data, especially urban population data at the fine-scale, is the basic statistical data related to national economies and people’s livelihoods. It can provide guidance regarding economic development, social governance, and environmental protection [2]. Accurately estimating the population at a subdistrict scale in a city is important for upgrading the urban management level, optimizing the allocation of resources, and accelerating social management [3]. Thus, it is a requirement for fine-scale urban management in the context of rapid urbanization. Population data in China is mostly obtained with statistical methods, so it is scientific and accurate [4]. However, this traditional census approach has the disadvantages of high costs, temporal delay, and insufficient spatial detail [5,6].
Population estimation is a hot topic attracting researchers from different domains, including demography [7], video analysis [8], and geography [9]. Based on the mobility of the population, population estimation is divided into two categories: static population estimation and dynamic population estimation. The core idea of dynamic population estimation is to use human mobility data to estimate the fine-scale dynamic population distribution [10]. Existing data sources used for dynamic population estimation research mainly include mobile phone signaling data, social media big data, subway card data, etc., [11,12,13,14,15]. Considering the dynamic changes of the human population is important when designing traffic assignment plans, evacuation procedures, and shelter locations [16,17]. The static population is the permanent population of a certain area. Different from the variability of dynamic population, static population has certain stability. Static population estimation is helpful to regional energy resource allocation, urban planning, social governance, and environmental protection [18].
Based on the data sources and mathematical methods employed, the methods used for static population estimation can be divided into the following three categories: traditional population prediction methods, areal interpolation, and methods based on statistical models [19]. Traditional population prediction methods include the average growth rate method, dependent coefficient method, and Pierce model. These methods generally establish an estimation formula, by using population data from several consecutive years [20]. This type of method is usually applied over a large research area and the calculation method is relatively simple, and thus it is not suitable to meet the needs of subdistrict-scale population estimation. Using mathematical methods to interpolate census data, areal interpolation converts the population data in the geographic space [21]. This type of method can solve the problem of census data with insufficient spatial resolution to some extent, but it is difficult to improve the time resolution. With the advent of the era of big data and the rise of dynamic data acquisition technology, large volumes of data related to human settlements are generated, such as remote sensing images, the traffic bayonet-corpus, trajectory data, signaling data, and point of interest (POI) data [22]. Population estimation models can be established with statistical methods, by analyzing the mathematical relationships between the population size and statistical variables that might affect populations. Based on Defense Meteorological Satellite Program/Operational Linescan System (DMSP/OLS) night lighting data, lighting indexes, and historical population data were previously employed to predict urban populations [23,24,25,26]. However, light images are affected by problems such as overflow and saturation, and the spatial resolution of the populations is low because of the limited resolution of night lighting data [27]. Tomás et al. used IKONOS-2 orthophotos, light detection, and lidar data to determine the volume of single-family houses and high-rise residences in order to estimate urban populations [28]. Given the close relationship between the residential population and number of residential units, geometric attributes such as the number, area, and volume of residential buildings can be employed to establish a population estimation model [29]. The relationships between the attributes of an urban fine-scale population estimation model can be assessed, by analyzing the population, residential building area, and layer number [30,31].
Population estimation is a complex scientific task that involves human geography, demography, resource and environmental science, and other disciplines. Various achievements in the field of population estimation have provided the foundations for urban planning and resource planning. However, the following problems still affect the current popular estimation methods. (1) There has been a lack of fine-scale urban population distribution research and most population estimation research focused on the city and county scales at a low spatial resolution, thereby failing to meet the needs of fine urban population analysis. (2) In building-based estimation, the building classifications based on land classification data and manual interpretations lack efficiency and the costs are high. (3) The importance of the variables employed was not analyzed and models were built directly using the variables selected for population estimation research.
This paper aims at fine-scale population estimation in the context of rapid population movement. In summary, the following contributions are made in this paper.
- (1)
- This paper proposes a building classification method with POI data. The text classification method, frequency-inverse document frequency (TF-IDF), is applied to calculate the POI data to obtain functional classifications of buildings (Section 2).
- (2)
- Based on the results of building classification, this paper establishes a population estimation model at a subdistrict scale. Firstly, this paper makes statistics on the relevant characteristics of buildings. Secondly, by calculating the importance of each building feature, a certain number of variables are selected, in turn, to establish a fine-scale population estimation model (Section 2).
- (3)
- This paper conducts experiments on the real dataset in Wuhan. The experimental results show that our approach achieves a lower error rate, which provides a new solution to the estimation for fine-scale populations (Section 3).
2. Materials and Methods
2.1. Study Site and Data Source
2.1.1. Study Area
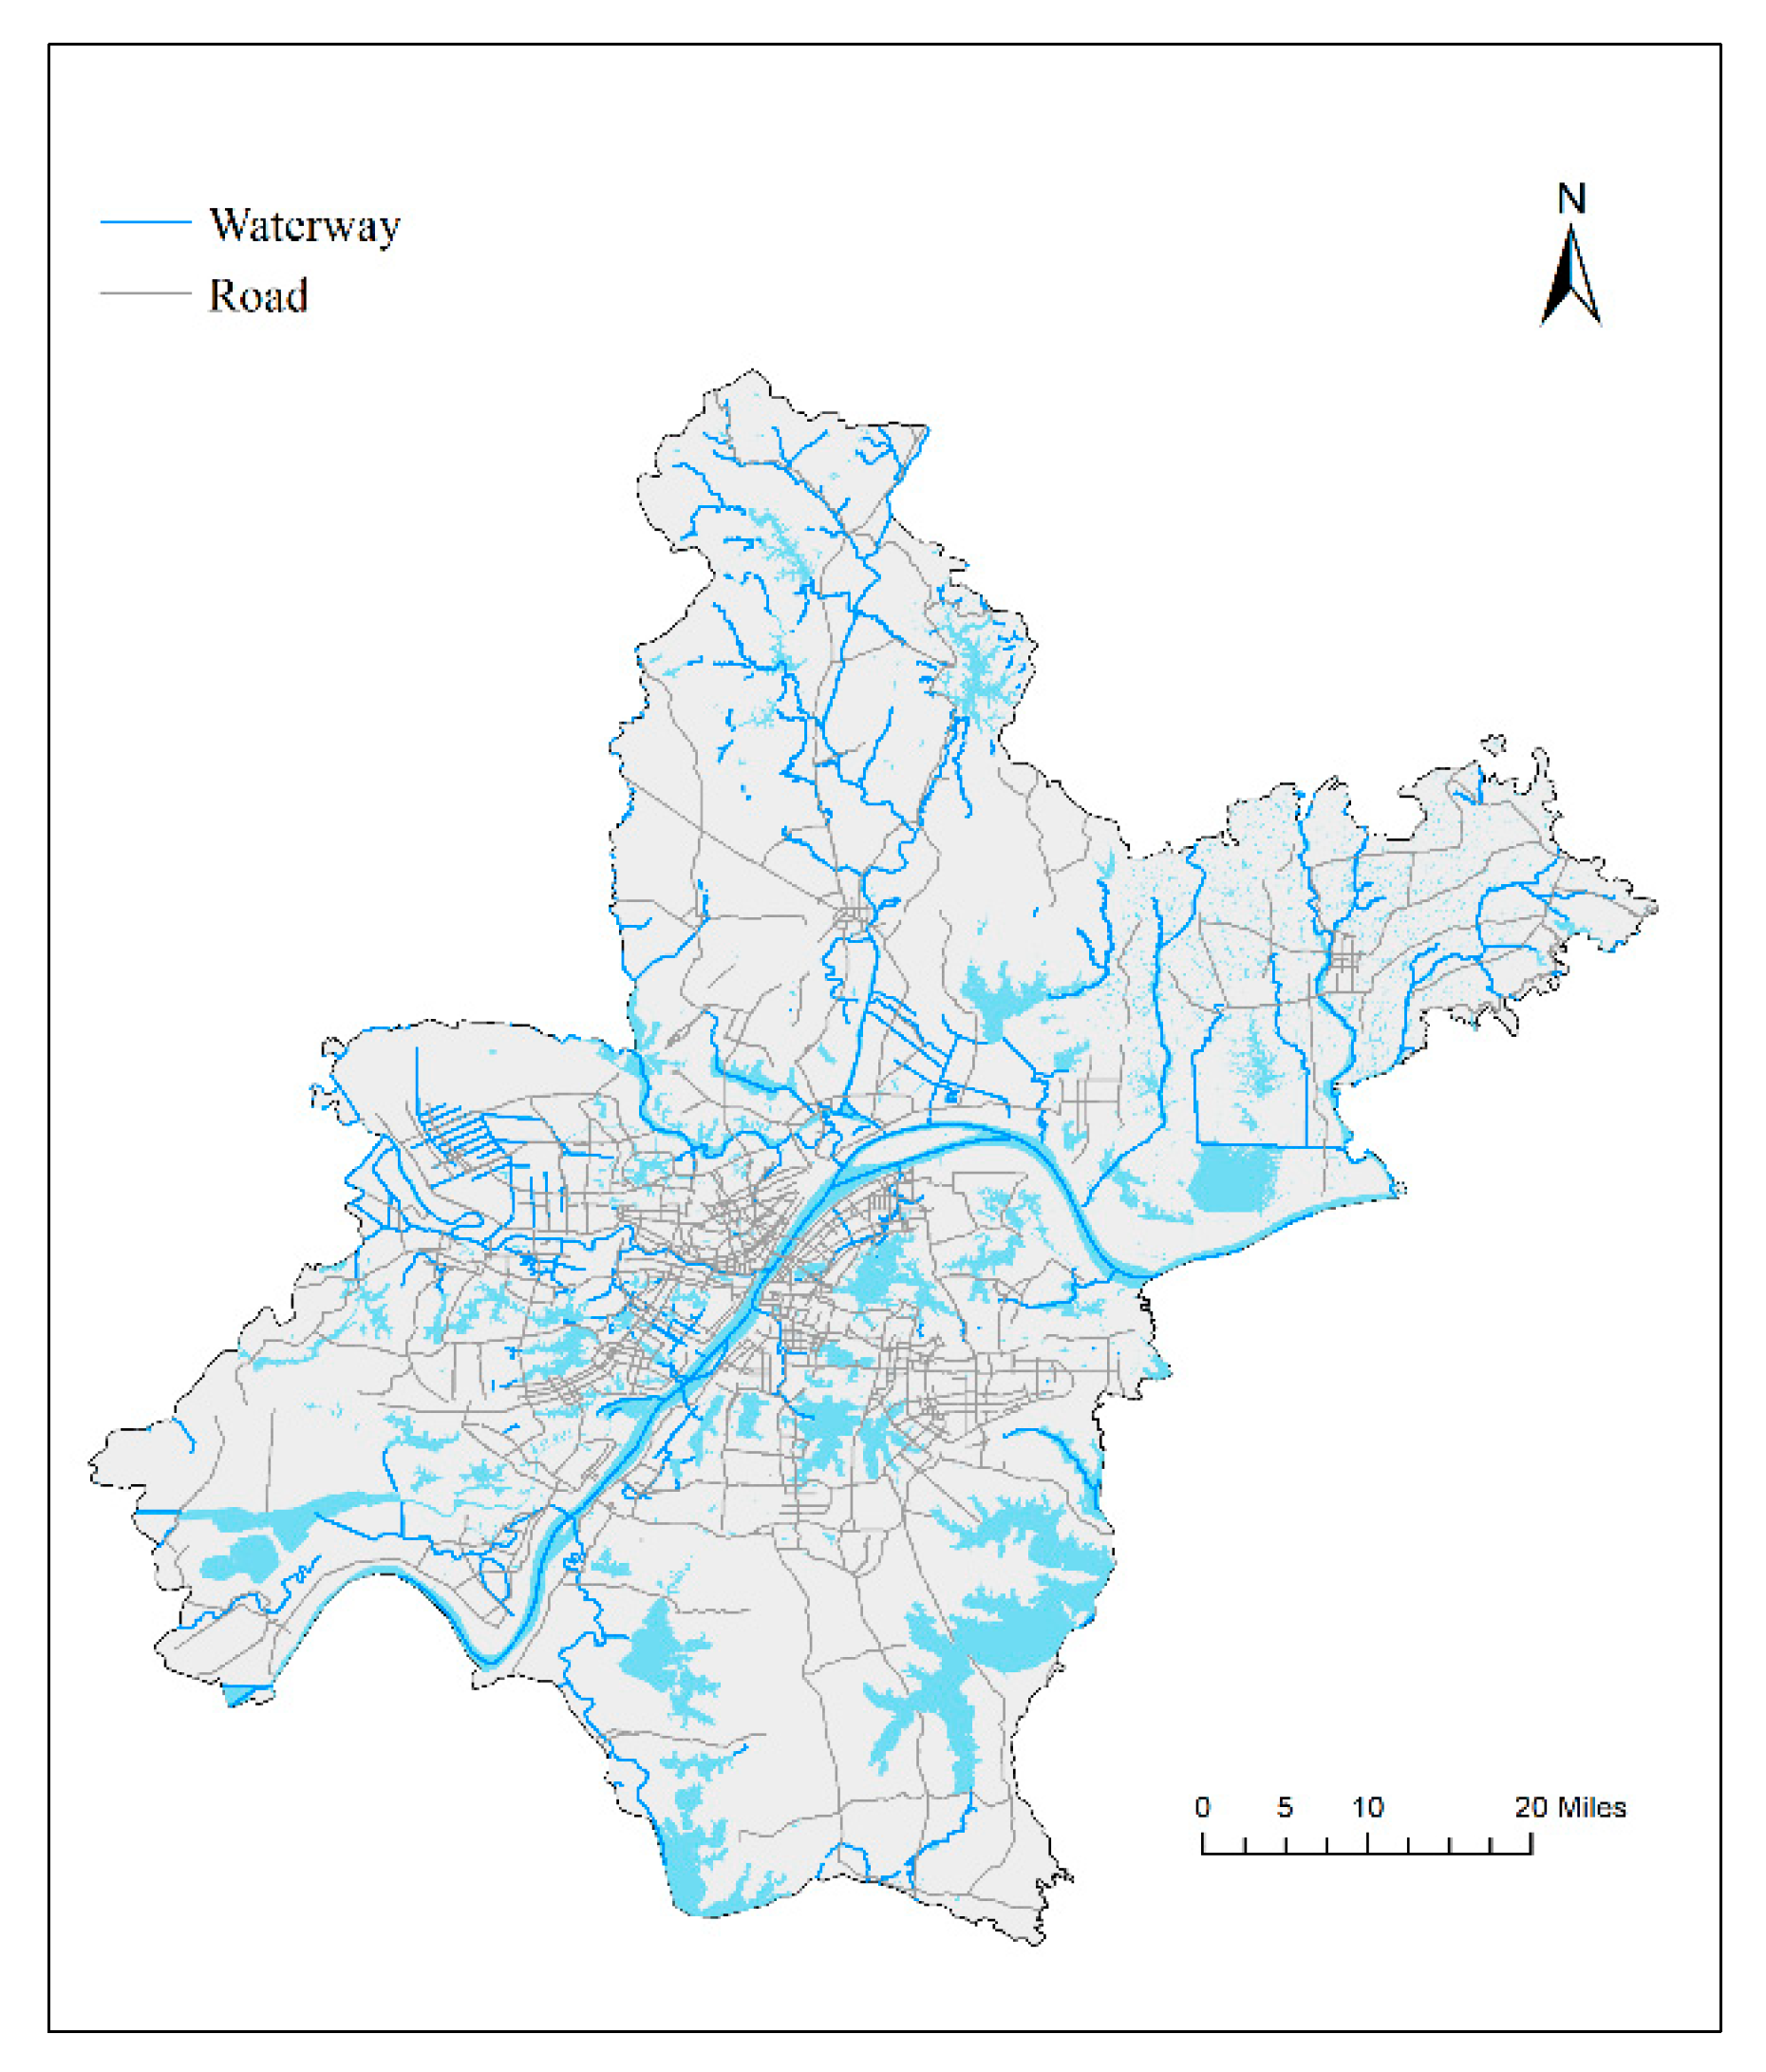
Wuhan is one of the most highly developed megacities in China. Located between 113°41′–115°05′ E and 29°58′–31°22′ N (Figure 1), Wuhan is a city in the middle of China. As the capital of Hubei Province, Wuhan is the political, economic, scientific, technological, educational, and cultural center of Hubei Province. Wuhan has 13 municipal districts, 108 subdistrict offices, 21 towns, 15 townships, 1107 communities, and 2033 administrative villages. At the end of 2018, the city’s resident population was 11.081 million, with 8.8373 million registered population and 6.4693 million urban residents. Known as the “thoroughfare of nine provinces”, Wuhan is the largest transportation hub of land, water, and air in inland China and the shipping center in the middle reaches of the Yangtze River. Its high-speed rail network covers more than half of China, and there are 53 direct routes from abroad. It is the only city in Central China that can directly fly to the four continents of the world. These result in the rapid change of Wuhan’s daily population.
2.1.2. Data Source
The data used in this paper include urban building data, POI data, administrative division data, and population census data. Administrative division data and building data are unified in the World Geodetic System 1984, which are obtained from the Open Street Map. Administrative division entities’ properties include entity ID, name, and update time. Building vector data comprise outline data for city buildings, whose attributes include building ID, building floor number, building perimeter, and building area. POI data is obtained from Gaode Map, and its attributes include ID, latitude, longitude, and category. Population census data comes from the Wuhan Municipal Bureau of Statistics (http://tjj.wuhan.gov.cn/tjfw/tjnj accessed on 22 June 2021).
2.2. Classification of Urban Buildings
Urban building classifications are key input variables for demographic and social-economic models [32,33]. Thus, urban building classification plays an important role in map updating, urban modeling, urban growth analysis, and change monitoring [34]. The urban population is mainly distributed in residential buildings. The correlation between the population distribution and non-residential buildings is relatively small, and the number of residential buildings reflects the size of the permanent population. With the advent of the big data era and the rise of dynamic data acquisition technologies, the availability of building data has been increased, which can be used for population estimation at the fine-scale. How to classify urban buildings in a scientific and efficient manner is crucial for obtaining fine-scale population data and improving the level of urban population management.
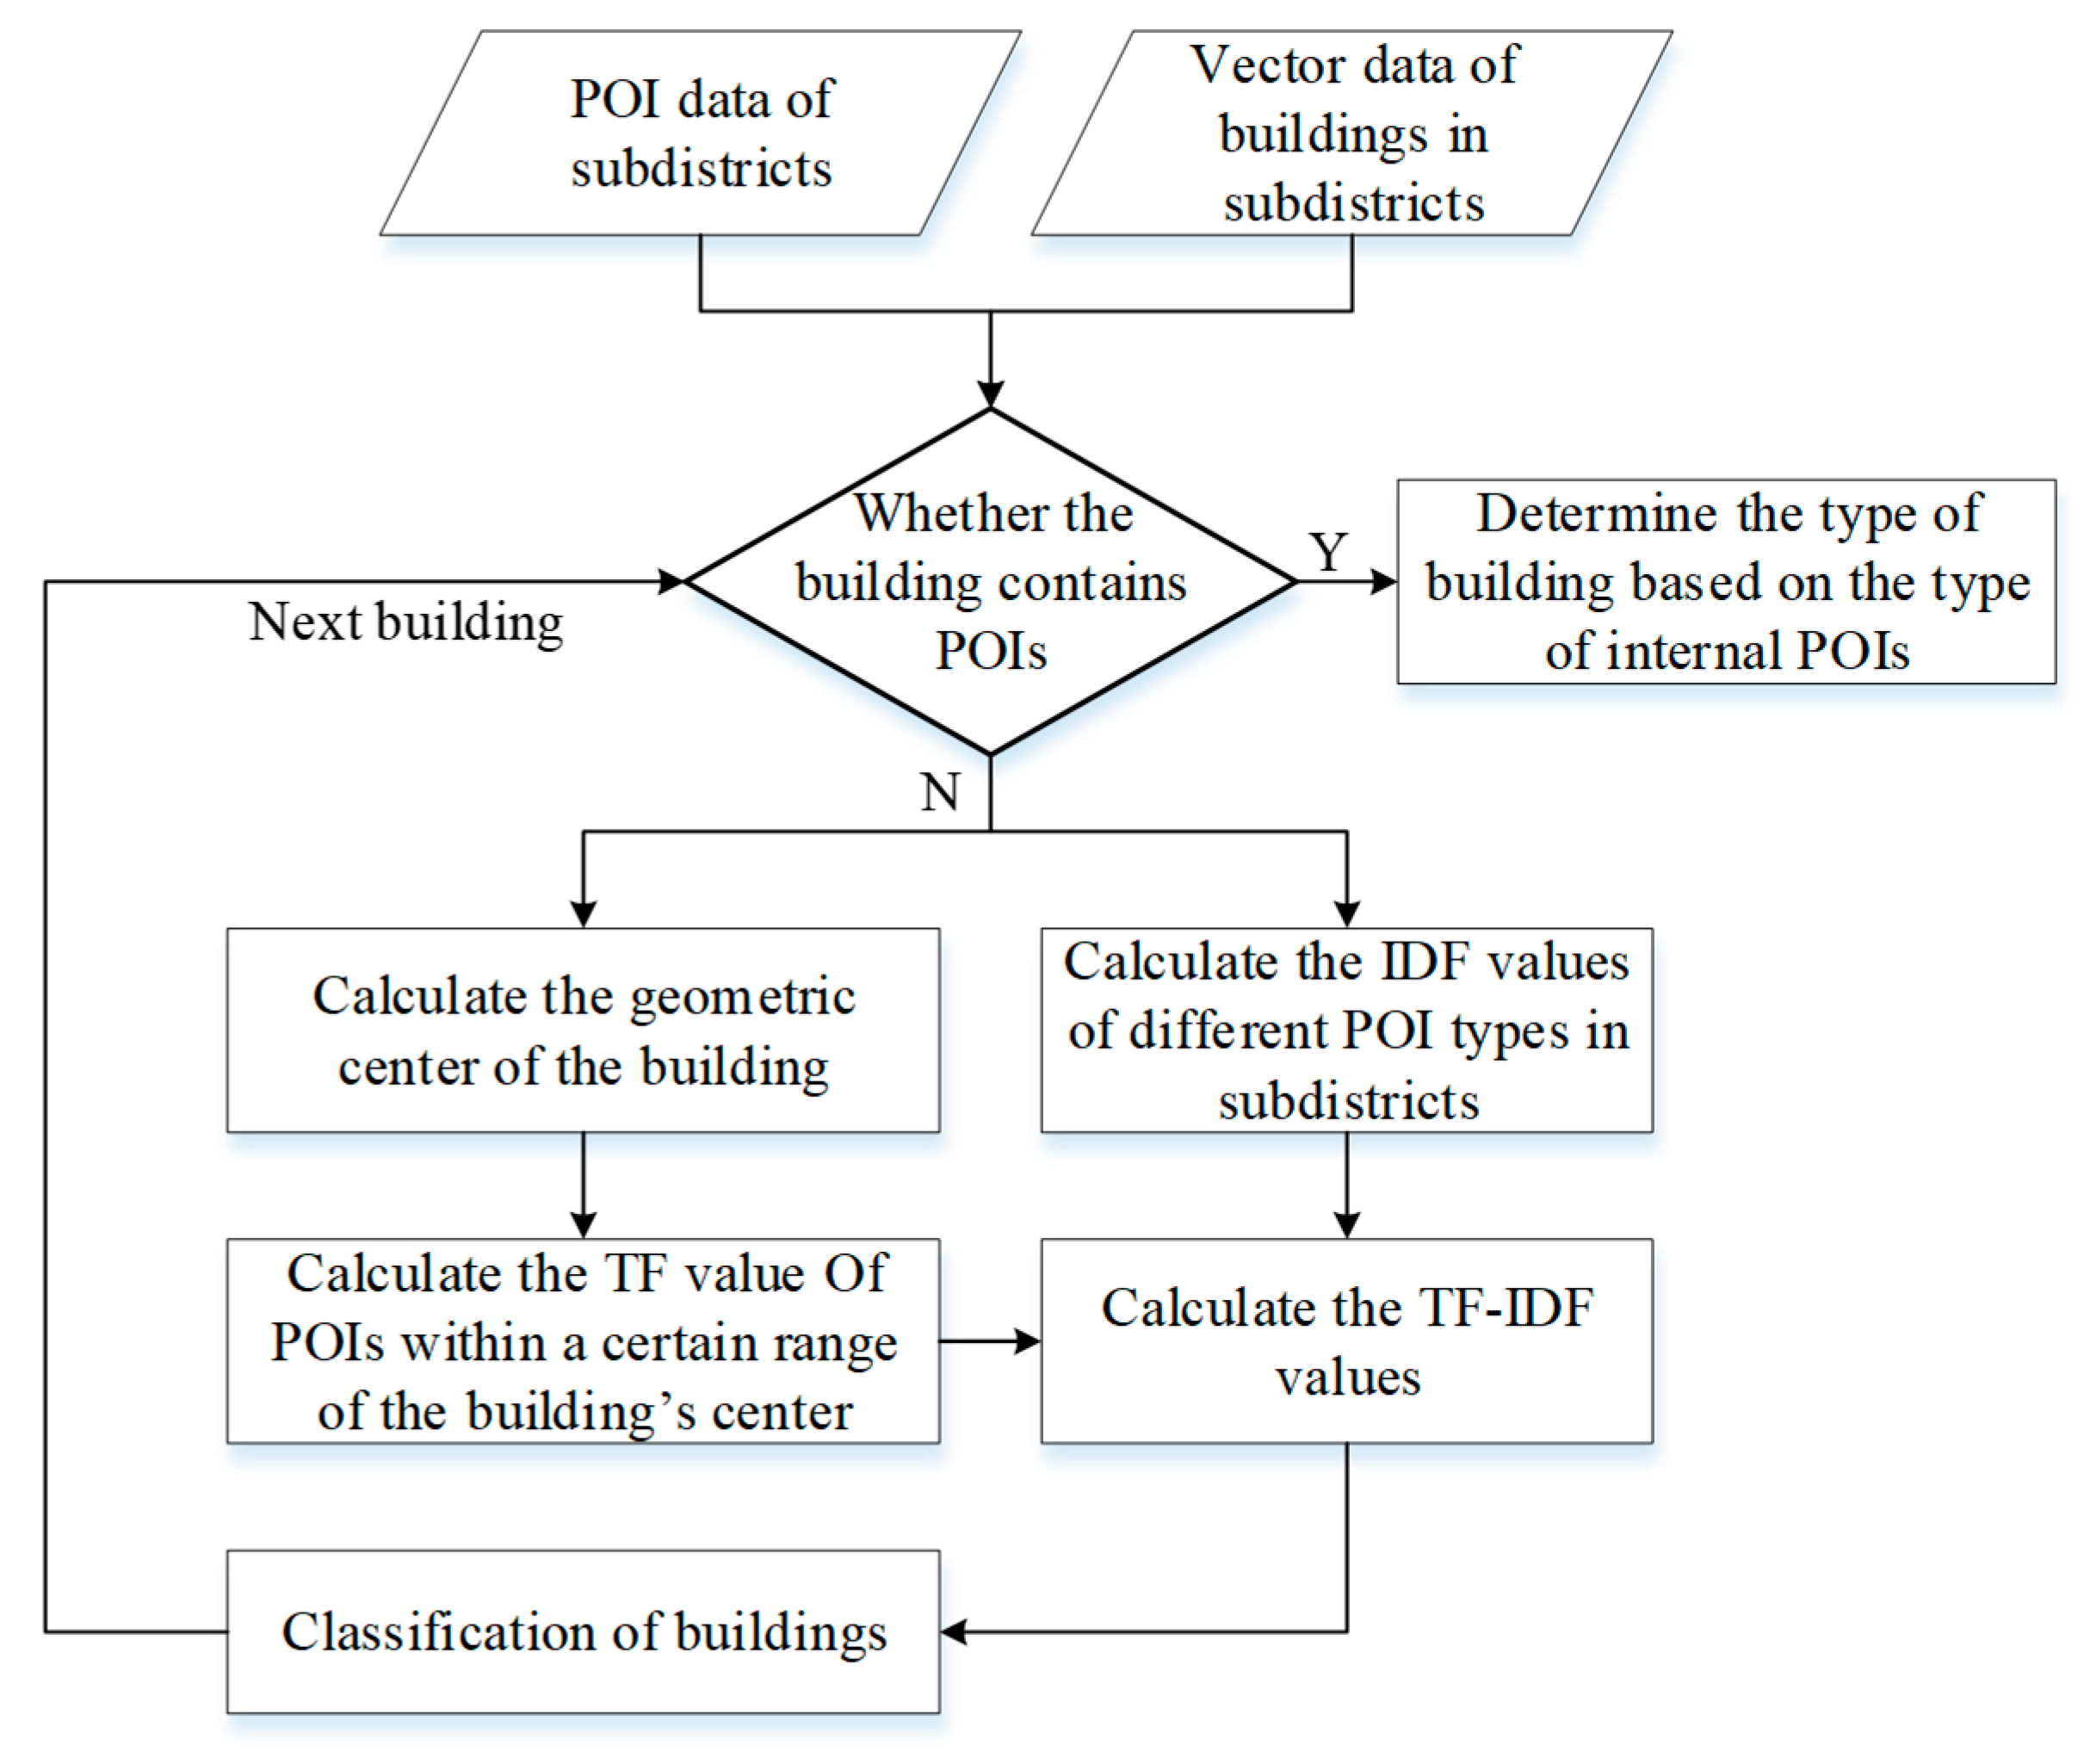
The POIs in cities mainly include physical buildings in cities that are closely related to people’s lives, such as schools, banks, and supermarkets. POI data describes the spatial and attribute information of buildings, so it can be reclassified to identify the types of buildings in a city. Considering the uneven distribution of POI data, this paper obtains functional classifications of buildings based on TF-IDF. This paper predicts the probability of building types based on the frequency statistics for POIs. The TF value indicates the frequency of a POI as a building in a certain area, and the IDF value indicates the inverse frequency of the POI in a subdistrict. The result obtained by multiplying both is the probability that a building belongs to a certain type (Figure 2).
2.2.1. Geometric Relationships and Classification of Space
POI data provides spatial details and the attributes of buildings, which are important for the quantitative identification of building types in cities. According to a previous study [35], over 20 types of POI data are available, and they can be divided into three categories comprising commercial service, public service, and residential building (Table 1).
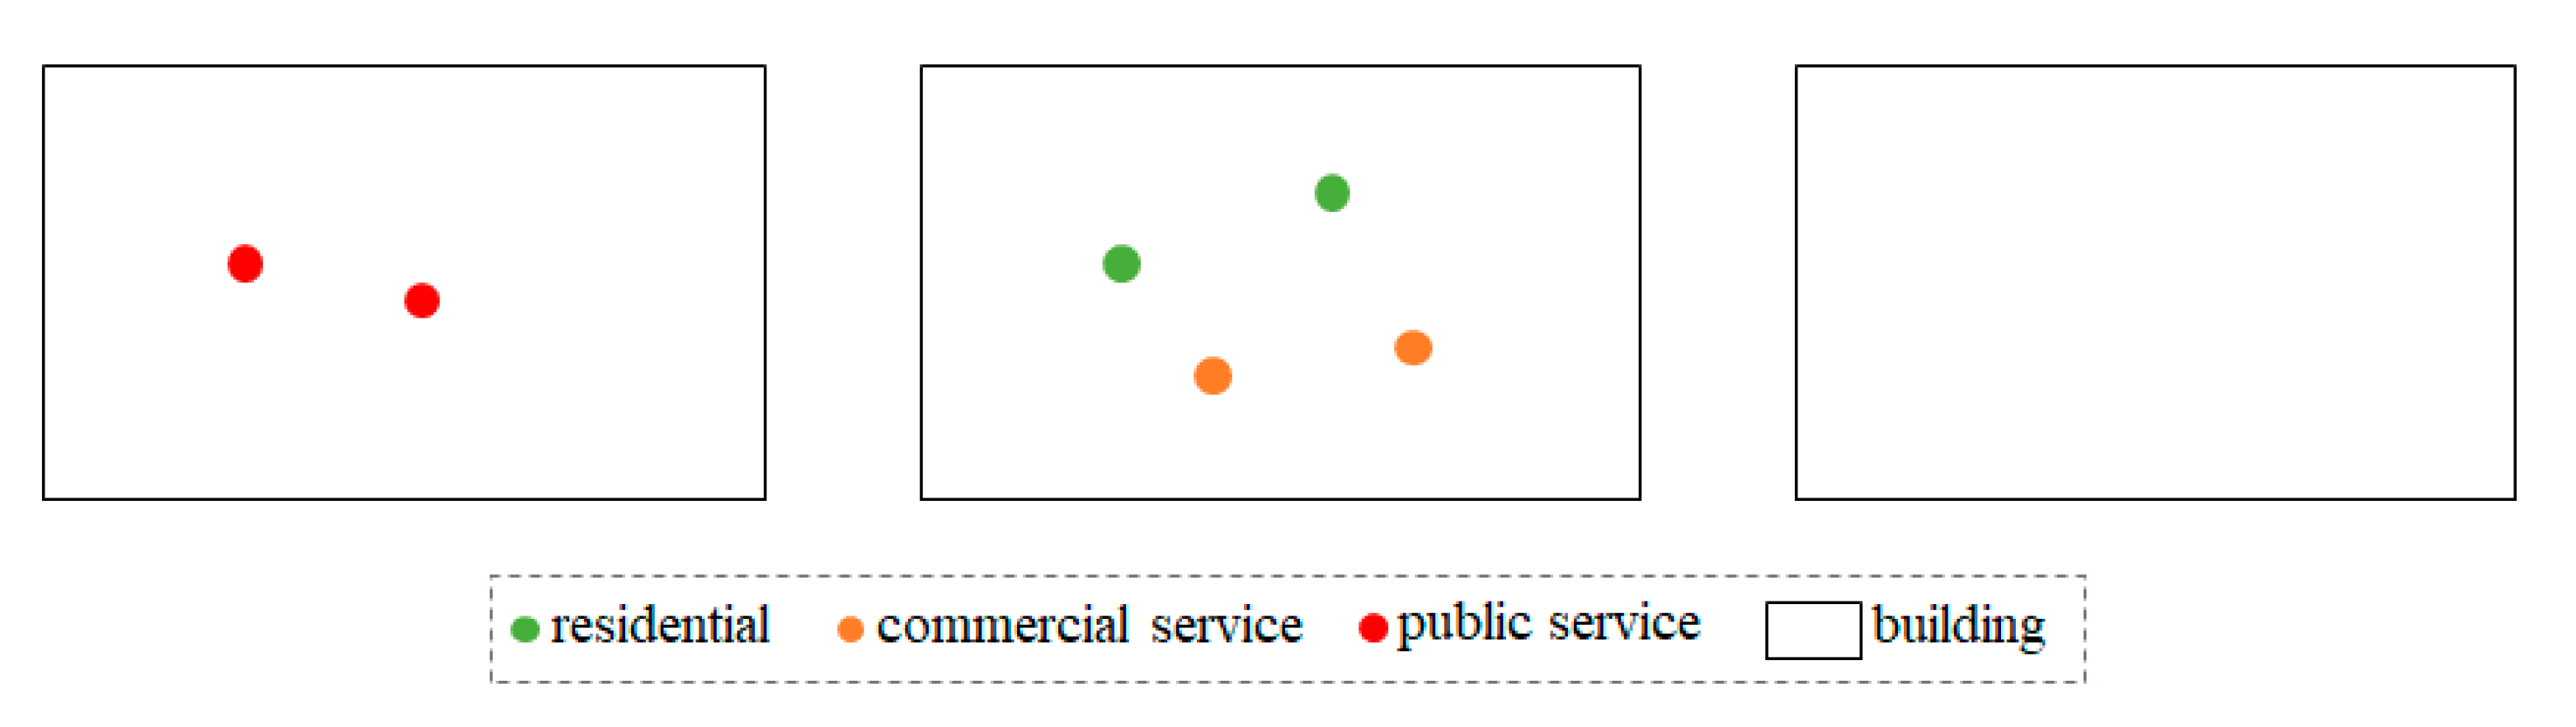
Considering the geometric distribution of POI and buildings, the relationships between them can be divided into three categories: (1) buildings with only a single type of POI, such as public service POIs; (2) various types of POIs related to buildings, such as residential POIs and commercial service POIs; and (3) buildings with no POI types. The three geometric relationships are shown in Figure 3.
Due to the different functions of urban buildings, buildings are divided into different types, comprising commercial services, public services, residential, and commercial–residential mixed (shops at low levels and residential buildings above). According to the relationship between the spatial distributions of buildings and POIs, the classification rules for buildings are defined as follows.
- (1)
- If a building is located in an area with only residential type POIs, the building is a residential building.
- (2)
- If a building is located in an area with both commercial service POIs and residential POIs, the building is a low-rise commercial building with residences above.
- (3)
- For buildings without POIs, the type is predicted with the TF-IDF method.
2.2.2. Classification of Buildings with the TF-IDF Method
In the POI data, the number of commercial POIs is much more than that of residential POIs. However, in the real world, the population is mainly distributed in residential buildings. This brings about a problem, residential buildings which are very important for classification, account for less in POI. TF-IDF is a commonly used weighting technique for information retrieval and data mining, where samples with a low frequency are of high importance in the local area. This is applicable to the uneven distribution of POI data.
For buildings with POIs inside, the building type is judged according to the internal POI type. Buildings without POIs inside are classified using the TF-IDF method. The steps in the building classification based on TF-IDF are as follows.
Step 1. Obtain the geometric center coordinates of a building.
Formula (1) is used to calculate the geometric center coordinates of the building to represent the location of building i (i = 1, 2,…, m; m is the total number of buildings), where and are the vertical and horizontal coordinates of the vertices of building i (j = 1, 2,…, n; n is the total number of building vertices), respectively.
Step 2. Calculate the IDF values for different classes of k.
Formula (2) is used to calculate the IDF value (k = 1, 2,…, p; p is the total number of POI classes) for each POI class k, where is the total number of k class POIs in the subdistrict and is the IDF value.
Step 3. Calculate the TF value for building i.
By taking the geometric centroid of building i as the center, the number of different POI types in a certain range is counted and the TF value is calculated using Formula (3), where represents the number of class K POIs within a certain area of building i.
Step 4. Calculate the TF-IDF value.
Formula (4) is used to calculate the TF-IDF value of building i for different class k POIs and the largest class is the building class.
Analyzing the significance and advantages of building classifications with the TF-IDF method is useful for population estimation. By calculating the frequency of different POI types around the center of buildings, we can get the TF-IDF value of building categories. This method can efficiently and scientifically obtain classification data for buildings. It requires less time compared with manually assigning building categories. Building classification data are important inputs for population estimation in the proposed method. After classifying the buildings, residential houses that are closely related to the population distribution can be extracted. Statistical data related to residential properties are important parameters for population estimation in our method.
2.3. Population Estimation at Fine-Scale
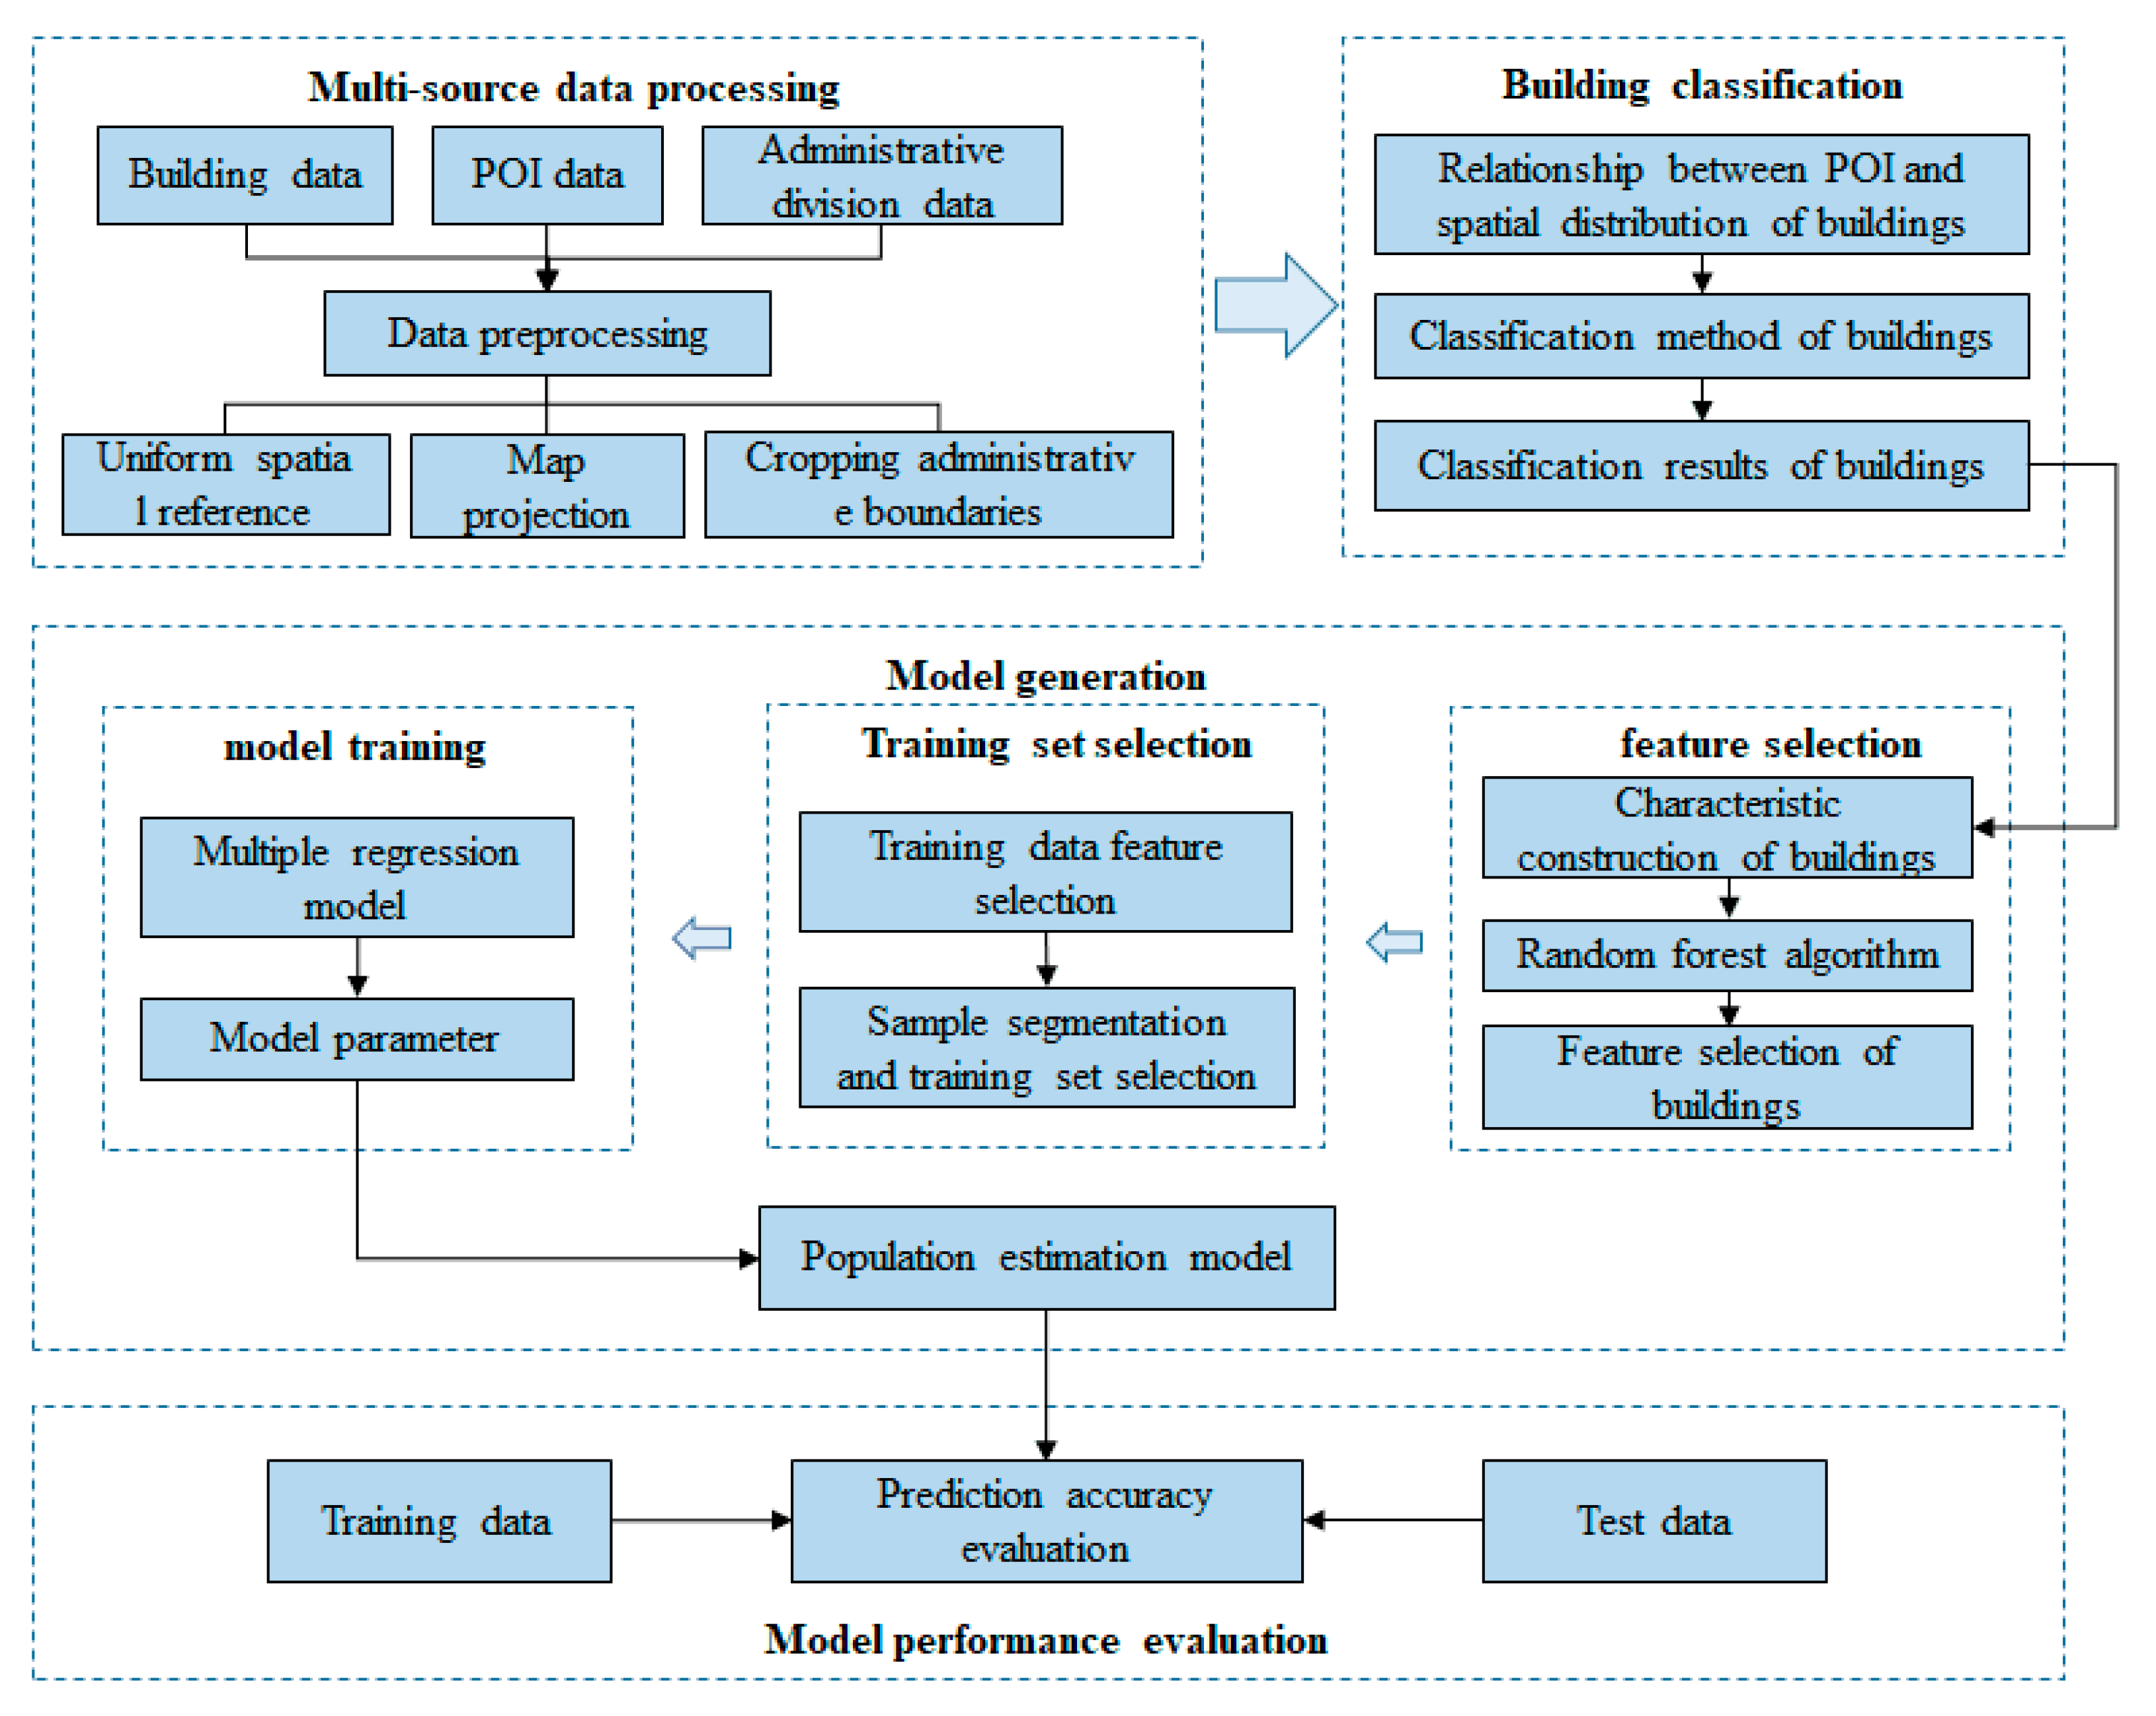
Living spaces are the actual centers of human distributions in geographical space, which has a low correlation with non-residential buildings, such as commercial service buildings and public service buildings. Based on the building classifications, this paper screens out residential houses and counts characteristic variables, such as the perimeter, area, and total number of floors of subdistrict residential buildings. To verify the validity of variables, the random forest method is applied for variable screening and correlation analysis. Since it has clear advantages when dealing with unbalanced data. A linear model is established with a multiple regression method, according to the number of buildings, geometric features, and population in an administrative division (Figure 4).
2.3.1. Classification of Buildings with the TF-IDF Method
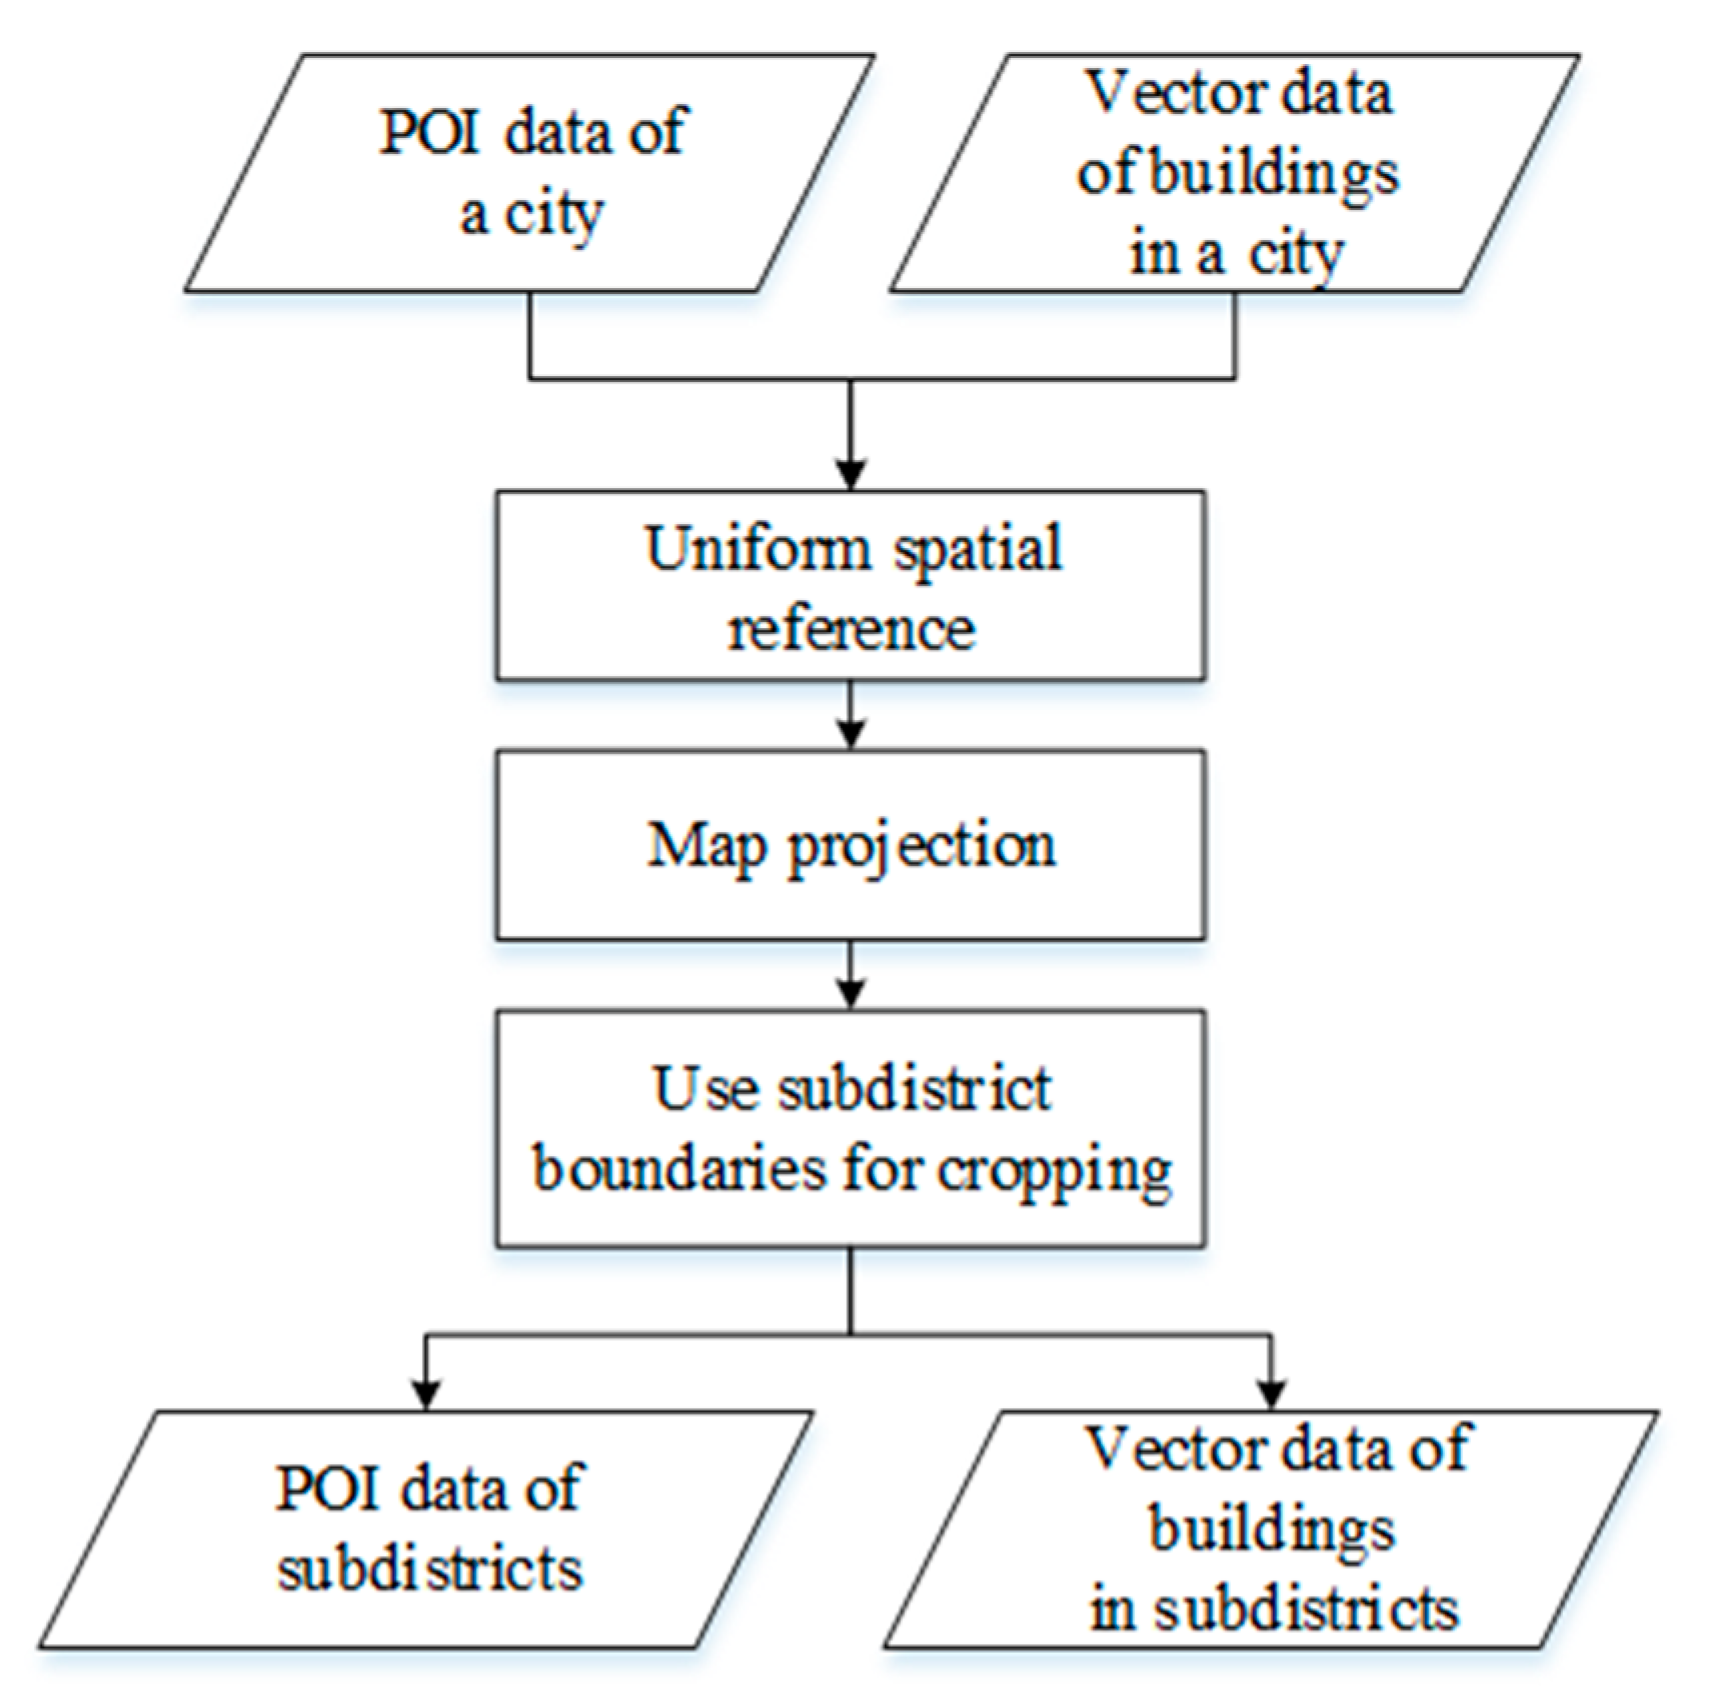
Firstly, multi-source data are processed to classify urban buildings. Residential buildings are selected from the classification results. The data used in this method include urban building data, POI vector data for the research area, and administrative division data. Urban building data, POI data, population census data, and administrative division data describe the characteristics of geographical areas in different dimensions, and they have significant spatial correlations. According to the limited spatial scope of the administrative division, subdistrict scale building data, POI data, and population census data are obtained, and relevant statistics are generated. The specific process is shown in Figure 5.
The attributes of POI vector data include the ID, latitude, longitude, and category. Building vector data comprise outline data for city buildings. Attribute data includes the building ID, building floor number, building perimeter, and building area. Administrative territorial entity properties include the administrative territorial entity ID, administrative territorial entity name, and administrative territorial entity update time. The demographic data used in this study are provided by the National Bureau of Statistics of the People’s Republic of China. The geographic coordinates system for POI data and building data is unified in World Geodetic System 1984, and map projection is conducted on this basis. Based on the administrative territorial entity data, POIs and building spatial data can be associated with administrative territorial entity data to obtain subdistrict scale POIs and building data.
2.3.2. Population Estimation Model
Residential houses in buildings are the main focus of a population’s spatial distribution. Thus, changes in the number of housing units reflect changes in the size of the population. The era of big data and improved dynamic data acquisition technology have increased the availability of building data, thereby meeting the requirements for population estimation at a fine scale. Our proposed method involves multi-source data processing to classify urban buildings, before selecting residential houses from the classification results.
The traditional residential unit method is used to calculate the population by multiplying the number of residential units by the average number of people per household in a statistical area. In addition, the overall living area of buildings is an important feature used for estimating populations. The contribution of buildings with different floor numbers to population estimates will vary. Based on the relevant national regulations, we classify residential buildings with 0–3 stories as low-rise residential buildings, residential buildings with 4–6 stories as middle-rise residential buildings, and residential buildings with seven stories or more as high-rise residential buildings. We can obtain the following characteristics of subdistrict buildings based on their classifications: (1) total floor area of buildings, (2) total floor area of low-rise buildings, (3) total floor area of middle-rise buildings, (4) total living area of high-rise buildings, (5) number of low-rise buildings, (6) number of medium-rise buildings, and (7) number of high-rise buildings. According to the number of floors in residential buildings, the characteristic variables are counted such as the perimeter, area, and total floor number. The random forest method is then employed for variable selection and association analysis.
The inputs for the random forest method comprise the predictor variable X and the response variable Y. X representing seven statistical features of buildings in a subdistrict, and Y is the actual population of the subdistrict. Random forest regression training is conducted after normalizing the input variables. The importance values are calculated for the seven building features, and the first K are selected in order to construct the multiple regression model.
2.3.3. Model Estimation
In order to evaluate the performance of the fine-scale population model, the training set and test set are independent of each other. The performance of the model is evaluated, by comparing the differences between the predicted population data and the actual population data. In the experiment, the estimation error rate is used as the evaluation index, where the estimation obtained by the model is better when the error rate is lower. The error rate is defined as follows, where ε represents the error of the population estimation, represents the estimated subdistrict population, and is the result obtained by the population census.
In summary, the population estimation method proposed in this study has the following advantages. The characteristics of the population at a fine scale in a city are closely related to the distribution of the city’s residents. Thus, residential houses are selected from the subdistrict buildings, by considering the differences in the per capita occupancies of buildings with different heights, where the residential buildings are divided into low-rise, middle-rise, and high-rise buildings. A multiple linear regression model is established based on the number of buildings and their geometric features to estimate the population.
3. Results and Discussions
3.1. Establishment of Population Estimation Model
Subdistrict-scale building classification results are obtained using the POI data, buildings data, and administrative territorial entity data in Wuhan. Residential houses are screened out from the classification results, and they are classified as low-rise, middle-rise, and high-rise. The following key characteristics of buildings in the subdistricts are obtained: (1) total floor area of buildings, (2) total residential area of low-rise buildings, (3) total living area of mid-rise buildings, (4) total living area of high-rise buildings, (5) number of low-rise buildings, (6) number of mid-rise buildings, and (7) number of high-rise buildings. With these seven characteristics as the prediction variables X and the actual population of the subdistrict as the response variable Y, the importance of each variable is calculated, as shown in Table 2. The first five variables are selected in order of the number of high-rise buildings, total area of buildings, total area of middle-rise buildings, number of middle-rise buildings, and total area of high-rise buildings.
In total, 20 subdistricts of Wuhan are selected as samples, where 10 are selected randomly for the training set and the remaining samples are used as the test set. The training set data are filtered, and fields with the same variable name as the feature selected are used as the independent variables in the regression model. The correlations between multi-source data and population data are analyzed by constructing a multiple regression model. The dependent variable in the model is the resident population number. The independent variables in the model include the number of high-rise buildings, total area of buildings, total area of middle-rise buildings, number of middle-rise buildings, and total area of high-rise buildings. The model obtained in this study is as follows, where Pop denotes the projected population size.
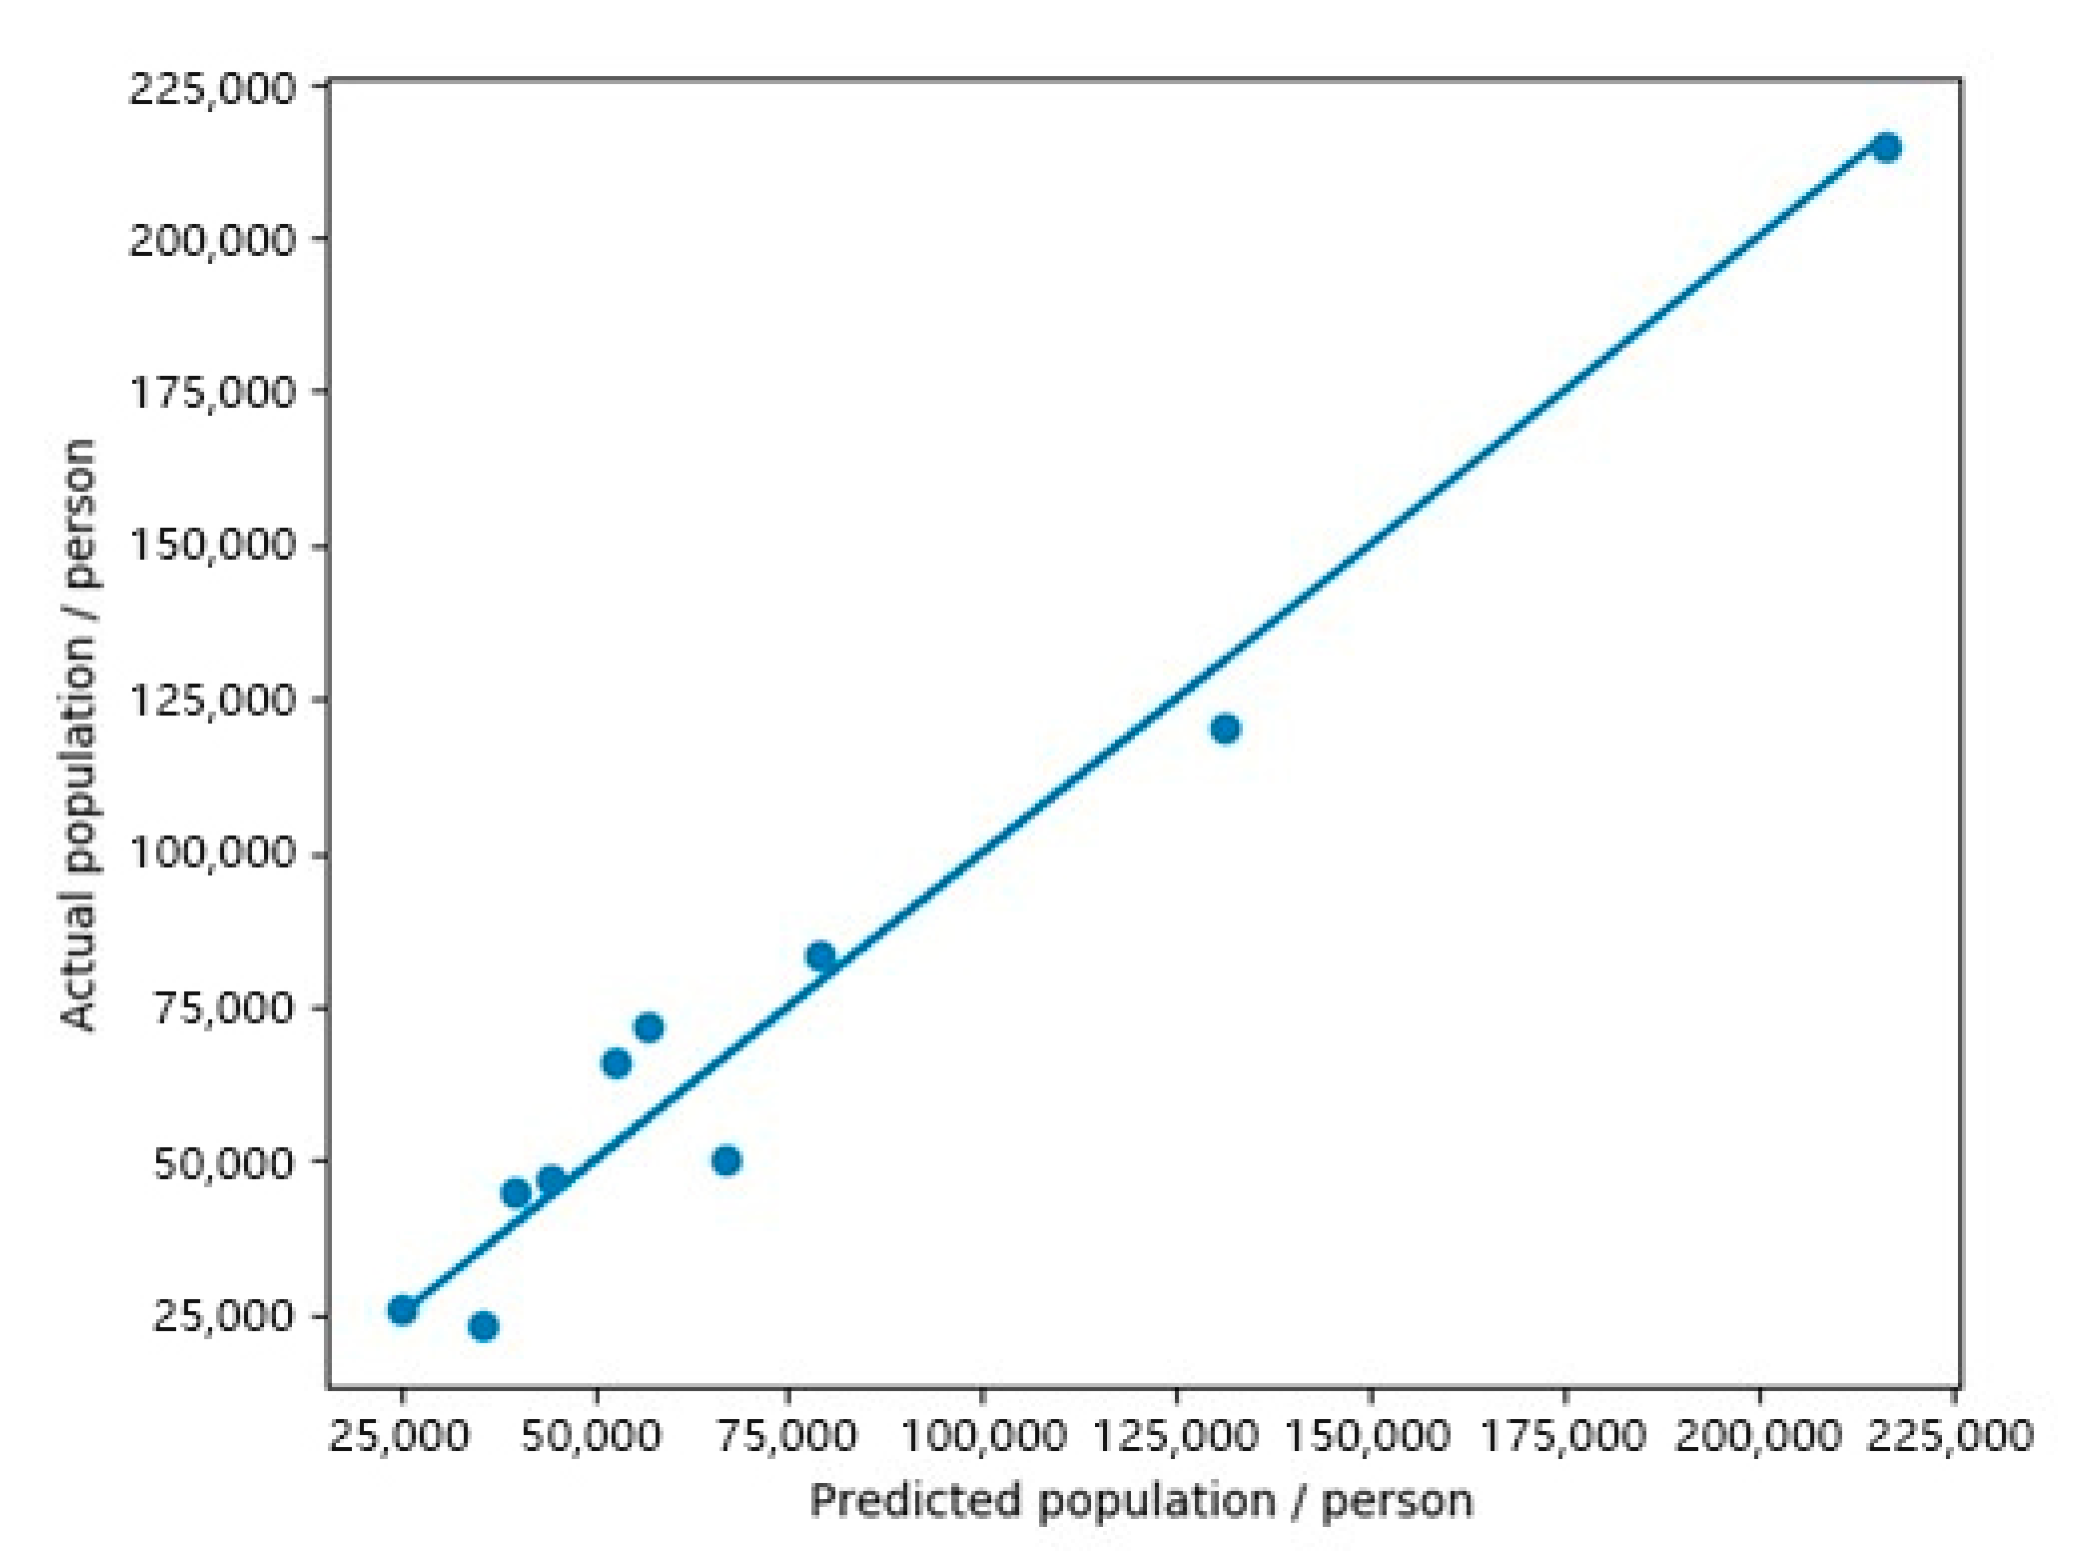
Figure 6 shows a scatter plot of the census population versus the estimated population, where the line indicates the ideal fit. The estimated results are generally close to the actual population, thereby demonstrating that the established regression model fitted the training set well. Table 3 compares the error rates for the model fitted to the training set in detail. Most of the error rates of subdistrict populations estimated are less than 25% and the average error is 11.08%, thereby indicating that the model had high accuracy.
3.2. Evaluation of Model Estimation Results
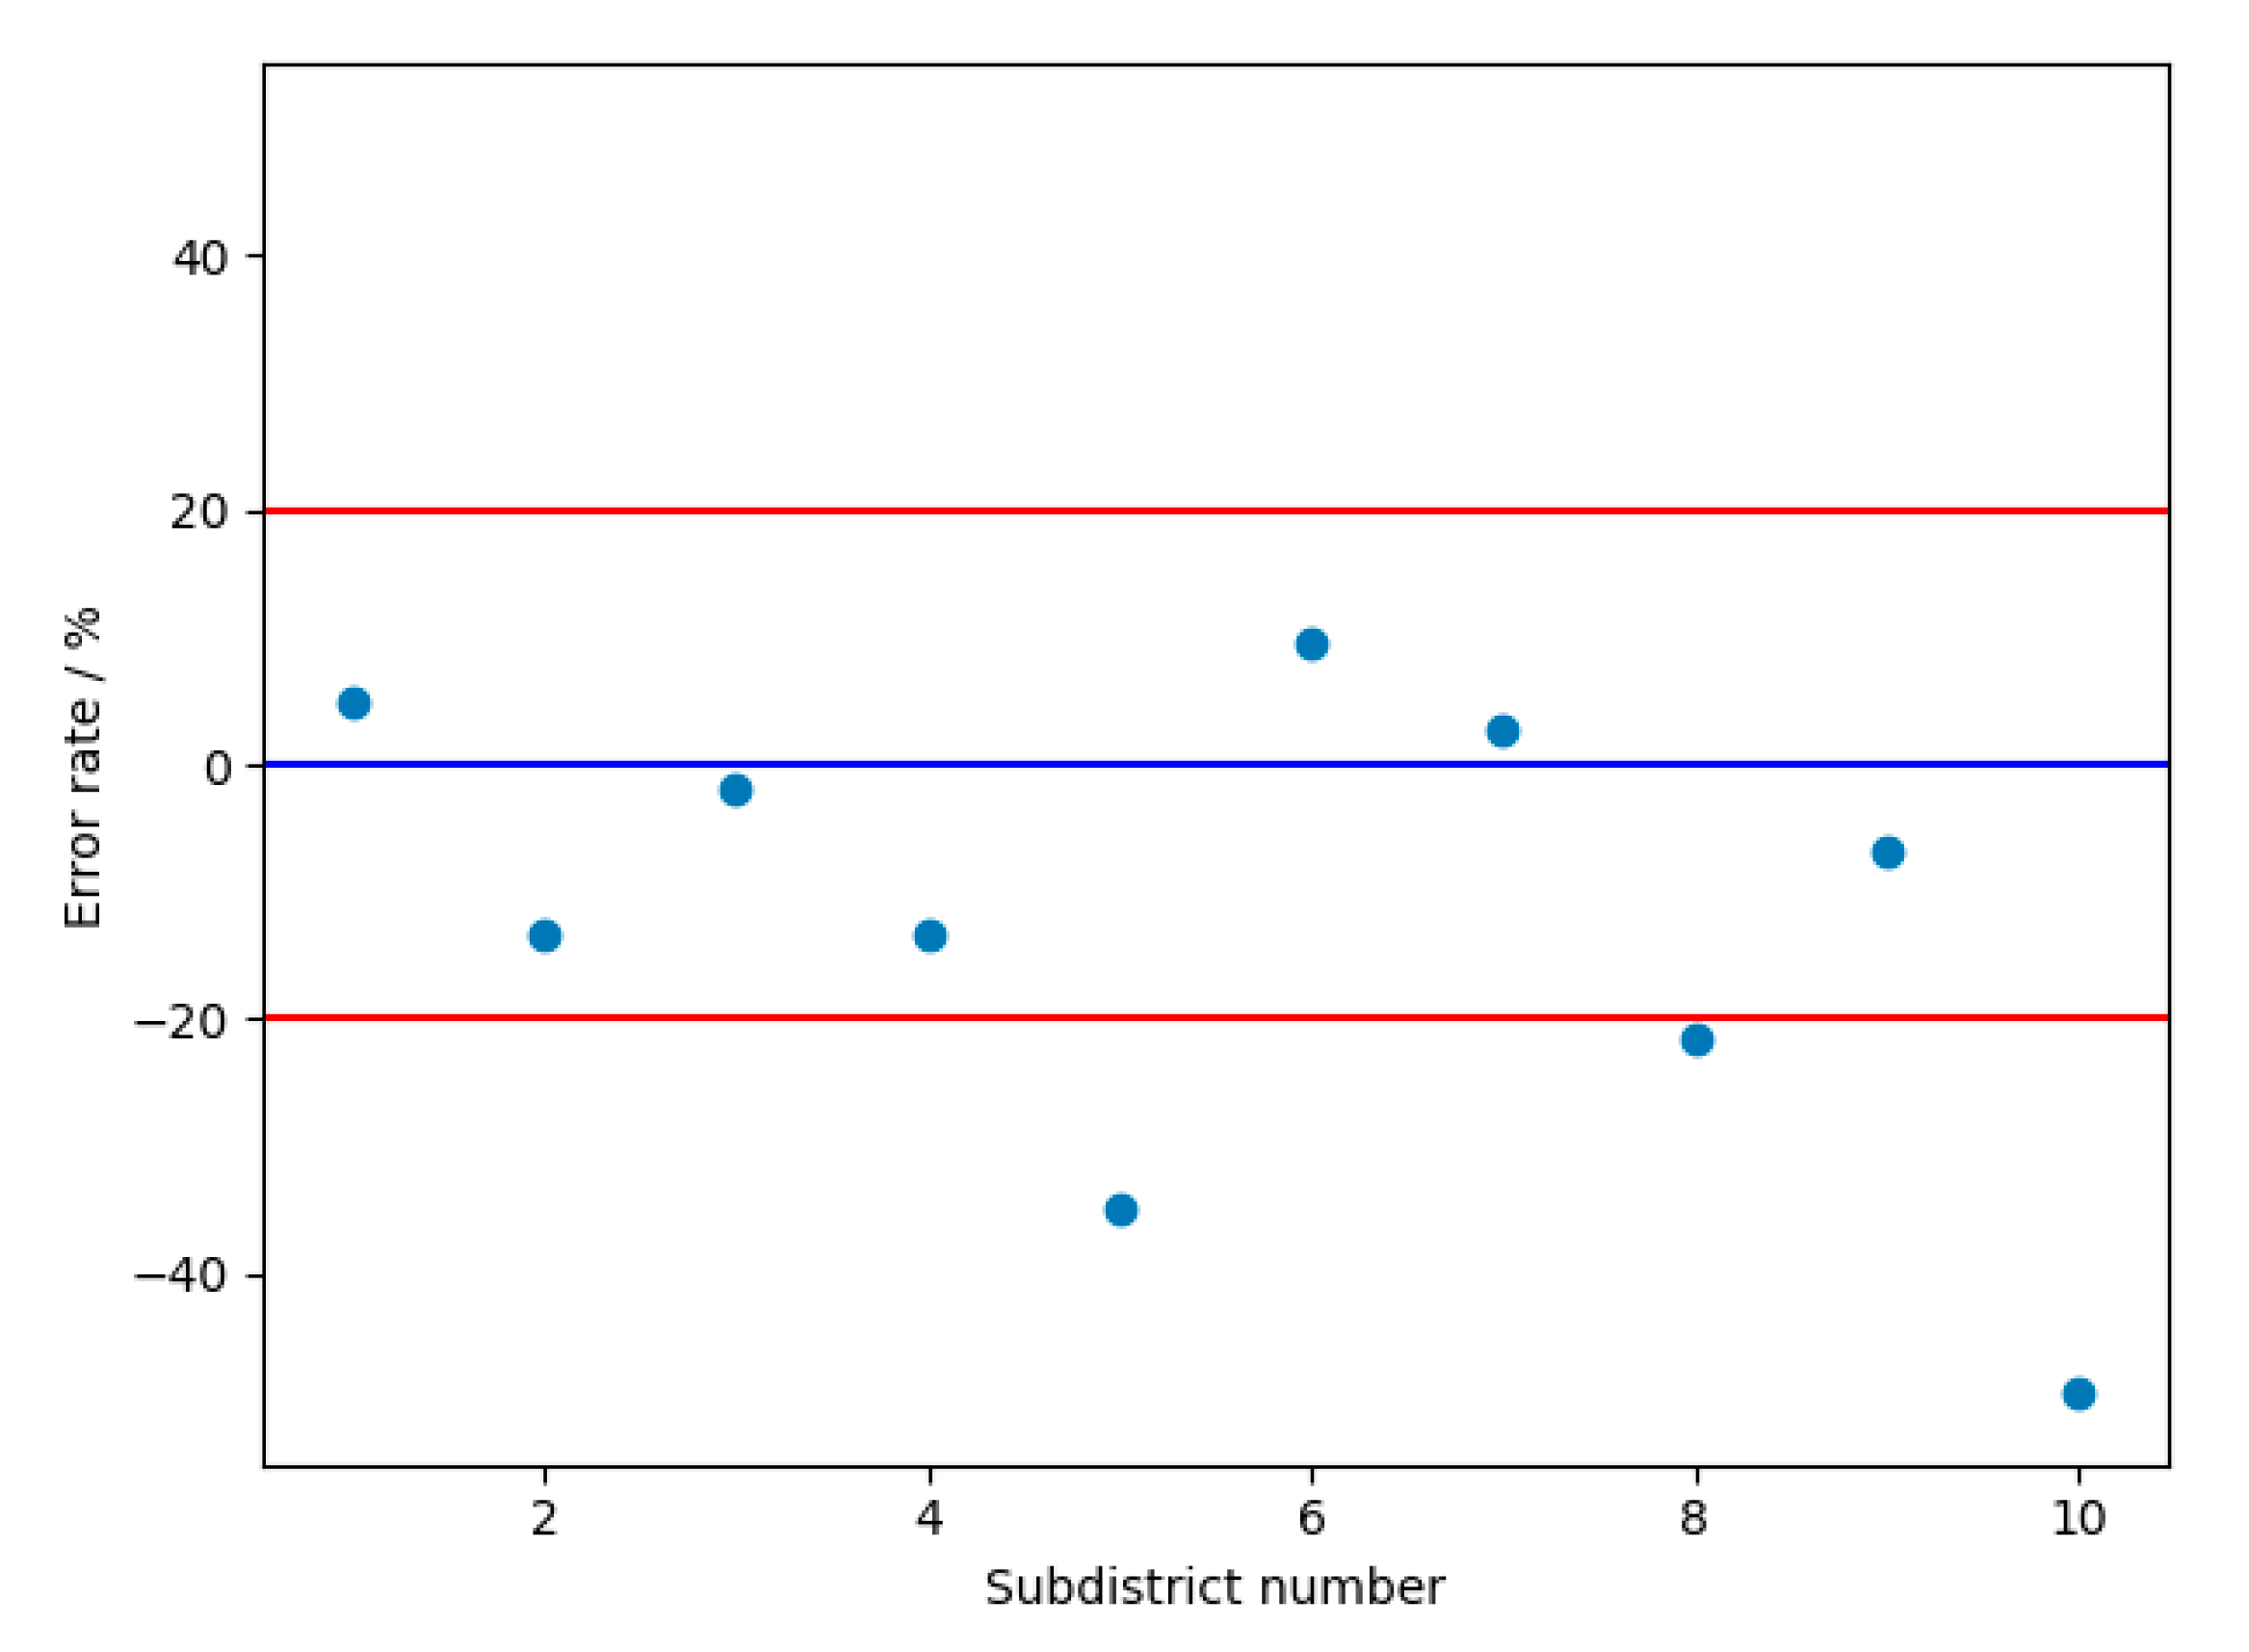
Data from 10 subdistricts, including Liangdao Subdistrict, Cuiwei Subdistrict, and Luonan Subdistrict, are used as independent test sets to evaluate the accuracy of the model at predicting the population sizes. The prediction error rates for the subdistrict populations are mostly less than 25% and the overall average is 12.33%. The accuracy of the proposed model is better than those of the current population estimation method based on DMSP/OLS night lighting data (error rate over 25% [36]) and the multi-agent urban fine-scale population estimation model (average relative error of 19% [37]). The results showed that the proposed model obtained good fits when predicting the subdistrict populations. It can be seen from Table 3 that the estimation error of most subdistricts is within 10,000 people, which leads to a large estimation error of subdistricts with fewer actual populations. The scatter plot in Figure 7 illustrates the estimated error rate for each subdistrict. Only two subdistricts had an error rate of more than 25%, and the rest of the subdistricts are pretty much correctly estimated. Comparatively speaking, there are more underestimates of the population in the whole experimental area, including two seriously underestimates and five slightly underestimates. This is mainly caused by the lack of building data in some areas.
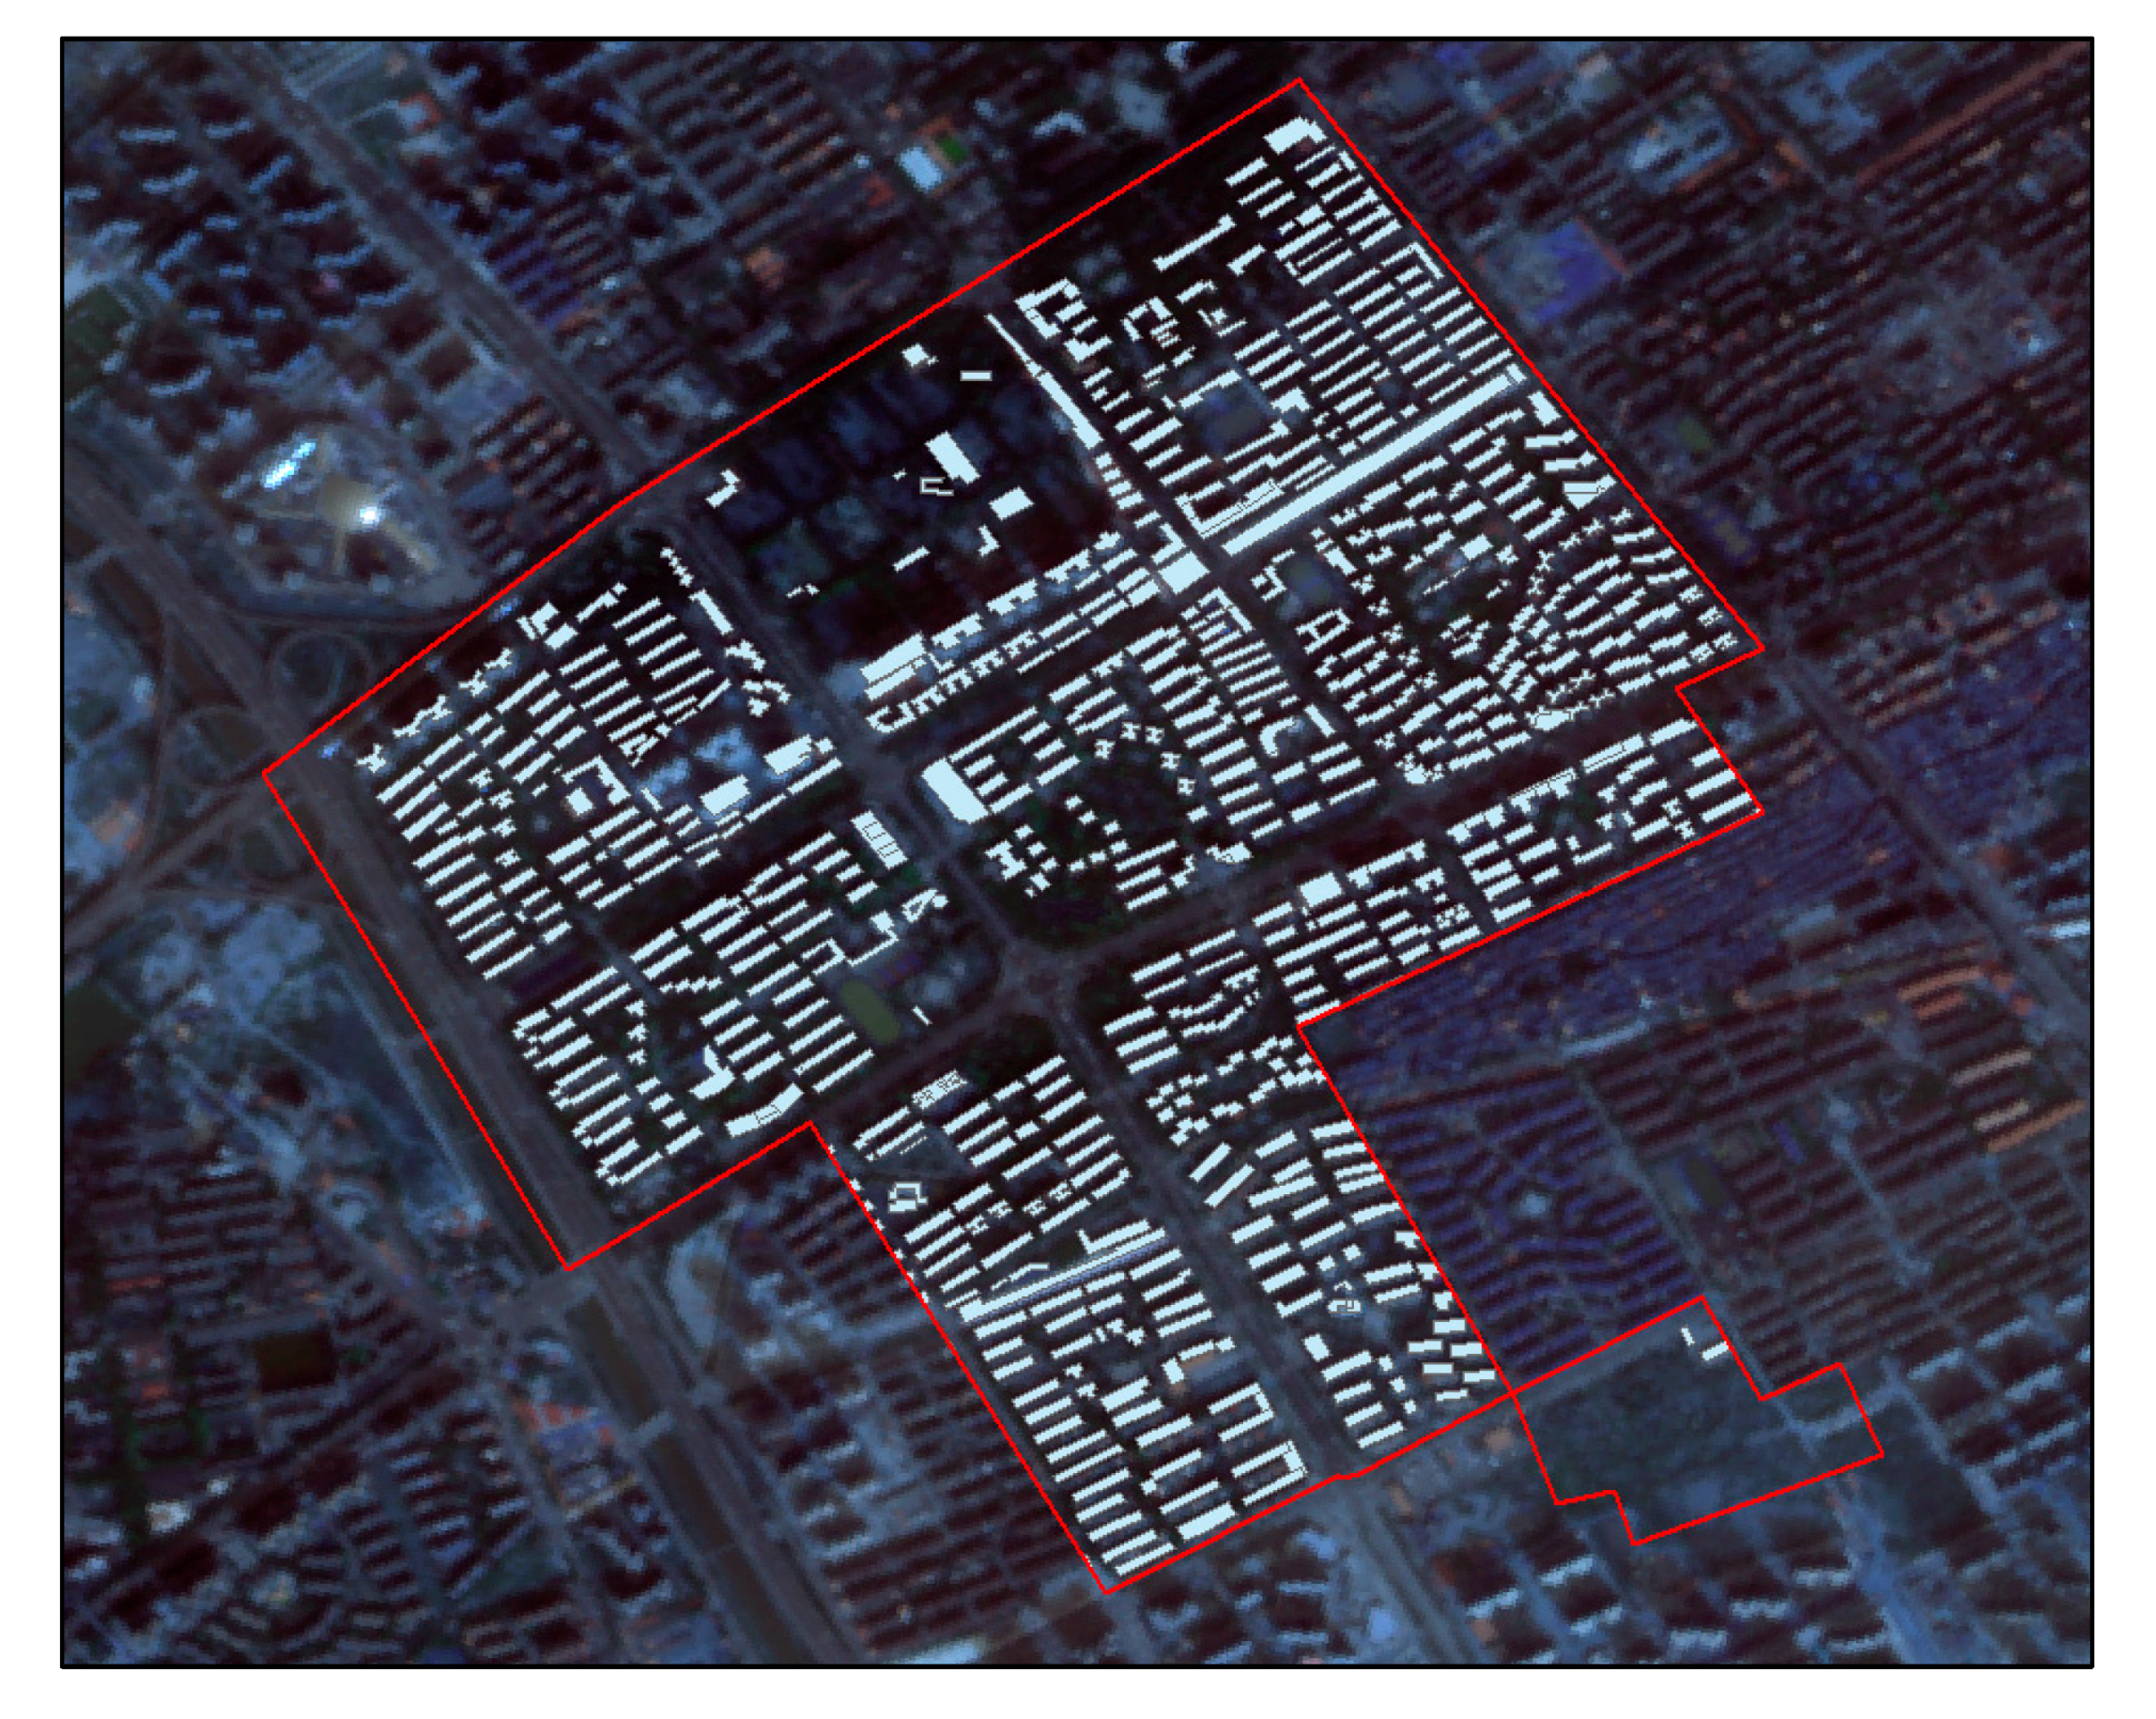
In order to confirm whether there is a lack of building data in subdistricts with large population estimation errors, we find the remote sensing data of Gaofen-1 satellite for comparison. Taking Ganghuacun Subdistrict as an example, the original data for the Ganghuacun Subdistrict are visualized in ArcMap. Figure 8 shows that the buildings in the upper and middle left part and the lower right part are clearly missing. The area of this subdistrict is less than 2.5 km2, and the number of missing buildings is high, thereby greatly impacting the accuracy of the model.
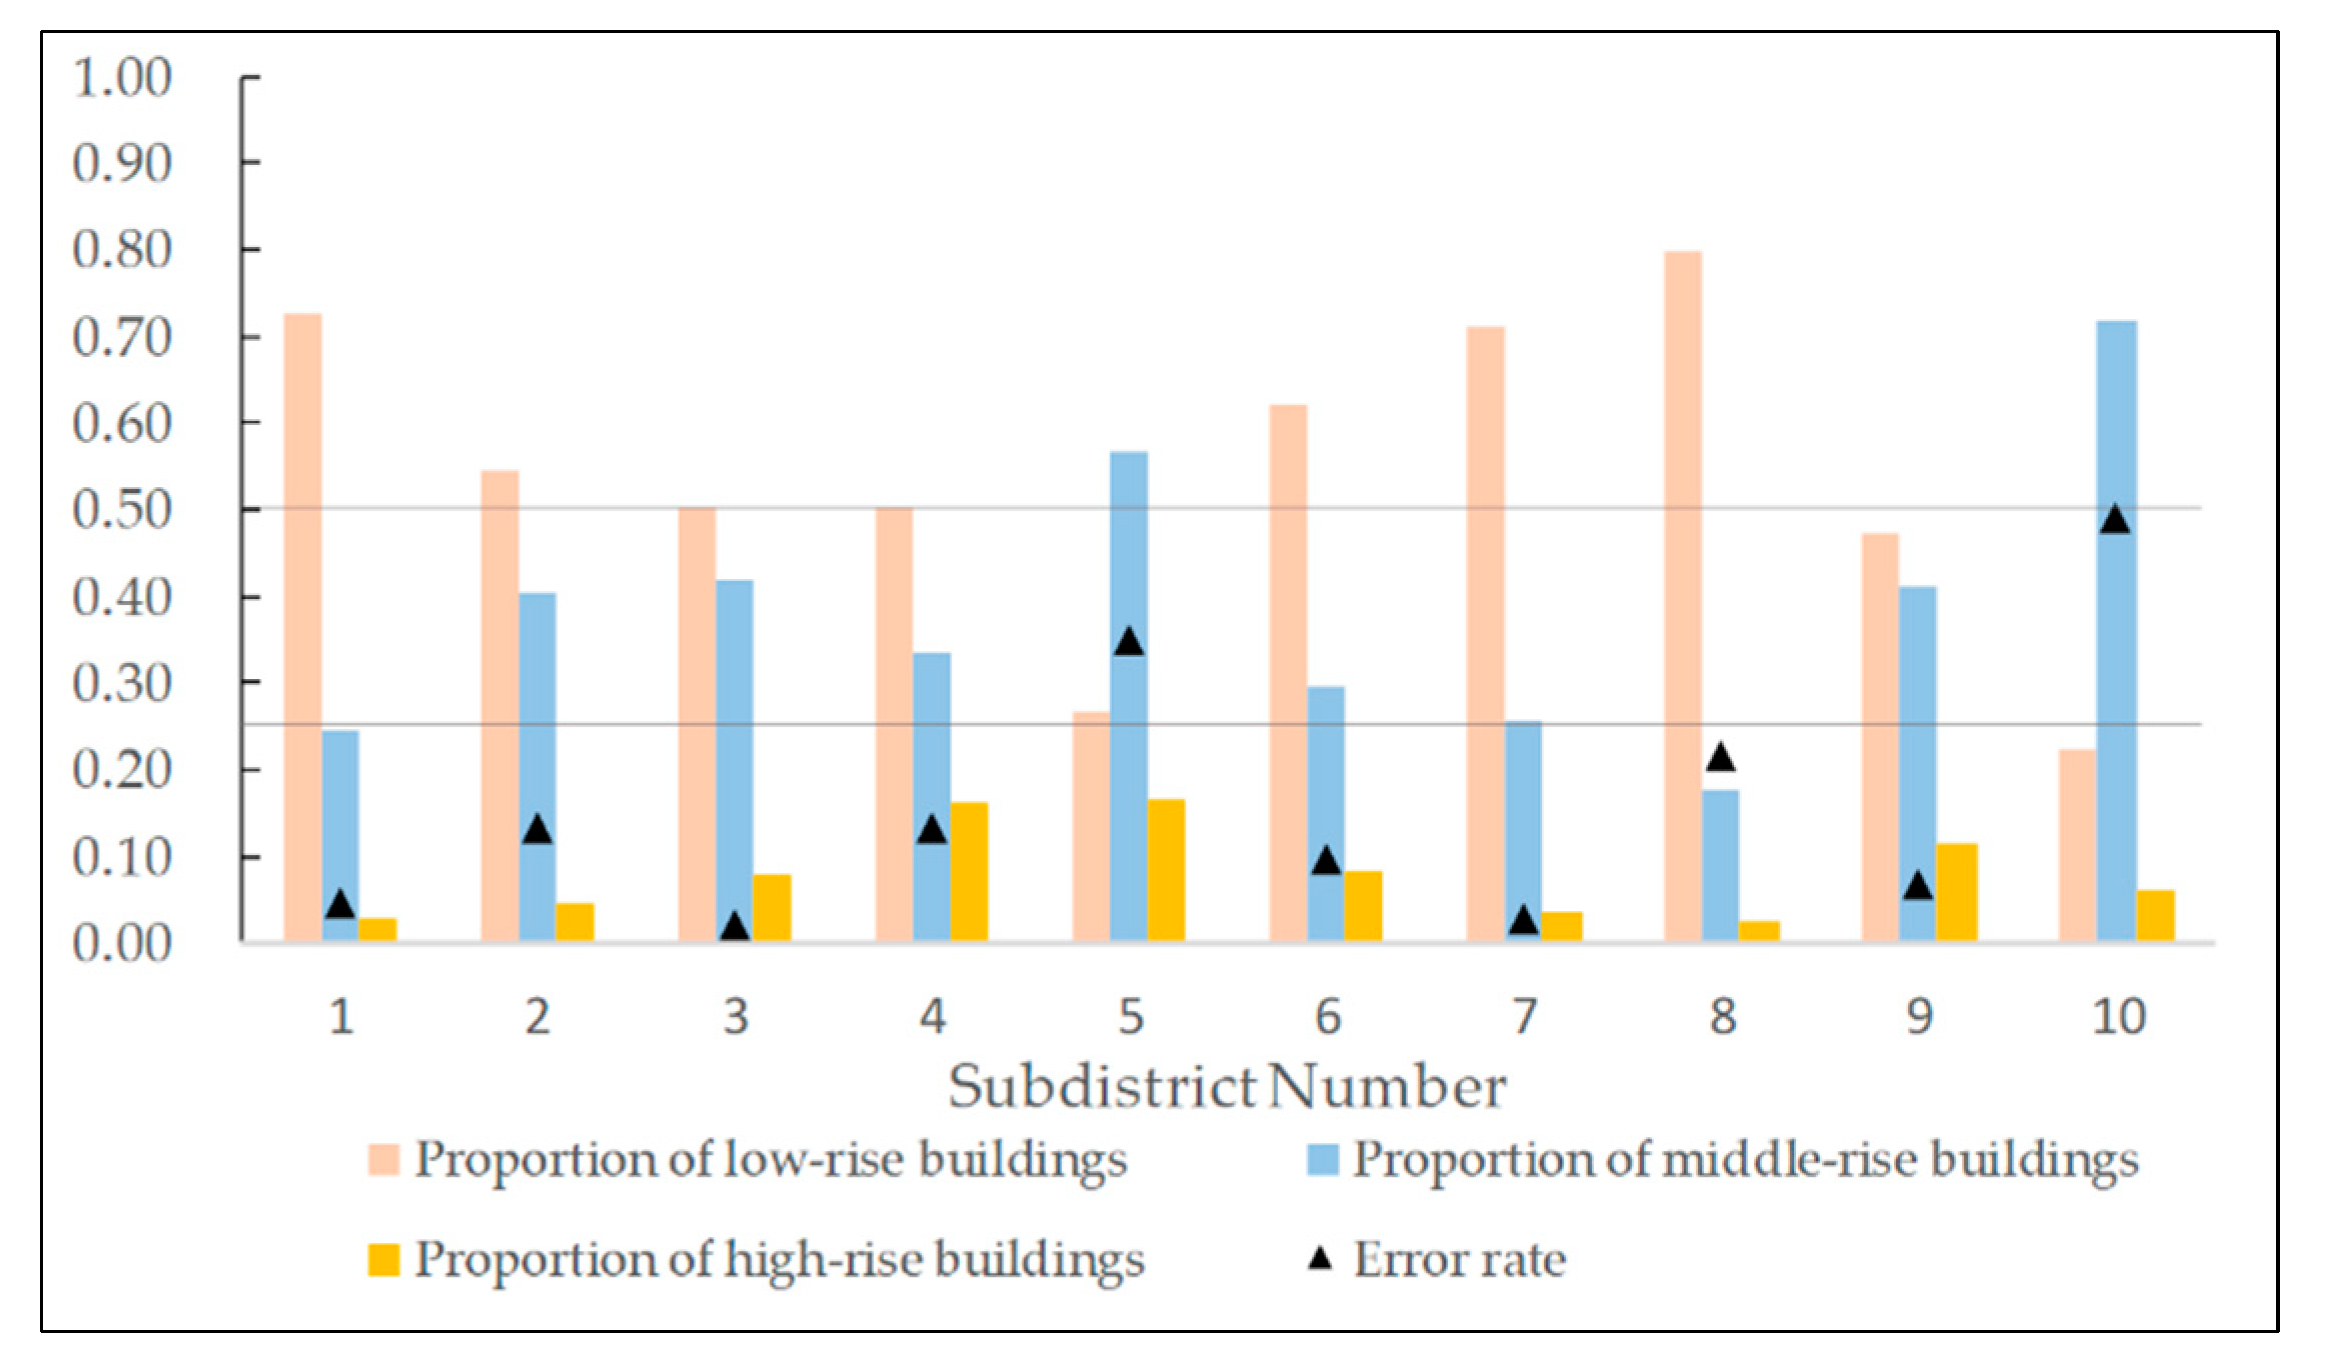
Furthermore, we analyze the relationship between the proportion of buildings with different building heights and the error rate. We count the proportion of low-rise, middle-rise, and high-rise buildings in these 10 streets in turn, and conduct correlation analysis with the estimation error. From Figure 9, we can find that the proportion of mid-rise buildings in the streets with an error rate of more than 25% is more than 50%. In China, mid-rise buildings often contain various types of POI, serving both commercial and residential functions. This brings interference to the classification of buildings.
To sum up, the method in this paper can experiment with fine-scale population estimations with an average error of 12.33%. The error rate of most subdistricts is small, and the estimation error of half subdistricts is less than 5000 people. Vector data of buildings are crucial for the fine-scale population estimation model proposed in this study. Thus, the lack of correct building data is the main explanation for the underestimation of the population numbers in some subdistricts.
4. Conclusions
Based on the close relationship between population size and building distribution, this paper divides urban areas at the fine-scale of subdistricts. To extract residential houses from building data, we construct an approach to classifying buildings into subdistricts, which uses multi-source data and the TF-IDF method. This method greatly reduces the time required compared with assigning buildings manually. The building variables related to the population are calculated and selected. According to the different population densities of different height floors, residential buildings are divided into low-rise, middle-rise, and high-rise buildings. The random forest method is then used to analyze the importance values according to the area, perimeter, and number of floors. A linear multiple regression model is established based on the number of floors in buildings, geometric features, and populations according to the importance of the variables for buildings.
The average error rate of the model is determined as 12.33%, which is better than other methods when using such as estimating the population based on night light remote sensing data. The fine-scale population estimation model developed in this study may have important applications related to the national economy and the livelihoods of people. There may be some possible limitations in this study. In this paper, the building is abstracted as a point and TF-IDF is used to predict its category. In real life, a high-rise building may have multiple functions at the same time. In addition, due to the dependence on building data and POI data, the model in this paper cannot be directly transferred to areas where relevant data is missing. Future research may focus on the following aspects: (1) establishing a spatio-temporal population estimation model by considering the decreases and increases in the numbers of buildings over time, and by introducing time variables; and (2) introducing night light data, remote sensing image data, and other data, and determining whether they improve the accuracy of the model.
Author Contributions
Conceptualization, S.W. and R.L.; methodology, S.W.; formal analysis, J.J.; data curation, Y.M.; writing—original draft preparation, S.W.; writing—review and editing, R.L.; supervision, J.J.; project administration, Y.M. All authors have read and agreed to the published version of the manuscript.
Funding
This research was supported by the National Natural Science Foundation of China (Grant No. U20A2091, 41771426) and the National Key Research and Development Program of China (Grant No.2016YFB0502301).
Institutional Review Board Statement
Not applicable.
Informed Consent Statement
Not applicable.
Data Availability Statement
The part data presented in this study are available on request from the corresponding author.
Conflicts of Interest
The authors declare no conflict of interest.
References
- Bai, C.; Lei, X. New trends in population aging and challenges for China’s sustainable development. China Econ. J. 2020, 13, 3–23. [Google Scholar] [CrossRef]
- Liu, X.; Clarke, K.; Herold, M. Population density and image texture. Photogramm. Eng. Remote Sens. 2006, 72, 187–196. [Google Scholar] [CrossRef] [Green Version]
- Wang, S.; Tian, Y.; Zhou, Y.; Liu, W.; Lin, C. Fine-scale population estimation by 3D reconstruction of urban residential buildings. Sensors 2016, 16, 1755. [Google Scholar] [CrossRef] [PubMed] [Green Version]
- Xie, J.; Zhou, J. Classification of urban building type from high spatial resolution remote sensing imagery using extended MRS and soft BP network. IEEE J. Sel. Top. Appl. Earth Obs. Remote Sens. 2017, 10, 3515–3528. [Google Scholar] [CrossRef]
- Liao, S.B.; Li, Z.H. Relationship between Population Distribution and Land Use and Spatialization of Population Census Data. Resour. Environ. Yangtze Basin 2004, 13, 557–561. [Google Scholar]
- Jiang, D.; Yang, X.H.; Wang, N.B.; Liu, H.H. Study on Spatial Distribution of Population Based on Remote Sensing and GIS. Adv. Earth Sci. 2002, 17, 734–738. [Google Scholar]
- Picornell, M.; Ruiz, T.; Borge, R.; García-Albertos, P.; de la Paz, D.; Lumbreras, J. Population dynamics based on mobile phone data to improve air pollution exposure assessments. J. Expo. Sci. Environ. Epidemiol. 2019, 29, 278–291. [Google Scholar] [CrossRef] [PubMed]
- Wang, J.L.; Singh, S. Video analysis of human dynamics—A survey. Real-Time Imaging 2003, 9, 321–346. [Google Scholar] [CrossRef]
- Tsou, M.H. Research challenges and opportunities in mapping social media and Big Data. Cartogr. Geogr. Inf. Sci. 2015, 42 (Suppl. 1), 70–74. [Google Scholar] [CrossRef]
- Qian, J.; Liu, Z.; Du, Y.; Wang, N.; Yi, J.; Sun, Y.; Zhou, C. Multi-Level Inter-Regional Migrant Population Estimation Using Multi-Source Spatiotemporal Big Data: A Case Study of Migrants in Hubei Province during the Outbreak of COVID-19 in Wuhan. In Mapping COVID-19 in Space and Time; Springer: Cham, Switzerlands, 2021; pp. 169–188. [Google Scholar]
- Leyk, S.; Gaughan, A.E.; Adamo, S.B.; de Sherbinin, A.; Balk, D.; Freire, S.; Rose, A.; Stevens, F.R.; Blankespoor, B.; Frye, C.; et al. The spatial allocation of population: A review of large-scale gridded population data products and their fitness for use. Earth Syst. Sci. Data 2019, 11, 1385–1409. [Google Scholar] [CrossRef] [Green Version]
- Wardrop, N.A.; Jochem, W.C.; Bird, T.J.; Chamberlain, H.R.; Clarke, D.; Kerr, D.; Bengtsson, L.; Juran, S.; Seaman, V.; Tatem, A.J. Spatially disaggregated population estimates in the absence of national population and housing census data. Proc. Natl. Acad. Sci. USA 2018, 115, 3529–3537. [Google Scholar] [CrossRef] [PubMed] [Green Version]
- Yao, Y.; Liu, X.; Li, X.; Zhang, J.; Liang, Z.; Mai, K.; Zhang, Y. Mapping fine-scale population distributions at the building level by integrating multisource geospatial big data. Int. J. Geogr. Inf. Sci. 2017, 31, 1220–1244. [Google Scholar] [CrossRef]
- Patel, N.N.; Stevens, F.R.; Huang, Z.; Gaughan, A.E.; Elyazar, I.; Tatem, A.J. Improving large area population mapping using geotweet densities. Trans. GIS 2017, 21, 317–331. [Google Scholar] [CrossRef]
- Kontokosta, C.E.; Johnson, N. Urban phenology: Toward a real-time census of the city using Wi-Fi data. Comput. Environ. Urban Syst. 2017, 64, 144–153. [Google Scholar] [CrossRef]
- Chen, R.; Sharman, R.; Rao, H.R.; Upadhyaya, S.J. Coordination in emergency response management. Commun. ACM 2008, 51, 66–73. [Google Scholar] [CrossRef]
- Nara, A.; Yang, X.; Machiani, S.G.; Tsou, M.H. An integrated evacuation decision support system framework with social perception analysis and dynamic population estimation. Int. J. Disaster Risk Reduct. 2017, 25, 190–201. [Google Scholar] [CrossRef]
- Khodabandelou, G.; Gauthier, V.; Fiore, M.; El-Yacoubi, M.A. Estimation of static and dynamic urban populations with mobile network metadata. IEEE Trans. Mob. Comput. 2018, 18, 2034–2047. [Google Scholar] [CrossRef] [Green Version]
- Feng, T.T.; Gong, J.Y. Investigation on Small-area Population Estimation Based on Building Extraction. Remote Sens. Technol. Appl. 2010, 25, 323–327. [Google Scholar]
- Wang, Z.Y.; Pan, Y.Q.; Huangfu, G.Y.; Li, T.G.; Ge, L.L. A Summary of Population Prediction Methods in Urban Plan. Resour. Dev. Mark. 2009, 25, 237–240. [Google Scholar]
- Pan, Z.Q.; Liu, G.H. The Research Progress of Areal Interpolation. Prog. Geogr. 2002, 21, 152–156. [Google Scholar]
- Lian, T. Population Estimation at the Building Level Based on Random Forest and Nighttime Light Data. Master’s Thesis, East China Normal University, Shanghai, China, 2019. [Google Scholar]
- Jie, Y. Population Estimation of Different Administrative Scales Based on DMSP/OLS Lighting Data. Master’s Thesis, Southwest Jiaotong University, Sichuan, China, 2018. [Google Scholar]
- Cao, L.Q.; Li, P.X.; Zhang, L.P. Urban Population Estimation Based on the DMSP/OLS Night-time Satellite Data—A Case of Hubei Province. Remote Sens. Inf. 2009, 1, 83–87. [Google Scholar]
- Amaral, S.; Monteiro, A.M.; Câmara, G.; Quintanilha, J.A. DMSP/OLS night-time light imagery for urban population estimates in the Brazilian Amazon. Int. J. Remote Sens. 2006, 27, 855–870. [Google Scholar] [CrossRef]
- Tripathy, B.R.; Tiwari, V.; Pandey, V.; Elvidge, C.D.; Rawat, J.S.; Sharma, M.P.; Prawasi, R.; Kumar, P. Estimation of urban population dynamics using DMSP-OLS night-time lights time series sensors data. IEEE Sens. J. 2016, 17, 1013–1020. [Google Scholar] [CrossRef]
- Xiao, D.S.; Yang, S. A review of population spatial distribution based on nighttime light data. Remote Sens. Land Resour. 2019, 31, 10–19. [Google Scholar]
- Tomás, L.; Fonseca, L.; Almeida, C.; Leonardi, F.; Pereira, M. Urban population estimation based on residential buildings volume using IKONOS-2 images and lidar data. Int. J. Remote Sens. 2016, 37 (Suppl. 1), 1–28. [Google Scholar] [CrossRef] [Green Version]
- Feng, T.T. Urban Small Area Population Estimation Based on High-Resolution Remote Sensing Data. Ph.D. Thesis, Wuhan University, Wuhan, China, 2010. [Google Scholar]
- Feng, J. Urban Small Area Population Estimation Based on High-resolution Remote Sensing Data. Master’s Thesis, East China Normal University, Shanghai, China, 2012. [Google Scholar]
- Lu, Z.; Im, J.; Quackenbush, L.; Halligan, K. Population estimation based on multi-sensor data fusion. Int. J. Remote Sens. 2010, 31, 5587–5604. [Google Scholar] [CrossRef]
- Wu, S.S.; Wang, L.; Qiu, X. Incorporating GIS Building Data and Census Housing Statistics for Sub-Block-Level Population Estimation. Prof. Geogr. 2008, 60, 121–135. [Google Scholar] [CrossRef]
- Khoshelham, K.; Nardinocchi, C.; Frontoni, E.; Mancini, A.; Zingaretti, P. Performance evaluation of automated approaches to building detection in multi-source aerial data. ISPRS J. Photogramm. Remote Sens. 2010, 65, 123–133. [Google Scholar] [CrossRef] [Green Version]
- Qu, C.; Ren, Y.H.; Liu, Y.L.; Li, Y. Functional Classification of Urban Buildings in High Resolution Remote Sensing Images through POI-assisted Analysis. J. Geo-Inf. Sci. 2017, 19, 831–837. [Google Scholar]
- Dong, G.; Li, R.; Jiang, J.; Wu, H.; McClure, S.C. Multigranular Wavelet Decomposition-Based Support Vector Regression and Moving Average Method for Service-Time Prediction on Web Map Service Platforms. IEEE Syst. J. 2019, 14, 3653–3664. [Google Scholar] [CrossRef]
- Lu, D.; Wang, Y.; Yang, Q.; Su, K.; Zhang, H.; Li, Y. Modeling spatiotemporal population changes by integrating DMSP-OLS and NPP-VIIRS nighttime light data in Chongqing, China. Remote Sens. 2021, 13, 284. [Google Scholar] [CrossRef]
- Dong, C.; Yin, S.; Zhang, Y. A model of urban fine-scale population estimation based on multi-agent. Sci. Surv. Mapp. 2019, 44, 113–119. [Google Scholar]
Figure 1.
Map of the study site.

Figure 2.
Building classification process.

Figure 3.
Spatial distribution of buildings and POIs.

Figure 4.
Population estimation method.

Figure 5.
Data preprocessing.

Figure 6.
Residuals of the training set used in the population estimation model.

Figure 7.
The error of the test set of the population estimation model.

Figure 8.
Buildings in Ganghuacun Subdistrict.

Figure 9.
Proportion of buildings with different floor heights.


Table 1.
Reclassification of POI.
| Classification | Reclassification |
|---|---|
| automobile service, automobile sales, automobile maintenance, motorcycle service, catering service, shopping service, life service, sports and leisure service, accommodation service, corporate enterprise, financial and insurance service, business residence: industrial park, business residence: building, business residence: business residence related | commercial service |
| medical and health care services, scenic spots, government institutions and social organizations, scientific, educational and cultural services, transportation facilities, road ancillary facilities, public facilities | public service |
| business residence: residential area, place name and address information: door number information | residential building |
Table 2.
The order of importance for building-related feature variables.
| Variable Name | Importance |
|---|---|
| HighbuildingNum | 0.231080 |
| BuildingAreacovered | 0.160503 |
| MidbuildingArea | 0.158064 |
| MidbuildingNum | 0.156951 |
| HighbuildingArea | 0.144724 |
| LowbuildingNum | 0.100244 |
| LowbuildingArea | 0.048434 |
Table 3.
Estimated error of the model.
| Subdistrict Name | Actual Population | Predicted Population | Estimation Error | Error Rate |
|---|---|---|---|---|
| Liangdao Subdistrict | 64,704 | 67,818 | 3114 | 4.81% |
| Cuiwei Subdistrict | 44,529 | 38,604 | 5925 | −13.31% |
| Luonan Subdistrict | 230,583 | 225,938 | 4645 | −2.01% |
| Shuita Subdistrict | 19,426 | 16,859 | 2567 | −13.21% |
| Dazhi Subdistrict | 35,087 | 22,799 | 12,288 | −35.02% |
| Erqi Subdistrict | 81,312 | 89,207 | 7894 | 9.71% |
| Huanghelou Subdistrict | 60,909 | 62,573 | 1664 | 2.73% |
| Minquan Subdistrict | 36,387 | 28,539 | 7848 | −21.57% |
| Siwei Subdistrict | 32,234 | 30,054 | 2180 | −6.76% |
| Ganghuacun Subdistrict | 77,222 | 39,195 | 38,027 | −49.24% |
Actual total population: 682,393; total error of prediction: 84,165; average error rate: 12.33%.
Publisher’s Note: MDPI stays neutral with regard to jurisdictional claims in published maps and institutional affiliations. |
© 2021 by the authors. Licensee MDPI, Basel, Switzerland. This article is an open access article distributed under the terms and conditions of the Creative Commons Attribution (CC BY) license (https://creativecommons.org/licenses/by/4.0/).
Share and Cite
MDPI and ACS Style
Wang, S.; Li, R.; Jiang, J.; Meng, Y. Fine-Scale Population Estimation Based on Building Classifications: A Case Study in Wuhan. Future Internet 2021, 13, 251. https://0-doi-org.brum.beds.ac.uk/10.3390/fi13100251
AMA Style
Wang S, Li R, Jiang J, Meng Y. Fine-Scale Population Estimation Based on Building Classifications: A Case Study in Wuhan. Future Internet. 2021; 13(10):251. https://0-doi-org.brum.beds.ac.uk/10.3390/fi13100251
Chicago/Turabian StyleWang, Shunli, Rui Li, Jie Jiang, and Yao Meng. 2021. "Fine-Scale Population Estimation Based on Building Classifications: A Case Study in Wuhan" Future Internet 13, no. 10: 251. https://0-doi-org.brum.beds.ac.uk/10.3390/fi13100251
Note that from the first issue of 2016, this journal uses article numbers instead of page numbers. See further details here.