
Experimental Evaluation of a LoRa Wildlife Monitoring Network in a Forest Vegetation Area


1
Department of Veterinary Sciences, University of Turin, 10095 Grugliasco (TO), Italy
2
Department of Information Engineering, University of Pisa, Via Caruso 16, 56122 Pisa, Italy
3
CNIT Research Unit, Department of Information Engineering, University of Pisa, 56100 Pisa, Italy
*
Author to whom correspondence should be addressed.
Future Internet 2021, 13(5), 115; https://0-doi-org.brum.beds.ac.uk/10.3390/fi13050115
Submission received: 12 April 2021
/
Revised: 27 April 2021
/
Accepted: 28 April 2021
/
Published: 29 April 2021
Abstract
:Smart agriculture and wildlife monitoring are one of the recent trends of Internet of Things (IoT) applications, which are evolving in providing sustainable solutions from producers. This article details the design, development and assessment of a wildlife monitoring application for IoT animal repelling devices that is able to cover large areas, thanks to the low power wide area networks (LPWAN), which bridge the gap between cellular technologies and short range wireless technologies. LoRa, the global de-facto LPWAN, continues to attract attention given its open specification and ready availability of off-the-shelf hardware, with claims of several kilometers of range in harsh challenging environments. At first, this article presents a survey of the LPWAN for smart agriculture applications. We proceed to evaluate the performance of LoRa transmission technology operating in the 433 MHz and 868 MHz bands, aimed at wildlife monitoring in a forest vegetation area. To characterize the communication link, we mainly use the signal-to-noise ratio (SNR), received signal strength indicator (RSSI) and packet delivery ratio (PDR). Findings from this study show that achievable performance can greatly vary between the 433 MHz and 868 MHz bands, and prompt caution is required when taking numbers at face value, as this can have implications for IoT applications. In addition, our results show that the link reaches up to 860 m in the highly dense forest vegetation environment, while in the not so dense forest vegetation environment, it reaches up to 2050 m.
1. Introduction
With the rapid increase in the population of ungulates, especially wild boars (Sus scrofa L.) in Italy emanating due to the migration from the Alps to the southern part of the country, it ungulates destroying crop produce such as vineyards, wheat, and corn fields, as well as causing plant mortality [1,2]. Statistical data also show that there has been a massive surge in the loss of wine production, due to the crop damage caused by wildlife attacks in the past 3 decades. The annual production loss in the wine industry in Italy is estimated to be 13 million euros, with an annual cost to the government estimated around 3 million euro [3], thus the ability to remotely monitor wildlife and protect crop produce has become an important necessity.
Considering the above, several ways have been used to keep ungulates from destroying crop products, which can be classified as lethal or non-lethal. Lethal ways, such as shooting, trapping, string and stone, are very cruel and not environmentally friendly, while non-lethal means, such as scarecrow, chemical repellents, organic substances, and fencing are sometimes inadequate, non-substantial, time-consuming and also expensive [4]. Some of these methods even have an environmental pollution effect on both humans and ungulates [5]. Technology assistance at various stages of the agricultural processes can significantly enhance the crop yield [6].
In this context, the usage of ad-hoc IoT devices (also called repellers, see Section 3.1 for details) capable of detecting the presence of animals by means of a PIR sensor, and repelling them through the generation of ultrasounds, has been designed and evaluated in our previous work in [7]. This has recently been proven as an alternative, effective method for protecting crops against ungulates. Such a solution, besides being non-lethal, has no impact on the landscape and no limitation on tourists’ and bikers movements, which is very relevant for tourism. Our proposed method for protecting crops from ungulate attacks is based on the generation of ultrasounds and the utilization of IoT technology for building a system with repelling and monitoring capabilities.
In terms of the communication technology, there have been various breakthroughs in technology that are suitable for various types of applications. Focusing on our application, one of the key requirements is that the repeller devices consume very little power with a low data rate service. Low-power wide area networks (LPWAN) technologies promise minimal power consumption and long ranges, while allowing the reuse of frequencies of legacy communication networks. Although cellular standards have continued to evolve (such as long term evolution machine type communications (LTE-M), narrow band IoT (NB-IoT) and the upcoming 5G massive machine type communications (mMTC) and ultra reliable MTC (uMTC)) to cater to the needs of IoT applications, a forecast from IoT Analytics [8] estimates that more than 2 billion devices will be connected through LPWAN technologies by the year 2025.
At present, there are many players in the LPWAN space, such as Long Range (LoRa) [9,10], Sigfox [11], Ingenu [12] and Weightless [13]. Among others, LoRa has gained more popularity from the industrial and academic community due to the openness of its specification and ready availability of hardware in the market, which can facilitate experimental research and rapid prototyping. While LoRa is a physical (PHY) layer specification, LoRaWAN is the medium access control (MAC) defined to be used on top of the aforementioned PHY, where many research works have shown their advantages in terms of scalability, coverage and energy efficiency [14].
Among different and various wireless technologies for the IoT, in this solution, we adopt LoRa and LoRaWAN, global de facto standards of low-power wide area networks (LPWAN). LoRa and LoRaWAN are gaining significant interest and positive momentum thanks to their excellent features in covering long distances and in large scaling with low cost. In this work, we focus on the performance of the LoRa network that is used to monitor and control the IoT devices. The optimization of the deployment of the LoRa end nodes and the gateway requires carrying out radio planning tasks. Such tasks are essential for scenarios such as the one described for this paper (i.e., forestry vegetation area), which are especially challenging in terms of radio propagation due to numerical obstacles that impact the electromagnetic waves.
LoRaWAN applications take advantage of the wide segment of the ISM band assigned in the 868 MHz region, where it is possible to use multiple concurrent channels to sustain a great number of end nodes [15]. Several studies concerning the aspects of propagation and performance of LoRa modulation in the 868 MHz band are found in the literature [16,17], but only few works [18,19] have performed an experimental analysis in the 433 MHz band, which is also available in Europe. This paper aims at evaluating the performance of LoRa transmission technology in a real-life experiment when devices are deployed in a light-dense and very-dense forest vegetation environments. We investigate how the quality of reception depends on the main LoRa configuration parameters in the 433 MHz and 868 MHz frequency bands. In addition, we provide a theoretical coverage study from an accurate radio planning tool [20], which uses accurate terrain elevation data and the ITM Longley–Rice propagation model. In this paper, our key contributions are:
- A comprehensive state-of-the-art section is provided on the LPWAN technologies used for smart agriculture applications and wildlife monitoring network.
- The design and implementation of a prototype device used for the experimental tests are described in detail.
- The radio planning analysis, which evaluates the performance of LoRa network operating in the 433 MHz and 868 MHz aimed at wildlife monitoring in a forest vegetation, is presented, together with experimental results.
- Comparison of real-life RSSI values collected from the experimental test to values generated using an RF planning tool.
The rest of this paper is organized as follows: Section 2 introduces the state-of-the-art and the related works. The overall system architecture is described in Section 3. In Section 4, we present the experimental setup, whereas experimental results and discussion are presented in Section 5. Lastly, Section 6 concludes the paper with some final remarks.
2. State-of-the-Art and Related Works
In this section, we briefly discuss the state-of-the-art of LPWAN technologies used in smart agriculture applications. Next, we present the related works.
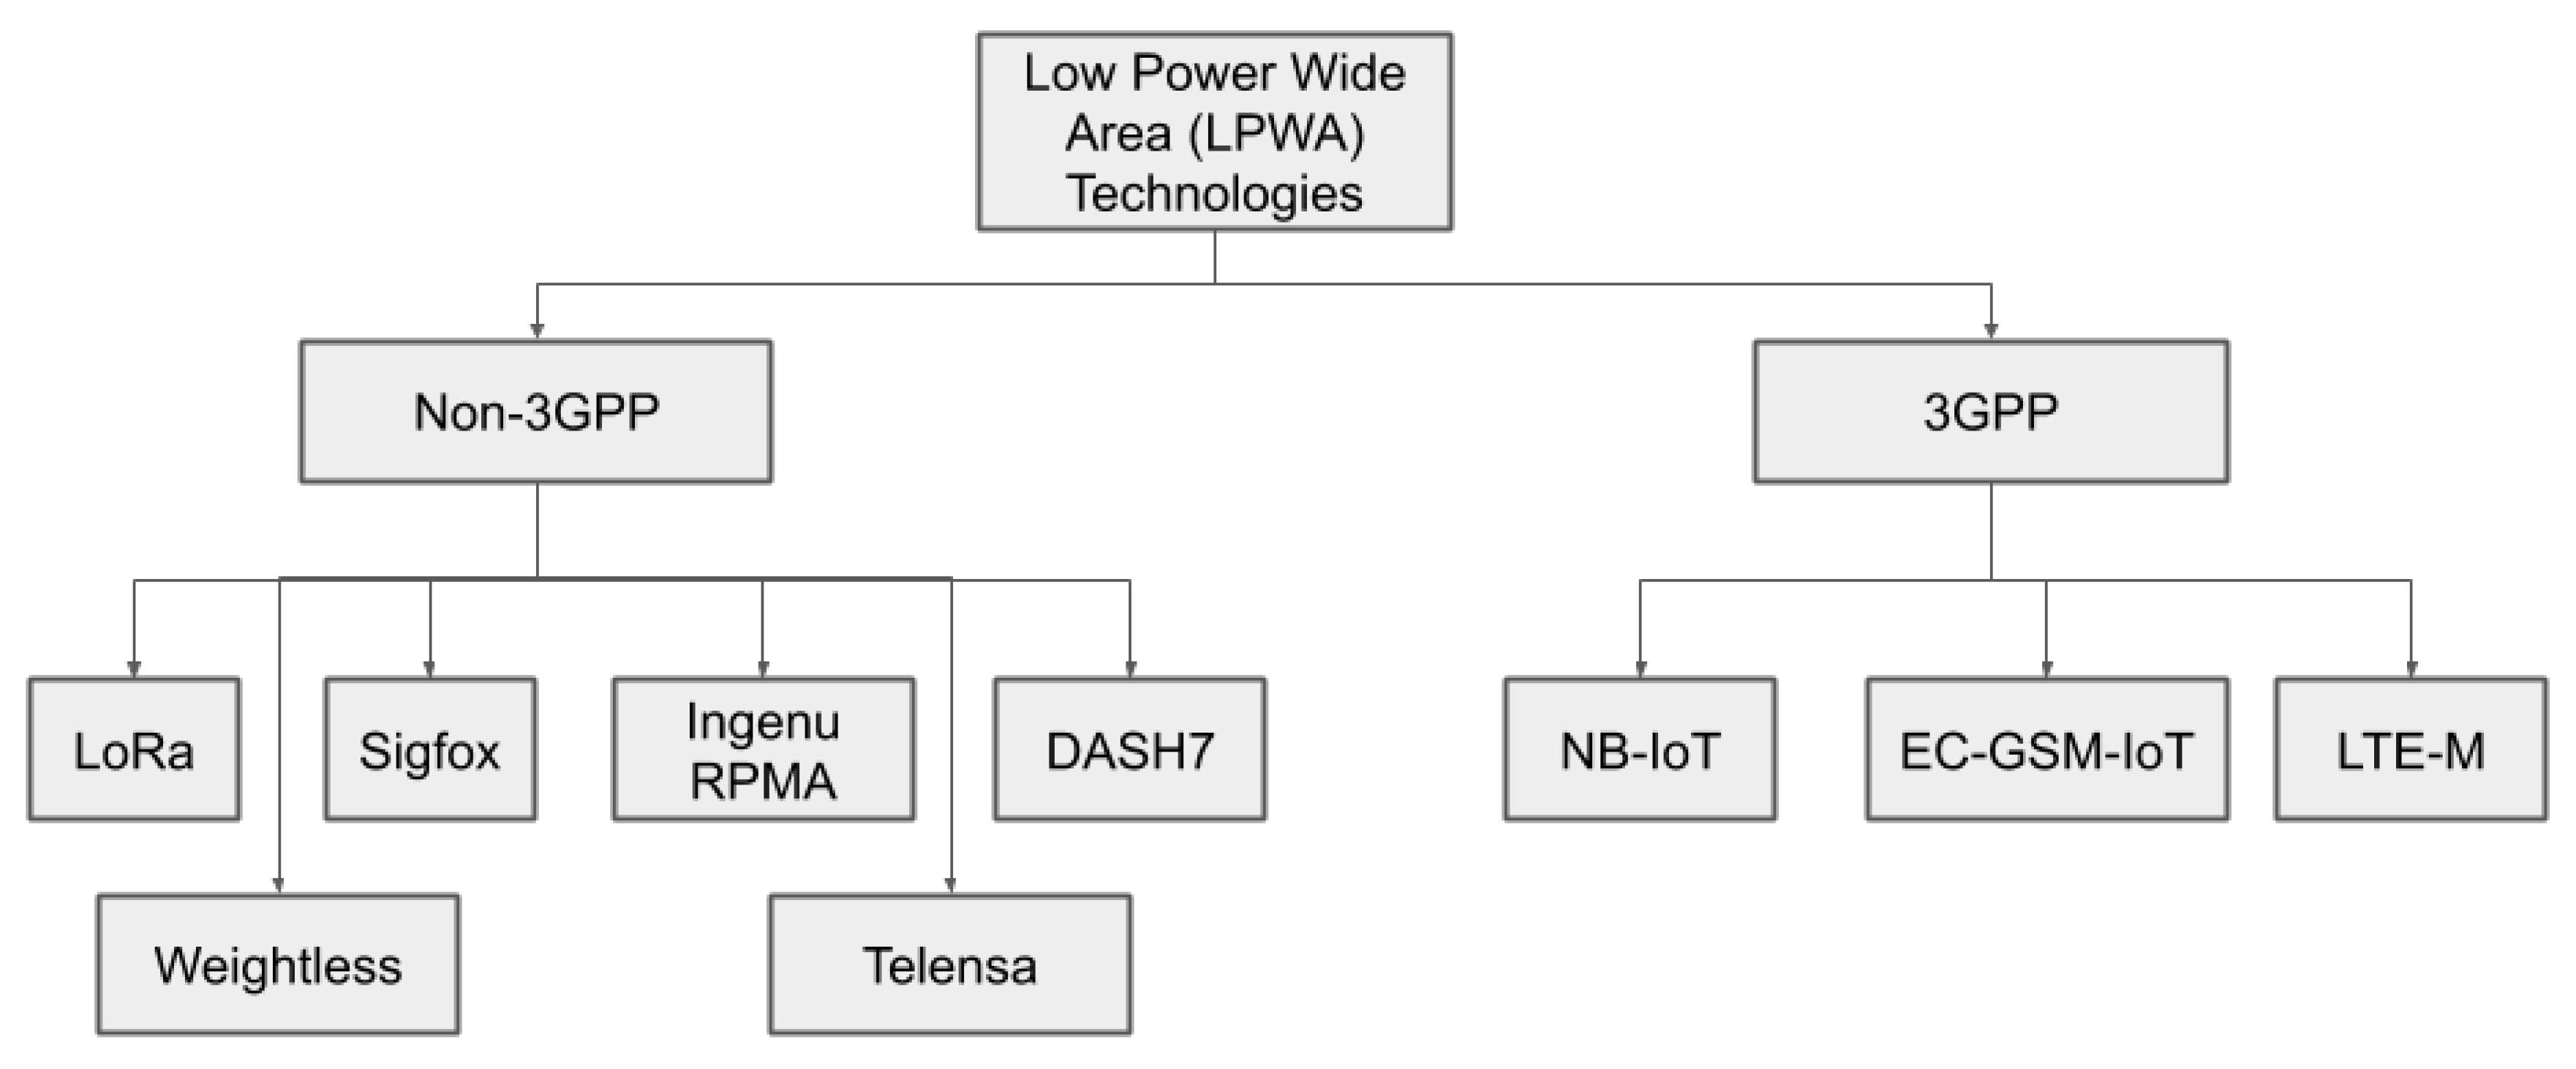
2.1. LPWAN Technologies for Smart Agriculture and Wildlife Monitoring
Following the rapid IoT market expansion, LPWAN has become one of the faster-growing areas in IoT, especially for smart agriculture applications. The choice of a LPWAN technology is dependent on the specific application area and its specific requirements such as data rate, range, energy budget, frequency band, bidirectionality, network, cost, scalability, security, among others. The classification of existing LPWAN technologies is illustrated in Figure 1. The LPWAN technologies can be broadly classified into two categories, 3GPP technologies (e.g., NB-IoT, LTE-M-IoT, EC-GSM-IoT) and non-3GPP technologies (e.g., LoRa, Sigfox, Ingenu RPMA, DASH7). We only describe in detail LoRa and LoRaWAN, where other LPWAN technologies mentioned in Figure 1 are referenced in [11,12,21,22,23,24,25].
LoRa and LoRaWAN
LoRa has robustness over a long distance due to the chirp spreading spectrum (CSS), where the physical channel is logically separated by the spreading factors (SF) due to their orthogonality. The carrier frequency varies over a designated amount of time, thus achieving low power and long-range communication links [15]. A network structure based on LoRaWAN protocol consists of four individual layers, namely the end devices, the gateway, the network server and the application server. A brief description of each layer is highlighted below:
- End Nodes are devices embedded with LoRa chips. There are 3 classes of end-devices: Class A (for All), B (for Beacon) and C (for Continuously listening), each associated with a different operating mode. The devices broadcast their sensor values to all gateways in all range which forward data packets to a single network server over an IP based network.
- Gateways are intermediate devices running an operating system that forward data packets coming from the end nodes to a network server over an IP-based backhaul network. In a LoRaWAN deployment, there can be multiple gateways receiving data packets from a LoRa end device. Usually, LoRa gateways are publicly available and transparently connected to a cloud community service.
- Network Server performs a lot of functions, such as filtering redundant packets, performing an adaptive rate, performing security checks and generally managing the network.
- Application Server is responsible for the encryption, decryption, and processing of data from the network server. The application server allows users to access and manage the gateway, nodes and applications.
The LoRa technology is defined by the main parameters, which are spreading factor, bandwidth and code rate, which are configured to adapt to the working scenario. We briefly describe each parameter below:
- Bandwidth (BW) is the range of transmission frequencies varying between 7.8 kHz and 500 kHz. The greater the bandwidth value is, the more the transmitted data, thus reducing transmission time and resulting in lower sensitivity.
- Spreading factor (SF) characterizes the number of bits sent in each LoRa symbol. SF take values between 7 and 12 resulting in different time-on-air , thus, varying receiver sensitivity. Having a higher such as denotes a longer range with low bit rate and better receiver sensitivity. The relationship between the LoRa transmission and the used LoRa parameters is denoted as .
- Transmitted Power (TP): By default, the maximum effective isotropic radiated power (EIRP) for LoRa end-device operating in the 433 MHz and 868 MHz band are 12.15 dBm and 16 dBm respectively.
- Code rate (CR) is related to the number of redundant bits used to improve the packet error rate in the presence of noise and interference. In other words, LoRa provides forward error correction capability by adding extra redundant bits to improve the robustness of transmission. The possible values of are , , and . A lower coding rate results in greater robustness at the expense of increased transmission time and high energy consumption. The resulting bit rate equation is given bywhere i takes on values between 1 to 4 in increment steps of 1. The noise floor is given byFor a channel bandwidth of 125 KHz and , this translates to a figure of dBm. Table 1 presents the LoRa main configuration parameters. It is worth noting that different combinations of the aforementioned transmission parameters yield different trade-offs with respect to the range and data rate that can be achieved, and these combinations are also governed by regulatory constraints.
A LoRa frame starts with a preamble, mainly used for synchronization purposes, then followed by an explicit header, a payload, and cyclic redundancy check (CRC), as shown in Figure 2. LoRa frame format can be either implicit or explicit, where explicit packet includes a short header containing information about the bytes, CRC and coding rate used in the frame. LoRa MAC layer is basically an ALOHA protocol, controlled by the network server. Significantly, the gateway can receive from multiple end devices simultaneously. Vangelista [26] pointed out that a LoRa gateway can simultaneously receive data by 9 devices, due to the orthogonality of transmission sub-bands and quasi-orthogonality of the spreading factors. Moreover, the end devices have to respect the regulatory restrictions with a duty cycle of less than e.g., 1% in each of the European (EU) 868 MHz bands.
2.2. Related Works
In this section, we briefly discuss some related deployments of smart agriculture based on LPWAN technology. Next, related works on LoRa signal propagation are presented in this section.
There have been several studies on LPWAN technologies applied to smart agriculture applications. LoRa and LoRaWAN occupy the majority of the smart agriculture applications deployment in the literature compared to other LPWAN technologies. This is hardly surprising given the open nature of the LoRa/LoRaWAN specification and availability of off-the-shelf hardware that can be leveraged for experimental research and rapid prototyping.
LoRa communication has gained momentum in smart agriculture applications by the scientific community and the industry in recent years. Davcev et al. [27] presented an innovative, power efficient and highly scalable IoT agricultural system based on LoRaWAN network for environmental monitoring in a grape farm. Studies in [28,29,30,31] also followed a similar approach by utilizing LoRa technology for environmental monitoring on a farm. The authors in [32] investigated LoRaWAN for agriculture-based use cases, in terms of measuring the temperature of a horse stable and also analyzing the soil properties and testing the permeability of agricultural land. The use of LoRa for smart irrigation purposes has also been demonstrated in [33,34,35]. An IoT monitoring infrastructure to be used for the remote control of offshore sea farms based on LoRAWAN protocol was presented in [36]. The study in [37] demonstrated the use of LoRaWAN in greenhouses.
Sigfox, on the other hand, is the first LPWAN technology and it has been deployed in some countries for smart agriculture applications. The work in [38] presented the development of an autonomous Sigfox sensor node capable of transmitting data collected by a range of sensors in a vineyard, in order to collect meteorological parameters directly to the cloud. Other studies utilizing Sigfox technology for environmental monitoring have been demonstrated in [39,40].
The deployment of NB-IoT is another concerning issue, as it requires a hardware upgrade of the existing LTE infrastructure [41]. Despite this, there are several papers that have utilized NB-IoT technology for smart agriculture and wildlife monitoring purposes [42,43,44,45,46]. The authors in [43] proposed an NB-IoT system for collecting underground soil parameters in potato crops using a UAV-aided network. A real field trial for NB-IoT performance evaluation in rural areas for smart agriculture applications was also demonstrated in [42]. Good coverage performance was achieved compared with the general packet radio service (GPRS) standard. Studies in [44,45] demonstrated the use of NB-IoT technology in greenhouses. The authors in [46] developed a water quality monitoring system for aquaculture ponds based on NB-IoT technology. Other studies [47,48,49,50] elaborated on the deployment of Ingenu RPMA, EC-GSM-IoT, DASH7, Telensa for smart agriculture applications as summarized in Table 2.
In regards to LoRa signal propagation, there are a few works [17,51,52,53] that have studied the behaviour of LoRa in forest vegetation to the best of our knowledge. The authors in [17] presented an evaluation of LoRa in three different environments (urban, suburban and rural) to analyze their influence on propagation conditions and performance considering both dynamic and static conditions. The authors were able to achieve a coverage range of 6 km in the urban and suburban scenarios under adverse scenarios, while achieving 18 km coverage in the open rural scenario. In [51], LoRa performance in a mountainous environment was demonstrated. Their results introduced the effect of high temperature, which deteriorates the signal, thus resulting in the reduction of the communication range by an order of magnitude, and the choice of antenna greatly impacted the quality of the signal. Authors in [52] demonstrated the behaviour of LoRa communication and its transmission range in dense urban and forest environments conducted in Brazil and Portugal. The longest range achieved in the dense-urban area was approximately 2.1 km, while results in the forest environments were inconclusive. Finally, Ferreira, Ana Elisa et al. [53] presented a signal propagation study of LoRa in forest, urban and suburban vehicular environments. The authors also considered node mobility, and the results showed how LoRa signal stability greatly depends on the environment and how much more stable it is in suburban areas than in high density urban areas.
In summary, whilst the surveyed studies are focusing on LPWAN performance for smart agriculture applications, and on the performance of LoRa in urban and suburban environments, more studies need to be carried out on hard natural environments such as dense forest environments. Such experimental deployment studies are needed to provide meaningful insight in providing a suitable propagation model for forest environments. In this study, we propose to explore the performance of a LoRa-based IoT network deployed in a forest vegetation area. The present work differs from the aforementioned literature, as it investigates the propagation of LoRa in the forest environments operating in the 433 MHz and 868 MHz frequency bands.
3. System Architecture
In this section, the overall system architecture is presented (see Figure 3). Next, the new prototype device used for the experimental test is also described.
3.1. System Description
The repeller system is an IoT device, which provides animal detection and repelling capabilities through the usage of a PIR sensor and an ultrasound generator respectively. The IoT device board uses an ATSAMD21G18A [54] 32-bit ARM Cortex® M0+ core architecture clocked at 48 MHz and paired with 32 kB of RAM and 256 kB of flash. It also integrates the RN2483A LoRa module supported by the LoRaWAN. All the pins of the micro-controller are exposed, allowing a developer to interface sensors and actuators over digital and analog interfaces. Moreover, the device is equipped with a PIR sensor to detect targets and activate animal repelling function. The power of the ultrasound produced by the tweeter is 110 dB at about ∼1 m, in a wide band of 18 kHz–27 kHz. Frequencies can be tuned according to the animal to repel. To transmit, process and store the information retrieved from the devices, we used a proxy software that collects the “activities”, i.e., animal detected events, and transmits this information via LoRa first to the LoRa gateway, and then to the back-end system. Monitoring data about the status of IoT devices are periodically generated and transmitted via a LoRa gateway to the back-end cloud services. Figure 4 shows the sketch of the repeller board in (a) with the lid open and (b) in an enclosure. In order to conduct more LoRa transmission tests in the 433 MHz and 868 MHz frequencies band in respect to the [7], we provided a new contribution by introducing another prototype device that we designed and created for the experimental tests. The prototype is a packet generator integrated with LoRa module RN2483 for the LoRa transmission, which is the same LoRa module for the repeller device. Section 3.2 provides in detail the description of the new prototype device.
3.2. LoRa Field Packet Generator
This section briefly presents the key requirements in realizing the prototype device. The hardware realization is also presented in this section.
3.2.1. Key Requirements
The first requirement emerging from the description of the experimental setup is a transportable packet generator capable of stand-alone operation for easy field deployment. The packet generator includes a display and a set of buttons to implement a simple user interface for controlling the settings and operations without a PC connection. The user interface should be able to access the selection of LoRa physical layer key parameters (SF, BW, CR, frequency) and the software has to implement routines to generate bursts of LoRa frames, with the ability to choose, in compliance with Duty Cycle legal limits, how many packets to send, and with which interval. The device must also be able to switch between the EU433 MHz and EU868 MHz for easy comparison. All these requirements are necessary for easy field deployment. Our LoRa field packet generator differs from the off-the-shelf solution due to its portability, open source abilities, fully configurable, easy switch between the 433 MHz and the 868 MHz frequency bands. Our device is also protected by an enclosure with an internal protection 65 (IP65) rating.
3.2.2. Hardware Realization
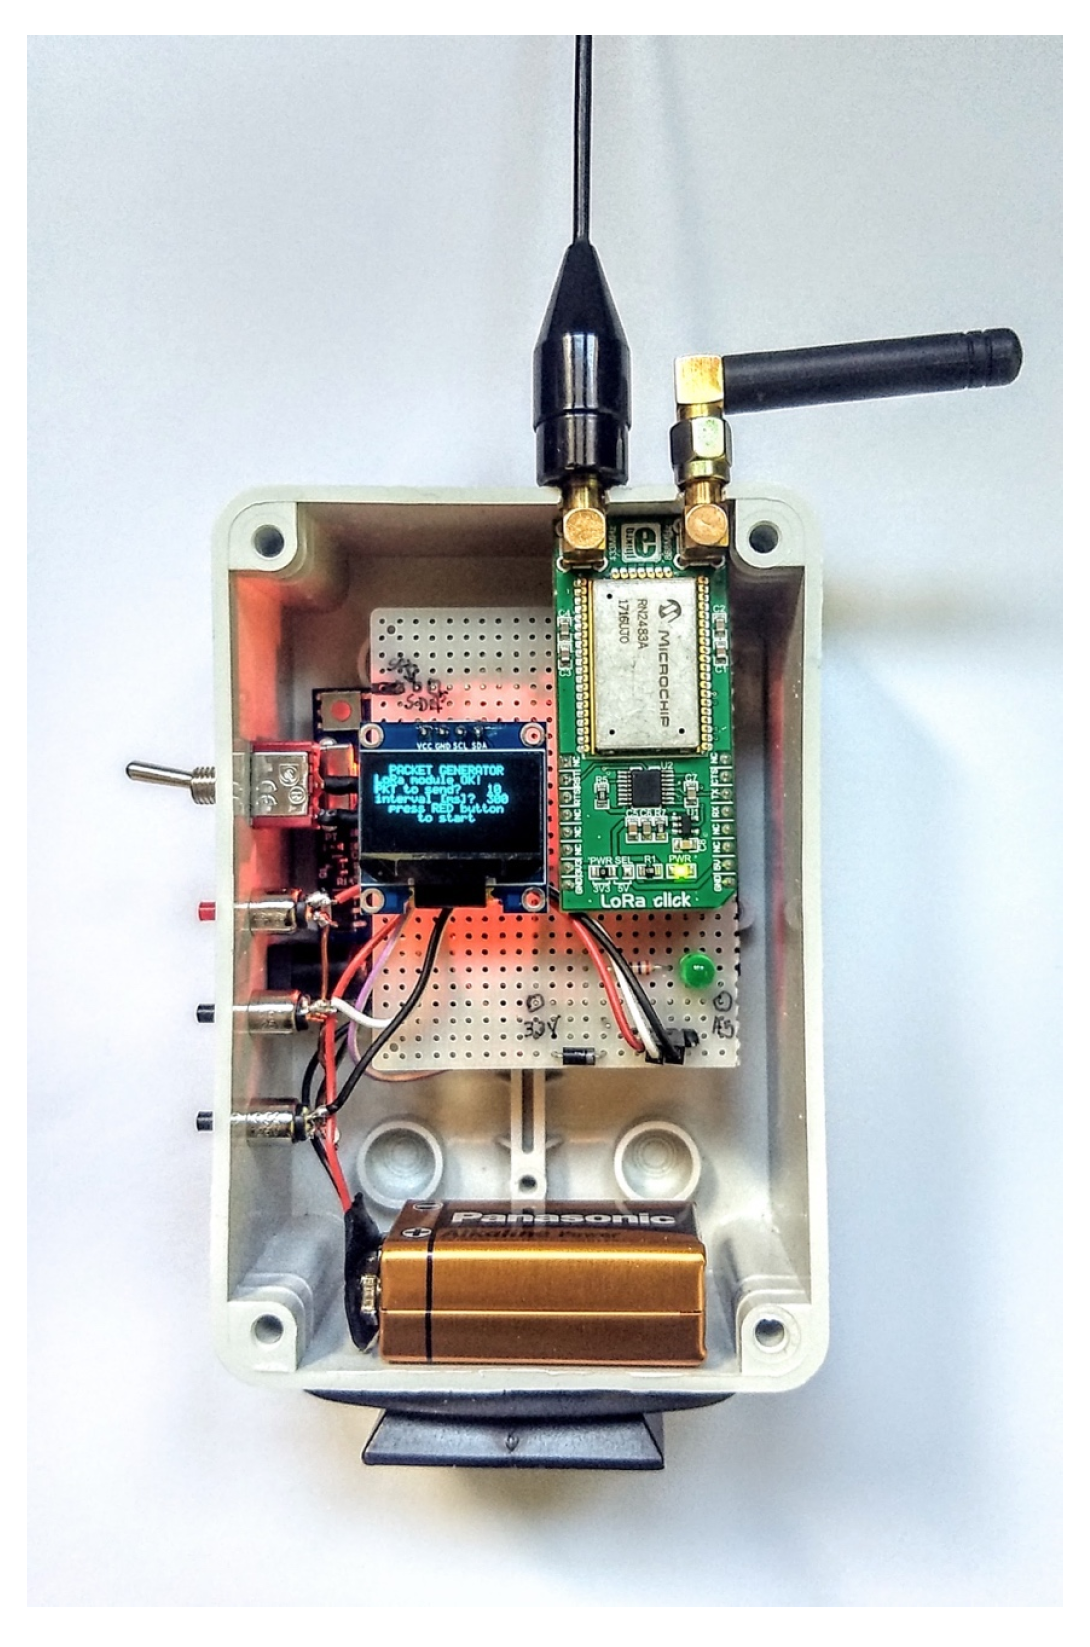
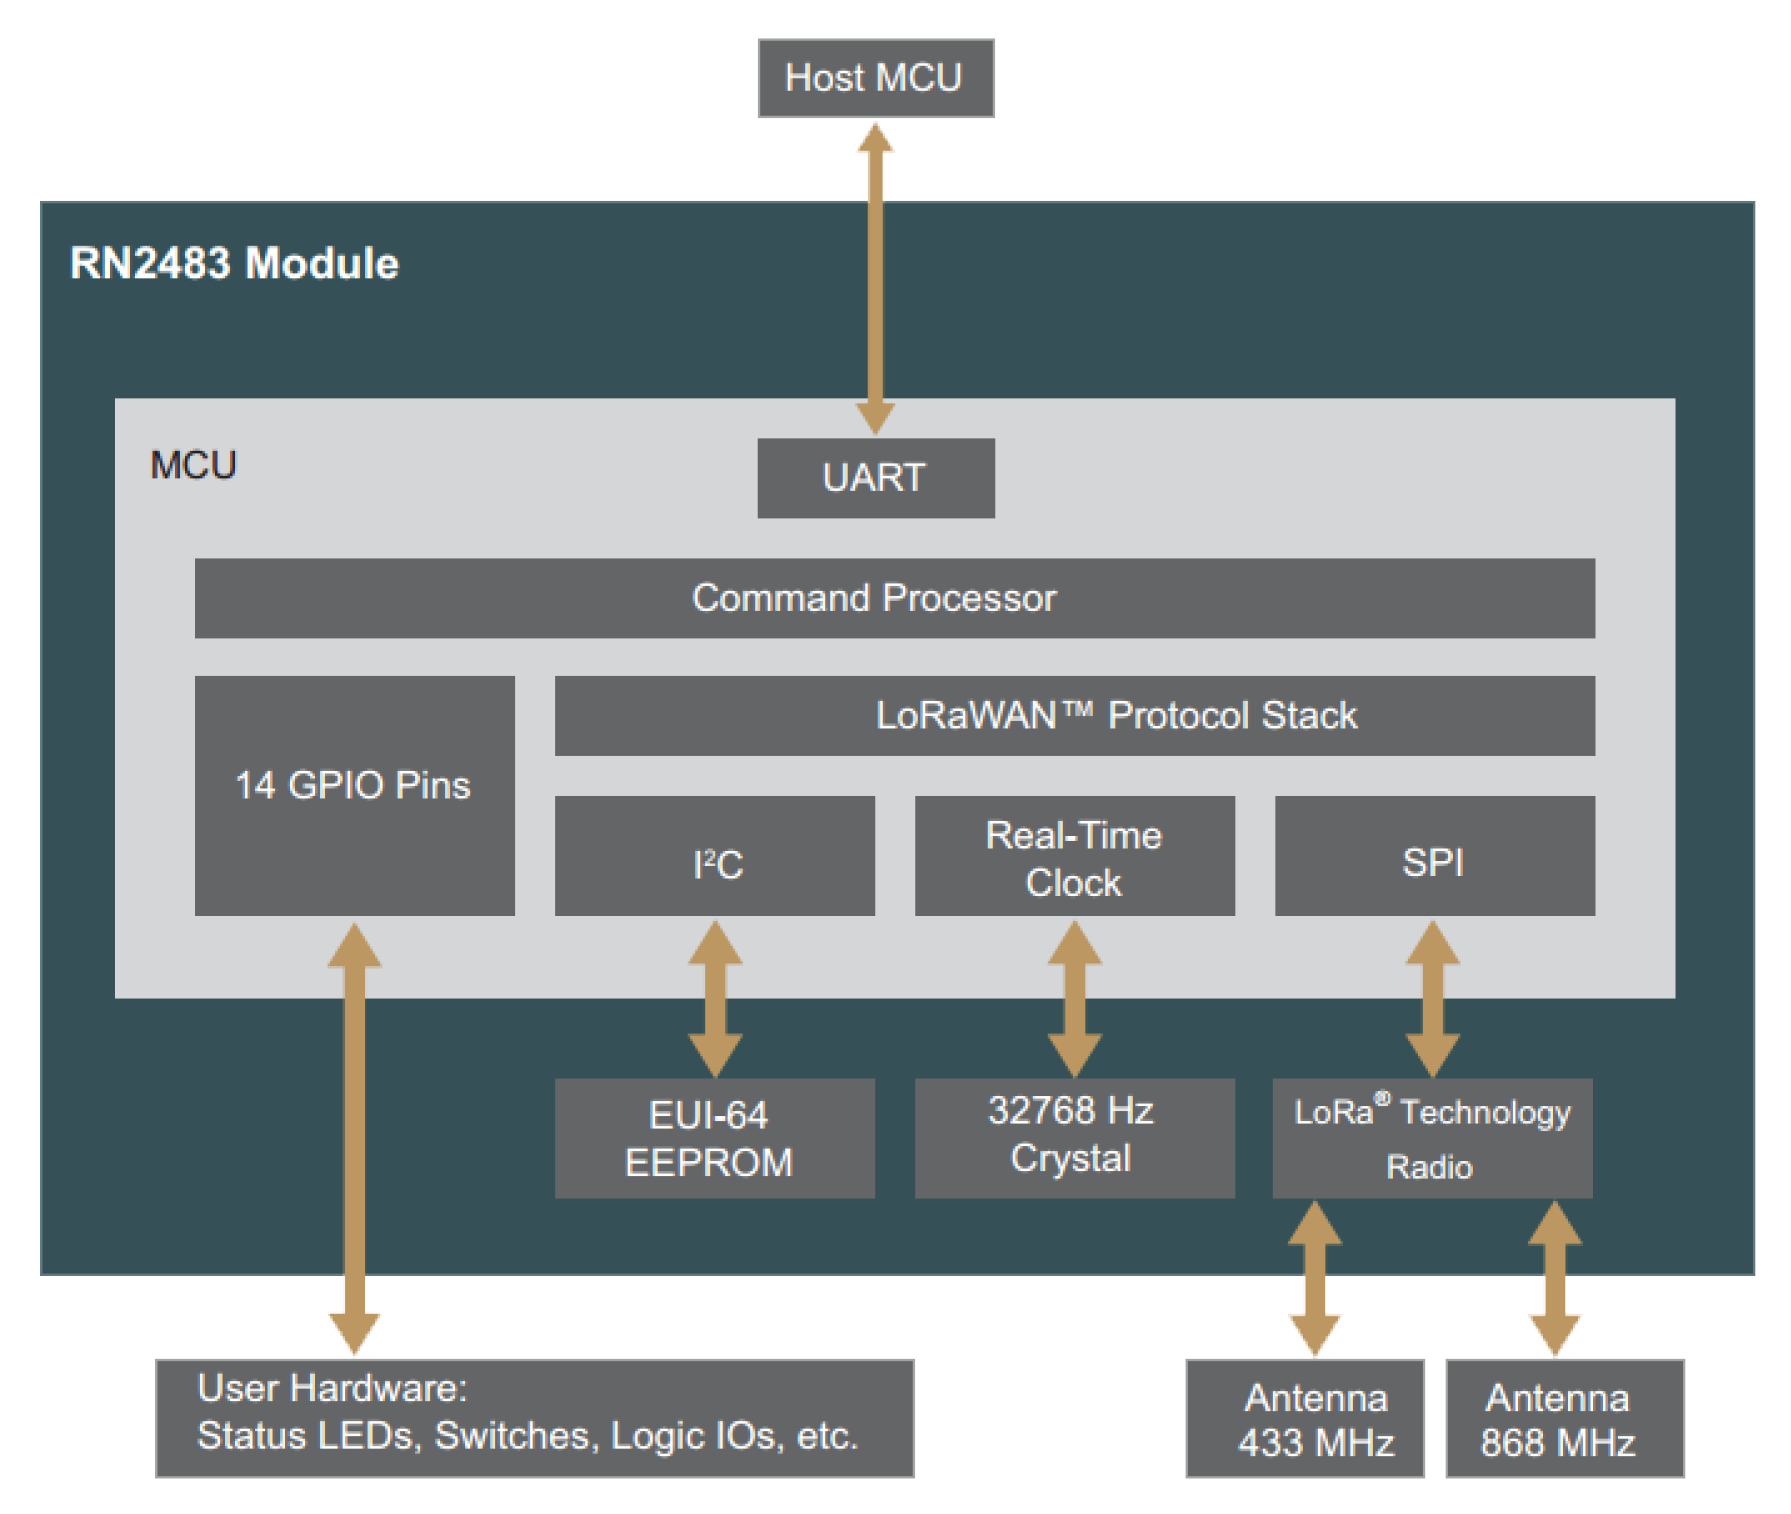
The packet generator is built around an ATSAMD21G18A, a 32-bit ARM Cortex® M0+ microcontroller by Microchip clocked at 48 MHz and paired with 32 kB SRAM Memory and 256 kB in-system self-programmable Flash. It also includes six serial communication modules (SERCOM) configurable as UART/USART, SPI or I2C, three 16-bit timer/counters, 32-bit real-time clock and calendar, 20 PWM channels, one 14-channel 12-bit ADC, one 10-bit DAC. The prototype device integrates a LoRa RN2483 radio module, a low-power long range transceiver operating in the 433 MHz and 868 MHz frequency bands for its communication. The LoRa module by microchip embeds a SX1276 transceiver, but also a MCU, by making available, through simple AT commands, the setting of PHY layer parameters and the ABP/OTAA registration methods necessary to join LoRaWAN infrastructures. In this way, the ATSAMD21G18A is only responsible for generating packets and handling the user interface via graphic display or USB connection to a terminal. The RN2483 is connected to the main microprocessor via a secondary UART on GPIO pins. Figure 5 shows the prototype device including the packet generator and the LoRa module, while Figure 6 presents the block diagram of the radio module.
4. Testbed and Experimental Setup
The experimental testbed deployment consists of a virtual fence of poles, where each pole is a full, autonomous, networked system. So far, the testbed consists of poles placed at different locations and deployed in the San Rossore Park in Pisa, Italy, which leverages the state-of-the-art LoRaWAN network technology. Focusing on the network performance of LoRa technology, we make use of the EU version of the RN2483 LoRa module, which operates in the 433 MHz and 868 MHz bands.
Monitoring data are transmitted from the prototype devices to the LoRa gateway in a periodic manner. We make use of a gateway embedded with LoRa capabilities that works in the 433 MHz and 868 MHz frequencies’ bands and placed at a height of 3 m, developed for outdoor use. The LoRa gateway is made up of the following hardware: a RAK831 LoRaWAN gateway, which operates in the 433 MHz and 868 MHz band. Such a gateway embeds a Semtech SX1301 LoRaWAN transceiver. The gateway is also equipped with a 4.15 dBi antenna for experimental measurements, performed both in the 433 MHz and 868 MHz frequency bands. The prototypes are placed at a height of 1.7 m above the ground.
The LoRa gateway device is placed at a fixed position during all the measurements, while the prototypes are deployed at different locations in the forest vegetation area, with the aim of covering different types of environments. The link measurements at each location are carried out sequentially with each prototype device and the LoRa gateway being configured with identical transmission parameters and cycling through various combination of different SF values with varying CR value alternating between and , and a constant value of 125 KHz for the bandwidth (BW) parameter. In this paper, the deployment focuses on LoRaWAN class A devices. The packet payload length is varied between 17 bytes, 37 bytes and 43bytes.
With respect to the LoRa RN2483 end node, we set the transmission power to 9.9 dBm and 10.4 dBm for the 433 MHz and 868 MHz bands, respectively. This transmitted power in the 433 MHz was set in order not to exceed the max EIRP for the 433 MHz frequency band, since we are utilizing an antenna whose gain is 2.15 dBi. The power used in the 868 MHz band was chosen consequently to guarantee the same system gain and have results comparable between the two bands. Table 3 briefly presents the RF specifications of the system used.
To plan the deployment, it is important to obtain some intuitions about the communication range of the different types of devices through some tests.
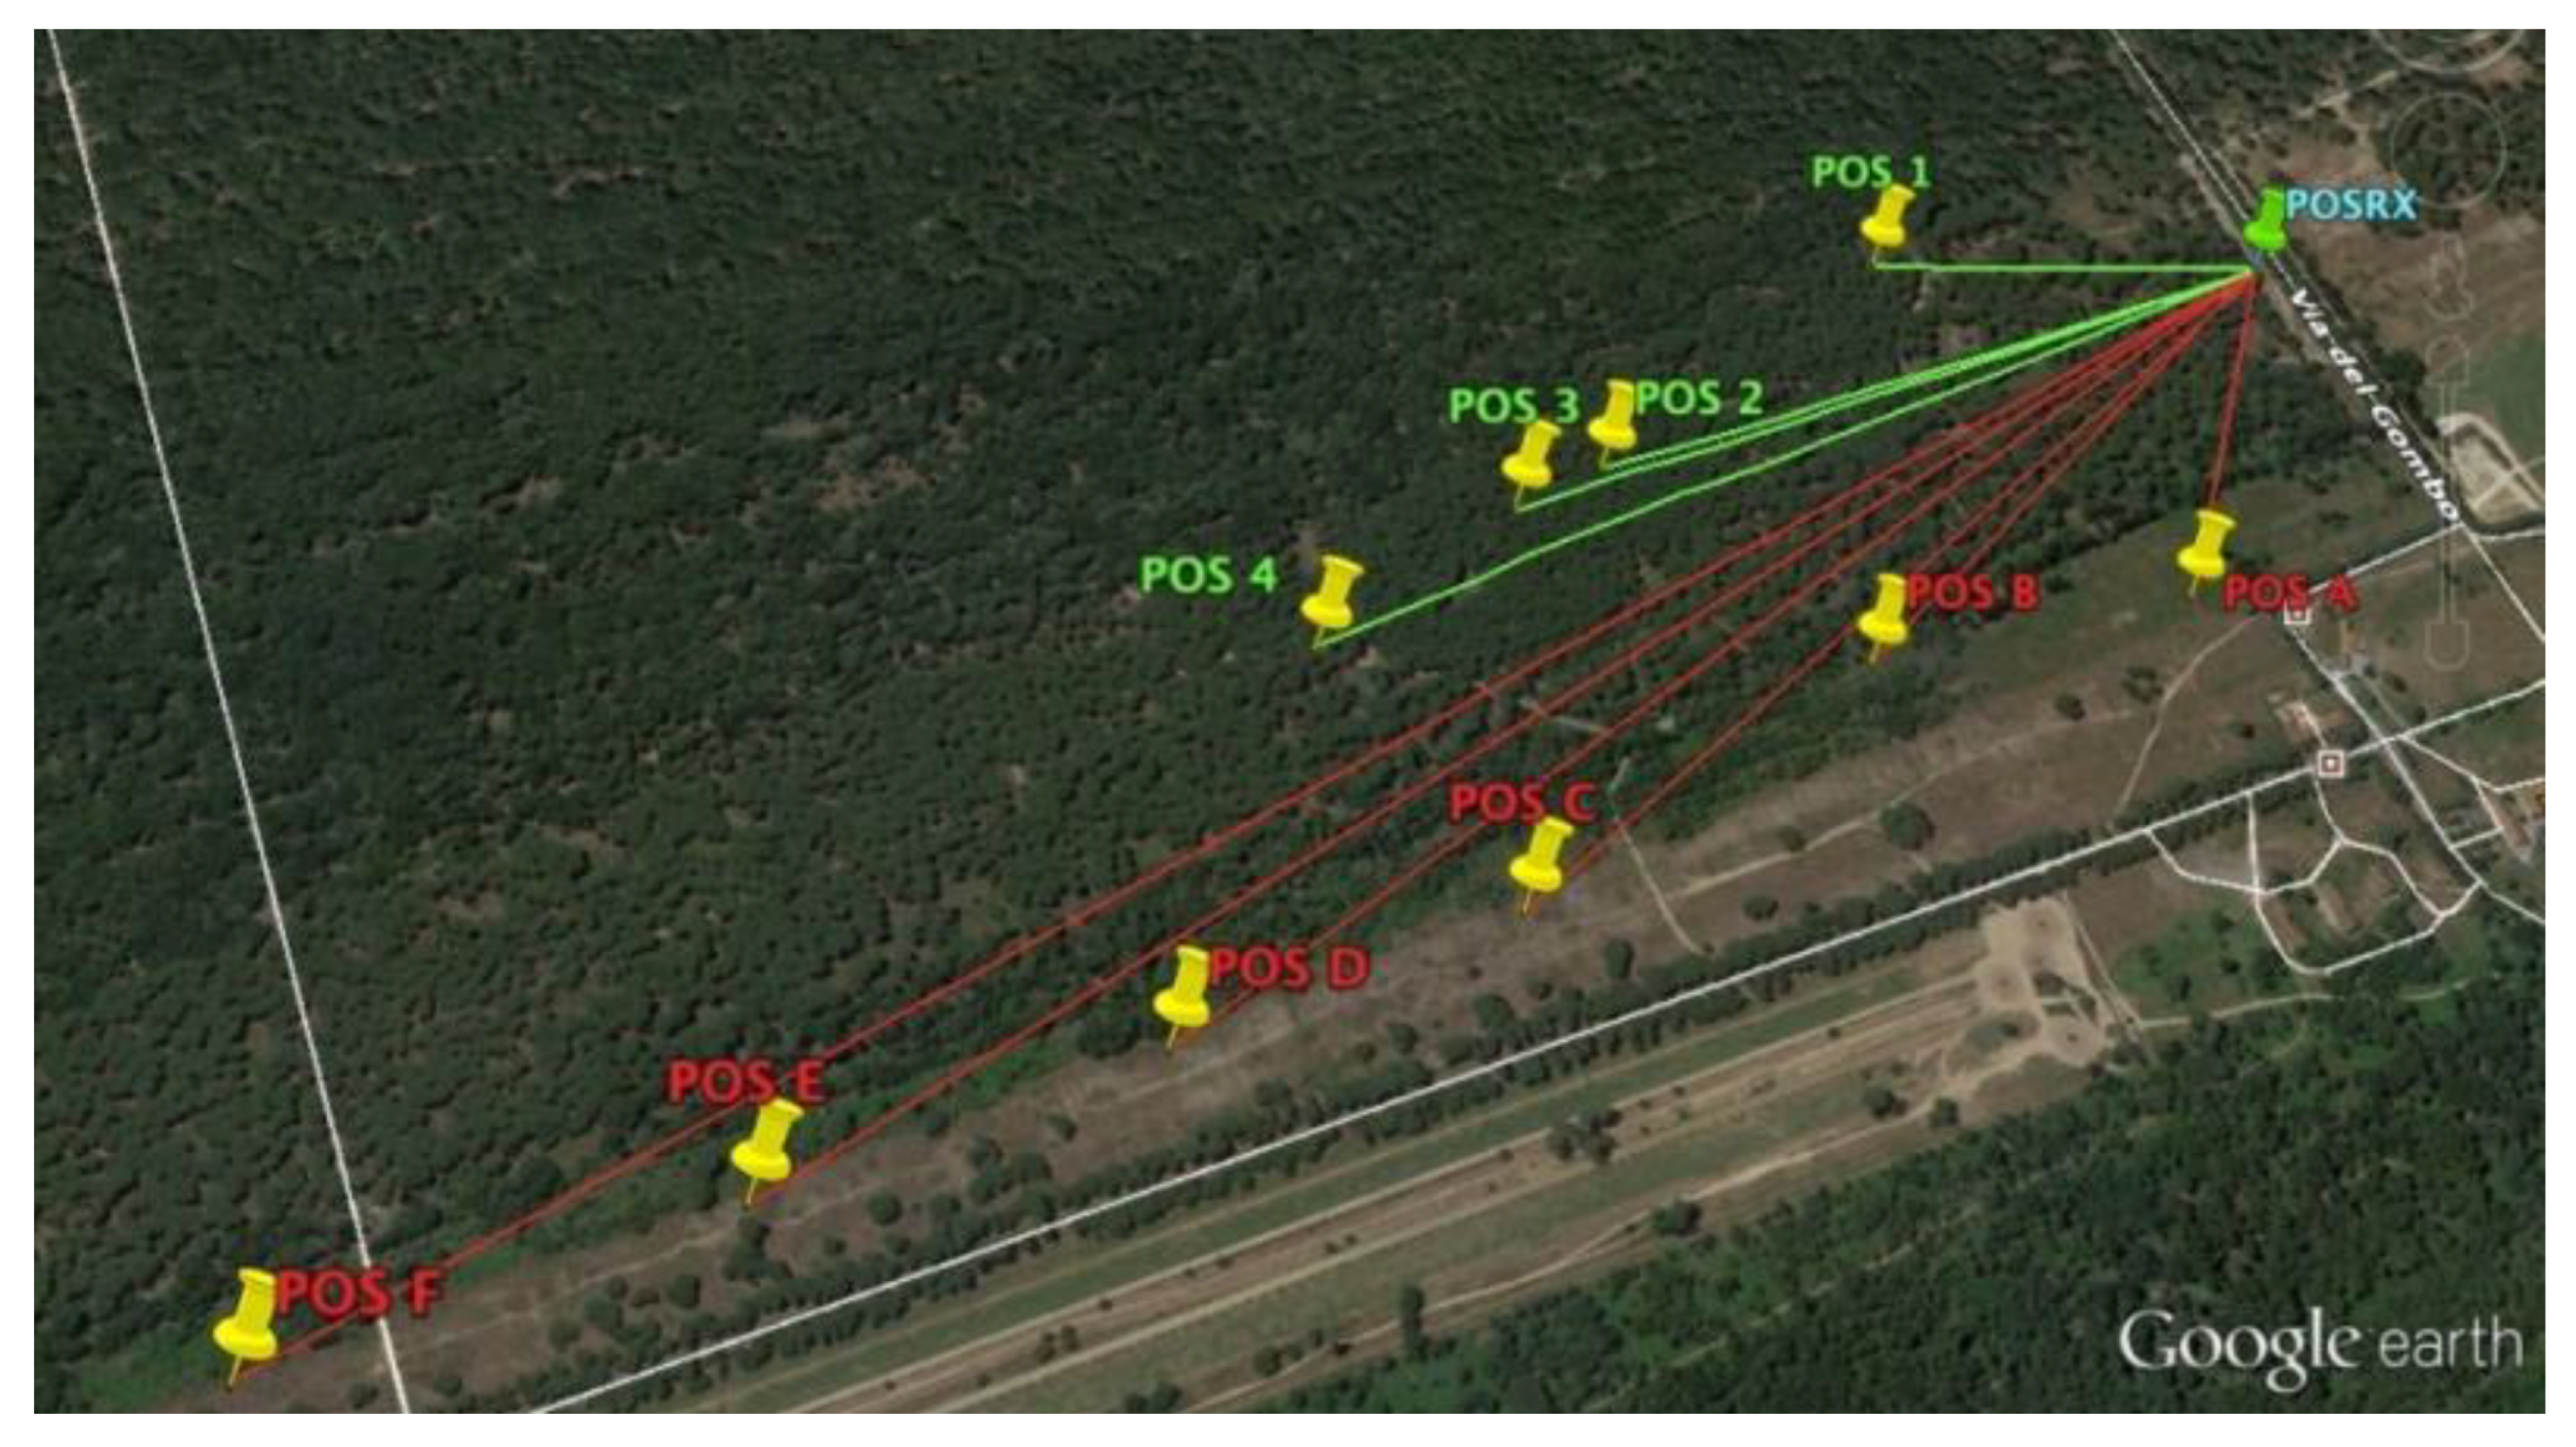
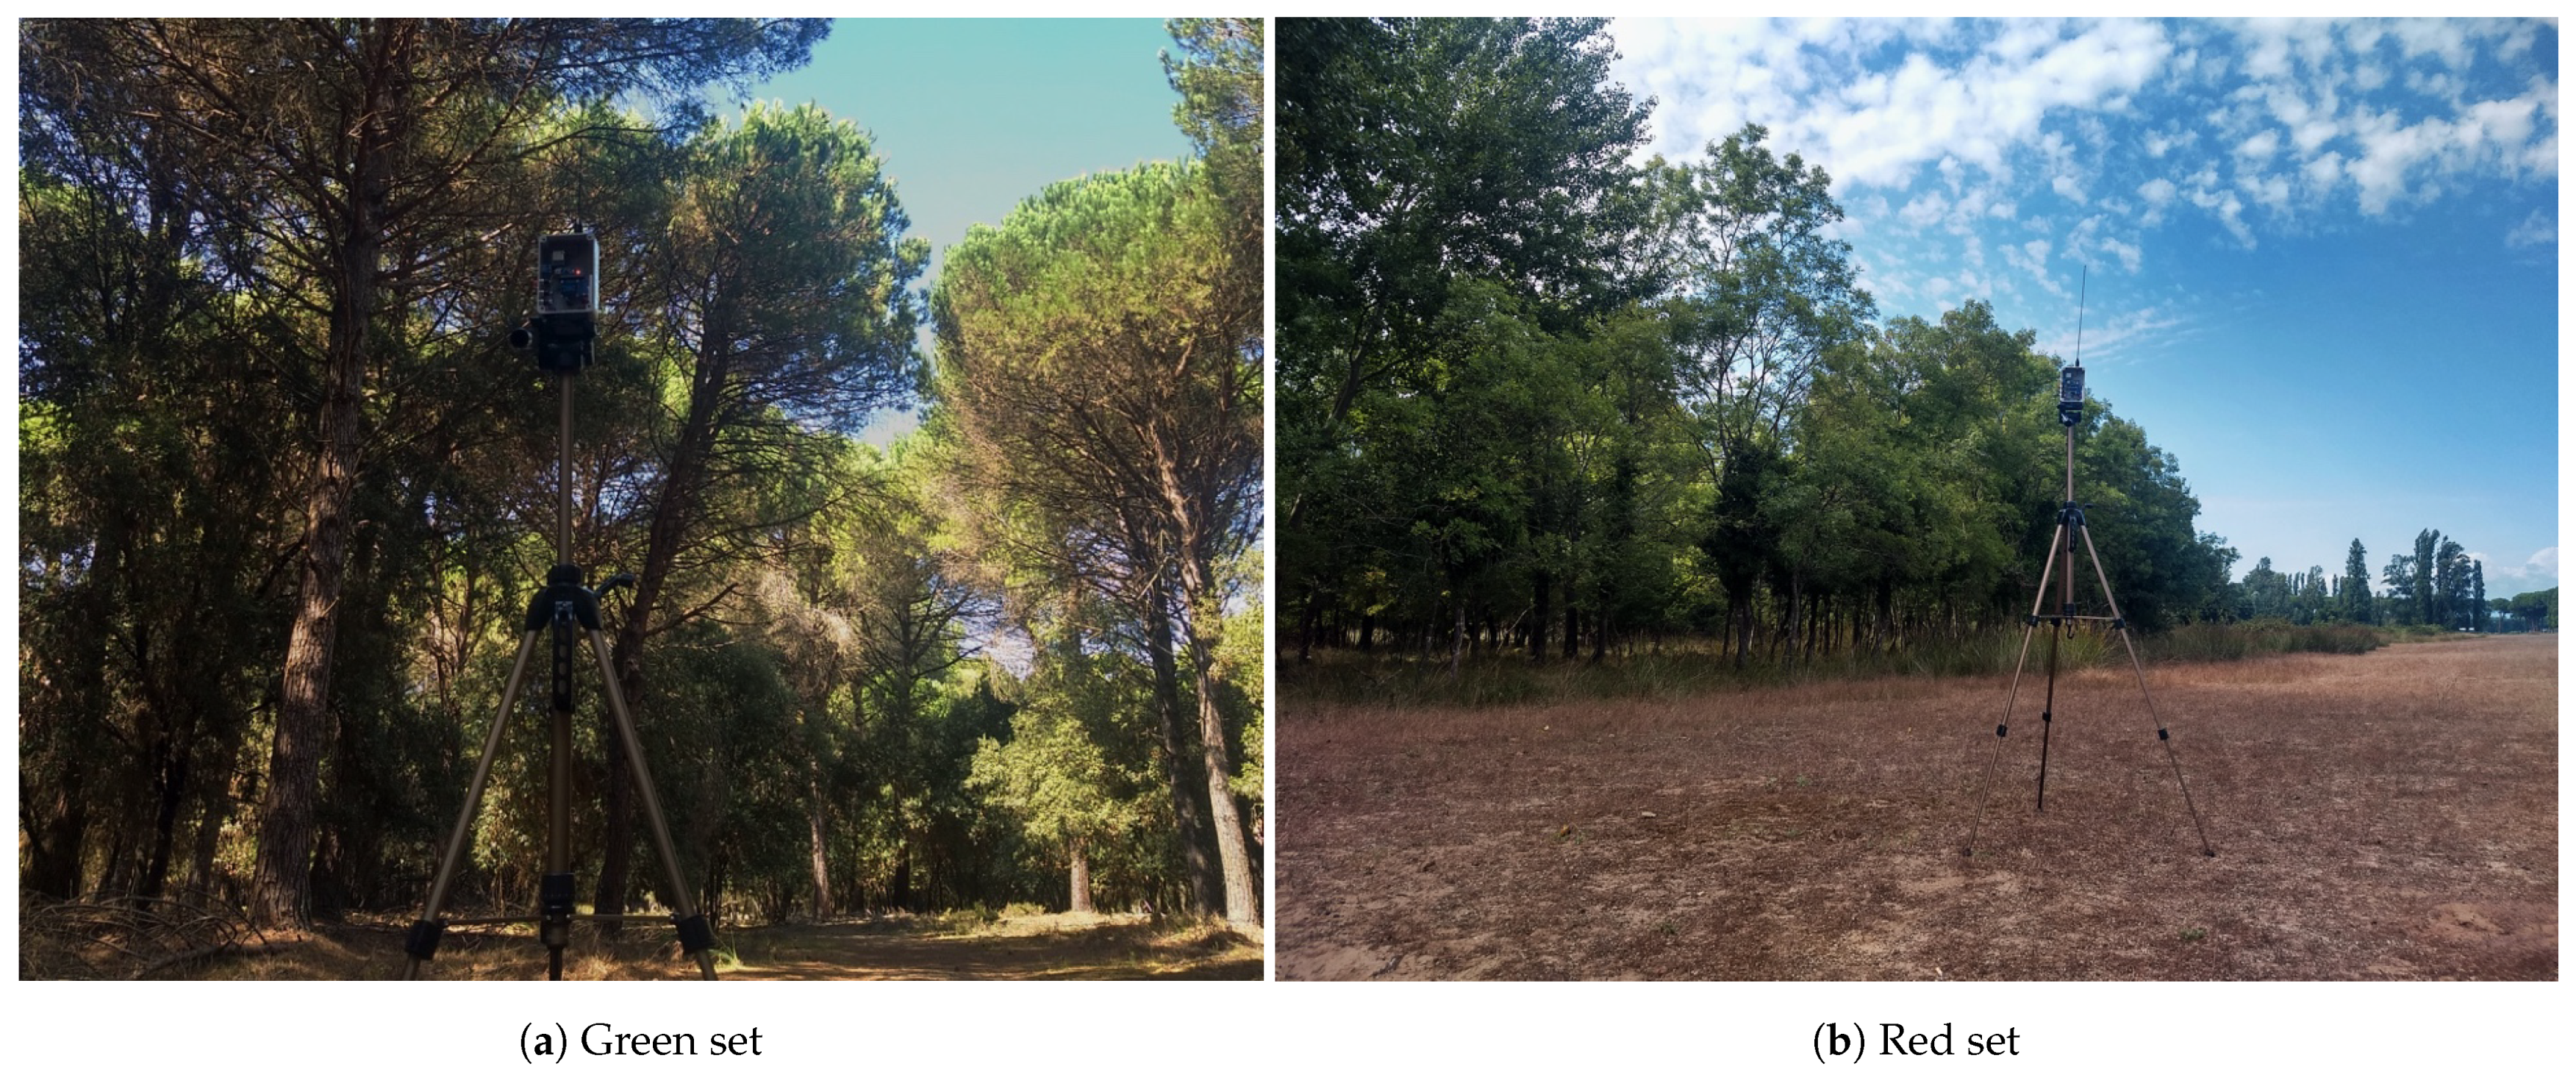
Figure 7 illustrates the topographical area of the San Rossore Park. Superimposed on Google Earth Pro are the devices and the gateway. The terrains in these locations are relatively flat and the vegetations consists mainly of oak and pine trees. The oak and pine trees are about 10 m and 20 m high, respectively. The map in Figure 7 shows the position of the gateway and the two sets of positions (distinguished by color) where transmissions were made. Figure 8a presents an example of the position in the green subset, where the view of the sky is almost obscured by the pine tree canopies, while Figure 8b shows the position of the red set where vegetation ends at about 20 m from the transmitter, reproducing the installation in the protection of a cultivated field. Table 4 shows the approximate straight line distance of the different endpoints from the gateway. The experiments performed were conducted during sunny and cloudy days with an average temperature of 25 °C and relative humidity in the 60–67% interval. In the short-term static scenario, for each configuration, 10 experiment runs are performed. Each experiment run consists in the transmission of a sequence of 300 packets.
5. Experimental Results and Discussion
The experimental results with analysis are presented, where discussion and result generalization are presented at the end of the section.
5.1. Experimental Results
Packet delivery ratio , received signal strength indicator and signal-to-noise ratio are the metrics selected to evaluate the performance of the LoRa transmission link. is calculated as the number of packets received by the gateway to the total number of packets sent, with a value of 1 implying 100% success and a value of 0 implying no success at all. Figure 7 and Table 4 show the approximate straight line distance of the positions with respect to the gateway. We investigate below the effects of the payload length, the and on the packet reception.
5.1.1. Effects of the Payload Length
Figure 9 presents the PDR as a function of the payload length with a constant SF12, and KHz in the 868 MHz frequency band. We can notice that the PDR curves are descending with increasing payload length, which demonstrates an impact of the packet length on the frame reception. To observe the shape of the curves better, Figure 9b presents the same data in the log scale to show the limit behaviour of the . In general, on wireless channels, is a function of the bit error rate and the packet length. The drops when the packet length increases. This assertion on the impact of packet length on the wireless channels corroborates with our LoRa experimental analysis depicted in Figure 9. We also notice that the shape of the PDR curves is different for each device depending on the position, as described in Table 4, which strongly impacts the channel quality. We can also observe that the device in POS B has a better PDR than the device in POS 2, despite the fact that the distance from both POS B and POS 2 is almost the same. The effect comes from the fact that POS 2 is placed in a much thicker vegetation area (in the green set area as described in Figure 7), which denotes more path loss and more possibility of the collision of our packets.
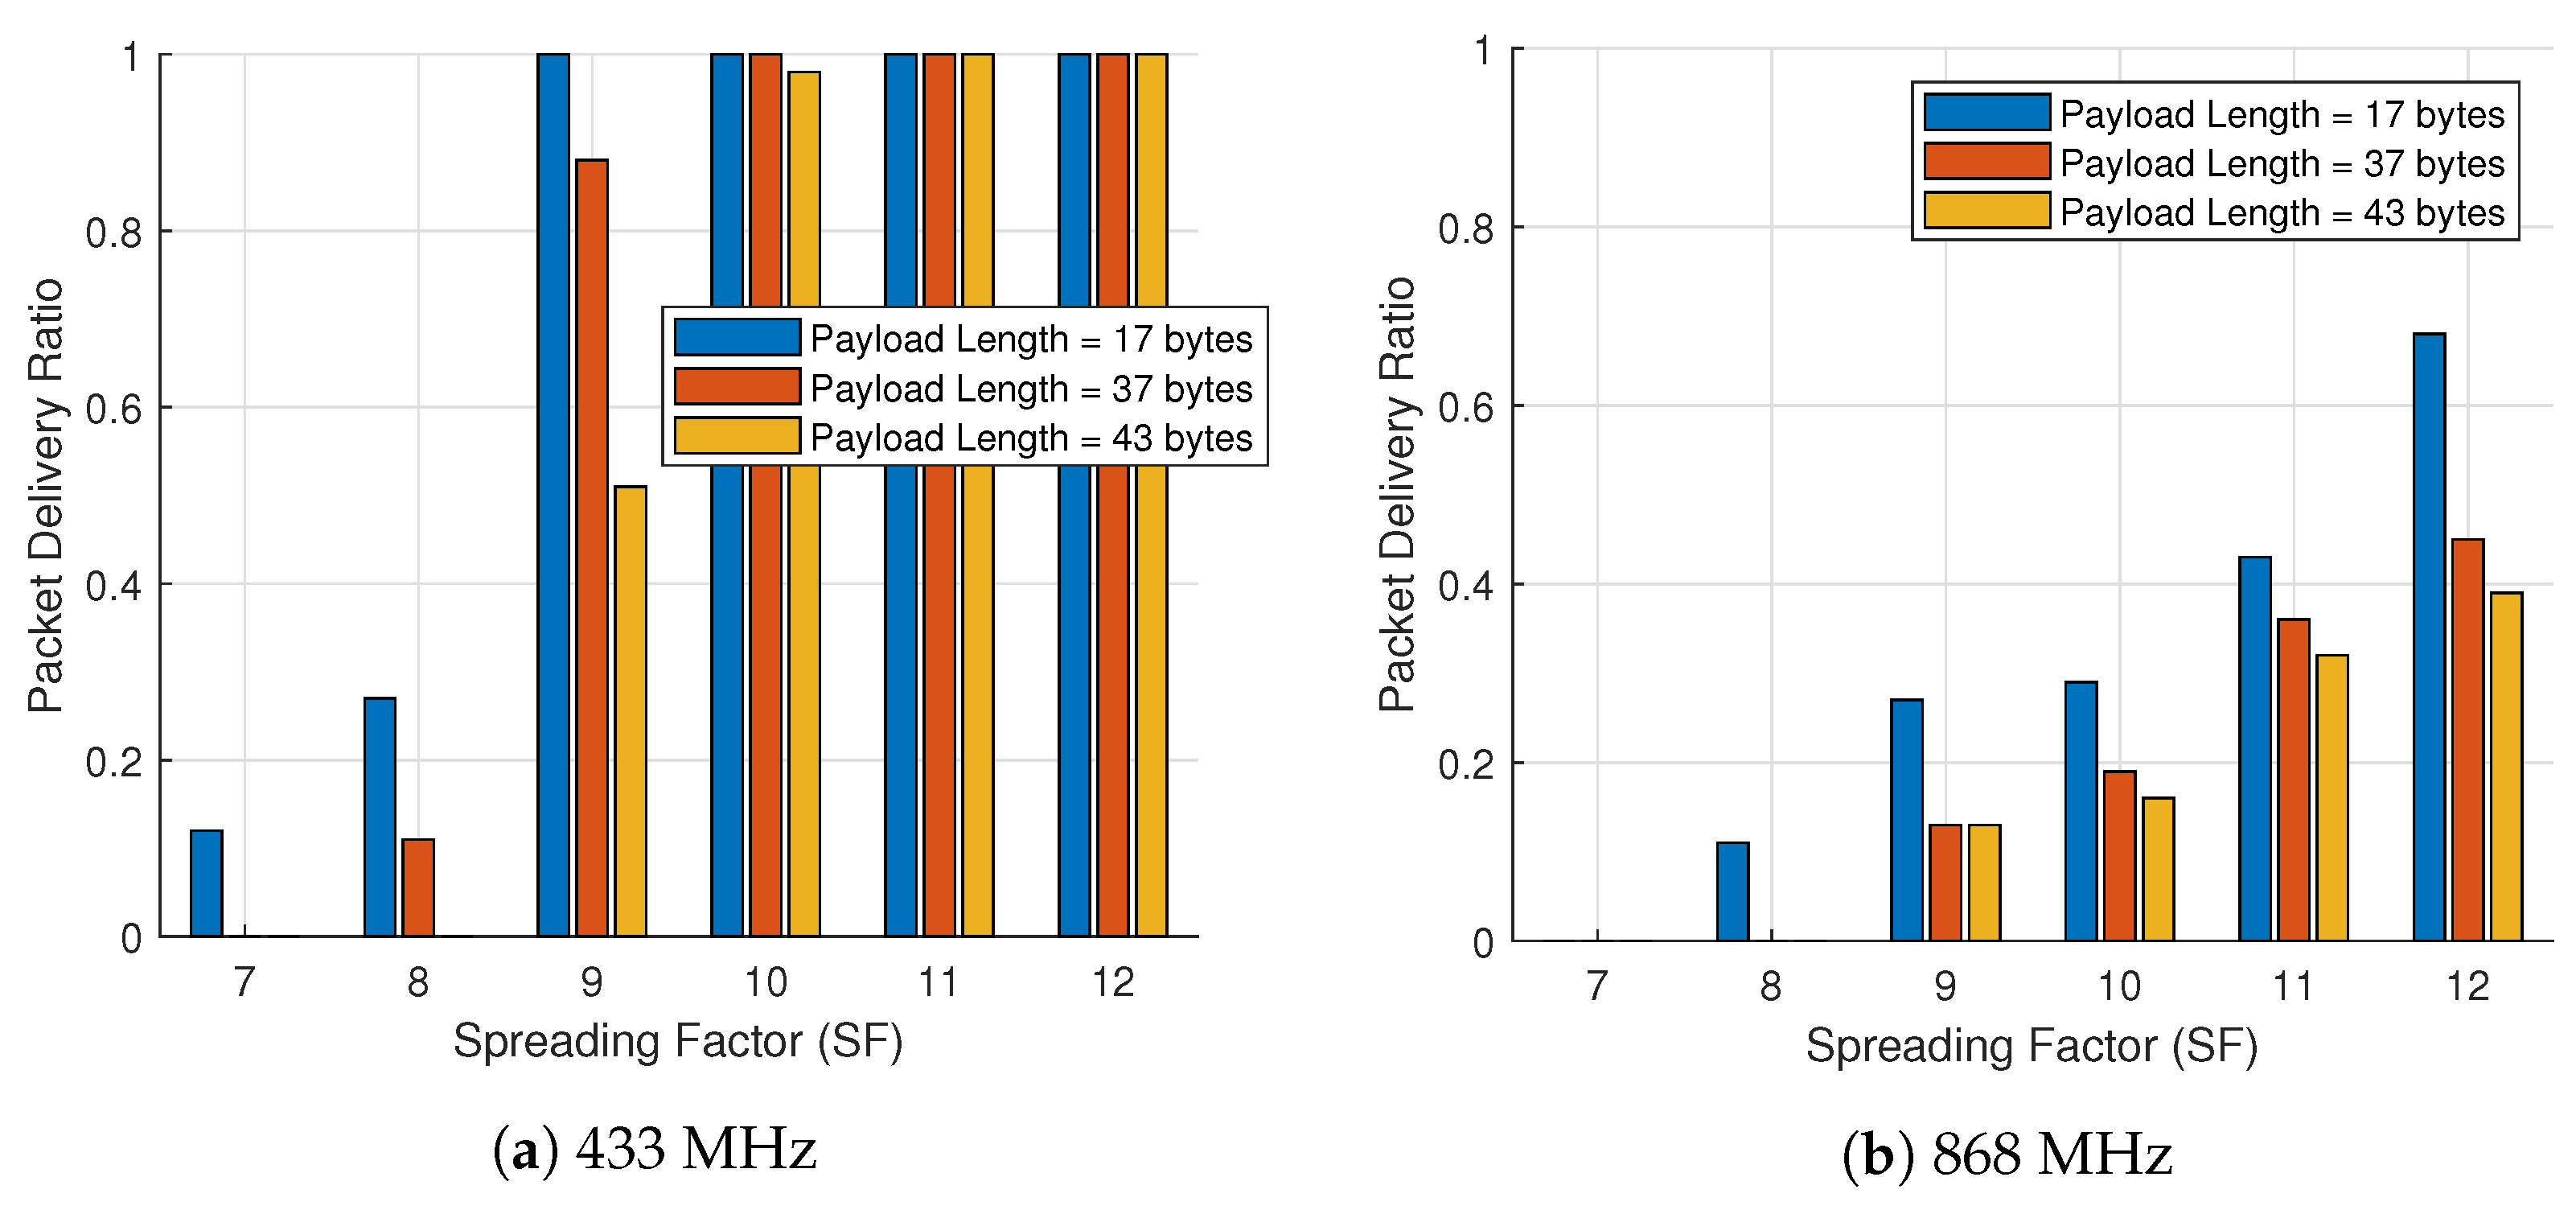
We present in Figure 10, the with different payload length in POS 2 operating in the 433 MHz and 868 MHz band for different and a constant . We draw up the following remarks: the decreases with increasing payload length. A larger number of symbols increases the probability to encounter channel attenuation variations, thus rejecting the reception of some symbols. In the case of higher (figure not presented), the trade-off is favourable because of the added redundancy; thereby, the problem is denoted by a slight reduction in the . From the figure presented, increasing the payload increases the number of symbols, which also increases the likelihood to encounter channel variation attenuation. In this case, symbols are rejected, bits are lost, the CRC fails and the whole packet is discarded, which leads to a severe reduction in the , and hence the performance.
5.1.2. Effects of the CR
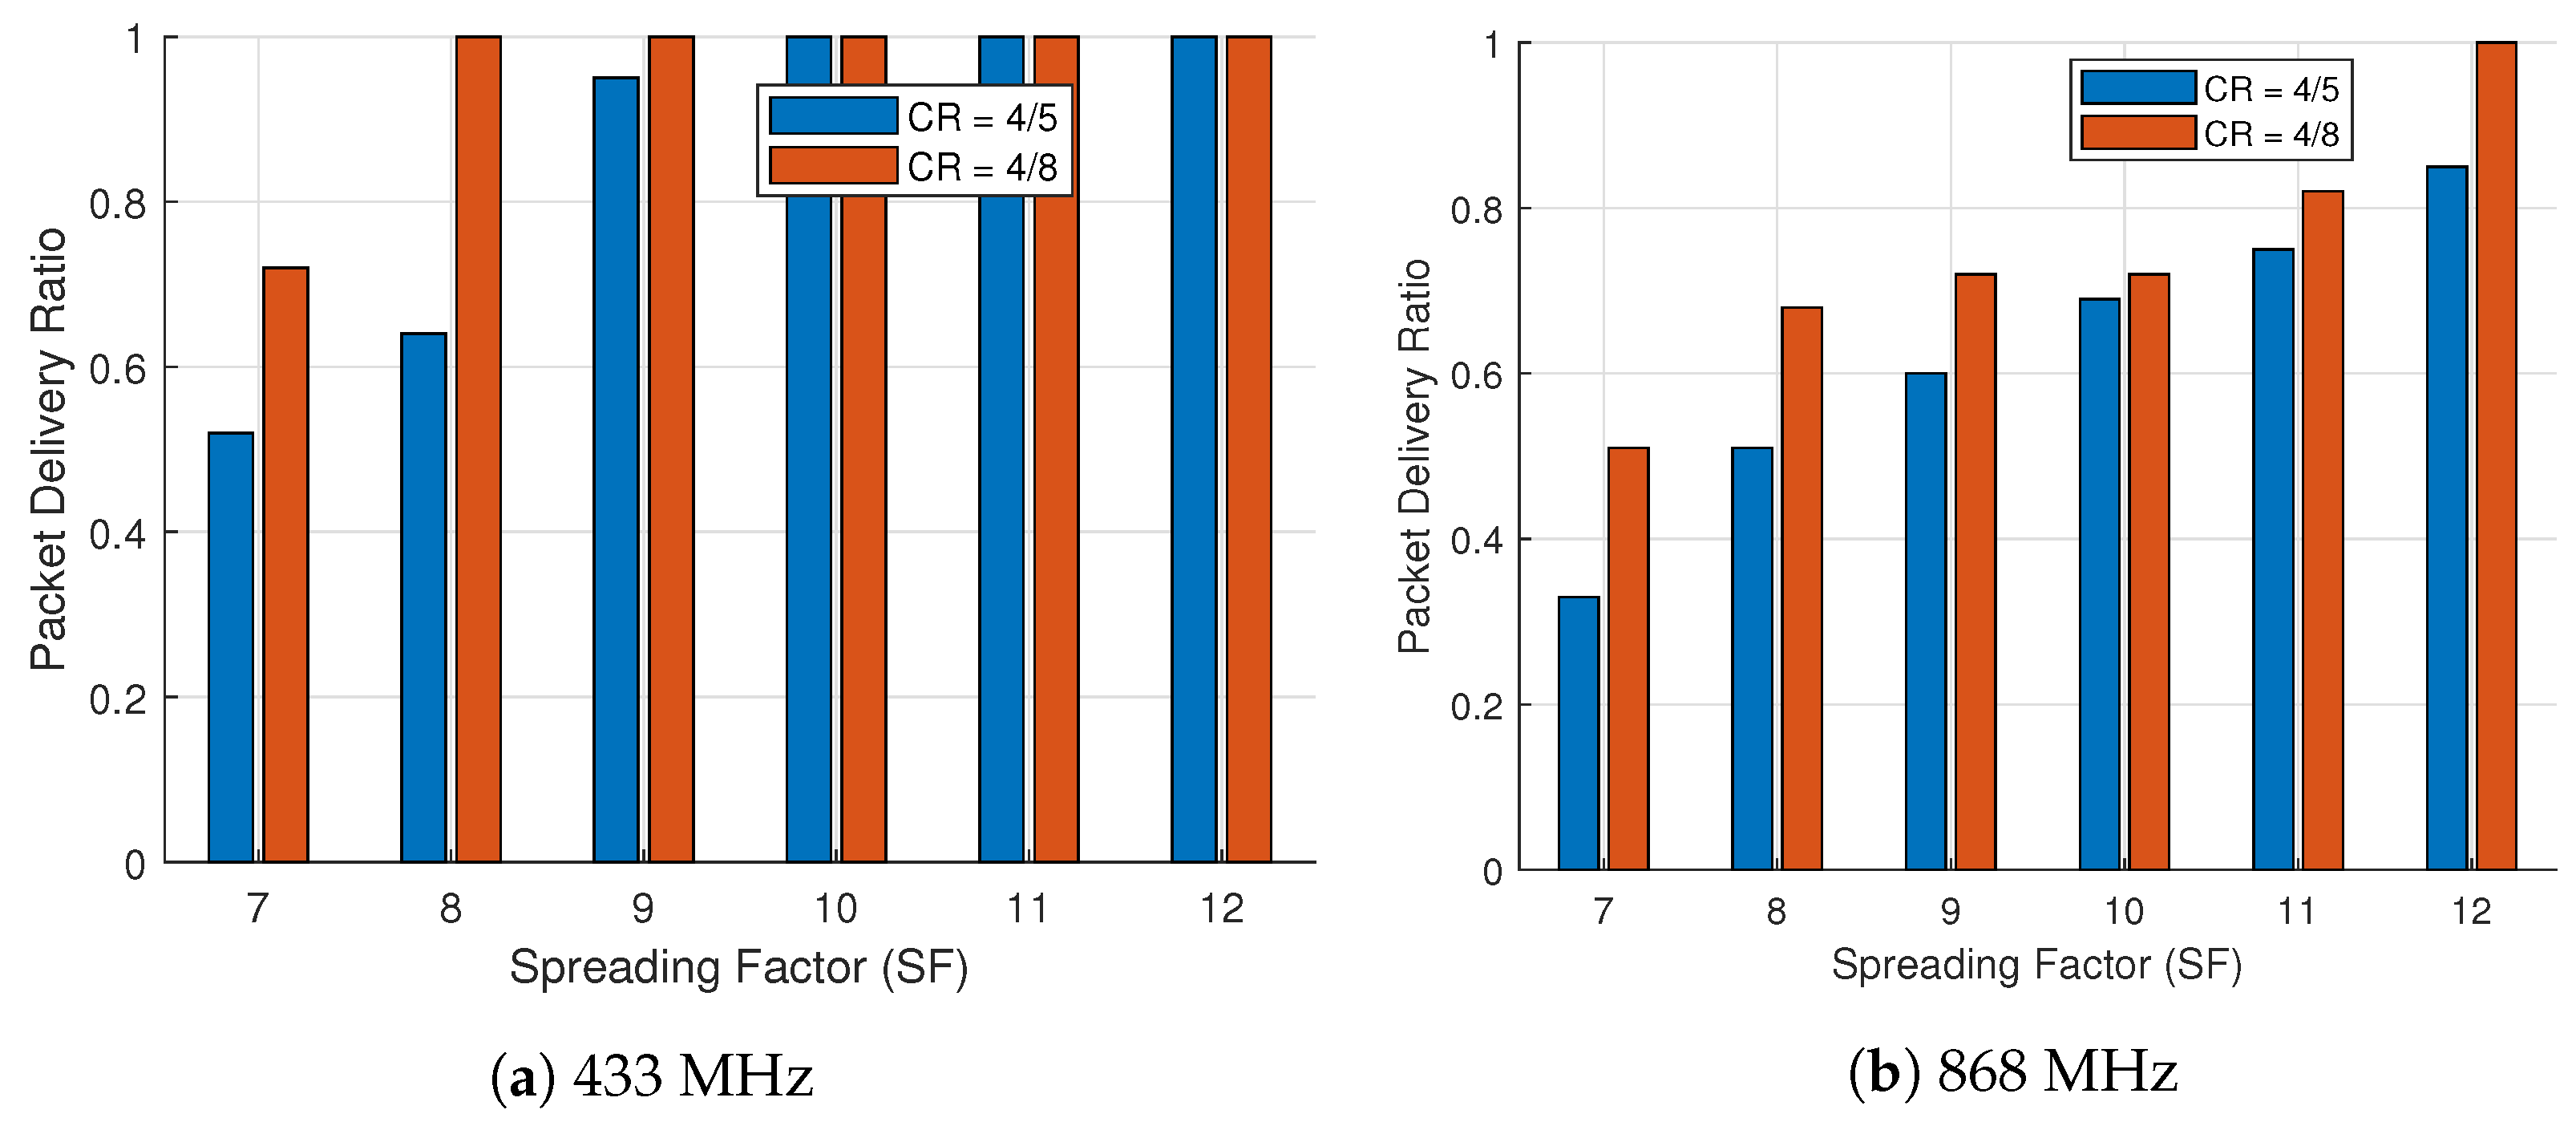
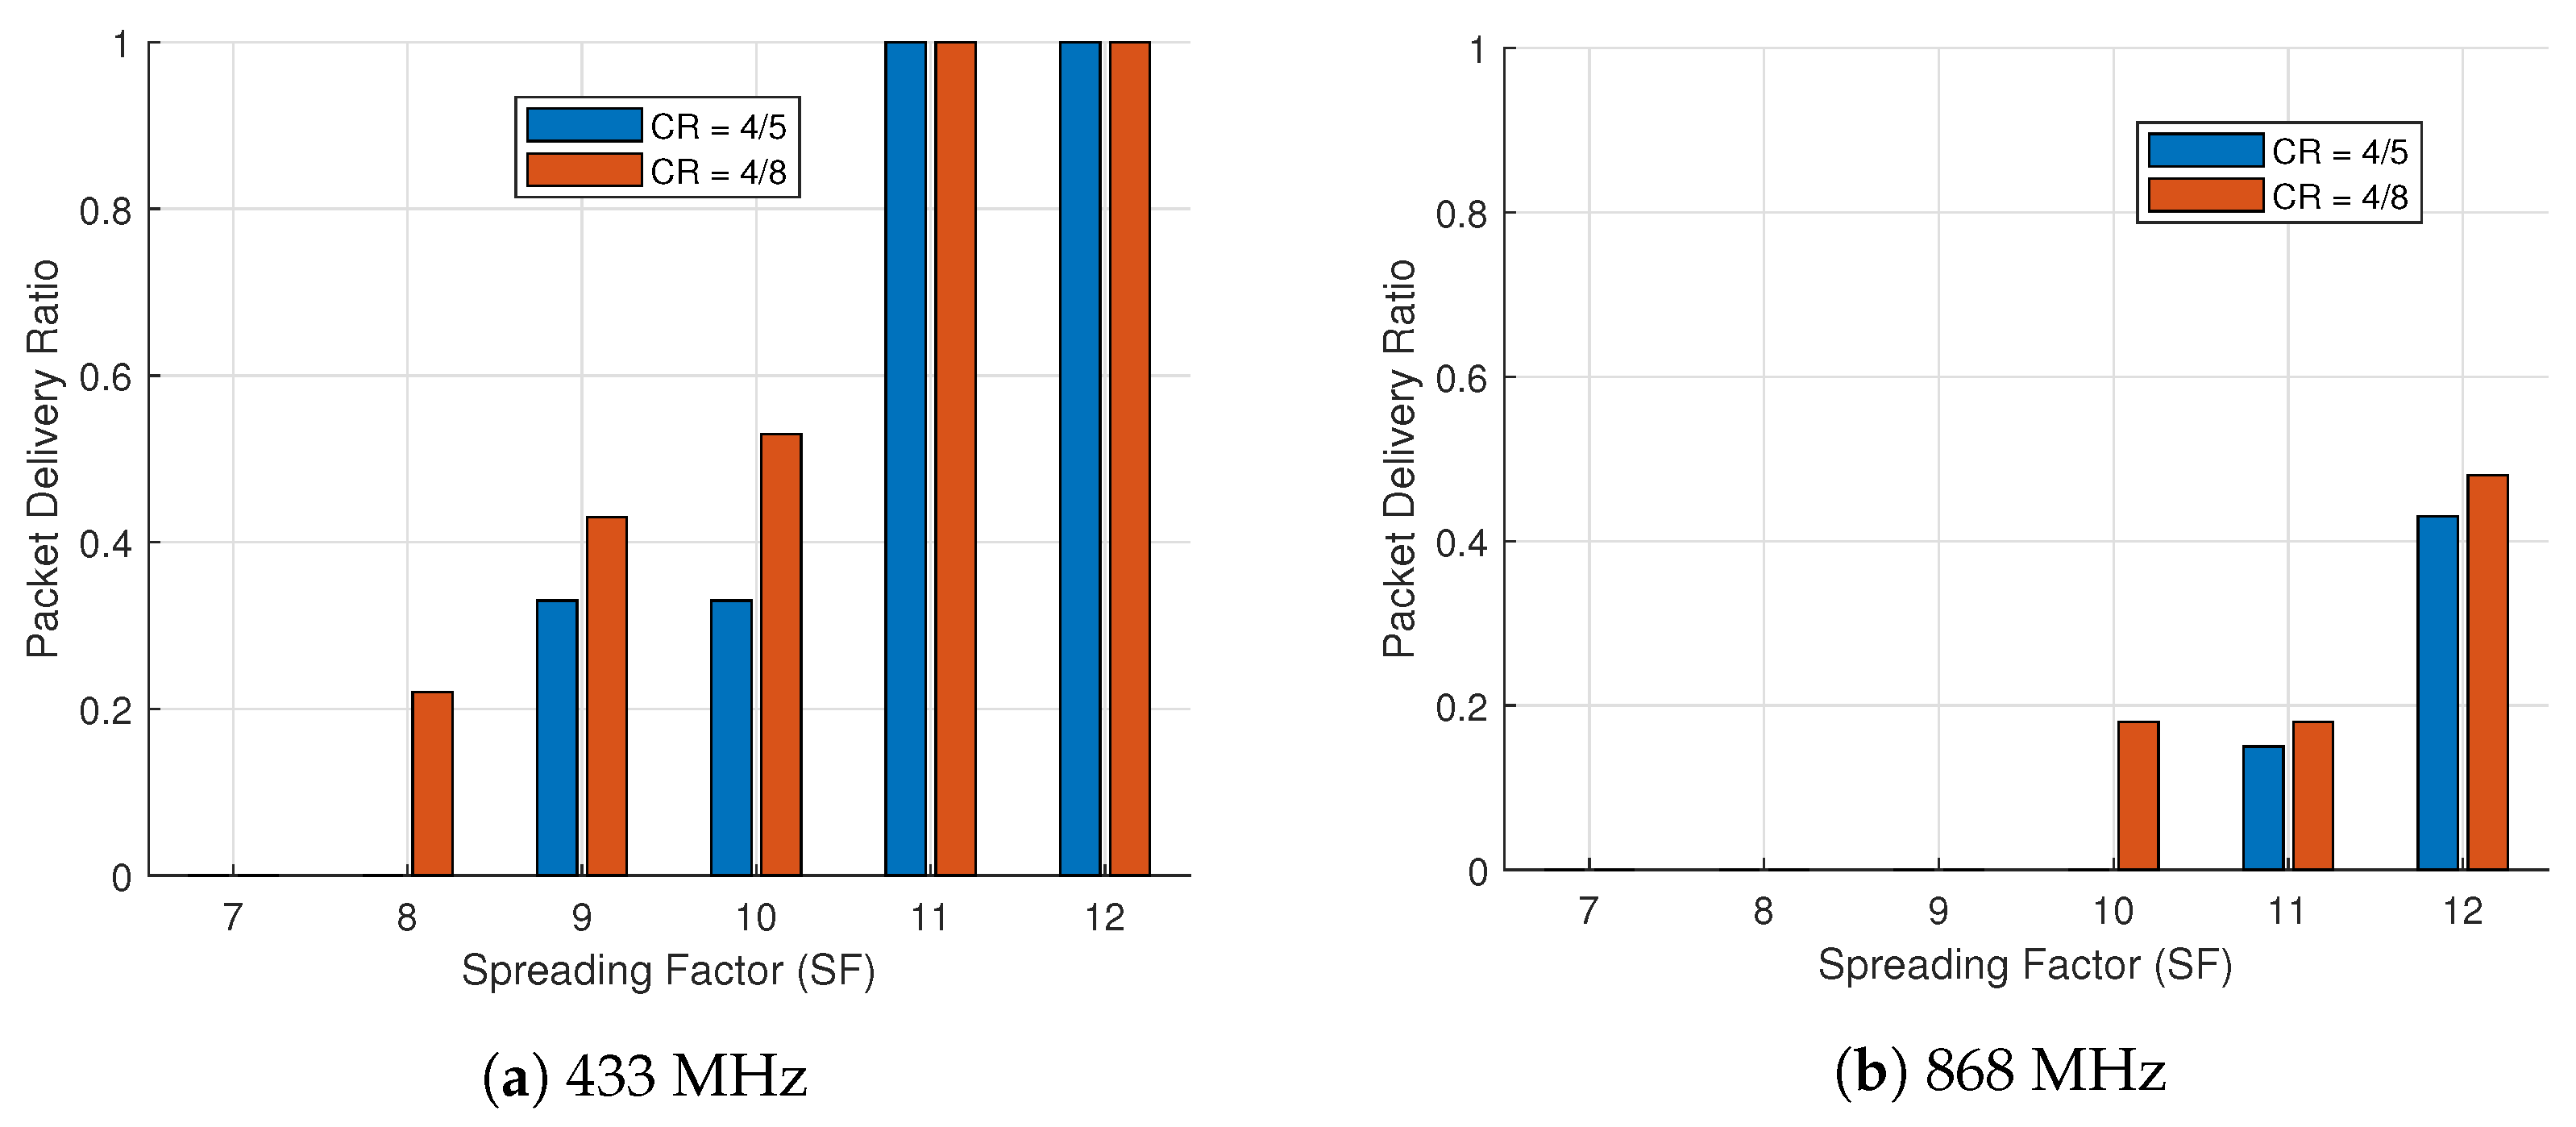
Figure 11, Figure 12 and Figure 13 show the for a 17 bytes LoRa transmitted packet obtained for transmissions from POS C, POS F & POS 3 to the gateway for different combinations of and values in both 433 and 868 MHz frequency bands. The CR values measured are (the least level of redundancy) and (the highest level of redundancy). Looking at the graph, it is clear that there is an advantage of using a higher code rate to improve the obtained . These experimental results conform to the simulations reported in [55], which pointed out that higher values (increased redundancy in the packet) guarantee, at the cost of an increased time-on-air (ToA), a substantial increment in the when the is near the threshold, and hence an increased robustness of LoRa to fluctuation in the channel attenuation.
At a higher code rate, the improved forward error correction (FEC) allows more bits to be recovered: fewer packets are corrupted and discarded by the CRC, thus resulting in a higher . An example is demonstrated in Figure 13a,b, which shows that for an SF value of 8 in the 433 MHz and value of 10 in the 868 MHz both in POS 3, communication was only possible when using the highest level of redundancy . Despite this, the connectivity was patchy, with only a small fraction of packets being delivered successfully, close to 22% and 18% respectively. No communication was impossible for an value of 12 at POS D, irrespective of the CR value. It should be noted that, in almost all tested configurations, even though it is not reported, that the measured for each packet, despite that better is marginally but still significantly lower, using a higher .
Figure 14 shows the received signal strength indicator at the receiver for transmissions from POS 2 with different combinations of SF and CR values in both 433 and 868 MHz frequency bands. As evident from this figure, signal strength values around the –125 dBm mark were observed for this location, indicating that this link is operating close to its edge (communication drops off beyond –135 dBm).
The figure also shows the differences when operating in different frequency bands. In addition, a strong signal is registered by the receiver with the average RSSI around the –113 dBm mark for the 433 MHz band. A setting with and emerges as the best choice when operating in the 868 MHz band for POS 2 to achieve the best possible performance with the least time on air. Nonetheless, the other two alternatives and could also be used. However, this would depend on the application’s tolerance to packet loss. If an application does not demand high levels of delivery accuracy and packet loss is tolerable, then a more aggressive setting could also be used. Therefore, the choice of settings boils down to the demands of the application and what can be practically delivered in the given deployment scenario.
5.1.3. Effects of the SF
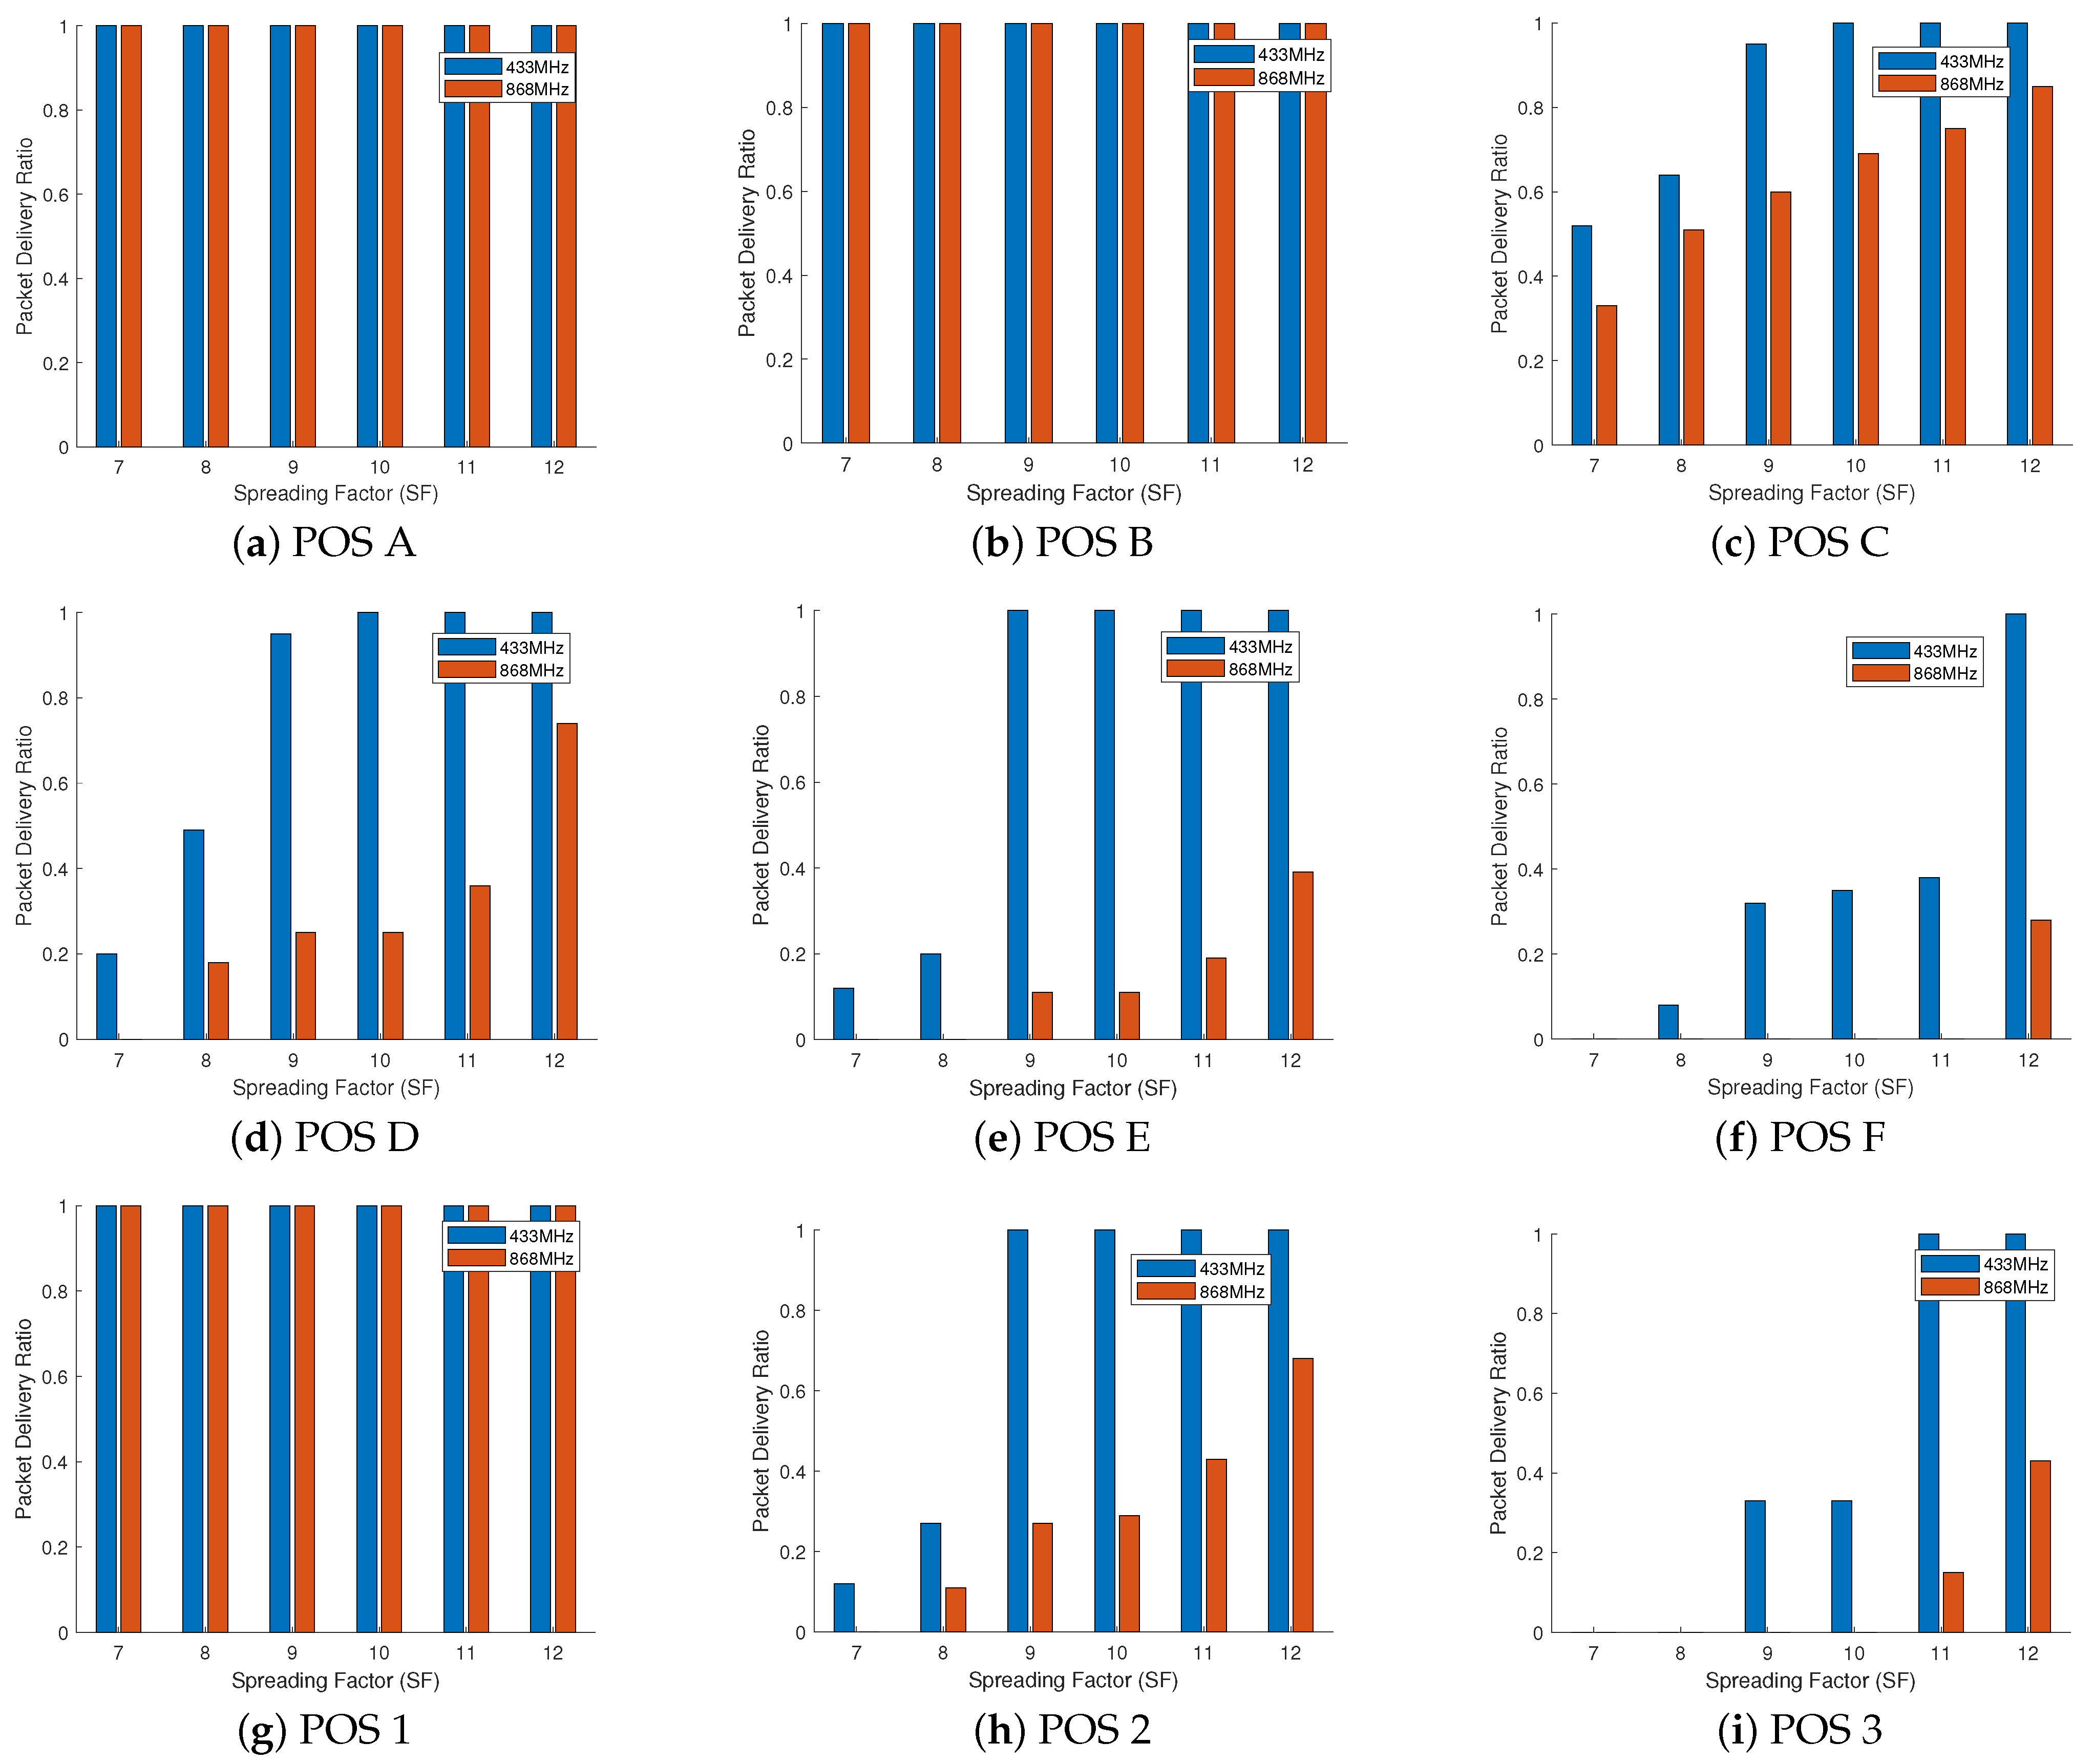
We present in Figure 15 the for a 17 bytes LoRa transmitted packet at different in different positions for a fixed bandwidth of 125 KHz and operating in the 433 MHz and 868 MHz bands. As seen from the figure, the higher the SF for a given CR and BW value, the higher the . It is well known that the choice of SF provides a compromise between range and data rate. Higher SF values provide a better range at the cost of a lower achievable data rate, as demonstrated in Figure 15. As expected, 433 MHz propagation is better in the same conditions. This is due to its lower radio propagation losses in comparison to the 868 MHz frequency.
The worst connectivity was achieved with POS 3 and POS F at a distance of 860 m and 2050 m from their respective locations to the gateway. Even though POS 3 has a shorter distance compared to POS F, POS 3 is placed at a very dense forest vegetation. Whilst these experiments suggest that optimistically a range of 860 m was achievable, in practice, few packets were successfully delivered. Similar performance was observed at POS 4, where no packets were successfully delivered to the gateway from this location, regardless of the and values. The best connectivity was achieved with POS 1, POS A and POS B, where 100% was achieved. From the figures presented in Figure 15, and using POS C and POS 3 as an example. POS C is placed at a distance of 1080 m to the gateway, while POS 3 is at a distance of 860 m. The PDR achieved in POS 3 surpasses the achieved in POS 3, despite the fact that POS 3 is closer to the gateway. This shows the position differences, which indicated that POS C is placed in a not so dense forest, while POS 3 is placed in a very dense forest environment.
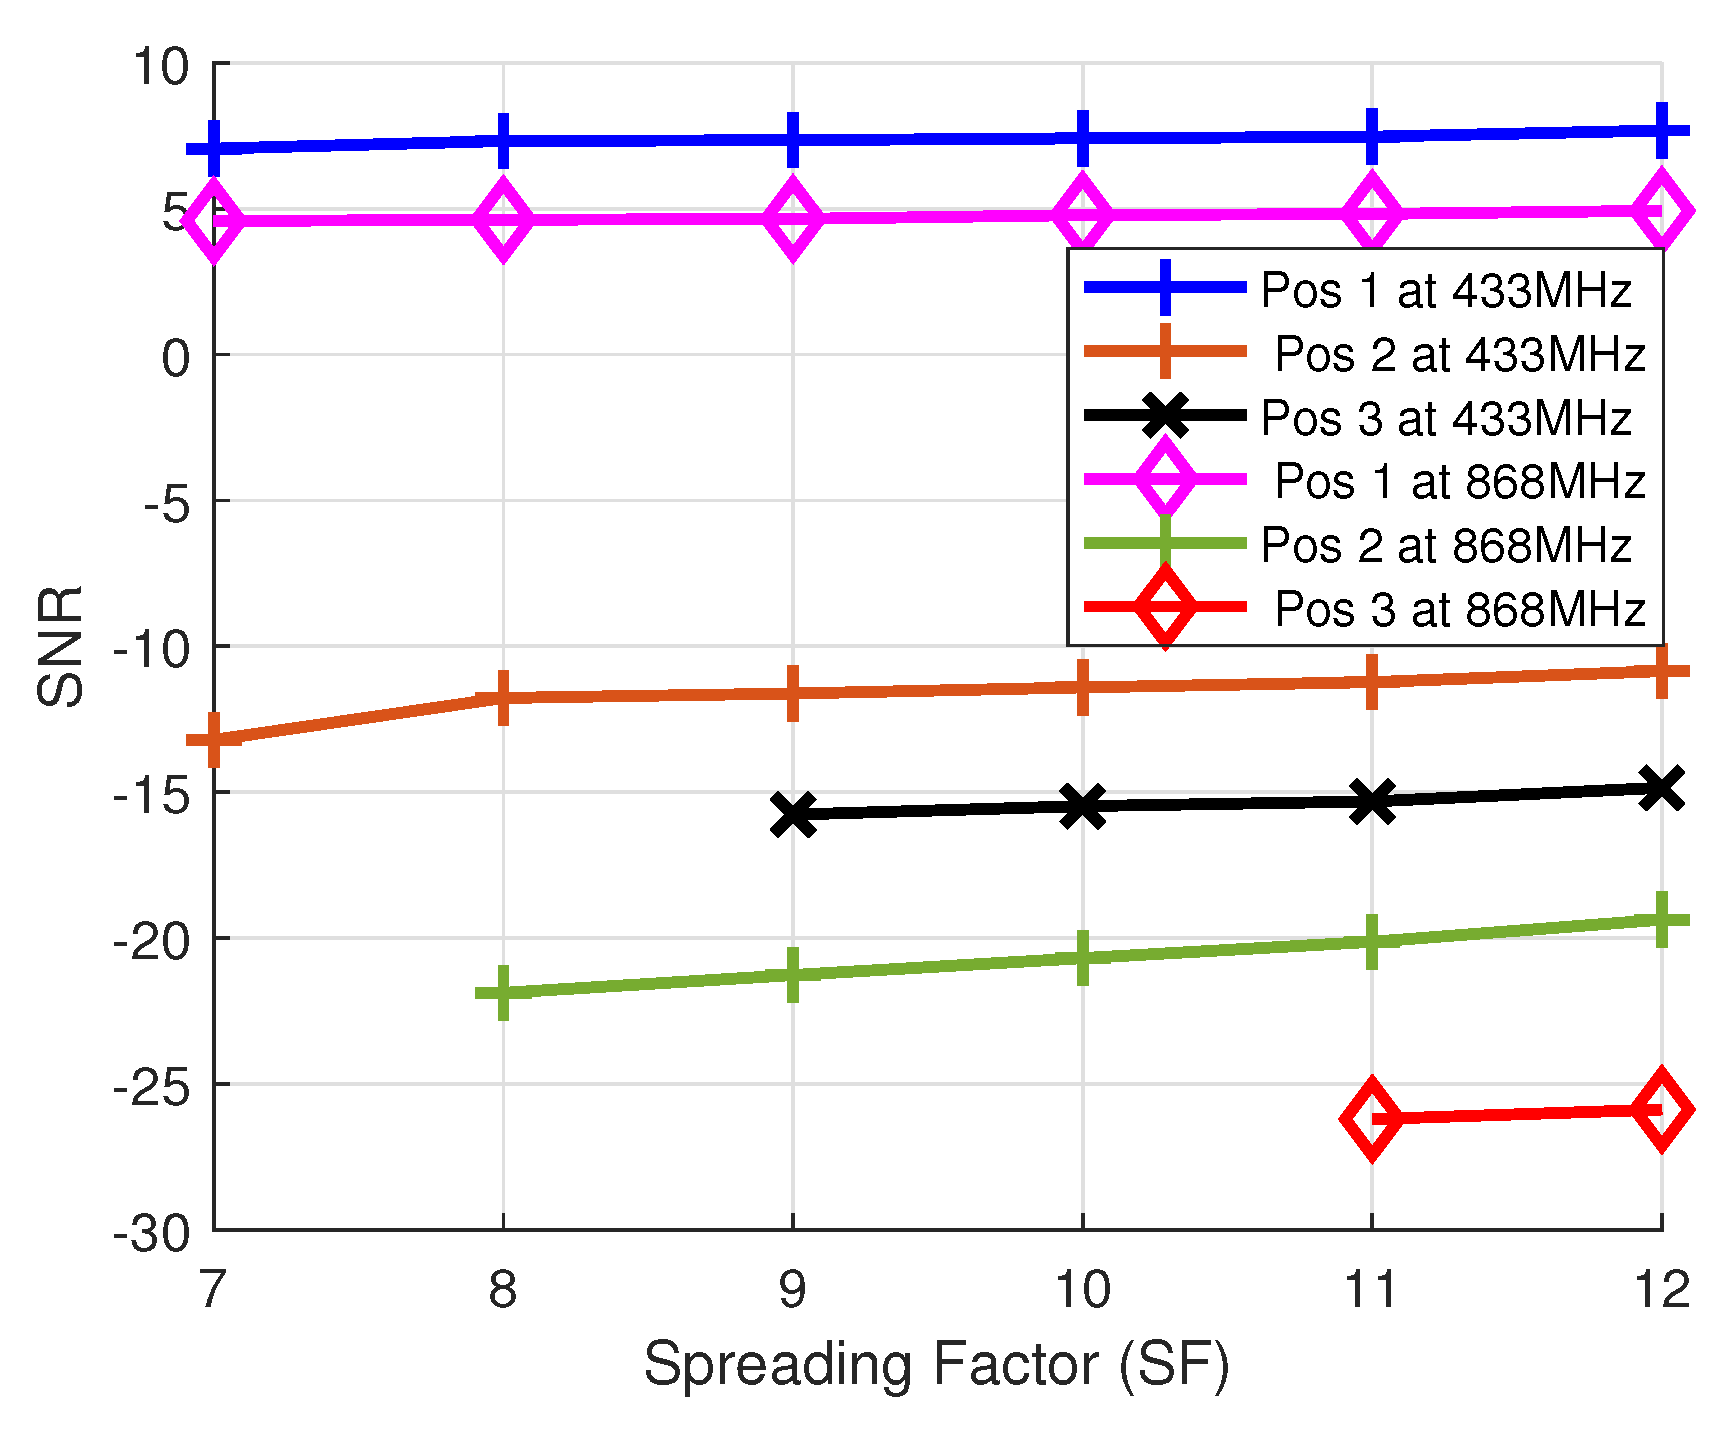
Figure 16 shows the average in function of the SF for POS 1–POS 3 in the 433 MHz and 868 MHz band. We can draw up the following remarks: the experiments performed in POS 1 benefit from a high quality of reception due to their distance to the gateway. There is a significant drop in the in POS 2 and POS 3, mainly due to the presence of vegetation as well as distance. In the case of POS 3 in the 868 MHz, connectivity was only achieved with and . As expected, we obtained a higher in the 433 MHz band, due to the lower radio propagation losses even in the worst gateway location.
5.2. Theoretical Coverage Study
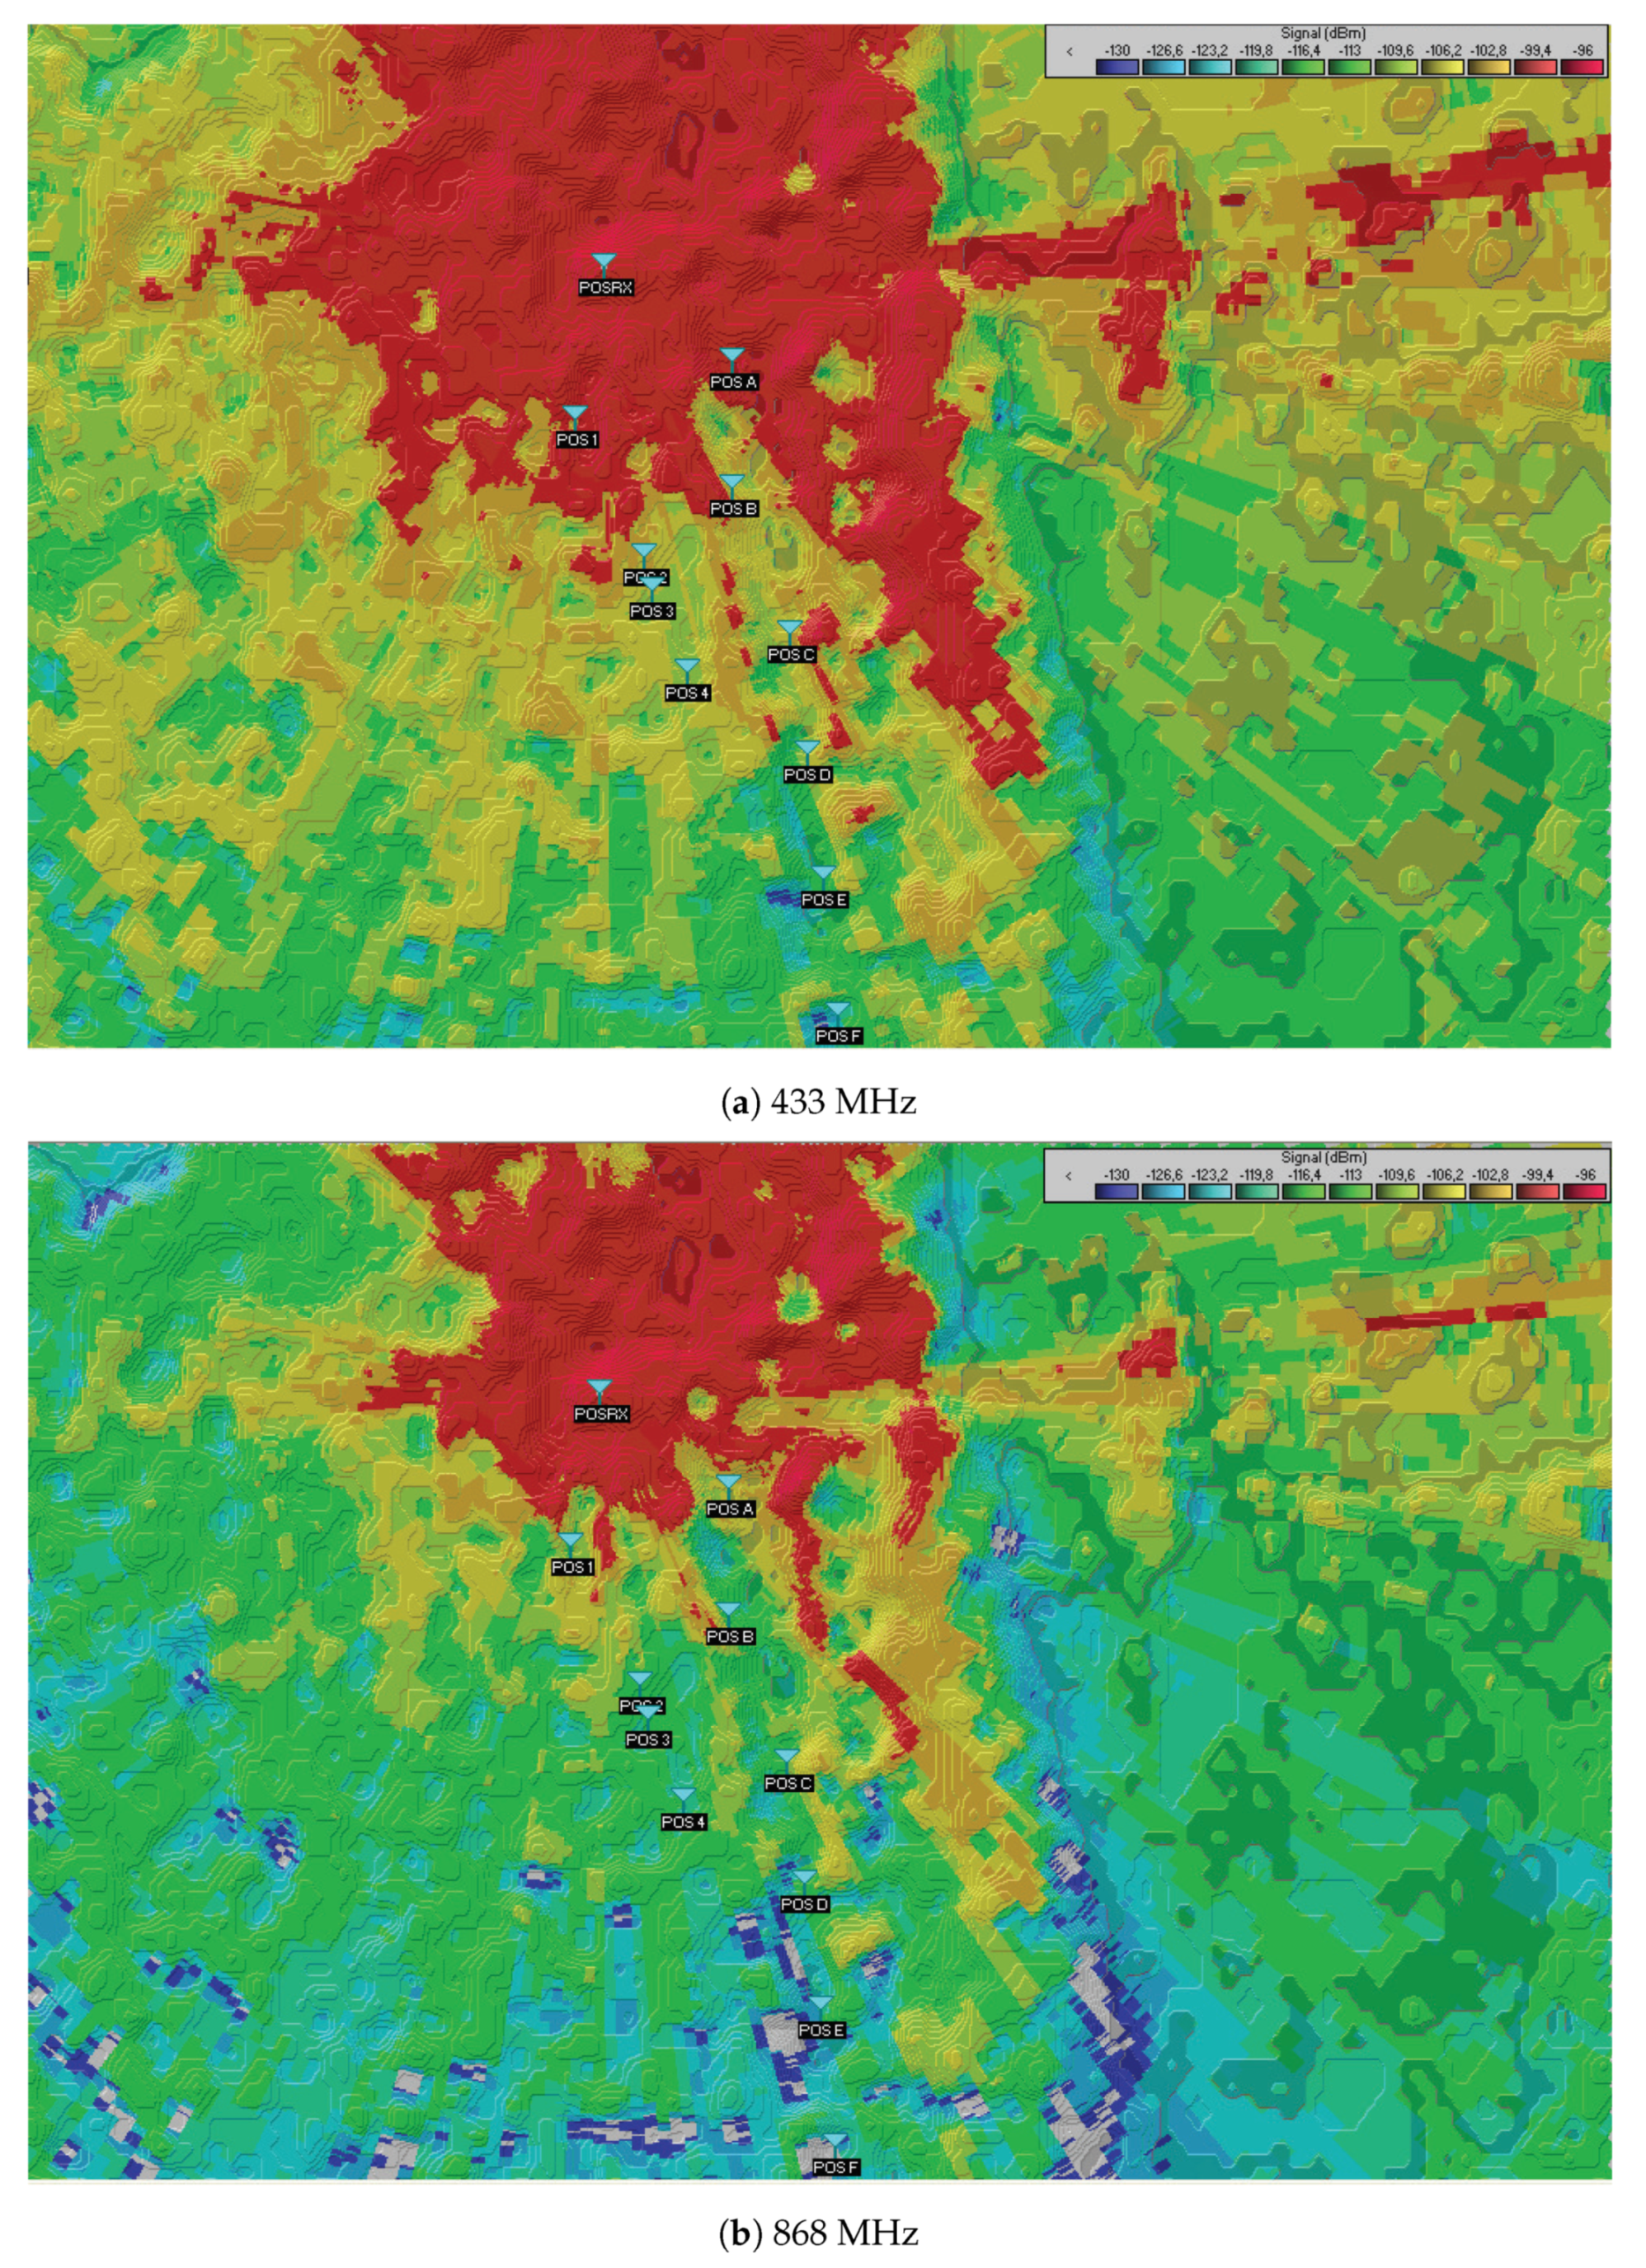
In this section, we present the theoretical coverage study from an accurate radio planning tool [20], which uses accurate terrain elevation data and the ITM Longley–Rice propagation model. We present a coverage graph showing the estimated RSSI interval for the propagation model that was tested. The configuration is set with the exact features corresponding to our experimental field test. All losses and gains of the system are considered to obtain an accurate study. The RSSI holds the received signal strength in dBm. Figure 17 shows the obtained coverage map for the 433 MHz and 868 MHz frequency bands. The positions in the figures are the exact location described in Table 4 and shown in Figure 7. The signal strength from the coverage heat map is described with colours. The red area indicates very good signal strength, where the blue areas represent a level of received power that is below the receiver’s floor sensitivity. From the figure, the 433 MHz heat map shows large coverage with low RSSI values compared to the 868 MHz heat map.
5.3. Discussion
In this study, we tested experimental LoRa communication in the forest environments. LoRa was designed for long-range, with theoretical coverage of 15 km for suburban and 5 km for urban areas. Nevertheless, measurements in the forest had an extremely short range compared to the theory. The maximum measured range achieved for a very dense forest vegetation area is 860 m for SF12. This drastic reduction is due to the difficult propagation conditions in the forest environment. LoRa has been shown to be sensitive to the presence of obstacles and reflectors, despite a CSS modulation technique that is more robust against interference.
It is clear that the performance achievable with LoRa can vary greatly depending on the deployment scenario and is also sensitive to the choice of operational parameters. Whilst there are conditions under which choice of conservative parameter values, e.g., using worse and values can mean the difference between connectivity and the lack thereof, there are other situations where aggressive parameter values can be safely leveraged to maximize performance. Identifying the optimal value for these operational parameters and adapting them in response to changes in the operational environment remain a challenge. Furthermore, the obtained results from the theoretical coverage study corroborate to the experimental field results. Despite the similarities, there are still some discrepancies. For example, in the theoretical coverage heat map, a weak RSSI is obtained for POS D, whereas in the experimental study, it shows no connection to the gateway. This shows that there is still a statistically significant difference between the experimental and the theoretical results.
The observed behaviour from our experimental results suggests that the encountered vegetation should represent a case of a slow fading channel. Experiments in [56] in fact confirm how, in a fast fading channel, better LoRa performances are obtained with lower spreading factor, and thus a higher baud rate that assures a symbol period lower than the coherence time of the channel.
In addition, all tests conducted have shown that 433 MHz performs better than 868 MHz in terms of achievable coverage, due to the lower radio propagation losses, but the unbalanced antenna system in favour of the 433 MHz band must be taken into account. Given the receiver sensitivity of LoRa and the claims in the existing literature of being able to achieve several kms of range in practice, it is also of interest to assess how far in terms of distance connectivity could be established reliably in different forest vegetation areas. This result will provide meaningful insights into academia in providing accurate propagation models in a forest vegetation area of a LoRa network.
6. Conclusions
This paper presented the behaviour of the LoRa in the forest vegetation with extensive experimental measurement. The measurement operated in the 433 MHz and 868 MHz frequency bands. The experiment carried out pushed the limits of the modulation in terms of the obtainable coverage and thus analyzed the impact of parameters such as spreading factor, code rate and bandwidth and the effects of a slow fading channel. According to these results and analysis, we can conclude that the LoRa signal stability greatly depends on the environment, and it is more stable in not so dense forest environments than in highly dense forest environments.
The impact of payload length on the was demonstrated. It was demonstrated that packets with the longest payload have been shown to suffer more from the effects of a slow fading, however leading to a lower due to CRC discarding of the corrupted one. The conclusions obtained show that the proposed tool provides useful guidelines for future developers on the design of smart repelling systems and the performance of LoRa in forest vegetation areas. In addition, our results can provide insight to geolocation and hikers in a natural park, for obtaining the maximum achievable coverage in both not so dense and highly dense forest environments. As future work, further tests would be carried out to study the impact of the environment, in terms of atmospheric conditions (air humidity, pressure, rainfall etc.), on the LoRa performance, and propose a suitable propagation model for forest environments from the obtained results.
Author Contributions
The presented work was carried out in collaboration with all of the authors. Conceptualization, M.O.O. and D.A.; methodology, M.O.O. and D.A.; investigation, M.O.O.; visualization, M.O.O.; validation, D.A.; resources, S.G.; funding acquisition, S.G.; formal analysis, M.O.O.; writing—original draft preparation, M.O.O.; writing—review and editing, M.O.O. and D.A.; supervision, D.A. and S.G.; All authors have read and agreed to the published version of the manuscript.
Funding
This work was jointly supported by Regione Toscana, Italy, under the program POR FESR 2014-2020 (ULTRA-DEFENDER and ULTRREP projects) and by the Italian Ministry of Education and Research (MIUR) in the framework of the CrossLab project (Departments of Excellence).
Data Availability Statement
Not Applicable, the study does not report any data.
Acknowledgments
The authors would like to thank Marco Niccolini for his conduct in the experimental tests.
Conflicts of Interest
The authors declare no conflict of interest. The funders had no role in the design of the study; in the collection, analysis, or interpretation of data; in the writing of the manuscript; or in the decision to publish the results.
References
- Carnevali, L.; Pedrotti, L.; Riga, F.; Toso, S. Ungulates in Italy: Status, Distribution, Abundance, Management and Hunting of Ungulate Populations in Italy-Report 2001–2005. Biol. Cons. Fauna 2009, 117, 1–168. [Google Scholar]
- Giordano, S.; Seitanidis, I.; Ojo, M.; Adami, D.; Vignoli, F. IoT Solutions for Crop Protection Against Wild Animal Attacks. In Proceedings of the 2018 IEEE International Conference on Environmental Engineering (EE), Milan, Italy, 12–14 March 2018; pp. 1–5. [Google Scholar]
- Amici, A.; Serrani, F.; Rossi, C.M.; Primi, R. Increase in Crop Damage Caused by Wild Boar (Sus Scrofa L.): The “Refuge Effect”. Agron. Sustain. Dev. 2012, 32, 683–692. [Google Scholar] [CrossRef] [Green Version]
- Wang, S.W.; Curtis, P.D.; Lassoie, J.P. Farmer Perceptions of Crop Damage by Wildlife in Jigme Singye Wangchuck National Park, Bhutan. Wildl. Soc. Bull. 2006, 34, 359–365. [Google Scholar] [CrossRef]
- Hamrick, B.; Campbell, T.A.; Higginbotham, B.; Lapidge, S. Managing an Invasion: Effective Measures to Control Wild Pigs. 2011. Available online: https://digitalcommons.unl.edu/cgi/viewcontent.cgi?article=2298&context=icwdm_usdanwrc (accessed on 29 April 2021).
- Tiedemann, A.R.; Quigley, T.; White, L. Electronic (Fenceless) Control of Livestock. In Res. Pap. PNW-RP-510; US Department of Agriculture, Forest Service, Pacific Northwest Research Station: Portland, OR, USA, 1999; Volume 510. [Google Scholar]
- Ojo, M.O.; Adami, D.; Giordano, S. Network Performance Evaluation of a LoRa-Based IoT System for Crop Protection Against Ungulates. In Proceedings of the 2020 IEEE 25th International Workshop on Computer Aided Modeling and Design of Communication Links and Networks (CAMAD), Pisa, Italy, 14–16 September 2020; pp. 1–6. [Google Scholar]
- State of the IoT 2018: Number of IoT Devices Now at 7B—Market Accelerating. Available online: https://iot-analytics.com/state-of-the-iot-update-q1-q2-2018-number-of-iot-devices-now-7b/ (accessed on 17 March 2021).
- LoRa. Available online: https://lora-alliance.org// (accessed on 17 March 2021).
- LoRaWAN. Available online: https://lora-alliance.org/wp-content/uploads/2020/11/RP_2-1.0.2.pdf (accessed on 17 March 2021).
- Sigfox. Available online: https://www.sigfox.com/en (accessed on 17 March 2021).
- Ingenu. RPMA Technology. Available online: https://www.ingenu.com/technology/rpma/ (accessed on 17 March 2021).
- Weightless. Available online: https://www.weightless.com/ (accessed on 17 March 2021).
- Georgiou, O.; Raza, U. Low power wide area network analysis: Can LoRa scale? IEEE Wirel. Commun. Lett. 2017, 6, 162–165. [Google Scholar] [CrossRef] [Green Version]
- Adelantado, F.; Vilajosana, X.; Tuset-Peiro, P.; Martinez, B.; Melia-Segui, J.; Watteyne, T. Understanding the Limits of LoRaWAN. IEEE Commun. Mag. 2017, 55, 34–40. [Google Scholar] [CrossRef] [Green Version]
- Augustin, A.; Yi, J.; Clausen, T.; Townsley, W.M. A Study of LoRa: Long Range & Low Power Networks for the Internet of Things. Sensors 2016, 16, 1466. [Google Scholar]
- Sanchez-Iborra, R.; Sanchez-Gomez, J.; Ballesta-Viñas, J.; Cano, M.-D.; Skarmeta, A.F. Performance Evaluation of LoRa Considering Scenario Conditions. Sensors 2018, 18, 772. [Google Scholar] [CrossRef] [Green Version]
- Trasviña-Moreno, C.A.; Blasco, R.; Casas, R.; Asensio, A. A Network Performance Analysis of LoRa Modulation for LPWAN Sensor Devices. In Ubiquitous Computing and Ambient Intelligence; Springer: Berlin/Heidelberg, Germany, 2016; pp. 174–181. [Google Scholar]
- Froiz-Míguez, I.; Lopez-Iturri, P.; Fraga-Lamas, P.; Celaya-Echarri, M.; Blanco-Novoa, Ó.; Azpilicueta, L.; Falcone, F.; Fernández-Caramés, T.M. Design, Implementation, and Empirical Validation of an IoT Smart Irrigation System for Fog Computing Applications Based on LoRa and LoRaWAN Sensor Nodes. Sensors 2020, 20, 6865. [Google Scholar] [CrossRef]
- Radio Mobile Online. Available online: https://www.ve2dbe.com/rmonline_s.asp/ (accessed on 17 March 2021).
- Wang, Y.-P.E.; Lin, X.; Adhikary, A.; Grovlen, A.; Sui, Y.; Blankenship, Y.; Bergman, J.; Razaghi, H.S. A Primer on 3GPP Narrowband Internet of Things. IEEE Commun. Mag. 2017, 55, 117–123. [Google Scholar] [CrossRef]
- STD. DASH7 ALLIANCE, DASH7 Alliance Protocol Specification v1.1. Available online: https://dash7-alliance.org/#primary (accessed on 29 April 2021).
- Telensa. Available online: https://www.telensa.com/ (accessed on 17 March 2021).
- EC-GSM-IoT. Extended Coverage GSM Internet of Things. Available online: https://www.gsma.com/iot/extended-coverage-gsm-internet-of-things-ec-gsm-iot/ (accessed on 17 March 2021).
- Poole, I. Weightless Wireless M2M White Space Communications; Electronics Notes: Dorking, UK, 2015. [Google Scholar]
- Vangelista, L.; Zanella, A.; Zorzi, M. Long-Range IoT Technologies: The Dawn of LoRa™. In Future Access Enablers of Ubiquitous and Intelligent Infrastructures; Springer: Berlin/Heidelberg, Germany, 2015; pp. 51–58. [Google Scholar]
- Davcev, D.; Mitreski, K.; Trajkovic, S.; Nikolovski, V.; Koteli, N. IoT Agriculture System Based on LoRaWAN. In Proceedings of the 2018 14th IEEE International Workshop on Factory Communication Systems (WFCS), Imperia, Italy, 13–15 June 2018; pp. 1–4. [Google Scholar]
- Heble, S.; Kumar, A.; Prasad, K.V.D.; Samirana, S.; Rajalakshmi, P.; Desai, U.B. A Low Power IoT Network for Smart Agriculture. In Proceedings of the 2018 IEEE 4th World Forum on Internet of Things (WF-IoT), Singapore, 5–8 February 2018; pp. 609–614. [Google Scholar]
- Codeluppi, G.; Cilfone, A.; Davoli, L.; Ferrari, G. LoRaFarM: A LoRaWAN-Based Smart Farming Modular IOT Architecture. Sensors 2020, 20, 2028. [Google Scholar] [CrossRef] [Green Version]
- Valente, A.; Silva, S.; Duarte, D.; Cabral Pinto, F.; Soares, S. Low-Cost LoRaWAN Node for Agro-Intelligence IoT. Electronics 2020, 9, 987. [Google Scholar] [CrossRef]
- Yim, D.; Chung, J.; Cho, Y.; Song, H.; Jin, D.; Kim, S.; Ko, S.; Smith, A.; Riegsecker, A. An Experimental LoRa Performance Evaluation in Tree Farm. In Proceedings of the 2018 IEEE sensors applications Symposium (SAS), Seoul, Korea, 12–14 March 2018; pp. 1–6. [Google Scholar]
- Grunwald, A.; Schaarschmidt, M.; Westerkamp, C. LoRaWAN in a Rural Context: Use Cases and Opportunities for Agricultural Businesses. In Mobile Communication-Technologies and Applications; 24. ITG-Symposium; VDE: Frankfurt, Germany, 2019; pp. 1–6. [Google Scholar]
- Boursianis, A.D.; Papadopoulou, M.S.; Gotsis, A.; Wan, S.; Sarigiannidis, P.; Nikolaidis, S.; Goudos, S.K. Smart Irrigation System for Precision Agriculture-The AREThOU5A IoT Platform. IEEE Sens. J. 2020. [Google Scholar] [CrossRef]
- Kamienski, C.; Soininen, J.-P.; Taumberger, M.; Dantas, R.; Toscano, A.; Salmon Cinotti, T.; Filev Maia, R.; Torre Neto, A. Smart Water Management Platform: IoT-Based Precision Irrigation for Agriculture. Sensors 2019, 19, 276. [Google Scholar] [CrossRef] [PubMed] [Green Version]
- Zhao, W.; Lin, S.; Han, J.; Xu, R.; Hou, L. Design and Implementation of Smart Irrigation System Based on LoRa. In Proceedings of the 2017 IEEE Globecom Workshops (GC Wkshps), Singapore, 4–8 December 2017; pp. 1–6. [Google Scholar]
- Parri, L.; Parrino, S.; Peruzzi, G.; Pozzebon, A. A LoRaWAN Network Infrastructure for the Remote Monitoring of Offshore Sea Farms. In Proceedings of the 2020 IEEE International Instrumentation and Measurement Technology Conference (I2MTC), Dubrovnik, Croatia, 25–28 May 2020; pp. 1–6. [Google Scholar]
- Singh, R.K.; Aernouts, M.; De Meyer, M.; Weyn, M.; Berkvens, R. Leveraging LoRaWAN Technology for Precision Agriculture in Greenhouses. Sensors 2020, 20, 1827. [Google Scholar] [CrossRef] [PubMed] [Green Version]
- Joris, L.; Dupont, F.; Laurent, P.; Bellier, P.; Stoukatch, S.; Redouté, J.-M. An Autonomous Sigfox Wireless Sensor Node for Environmental Monitoring. IEEE Sens. Lett. 2019, 3, 1–4. [Google Scholar] [CrossRef]
- Pitu, F.; Gaitan, N.C. Surveillance of Sigfox Technology Integrated with Environmental Monitoring. In Proceedings of the IEEE 2020 International Conference on Development and Application Systems (DAS), Suceava, Romania, 21–23 May 2020; pp. 69–72. [Google Scholar]
- Zhang, X.; Andreyev, A.; Zumpf, C.; Negri, M.C.; Guha, S.; Ghosh, M. Thoreau: A Subterranean Wireless Sensing Network for Agriculture and the Environment. In Proceedings of the 2017 IEEE Conference on Computer Communications Workshops (INFOCOM WKSHPS), Atlanta, GA, USA, 1–4 May 2017; pp. 78–84. [Google Scholar]
- Foubert, B.; Mitton, N. Long-Range Wireless Radio Technologies: A Survey. Future Internet 2020, 12, 13. [Google Scholar] [CrossRef] [Green Version]
- Valecce, G.; Petruzzi, P.; Strazzella, S.; Grieco, L.A. NB-IOT for Smart Agriculture: Experiments from the Field. In Proceedings of the IEEE 2020 7th International Conference on Control, Decision and Information Technologies (CoDIT), Prague, Czech Republic, 29 June–2 July 2020; Volume 1, pp. 71–75. [Google Scholar]
- Castellanos, G.; Deruyck, M.; Martens, L.; Joseph, W. System Assessment of WUSN Using NB-IOT UAV-Aided Networks in Potato Crops. IEEE Access 2020, 8, 56823–56836. [Google Scholar] [CrossRef]
- Zhang, F.; Wan, X.; Zheng, T.; Cui, J.; Li, X.; Yang, Y. Smart Greenhouse Management System based on NB-IOT and Smartphone. In Proceedings of the IEEE 2020 17th International Joint Conference on Computer Science and Software Engineering (JCSSE), Bangkok, Thailand, 4–6 November 2020; pp. 36–41. [Google Scholar]
- He, C.; Shen, M.; Liu, L.; Okinda, C.; Yang, J.; Shi, H. Design and Realization of a Greenhouse Temperature Intelligent Control System Based on NB-IoT. J. South China Agric. Univ. 2018, 39, 117–124. [Google Scholar]
- Huan, J.; Li, H.; Wu, F.; Cao, W. Design of Water Quality Monitoring System for Aquaculture Ponds Based on NB-IoT. Aquac. Eng. 2020, 90, 102088. [Google Scholar] [CrossRef]
- Olatinwo, S.O.; Joubert, T. Enabling Communication Networks for Water Quality Monitoring Applications: A Survey. IEEE Access 2019, 7, 100332–100362. [Google Scholar] [CrossRef]
- Finnegan, J.; Brown, S. An Analysis of the Energy Consumption of LPWA-Based IoT Devices. In Proceedings of the IEEE 2018 International Symposium on Networks, Computers and Communications (ISNCC), Rome, Italy, 19–21 June 2018; pp. 1–6. [Google Scholar]
- Piromalis, D.D.; Arvanitis, K.G. Radio Frequency Identification and Wireless Sensor Networks Application Domains Integration using DASH7 Mode 2 Standard in Agriculture. Int. J. Sustain. Agric. Manag. Inform. 2015, 1, 178–189. [Google Scholar] [CrossRef]
- Naik, N. LPWAN Technologies for IoT Systems: Choice Between Ultra Narrow Band and Spread Spectrum. In Proceedings of the 2018 IEEE International Systems Engineering Symposium (ISSE), Rome, Italy, 1–3 October 2018; pp. 1–8. [Google Scholar]
- Iova, O.; Murphy, A.; Picco, G.P.; Ghiro, L.; Molteni, D.; Ossi, F.; Cagnacci, F. LoRa from the City to the Mountains: Exploration of Hardware and Environmental Factors. In Proceedings of the 2017 International Conference on Embedded Wireless Systems and Networks, Uppsala, Sweden, 20–22 February 2017. [Google Scholar]
- Villarim, M.R.; de Luna, J.V.H.; de Farias Medeiros, D.; Pereira, R.I.S.; de Souza, C.P.; Baiocchi, O.; da Cunha Martins, F.C. An Evaluation of LoRa Communication Range in Urban and Forest Areas: A Case Study in Brazil and Portugal. In Proceedings of the 2019 IEEE 10th Annual Information Technology, Electronics and Mobile Communication Conference (IEMCON), Vancouver, BC, Canada, 17–19 October 2019; pp. 0827–0832. [Google Scholar]
- Ferreira, A.E.; Ortiz, F.M.; Costa, L.H.M.; Foubert, B.; Amadou, I.; Mitton, N. A Study of the LoRa Signal Propagation in Forest, Urban, and Suburban Environments. Ann. Telecommun. 2020, 75, 333–351. [Google Scholar] [CrossRef]
- Ojo, M.O.; Giordano, S.; Procissi, G.; Seitanidis, I.N. A Review of Low-end, Middle-end, and High-end IOT Devices. IEEE Access 2018, 6, 70528–70554. [Google Scholar] [CrossRef]
- Baruffa, G.; Rugini, L.; Mecarelli, V.; Germani, L.; Frescura, F. Coded LoRa Performance in Wireless Channels. In Proceedings of the 2019 IEEE 30th Annual International Symposium on Personal, Indoor and Mobile Radio Communications (PIMRC), Istanbul, Turkey, 8–11 September 2019; pp. 1–6. [Google Scholar]
- Petäjäjärvi, J.; Mikhaylov, K.; Pettissalo, M.; Janhunen, J.; Iinatti, J. Performance of a Low-Power Wide-Area Network Based on LoRa Technology: Doppler Robustness, Scalability, and Coverage. Int. J. Distrib. Sens. Netw. 2017, 13, 1550147717699412. [Google Scholar] [CrossRef] [Green Version]
Figure 1.
Low Power Wide Area Network Classification.

Figure 2.
LoRa Frame Structure.

Figure 3.
System Architecture.

Figure 4.
Repeller board sketch (a) wide open (b) in an enclosure.

Figure 5.
LoRa Field Packet Generator.

Figure 6.
RN2483 Block Diagram.

Figure 7.
The Prototype devices (LoRa end-node) placed at different positions (POS A–POS F, POS 1–POS 4), and the Gateway indicated as POSRX.
Figure 7.
The Prototype devices (LoRa end-node) placed at different positions (POS A–POS F, POS 1–POS 4), and the Gateway indicated as POSRX.

Figure 8.
Image showing the environment in the green and red subsets.

Figure 9.
(a) PDR vs. payload length for SF12, CR = 4/5, BW = 125 KHz @ 868 MHz (b) log(PDR) vs. payload length for SF12.
Figure 9.
(a) PDR vs. payload length for SF12, CR = 4/5, BW = 125 KHz @ 868 MHz (b) log(PDR) vs. payload length for SF12.

Figure 10.
PDR vs. SF in POS 2 with CR = 4/5, BW = 125 KHz for (a) 433 MHz band (b) 868 MHz band.

Figure 11.
PDR vs. SF varying the CR in POS C (a) 433 MHz (b) 868 MHz.

Figure 12.
PDR vs. SF varying the CR in POS F (a) 433 MHz (b) 868 MHz.

Figure 13.
PDR vs. SF varying the CR in POS 3 (a) 433 MHz (b) 868 MHz.

Figure 14.
RSSI registered between the GW and POS 2 for different SF and CR values.

Figure 15.
PDR achieved for transmissions from all positions for different SF values, with CR = 4/5, BW = 125 KHz in the 433 MHz and 868 MHz frequency bands.
Figure 15.
PDR achieved for transmissions from all positions for different SF values, with CR = 4/5, BW = 125 KHz in the 433 MHz and 868 MHz frequency bands.

Figure 16.
SNR vs. SF with CR = 4/5, BW = 125 KHz for POS 1–POS 3.

Figure 17.
Theoretical coverage heat map for the forest environment area (a) 433 MHz band (b) 868 MHz band.
Figure 17.
Theoretical coverage heat map for the forest environment area (a) 433 MHz band (b) 868 MHz band.


Table 1.
LoRa configuration parameters for 125 kHz bandwidth.
| SF | Bit Rate [kbps] | Sensitivity [dBm] |
|---|---|---|
| 7 | 5.468 | −123 |
| 8 | 3.125 | −126 |
| 9 | 1.757 | −129 |
| 10 | 0.976 | −132 |
| 11 | 0.537 | −134.5 |
| 12 | 0.293 | −137 |
Table 2.
A Summary of Related Works.
| Ref. | Communication Technologies | Application | Sensors | Nature of Research |
|---|---|---|---|---|
| [27] | LoRaWAN | grape farm monitoring | soil moisture, humidity, temperature | proof-of-concept |
| [28] | LoRaWAN | maize crop monitoring | soil moisture, soil temperature, light intensity, humidity, ambient temperature and CO2 | costs and power consumption evaluation |
| [29] | LoRaWAN | vineyard and greenhouse monitoring | soil mositure, soil temperature and humidity | environmental performance analysis |
| [30] | LoRaWAN | vineyard monitoring | soil and air temperature, wind, soil water content, electrical conductivity, solar radiation, precipitation, pressure, humidity and lightning strikes count | energy consumption evaluation |
| [31] | LoRaWAN | tree farm monitoring | temperature, humidity, solar irradiance, flame sensor | environmental performance analysis |
| [32] | LoRaWAN | horse stable and agricultural land monitoring | temperature, humidity, conductivity and soil temperature | use cases analysis |
| [33,34] | LoRaWAN | irrigation control | temperature and soil moisture | experimental performance analysis |
| [35] | LoRaWAN | irrigation control | — | proof-of-concept |
| [36] | LoRaWAN | sea farm monitoring | water temperature, salinity, turbidity and pH | use cases analysis |
| [37] | LoRaWAN | tomato crop monitoring | temperature, humidity, CO2, electrical conductivity (EC) and illuminance | power consumption evaluation |
| [38] | Sigfox | climate monitoring in vineyards | temperature, humidity, and luminosity | proof-of-concept |
| [39] | Sigfox | crop monitoring | temperature, humidity, and luminosity | proof-of-concept |
| [40] | Sigfox | crop monitoring | soil moisture, soil temperature, electric conductivity and water potential | test bed |
| [42] | NB-IoT | agricultural field test | — | experimental performance analysis |
| [43] | NB-IoT | potato crop monitoring | climate and soil parameters e.g., air and ground humidity, temperature, solar radiation, pH and compaction | use cases analysis |
| [44,45] | NB-IoT | greenhouse management | temperature, humidity, light, wind | use cases analysis |
| [46] | NB-IoT | water quality monitoring system for aquaculture ponds | temperature, pH composite electrode, dissolved oxygen | experimental Performance analysis |
| [47] | Ingenu RPMA, Sigfox, LoRaWAN, NB-IoT | water quality monitoring | temperature, pH | proof-of-concept |
| [48] | EC-GSM-IoT, LoRaWAN, Sigfox, NB-IoT | energy efficiency analysis for agricultural applications | — | modelling and use cases analysis |
| [49] | DASH7 | agricultural management | — | proof-of-concept |
| [50] | Telensa, Ingenu RPMA, LoRaWAN, Sigfox | agricultural management | — | performance evaluation |
Table 3.
System RF Summary.
| RX | TX | |||
|---|---|---|---|---|
| MHz | 433 | 868 | 433 | 868 |
| Antenna Type | whip | whip | whip | PCB dipole |
| Antenna Gain | 4.15 dBi | 4.15 dBi | 2.15 dBi | 1 dBi |
| TX Power | — | — | 9.9 dBm | 10.4 dBm |
| Radio Module | RAK831 | RN2483 | ||
Table 4.
Prototype Positions and Distance (approx. straight line) from the gateway (GW).
| Red Set | Green Set | ||
|---|---|---|---|
| Position | Distance[m] | Position | Distance[m] |
| POS A | 421 | POS 1 | 413 |
| POS B | 718 | POS 2 | 767 |
| POS C | 1080 | POS 3 | 860 |
| POS D | 1380 | POS 4 | 1050 |
| POS E | 1700 | ||
| POS F | 2050 | ||
Publisher’s Note: MDPI stays neutral with regard to jurisdictional claims in published maps and institutional affiliations. |
© 2021 by the authors. Licensee MDPI, Basel, Switzerland. This article is an open access article distributed under the terms and conditions of the Creative Commons Attribution (CC BY) license (https://creativecommons.org/licenses/by/4.0/).
Share and Cite
MDPI and ACS Style
Ojo, M.O.; Adami, D.; Giordano, S. Experimental Evaluation of a LoRa Wildlife Monitoring Network in a Forest Vegetation Area. Future Internet 2021, 13, 115. https://0-doi-org.brum.beds.ac.uk/10.3390/fi13050115
AMA Style
Ojo MO, Adami D, Giordano S. Experimental Evaluation of a LoRa Wildlife Monitoring Network in a Forest Vegetation Area. Future Internet. 2021; 13(5):115. https://0-doi-org.brum.beds.ac.uk/10.3390/fi13050115
Chicago/Turabian StyleOjo, Mike Oluwatayo, Davide Adami, and Stefano Giordano. 2021. "Experimental Evaluation of a LoRa Wildlife Monitoring Network in a Forest Vegetation Area" Future Internet 13, no. 5: 115. https://0-doi-org.brum.beds.ac.uk/10.3390/fi13050115
Note that from the first issue of 2016, this journal uses article numbers instead of page numbers. See further details here.