
CoKnowEMe: An Edge Evaluation Scheme for QoS of IoMT Microservices in 6G Scenario


Dipartimento di Ingegneria Elettrica, Elettronica ed Informatica (DIEEI), Universitá di Catania, 95125 Catania, Italy
*
Author to whom correspondence should be addressed.
Future Internet 2021, 13(7), 177; https://0-doi-org.brum.beds.ac.uk/10.3390/fi13070177
Submission received: 1 June 2021
/
Revised: 2 July 2021
/
Accepted: 2 July 2021
/
Published: 7 July 2021
(This article belongs to the Special Issue The Future Internet of Medical Things)
Abstract
:The forthcoming 6G will attempt to rewrite the communication networks’ perspective focusing on a shift in paradigm in the way technologies and services are conceived, integrated and used. In this viewpoint, the Internet of Medical Things (IoMT) represents a merger of medical devices and health applications that are connected through networks, introducing an important change in managing the disease, treatments and diagnosis, reducing costs and faults. In 6G, the edge intelligence moves the innovative abilities from the central cloud to the edge and jointly with the complex systems approach will enable the development of a new category of lightweight applications as microservices. It requires edge intelligence also for the service evaluation in order to introduce the same degree of adaptability. We propose a new evaluation model, called CoKnowEMe (context knowledge evaluation model), by introducing an architectural and analytical scheme, modeled following a complex and dynamical approach, consisting of three inter-operable level and different networked attributes, to quantify the quality of IoMT microservices depending on a changeable context of use. We conduct simulations to display and quantify the structural complex properties and performance statistical estimators. We select and classify suitable attributes through a further detailed procedure in a supplementary information document.

1. Introduction
1.1. Telecommunication Evolution and Status of 5G Deployment
During the last two decades the communication networks evolved from the first generation networks (1G) to the fifth generation (5G) by introducing a countless number of novel ideas to meet the stringent requirements set out [1]. Beyond 5G, some fundamental issues that need to be addressed are higher system capacity, higher data rate, lower latency, higher security and improved quality of service (QoS). For what concerns a global adoption of 5G, especially for low income and middle-income countries, investments for new generation of mobile telecommunication networks and infrastructure could be a crucial factor for economic growth, facilitating education, social cohesion, ideas exchange, access to global information, knowledge and learning. This kind of investment has rapidly become a priority, especially over the last couple of years, because of restrictions due to the COVID-19 pandemic and for this reason we have seen the expansion of 5G in countries across the world with rapid acceleration [2].
The penetration rate of 5G may be faster in comparison with 4G and previous technologies for different reasons, mainly due to the possibility of exploiting the existing LTE core network and the growing marketing of mobile technologies, favorable to a widespread 5G coverage, in Europe, the USA and Asia, primarily available in larger cities and in some regions [3,4]. In certain parts of the world, 5G has already been deployed, as shown and detailed in [2,5,6,7] (see Table 1). This means a further expansion of 5G across larger geographical regions unlocking the full potential of 5G, network slicing, ultra-low latency, improving the mobile experience of users. While the 5G systems will offer significant improvements, they will not be able to fulfill the demands of future emerging intelligent systems; 5G networks will not have the capacity to deliver a completely automated and intelligent network that provides everything as a service and a completely immersive experience [8]. For this reason, there is a growing interest in studying a new paradigm of wireless communication as the sixth-generation (6G) system, with the full support of artificial intelligence, expected to be implemented between 2027 and 2030 [8], as supported in a huge number of papers [8,9,10,11,12,13] where authors agree that the 6G networks will introduce a key enabler of intelligence, new technologies and network features. For further up-to-date details on very recent 6G studies, see Table 2.
1.2. Beyond 5G Networks towards 6G Revolution
A promising communication paradigm is represented by 6G that will have the ability to give a boost to the ongoing process of telecommunications evolution and to rule the entire health field from 2030 onward [13]. We are witnessing an increasing effect in both number of connected devices and demand for high-data rate services. In fact, with a growing number of mobile users and bandwidth-intensive services and applications, worldwide research activity is mainly interested in defining new paradigms for the next-generation 6G systems, in order to take into consideration all the last trends of this evolution, such as densification, higher rate, massive antenna, complexity, artificial intelligence (AI), computing and sensing [9,10,11,12]. It will revolutionize several fields toward a society of fully automated remote management systems including industry, health, roads, oceans and space jointly with the millions of sensors integrated into cities, vehicles, homes, industries, food, toys and other environments to provide a smart life and automated systems [8].
The 6G technology has the ambition to provide new directions to deal with future network challenges. It will address the constraints and the performance requirements of the applications and innovative services which need highly increasing resources, through innovative approaches [10]. Major challenge arises from the health related systems, since the new communication technology enables to envision the future healthcare in terms of well-being of people. The healthcare systems have to manage a wide variety of diseases, the increase of aging populations, the management of pandemics and jointly the effects of people awareness [14] and an increased number of treatments and patients [15]. The proliferation of devices ranging from simple sensors to sophisticated ones and the different network scenarios as cellular, vehicular, Wi-Fi, Internet of Things (IoT) and Internet of Everything (IoE) systems, shape a fully connected network of millions of people and billions of machines. In this context edge intelligence [16,17,18] will be a key enabling factor for future networks to improve performances, functions and services. In the edge application development the distributed and complex approach will be represented by the microservices able to develop modular lightweight application components. In the healthcare scenario, this context is suitable for enabling the Internet of Medical Things (IoMT) [19].
1.3. 6G as a Key Enabler for Internet of Medical Things
IoMT has the capability to interconnect various heterogeneous entities ranging from personal devices and healthcare providers to private companies. The advent of IoMT in a heterogeneous and dynamic environment is mainly due to increase in use and development of connected and distributed medical devices, leading to potential application and services that need to address several concerns. Since a cloud of Things and IoMT produce a huge amount of data concerning consumers, it is possible to combine services/data from one or multiple Things with services/data from virtual resources to dynamically allocate the connected heterogeneous things that can share resources, archives and tasks to provide services [20]. These ecosystems involve devices with constrained resources and computational capabilities and call for novel algorithms and a new characterization with the aim to dynamically manage lightweight and simple services, as a microservice, in mobile scenarios [21,22]. While in the literature, different schemes have been proposed with the aim of presenting evaluation models of a service [23,24,25,26,27,28,29,30]; this kind of service require a new innovative approach, since they are treated on the one hand as resources for healthcare and on the other hand as a complex network of combined and virtualized elements. In fact, it is essential to understand what is the quality of this kind of dynamical service which is characterized by an increasing demand for stringent requirements as data-driven and defined by extremely low-latency, ultra-reliable, fast and seamless wireless and mobile connectivity, including also the shift of distributed communications, control, computing, sensing and energy, from its core to its end nodes (edge clouds, Mobile Edge Computing (MEC), etc.).
1.4. A Complex and Dynamical Approach for a Context-Based Evaluation Model
In this work, we propose a new evaluation scheme, which has been called CoKnowEMe (context Knowledge evaluation model), modelling it following a complex and dynamical approach in accordance with the construction of IoMT services and taking into consideration the 6G paradigm and the healthcare scenario. The evaluation model consists of three different inter-operable levels. The different levels are based on the concepts of Acceptability, Usability and User Experience, which, combined together, allow a complete evaluation of the service, with both objective considerations, concerning the functional aspects and subjective ones, included through the study of user experience and the attributes that account for the interaction with the user.
The evaluation model is presented as a dynamic model capable of conveying the knowledge acquired from each of the levels considered and from their combination. Moreover, for each level, several attributes and sub-attributes have been identified as the key aspects to be investigated with the aim of mining the knowledge referred to the different features considered. We propose a dynamical schematic evaluation model jointly with an analytical model for each level considered. The quantification of the outputs provided uses the Weighted Sum Model (WSM) [31], in which the weight of the values of the corresponding attributes is determined by the context of use. The context of use plays a key role within the model as it manages how to modulate the intensity of the attributes of each concept, increasing the effectiveness and accuracy of the evaluation and its adaptability to the interconnection of the different elements of the IoMT services. For this reason, the model is proposed as a context-based evaluation model.
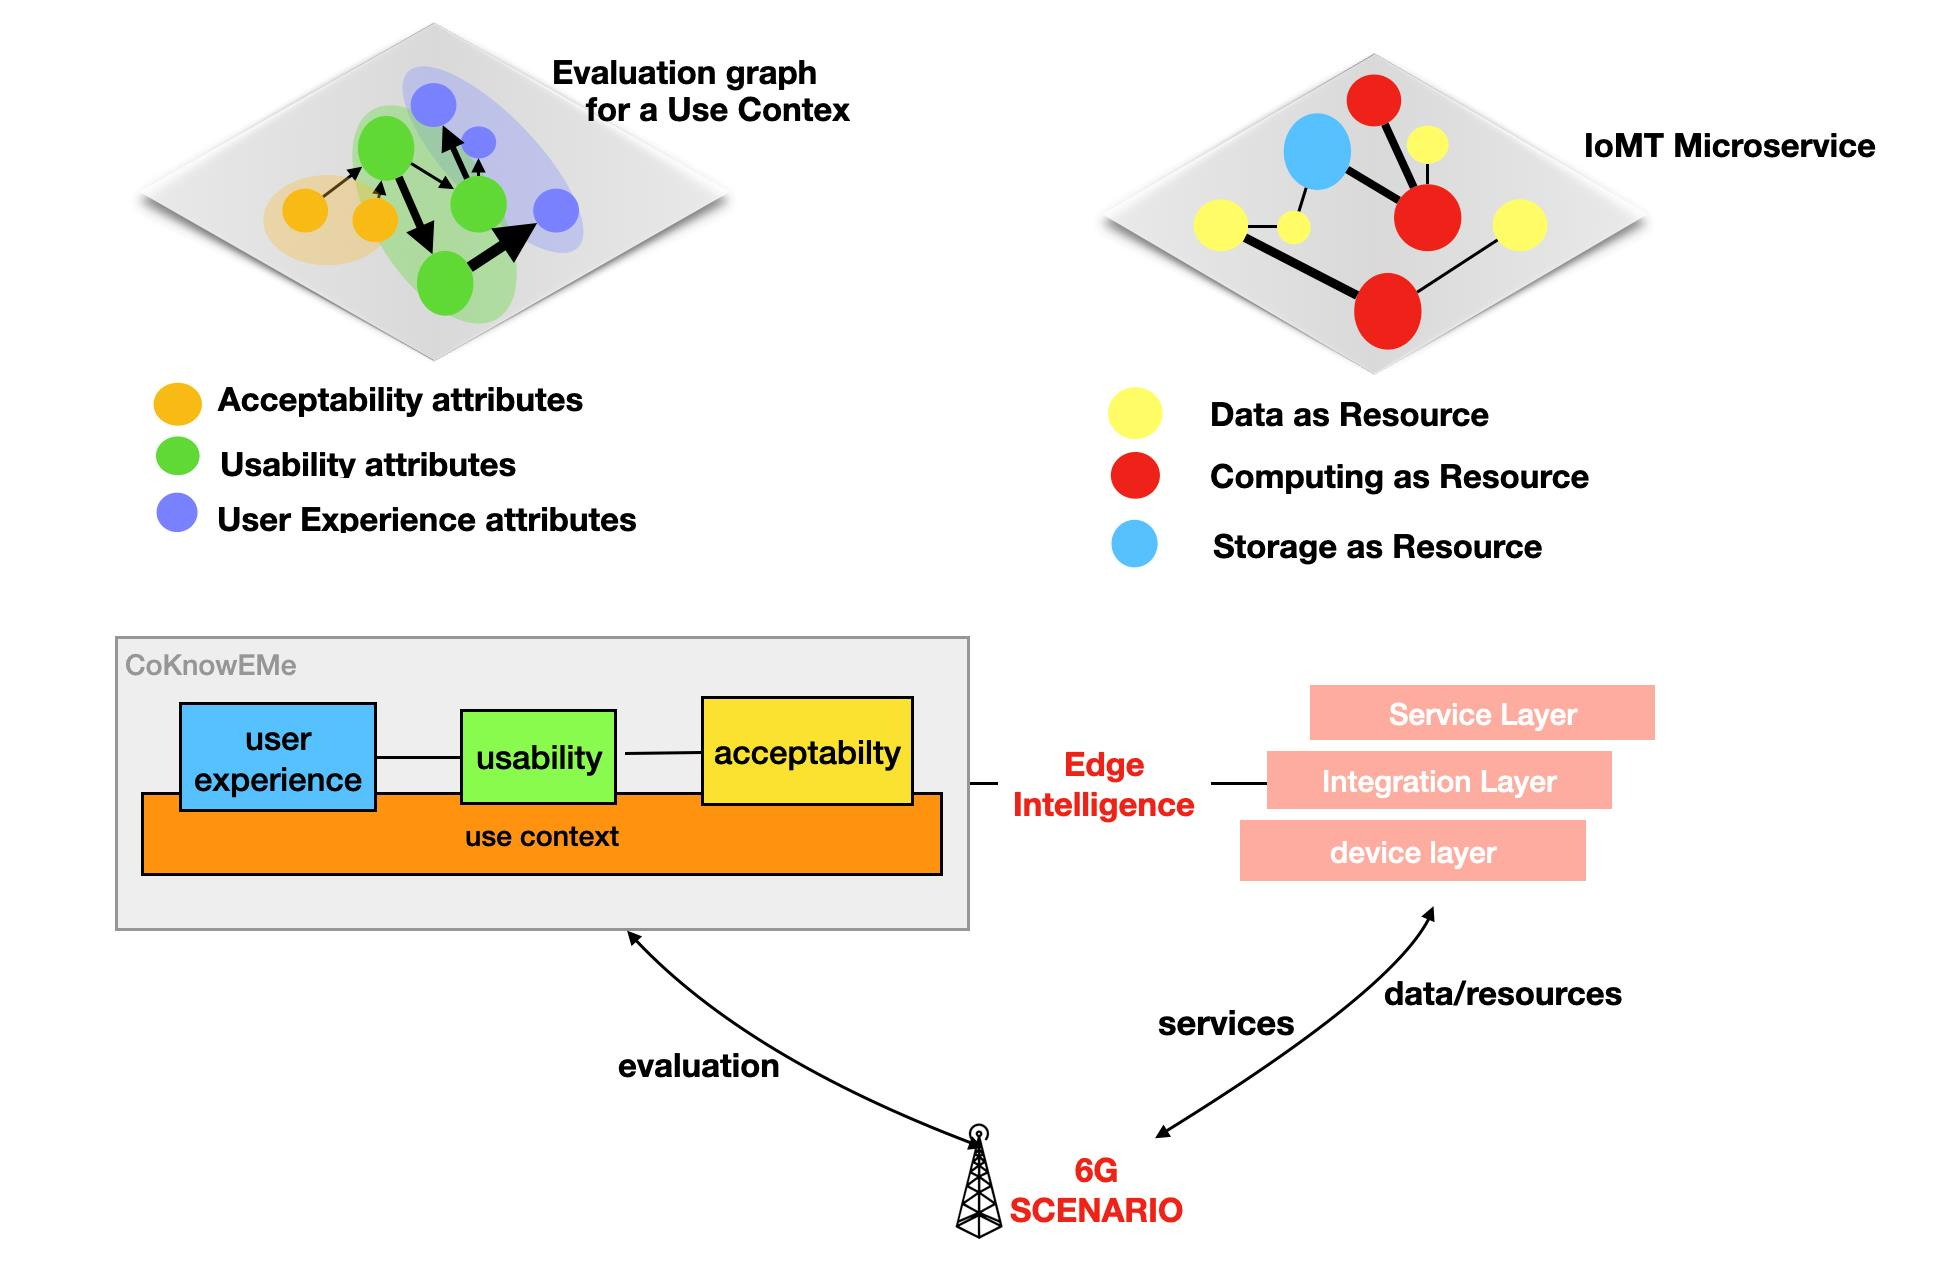
For the sake of clarity, we show the evaluation approach and the schematic representation in Figure 1 of a 6G scenario with heterogeneous sub-networks and systems and the plethora of entities from the mobile users and their devices (from wearable to hand-held) or the heterogeneous smart devices that form the IoT and IoMT networks. The aim of this representation is to schematically introduce a complex approach for both IoMT services and for the evaluation scheme, since each module can represent a resource in terms of data or computed output, in a multilevel architecture, which exploits the opportunity introduced by the edge intelligence. The 5G has already introduced a number of novel ideas to meet the stringent requirements set out, as, for example, heterogeneity, ultra-dense cells, mm-wave. The 6G network is expected to change the whole perspective of mobile communication networks by making the transformation from “connected things” or Internet of Things (IoT) or Internet from Everything to the “connected intelligence”. Complex systems and Edge Intelligence (EI) [10,16,17,18] powered by algorithms and techniques, such as machine learning, deep neural networks, diffusion dynamics and social network structure, are already being considered to be key missing elements in 5G networks. The upcoming 6G has the ambition to introduce heterogeneous and interconnected elements that can be represented by nodes of a complex network and can dynamically interact with each other as well as with their environment in an unpredictable and unplanned way. These ecosystems involve heterogenous devices with constrained resources and computational capabilities and call for novel algorithms and a new characterization for both dynamically managing and evaluating the lightweight services, as a microservice. Since we are rapidly moving from closed to open and distributed systems and to a completely dynamic topology that will be characterized by a vast heterogeneity, this requires an intelligence at edge level also for the evaluation of the services provided in order to introduce the same degree of adaptability [9,10,11,12,22].

Table 2.
Research works about 6G paradigm.
| Reference | Year | Keywords |
|---|---|---|
| [13] | 2020 | Emergency Service, Healthcare, 5G Communications, 6G Communications, Wireless Communications, Internet of Things, Internet of Everything, Vehicular Technology, Drones, Mobile Hospital, Hospital-to-Home Services, Fire Control, Accidental Services, Natural Disaster. |
| [9] | 2020 | 6G mobile communication, 5G mobile communication, Reliability, Wireless networks, Internet of Things, Intelligent sensors. |
| [10] | 2020 | Complex systems, complex networks, networked complex system, 5G, 6G, wireless communications, wireless networks, mobile communication networks, modelling |
| [11] | 2019 | 6G mobile communication, 5G mobile communication, Market research, Wireless communication, Sensors, Wireless sensor networks. |
| [12] | 2020 | 6G, wireless communications, terahertz band, intelligent communication environments, pervasive artificial intelligence, network automation, all-spectrum reconfigurable transceivers, ambient backscatter communications, cell-free massive MIMO, Internet of NanoThings, Internet of BioNanoThings, quantum communications. |
| [8] | 2020 | 5G, 6G, artificial intelligence, automation, beyond 5G, data rate, massive connectivity, virtual reality, terahertz. |
| [16] | 2020 | Computer Science, Distributed, Parallel, Cluster Computing, Artificial Intelligence, Networking and Internet Architecture. |
| [17] | 2020 | Self-learning edge intelligence, technological framework, seamless integration, communication networks, mobile edge computing, key missing components, edge-native AI, self-supervised generative adversarial nets, potential performance improvement, automatic data learning, edge computing networks, key research problems, edge-native artificial intelligence, communication network, wireless 6G cellular systems, self-learning architecture, self-learning-enabled 6G edge intelligence. |
| [18] | 2021 | Edge intelligence, 6G, Ultra-reliable low-latency, COVID-19, Internet of drones, Holographic communication. |
| [22] | 2020 | 6G, architecture, B5G, cellular communication, convergence, orchestration, sub-networks, wireless networks. |
| [30] | 2021 | Aggregation, differentiated services (Diffserv), edge intelligence, network traffic, preference logic, quality of experience (QoE), quality of service (QoS). |
| [32] | 2020 | Massive MIMO, holographic beamforming, Internet of everything (IoE), Machine learning, Distributed security. |
| [33] | 2021 | MEC, EGT, Temporal multiplex network, Social network, 6G. |
1.5. Organization of the Paper
The paper is organized as follow:
- In Section 2 we briefly introduce background and methods.
- In Section 3 we detail the novel evaluation scheme, the analytical methodology and the performance evaluation in a complex networked scenario.
- In Section 4 we conclude by discussing the potential implications of the proposal and the future works.
1.6. Contributions of the Paper
The main contributions of the paper are summarised below.
- We propose a novel evaluation scheme, which has been called CoKnowEMe (context knowledge evaluation model), for IoMT microservices in accordance with the complex approach suitable for the forthcoming 6G generation, taking into account what this paradigm will introduce in terms of enabling technologies, in particular driving towards more edge intelligent capabilities, such as computing, machine learning and evaluation of quality of services close to the users.
- We shed light on both architectural and analytical procedure, following a complex approach, consisting of three different interoperable levels, underlining how the interoperability of these chained different levels changes in accordance with the context of use.
- We follow the complex approach in line with the future 6G network and with the moving of the intelligence from the central cloud to edge computing resources since the computing of each evaluation module can represent a resource at edge level. A completely dynamic and heterogeneous topology requires an intelligence at edge level also for the evaluation of the services provided in order to introduce the same degree of adaptability. To this aim, we have also performed simulations to display properties of a networked set of heterogeneous attributes.
- We conduct a deep investigation concerning suitable attributes for each category considered in the evaluation scheme, summarizing this procedure and the findings of the selection and classification in the supplementary information document.
2. Materials and Methods
Here, we detail the background methodologies of the scenario firstly linked to the IoMT, microservices and the edge intelligence. Secondly, we address the main features of the complex approach and furthermore, there is a brief discussion on the modules of acceptability, usability and user experience and the weighted sum model used. These are concepts in continuous evolution over time; this is mainly due to the speed of technological evolution that we have witnessed in recent years; it is, therefore, clear that a global definition has not yet been provided. There have been many approaches to the study of service evaluation and different points of view and aspects have been dealt with, each of which provides a small contribution to the general understanding of what the quality of a service (QoS) is and how it can be assessed. The attributes and sub-attributes studied and selected in this paper are extracted from the best known and most often cited models in the literature [24,25,26,27,28,34,35,36]. Moreover, we describe the output of this literature investigation and selection and classification of the attributes and entry for each category and further details in the supplementary information document.
2.1. IoMT, Microservices and Edge Intelligence
The IoMT is progressing towards a smart, intelligent, reliable and automated infrastructure, thanks to the adoption of several evolving technologies, which make it possible to provide services everywhere and at any time in order to improve the human beings’ quality of life. In particular, distributed and edge computing and Web of Things platforms are crucial to enabling a fast and responsive IoMT system and to facilitate the ubiquity, reusability and interoperability of available resources. On the one hand, the current generation of IoMT nodes can be independently deployed at the edge, stand alone or embedded in patient’s devices, or deployed on infrastructure settings, both in hospital or home where the patient data needs to be monitored, where they collect diversified types of user-generated data such as emotional and physical health-related ones. The process of integration of the retrieved information is crucial, as their coordination and synchronization in order to provide advanced context-aware applications (such as behaviour monitors, fall detectors, automatic diary builders and so on). The storage and computing of these data can be done at the edge in the resource-constrained “medical things”, which allows data from IoMT devices to be processed locally reducing latency and security-related issues [32,37]. Edge computing and storage are forms of cloud parts that enable physically and logically moving the service-specific processing and data storage from the central to the edge network that is close to both the end users and providers. In 6G among the expected benefits the edge intelligence will contribute to all these aspects. The edge intelligence involves an increasing level of data processing and brings some new features linked to machine learning, evolutionary and self-organizing strategies and artificial intelligence and complex systems approaches on the clusters of nodes that can learn and share collectively [16]. On the other hand, thanks to the Web of Things, medical things can be seen as interconnecting devices into the Internet and web resources which can be easily discovered and accessed through traditional web standards (such as HTTP, REST, URI and so on) [20]. This paradigm, based on a resource-oriented architecture, improves the connectivity and reusability of context data and resources to deliver different kinds of health, wellness and ambient assisted living services. IoMT application can be split into independent execution units and microservices and therefore can be distributed across different medical things [38] for processing. In fact, in comparison with monolith software applications, whose modules cannot be executed independently and are unsuitable for distributed systems, microservices are cohesive, autonomic, replaceable and deployable independent processes interacting with each other through standardised interfaces [39].
2.2. A Complex Perspective towards 6G
Several real-world systems, from natural to man-made, such as communication networks, transportation infrastructure, biological systems and social interactions, are structured as networks, highly interconnected and characterized by non-trivial network topologies [40]. These systems can be classified as complex systems, totally described by the connectedness and the network representation of the elements belonging to them, which interact with each other through multiple, heterogeneous and interdependent links [10,41]. Interest is growing in many research fields in studying complex systems [10,40], particularly for what concerns aspects such as collective behaviours, interactions between the system and its environment and emerging patterns among many interacting elements. Network theory investigates the topology and structural patterns of the interactions among the constituent elements of many of complex systems [42]; in order to capture relevant information about the heterogeneity of such interactions it becomes useful to rescue multi-dimensional network representations, such as multiplex networks, where elements are represented as nodes connected through multiple types of links, at multiple time, or at multiple scales of resolution [43]. Along with this aspect in many real-world systems connections are characterized by a large variety in relevance and intensity. To this aim, it is useful to enrich the network representation defining links not only as a binary state, present or absent, but by a weight proportional to their intensity or capacity [41,42]. Some pivotal points of complex system theory such as emergence, adaptability, evolution, resilience, decentralization, self-organization and self-optimization are becoming key-factors for the next mobile communication networks which, especially in the forthcoming 6G, are characterized by an increasingly higher level of interdependence among their very heterogeneous components. For these reasons, the complex system approach represents an effective and useful tool able to monitor, model and design such networks [10,11,12].
2.3. Acceptability
The concept of acceptability has a complex nature as it depends on various factors belonging to different fields such as human sciences, engineering and psychology. Acceptability can be considered as the precursor to the use of a service and it can be considered as the composition of practical and social factors. The most used model to understand technological acceptance processes is the Technological Acceptance Model (TAM), which states that the intention to adopt a technology is already a good predictor for its use [28]. The TAM is based on the following fundamental constructs, Perceived Utility (PU), Perceived Ease of Use (PEOU), User Attitude (A) and Behavioural Intentions (BI), to explain the technological acceptance; however, as argued in several studies [29,44,45], the TAM does not take into account social influence in studying the adoption and use of technology. For this reason in [46] the model is extended, including social influence and psychological attachment. Social influence affects the behaviour of the individual on several levels classified as internalization, identification and conformity. Internalization is the highest level when an individual accepts influence as it fully corresponds to his own value system; identification represents the intermediate level when an individual accepts influence because he intends to establish or maintain a satisfactory relationship with another person or group; compliance is the lowest level—in this case an individual adopts a certain behaviour not because he believes in its content but because he expects to obtain rewards or avoid a punishment. The TAM has been widely used as a basis for the design of other models such as the Unified Theory of Acceptance and Use of Technology (UTAUT). Reference [29] extends the TAM to include determining factors (such as performance expectancy, effort expectancy, social influence, facilitation) and mediation factors (such as sex, age, experience, voluntariness). The advantage of these models is that they are applicable to several technologies. Other models have been proposed for specific use, such as the Mobile Technology Acceptance Model (MOPTAM) [29], which focuses on the acceptance of mobile phones, the Senior Technology Acceptance and Adoption Model (STAM), also designed on the basis of the TAM narrows the field to the elderly, and the Rural Technology Acceptance Model (RUTAM), according to which in rural areas social influence has a more important role than technology itself in determining acceptance [29,45]. The Expectation Confirmation Model (ECM-IT) [28] in the context of IT investigates the continued (or post-adoption) use of IT by exploiting three antecedent constructs, which are: User satisfaction with IT, extent of user confirmation and post-adoption expectations, the latter represented by perceived utility. This model considers satisfaction as the main influence on the user’s intention to continue using the technology. The extension of the previous models is the EECM-IT—Extended ECM-IT [28]—born from the merger of the TAM and ECM-IT, which considers, in addition to the perceived utility, also the perceived ease of use.
2.4. Usability
Further, with regard to the usability, there are many models available in the literature [25]. In the Quality in Use Integrated Map (QUIM) model [35] the usability is considered as a composition of factors, criteria, metrics and data while the people at the centre of mobile application development (PACMAD) [26,47] was designed specifically for mobile devices. The Goal Question Metric (GQM) [48], is a three-level hierarchical model used for mobile applications. In [27] the Mobile Application Usability Evaluation Metrics (MAUEM) model is proposed, this model extends the PACMAD by adding two new attributes, interruptability and simplicity, and it indicates the different metrics to measure the considered attributes. In [49], the authors, unlike the models seen so far, present six different aspects of usability; this suggests that approaching usability from multiple points of view can lead to a better understanding. The six proposed aspects are: Universal usability, which embraces the challenge of making products universally usable, despite the different abilities, backgrounds, styles and technological environments of the users; situational usability, which considers that users do not experience products in isolation but contextualizes them in different situations of use and consequently usability must be related to specific situations related to users, tasks and contexts of use; perceived usability, user-centered aspect, concerns the user’s subjective experience making him the final arbiter of usability; hedonic usability, is focused exclusively on pleasure and emotions and the joy of using a product rather than its ease of use; organizational usability is associated with groups of people who collaborate in an organizational context; cultural usability refers to the kind of usability and is defined as the extent to which a computer system, especially in contexts of intercultural use, adapts itself to the cultural background of its users in such a way as to support their activities in an efficient and enjoyable way.
2.5. User Experience
The User Experience (UX) is known as extremely subjective for its evaluation because it depends on user perceptions, emotions, preferences, beliefs and outcomes, resulting from the use of a service. For this reason, it should not be considered only as something that can be evaluated after the interaction with a service, but also before and during. The attributes or the different components concerning the UX have not been uniquely defined. For example, in [50] the authors proposed some metrics to measure UX, such as subjective satisfaction, consistency, attractiveness, familiarity, error tolerance, system terminology, predictability, feedback, help, control and freedom. Most of the metrics indicated in [50] are taken into consideration in the underlying levels of the proposed architectural model.
2.6. Weighted Sum Model (WSM)
The Weighted Sum Model (WSM) is a general model that can be used in different domains; in the ICT it is very often applied in multiple criteria decision analysis (MCDA) [19] and in optimization problems [51]. The key element of the WSM is a coefficient called weight, which quantifies the “degree of importance” of the different criteria (but also parameters, attributes and so on). In this way, it provides a tool to compare different alternatives in accordance with different criteria, combining the criteria and the weights assigned to each of them. The WSM has been applied to different scenarios; in [52] it is used within a selection scheme in order to numerically evaluate web services by considering several non-functional characteristics. In [53] the authors propose a model for service selection, based on consumer preferences and several properties of the service and implemented through the combined use of the Fuzzy Extended Analytic Hierarchical Process (FEAHP) and the WSM. In [54] the WSM is used to take into account, at the same time, subjective and objective parameters in the server selection. In this paper, we exploit the advantages of the WSM to propose a context-based evaluation scheme, in which, through the weights of the WSM, the attributes considered for each concept (acceptability, usability, user experience) are modulated in accordance with the use context. Moreover, the sum-based model allows us to build a modular architectural scheme, adding up the output of individual levels with the others, in a weighted way.
3. Results
3.1. Scenario
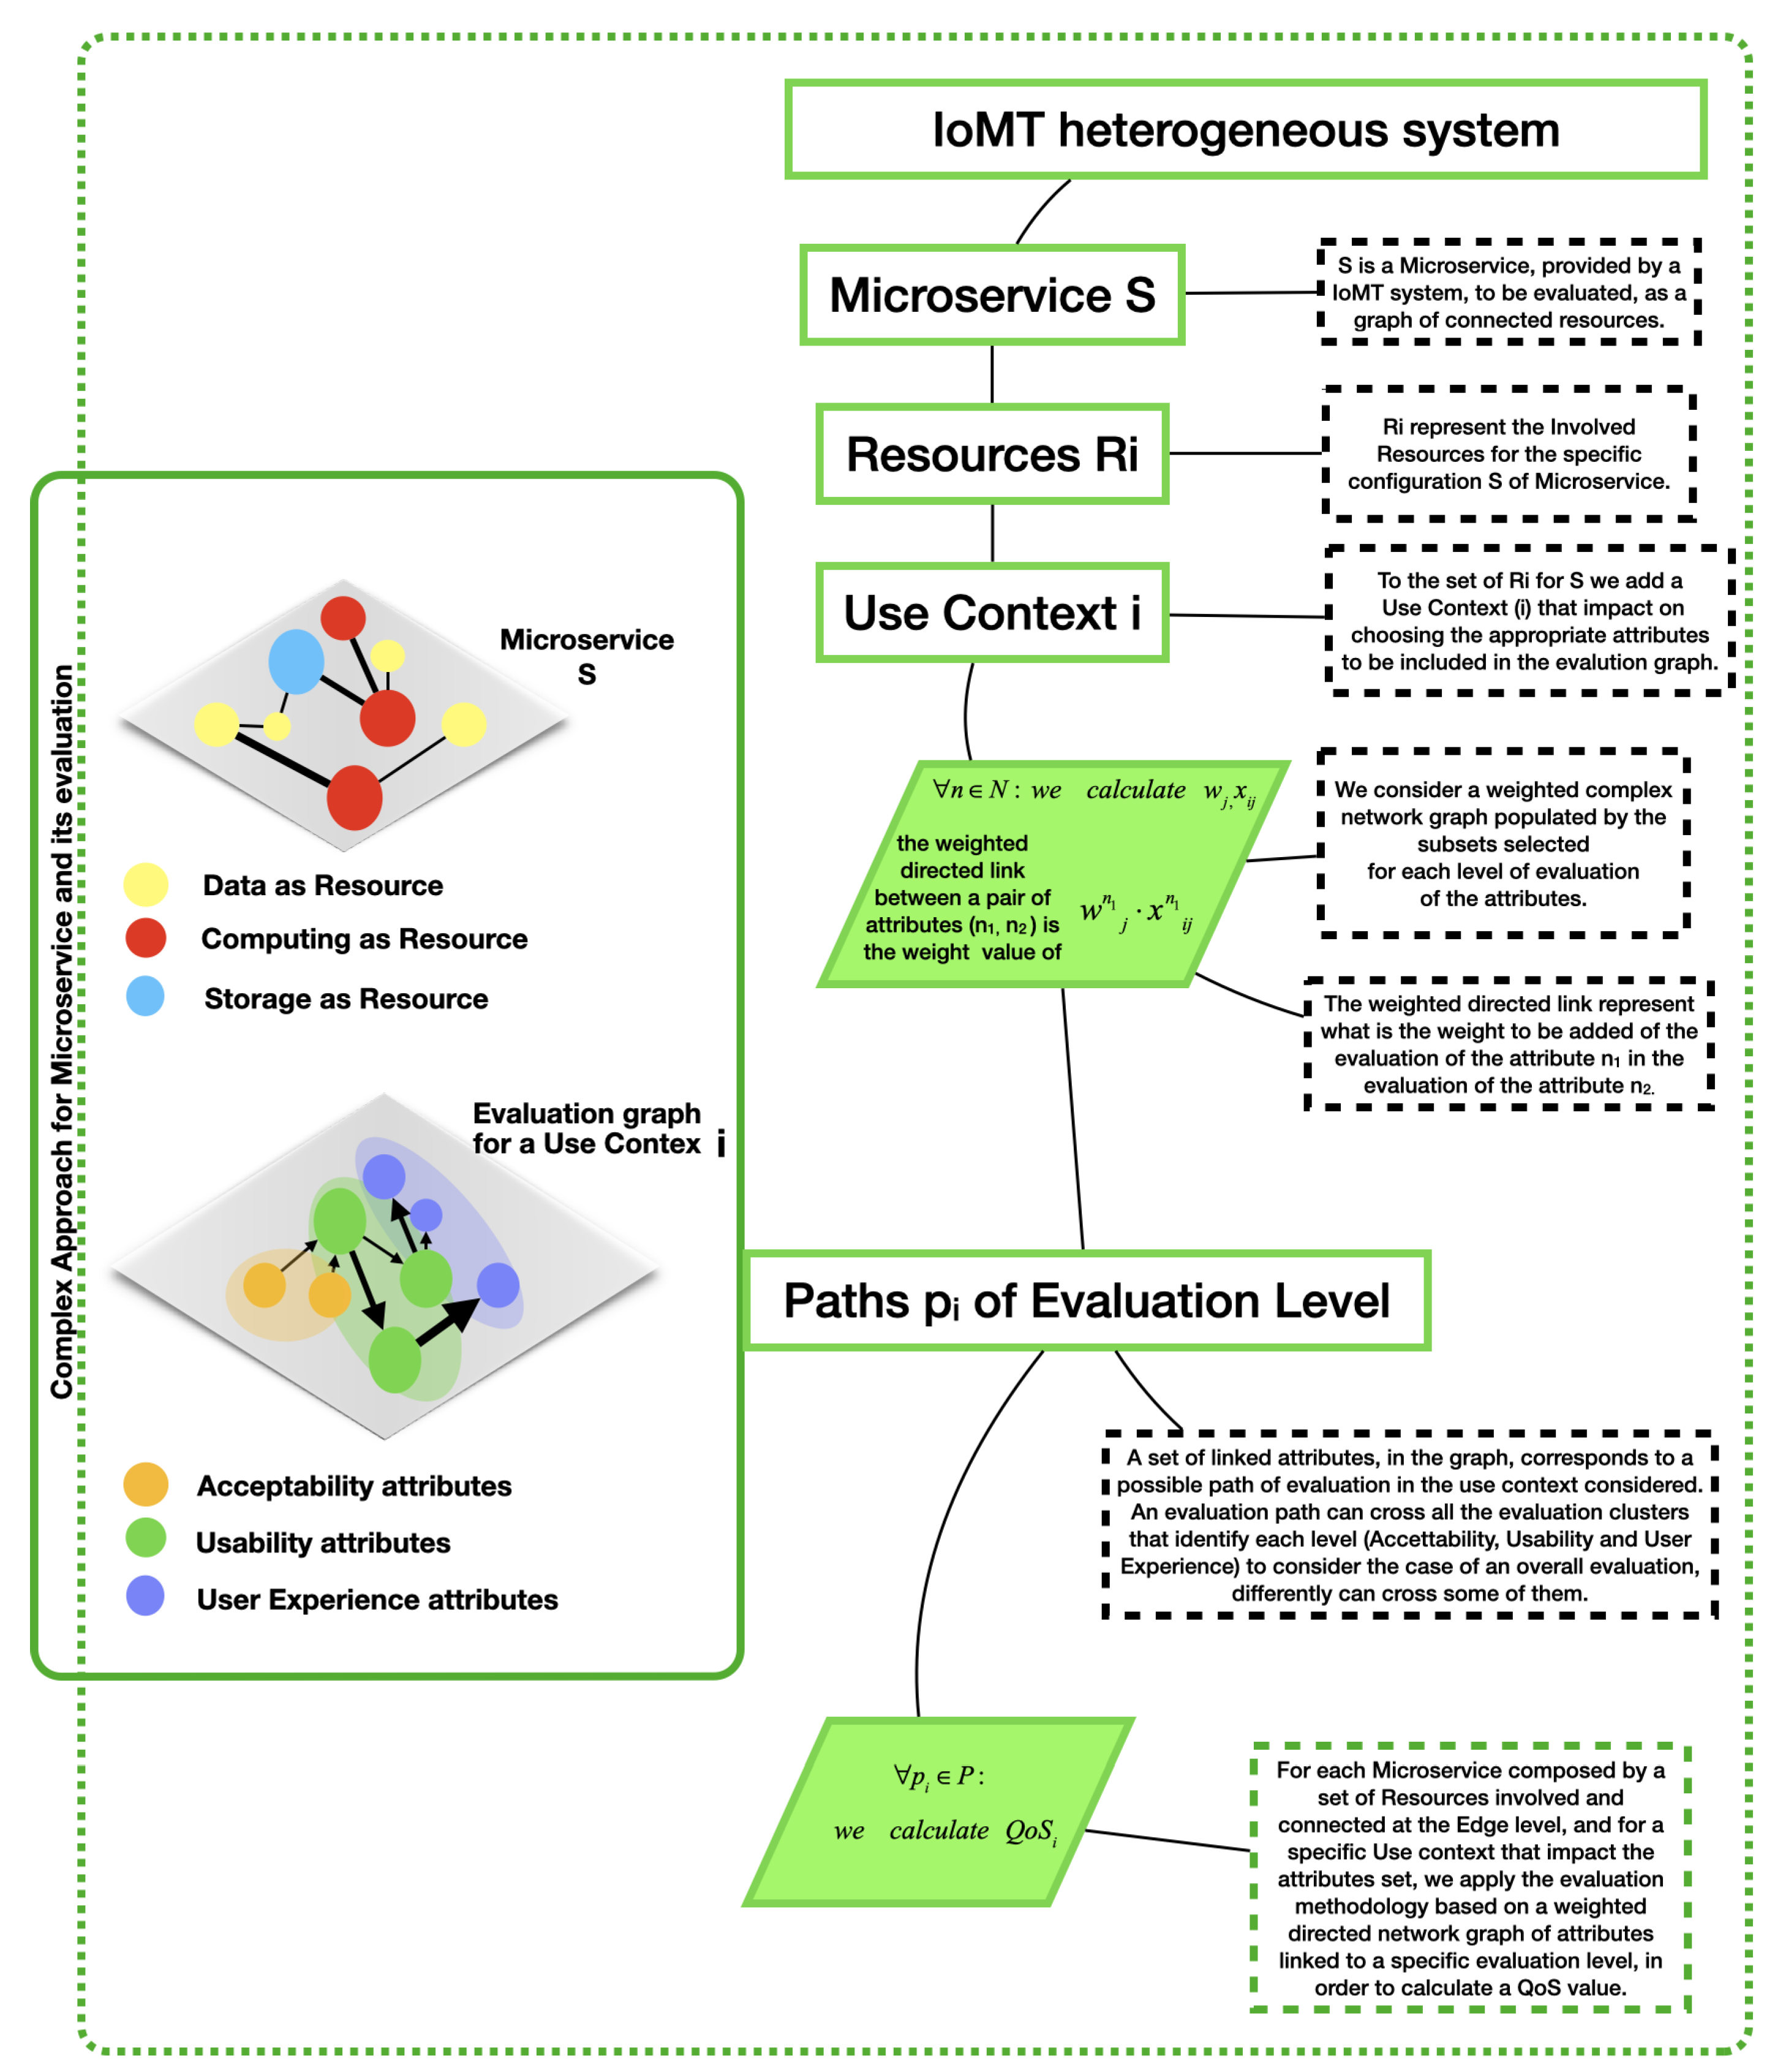
We propose an evaluation model for a 6G scenario, to assess, on edge level, the microservices of IoMT systems. As microservices are dynamically created at the edge level, similarly the evaluation follows the same approach. The edge nodes deal with the computing, storage, integration of heterogeneous data, the dynamical structural organization in space and time, according to a multiplex and complex approach [33], and the evaluation. The evaluation scheme, as presented in Figure 2, is designed following the key aspects of a lightweight application and in a modular way with interdependent and chained levels. Each output, from one of the level or from a combination of more than one, can be seen as a resource for the edge nodes that are organized to dynamically and consciously use and reuse the available resources and also to create new ones. This approach adds a key point in the design of the edge intelligence since in addition to carrying out services respecting the users’ requirements, making the best use of resources, it enables edge entities to assess the impact of the application on end user in a collective and dynamic way, close to the user itself. In the Figure 3, we detail the research method starting from the complex approach. Both the microservice construction and the evaluation scheme applied to it follow the complex approach. In fact, we consider the microservice construction as the result of a networked structure of resources that can change dynamically and shape a complex graph that follows the properties of the structures that arise in a wide array of different contexts such as technological and transportation infrastructure, social phenomena and biological systems [40,41].
3.2. Glossary
Before proceeding with the exposition of the architectural model and all the parts composing it, it is necessary to provide some definitions that will allow a better understanding of all the elements that make up the model and what is the relationship among them [55].
- Attribute: A measurable physical or abstract property of a service entity that can be measured using a quality metric.
- Metric: A measurement scale (i.e., nominal, ordinal, interval, ratio or absolute) combined with a measurement approach (i.e., measurement method or measurement function) that describes how the measurement is to be conducted. Each metric can also have multiple ways in which it can be calculated. There are three types of metrics:
- -
- Basic metric: A metric that does not depend on any other metric and uses a measurement method as a measurement approach.
- -
- Derived metric: A metric derived from other basic or derived metrics, using a measurement function as a measurement approach.
- -
- Indicator: A high-level quantitative metric derived from other metrics and using an analysis model as a measurement approach.
- Measurement method: A logical sequence of operations that are used to quantify a quality attribute using a basic metric.
- Unit of measurement: Quantity taken as a sample and term of comparison for the measurement of all quantities of the same species.
3.3. CoKnowEMe: Architectural and Analytical Model
The evaluation of a service is often a difficult task to complete, in the literature there are many models for the evaluation of Acceptability, Usability and User Experience; what we try to do, in this paper, is to capture the knowledge that each model carries within itself, proposing an adaptive architectural model capable of embracing all the aforementioned concepts (see Section 2). It can be applied to different areas by including a set of key concepts that make it upgradeable as needed, allowing a precise and ad hoc evaluation of a service. We propose an architectural model, which has been called CoKnowEMe (context knowledge evaluation model). The proposed model is based on a three-level structure: Acceptability, Usability and User Experience; each of them embraces a different aspect of the service, always taking into consideration the context of use, as shown in Figure 2. The adaptability of the model is given not only by the desired choice of versatile concepts that are able to adapt to different fields, but also by the ability of the model itself to allow the separate evaluation of concepts. Each level has been designed both to be used individually, since each level corresponds to a precise concept that can be fully evaluated thanks to its set of attributes and for the construction of a multi-conceptual evaluation. Each layer acts as a base for the next level resulting in a set of building blocks of the entire evaluation.
The model, which at first sight appears as a simple chain of three concepts, was designed to be easily used by anyone who wants to establish the quality of a service; hence, the choice of such a small number of concepts. However, the power of the tool derives precisely from the versatility and the lack of a standard definition of the concepts themselves, which allows the more experienced to make a more accurate evaluation, adding new and more specific attributes inherent to the scope of application treated. The proposed model, in fact, is aimed at all service stakeholders, i.e., those who need to measure and use the proposed metrics [55]:
- Supplier: Person, organization or body, belonging to a specific sector that provides a specific type of service.
- Broker: Intermediary who negotiates the relationship between consumer and service provider.
- Consumer: Person or organization that maintains a commercial relationship and uses the services made available by service providers.
- End user: The people or organizations that are the customers of the service.
- Developer: Intended as a service partner, it can be a developer, integrator, tester, etc.
The multilevel structure of the model is shown in Figure 2.
3.3.1. Approach to Literature Review, Entry Selection and Classification
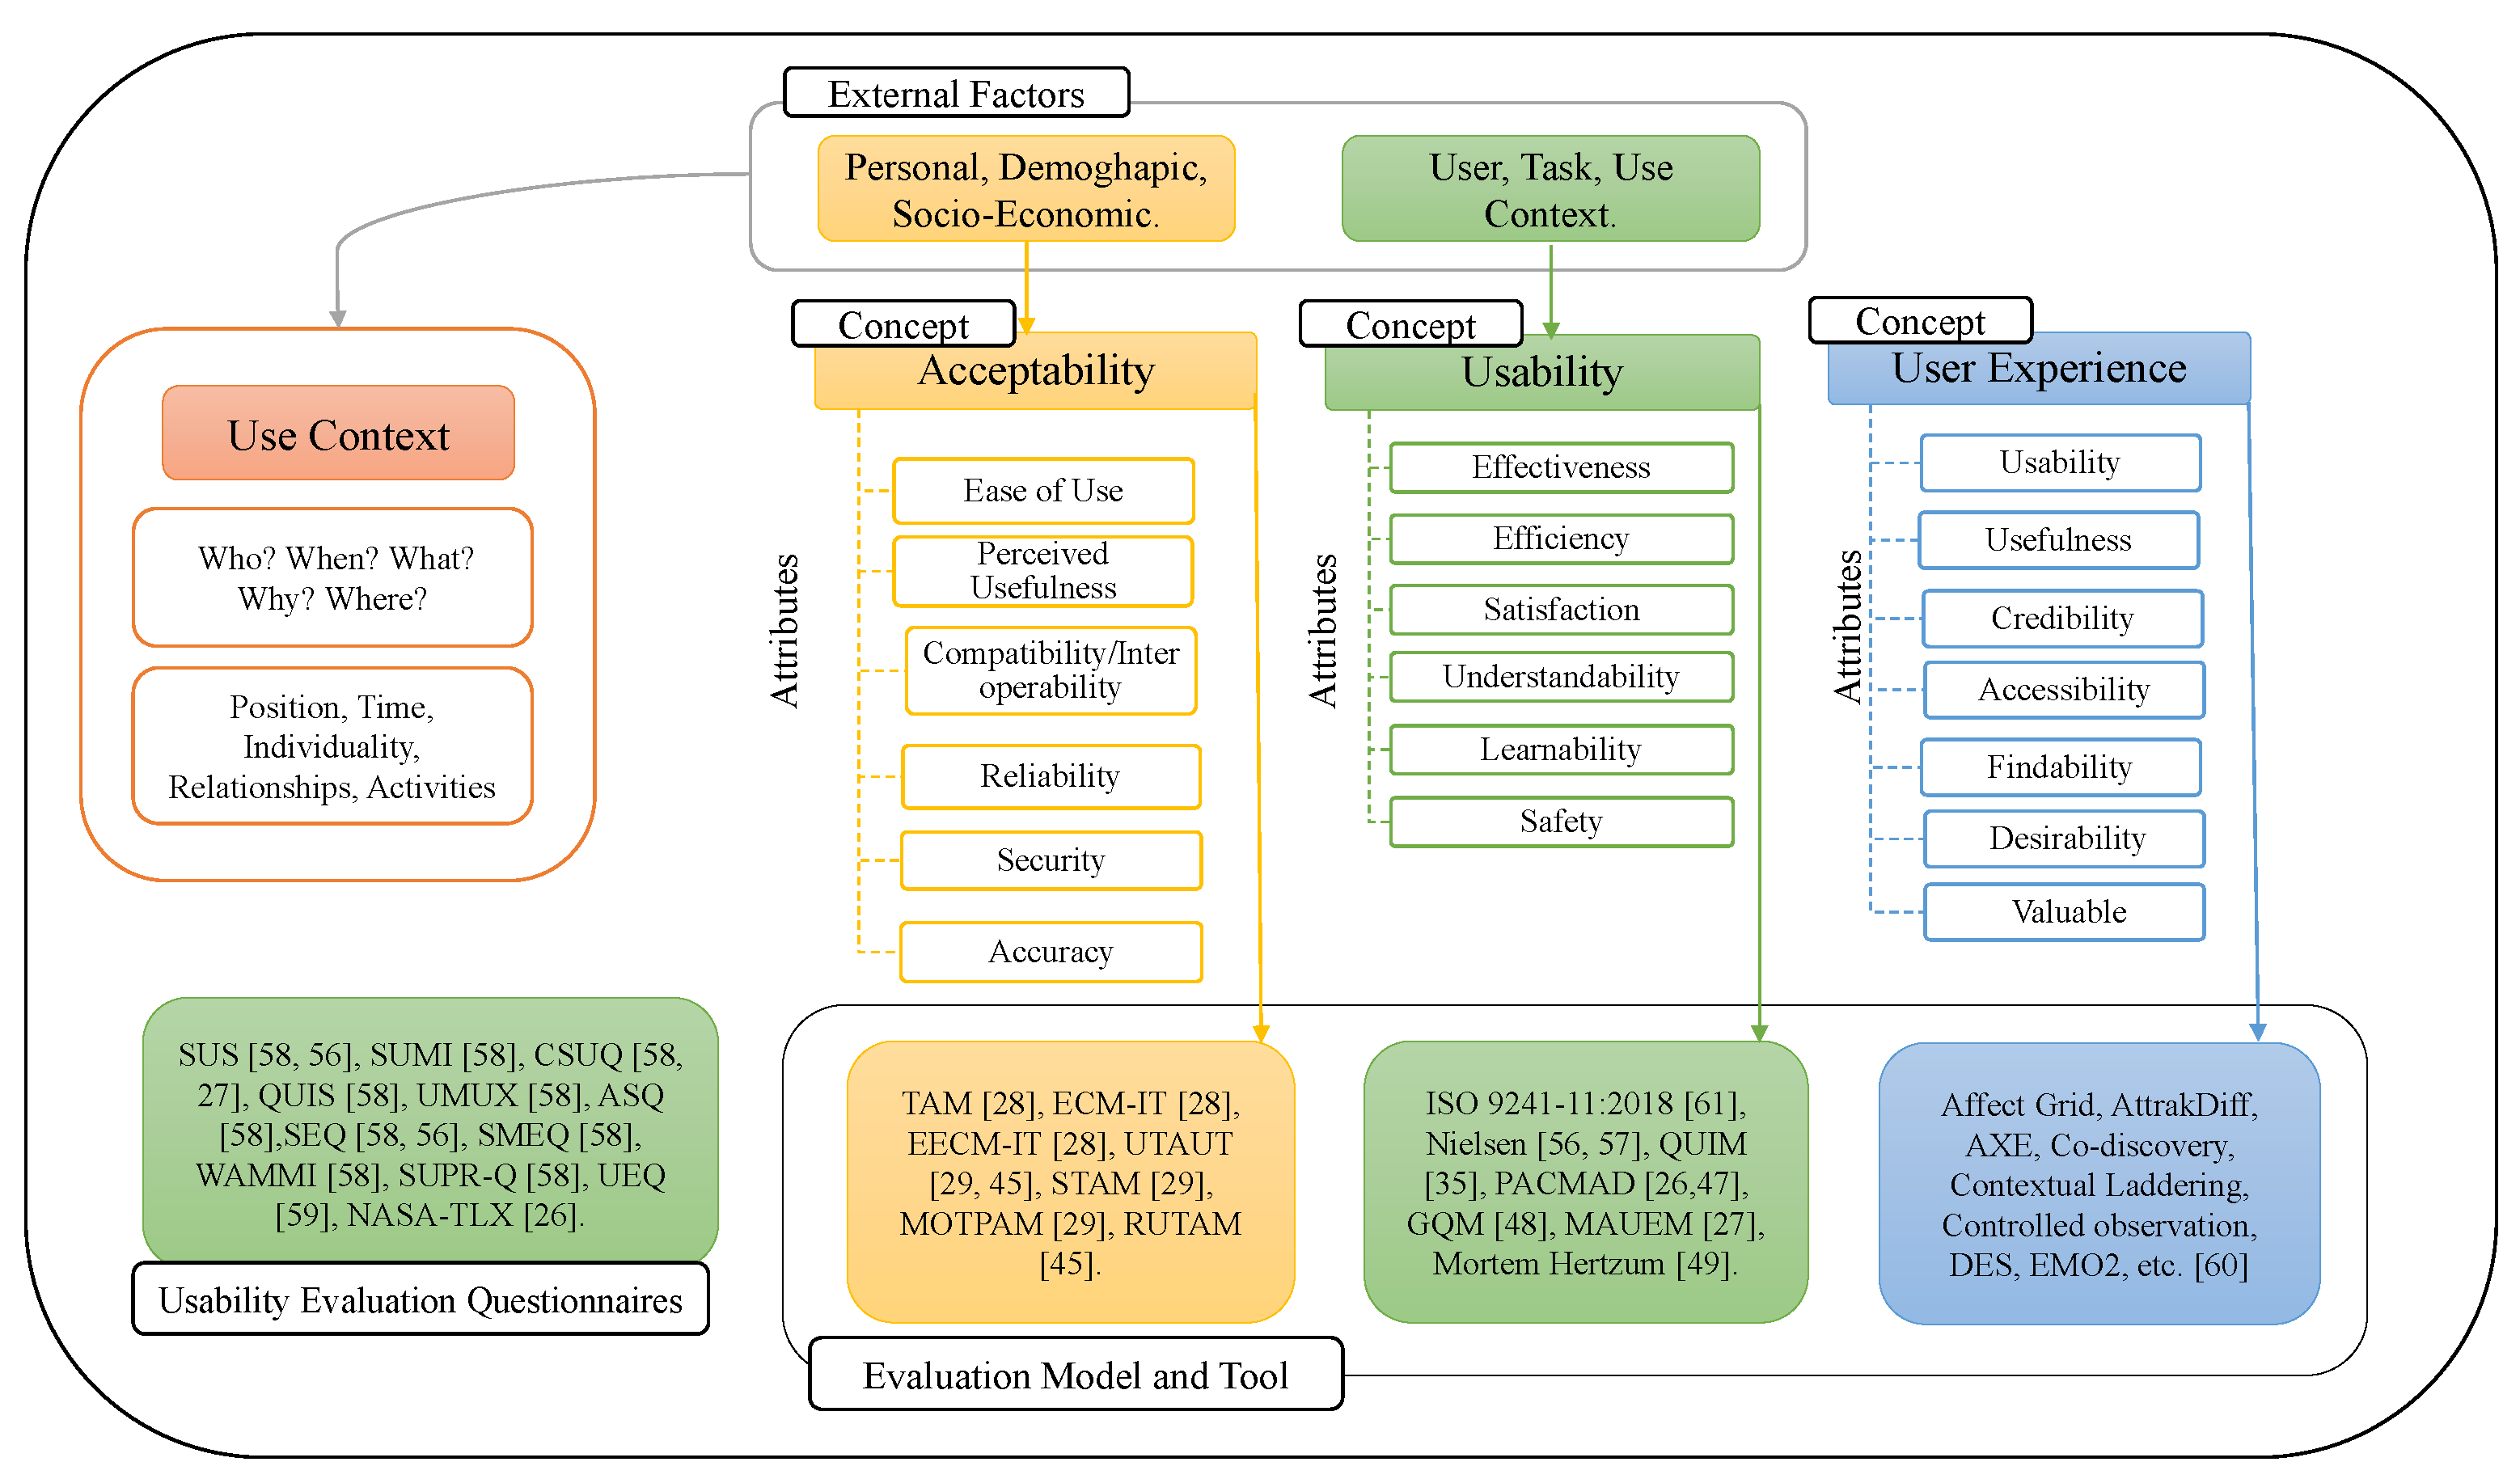
In this paper, the attributes and sub-attributes, considered in the architectural and analytical model, for the evaluation methodology, have been selected and investigated from the best known and most often cited models in the literature, creating a comprehensive literature review that starts with broad search of the relevant research in the field. To achieve the best possible result and to be able to search the existing publications we decided on the most popular search engines: Scopus, Web of Science and Google Scholar. As summarized in Figure 4, we deeply detail the attributes and sub-attributes studied and selected in this paper, extracted from the best known and most often cited models in the literature [24,25,26,27,28,34,35,36,56,57,58,59,60,61]. Furthermore, we describe the selection procedure, the entry for each category and more information. We describe the output of this literature investigation and selection procedure in the supplementary information document, the entries for each category and more details. After an initial screening, in the supplementary information document we present the details of output of the search through the databases that gave us well over several papers.
3.3.2. First Level: Acceptability
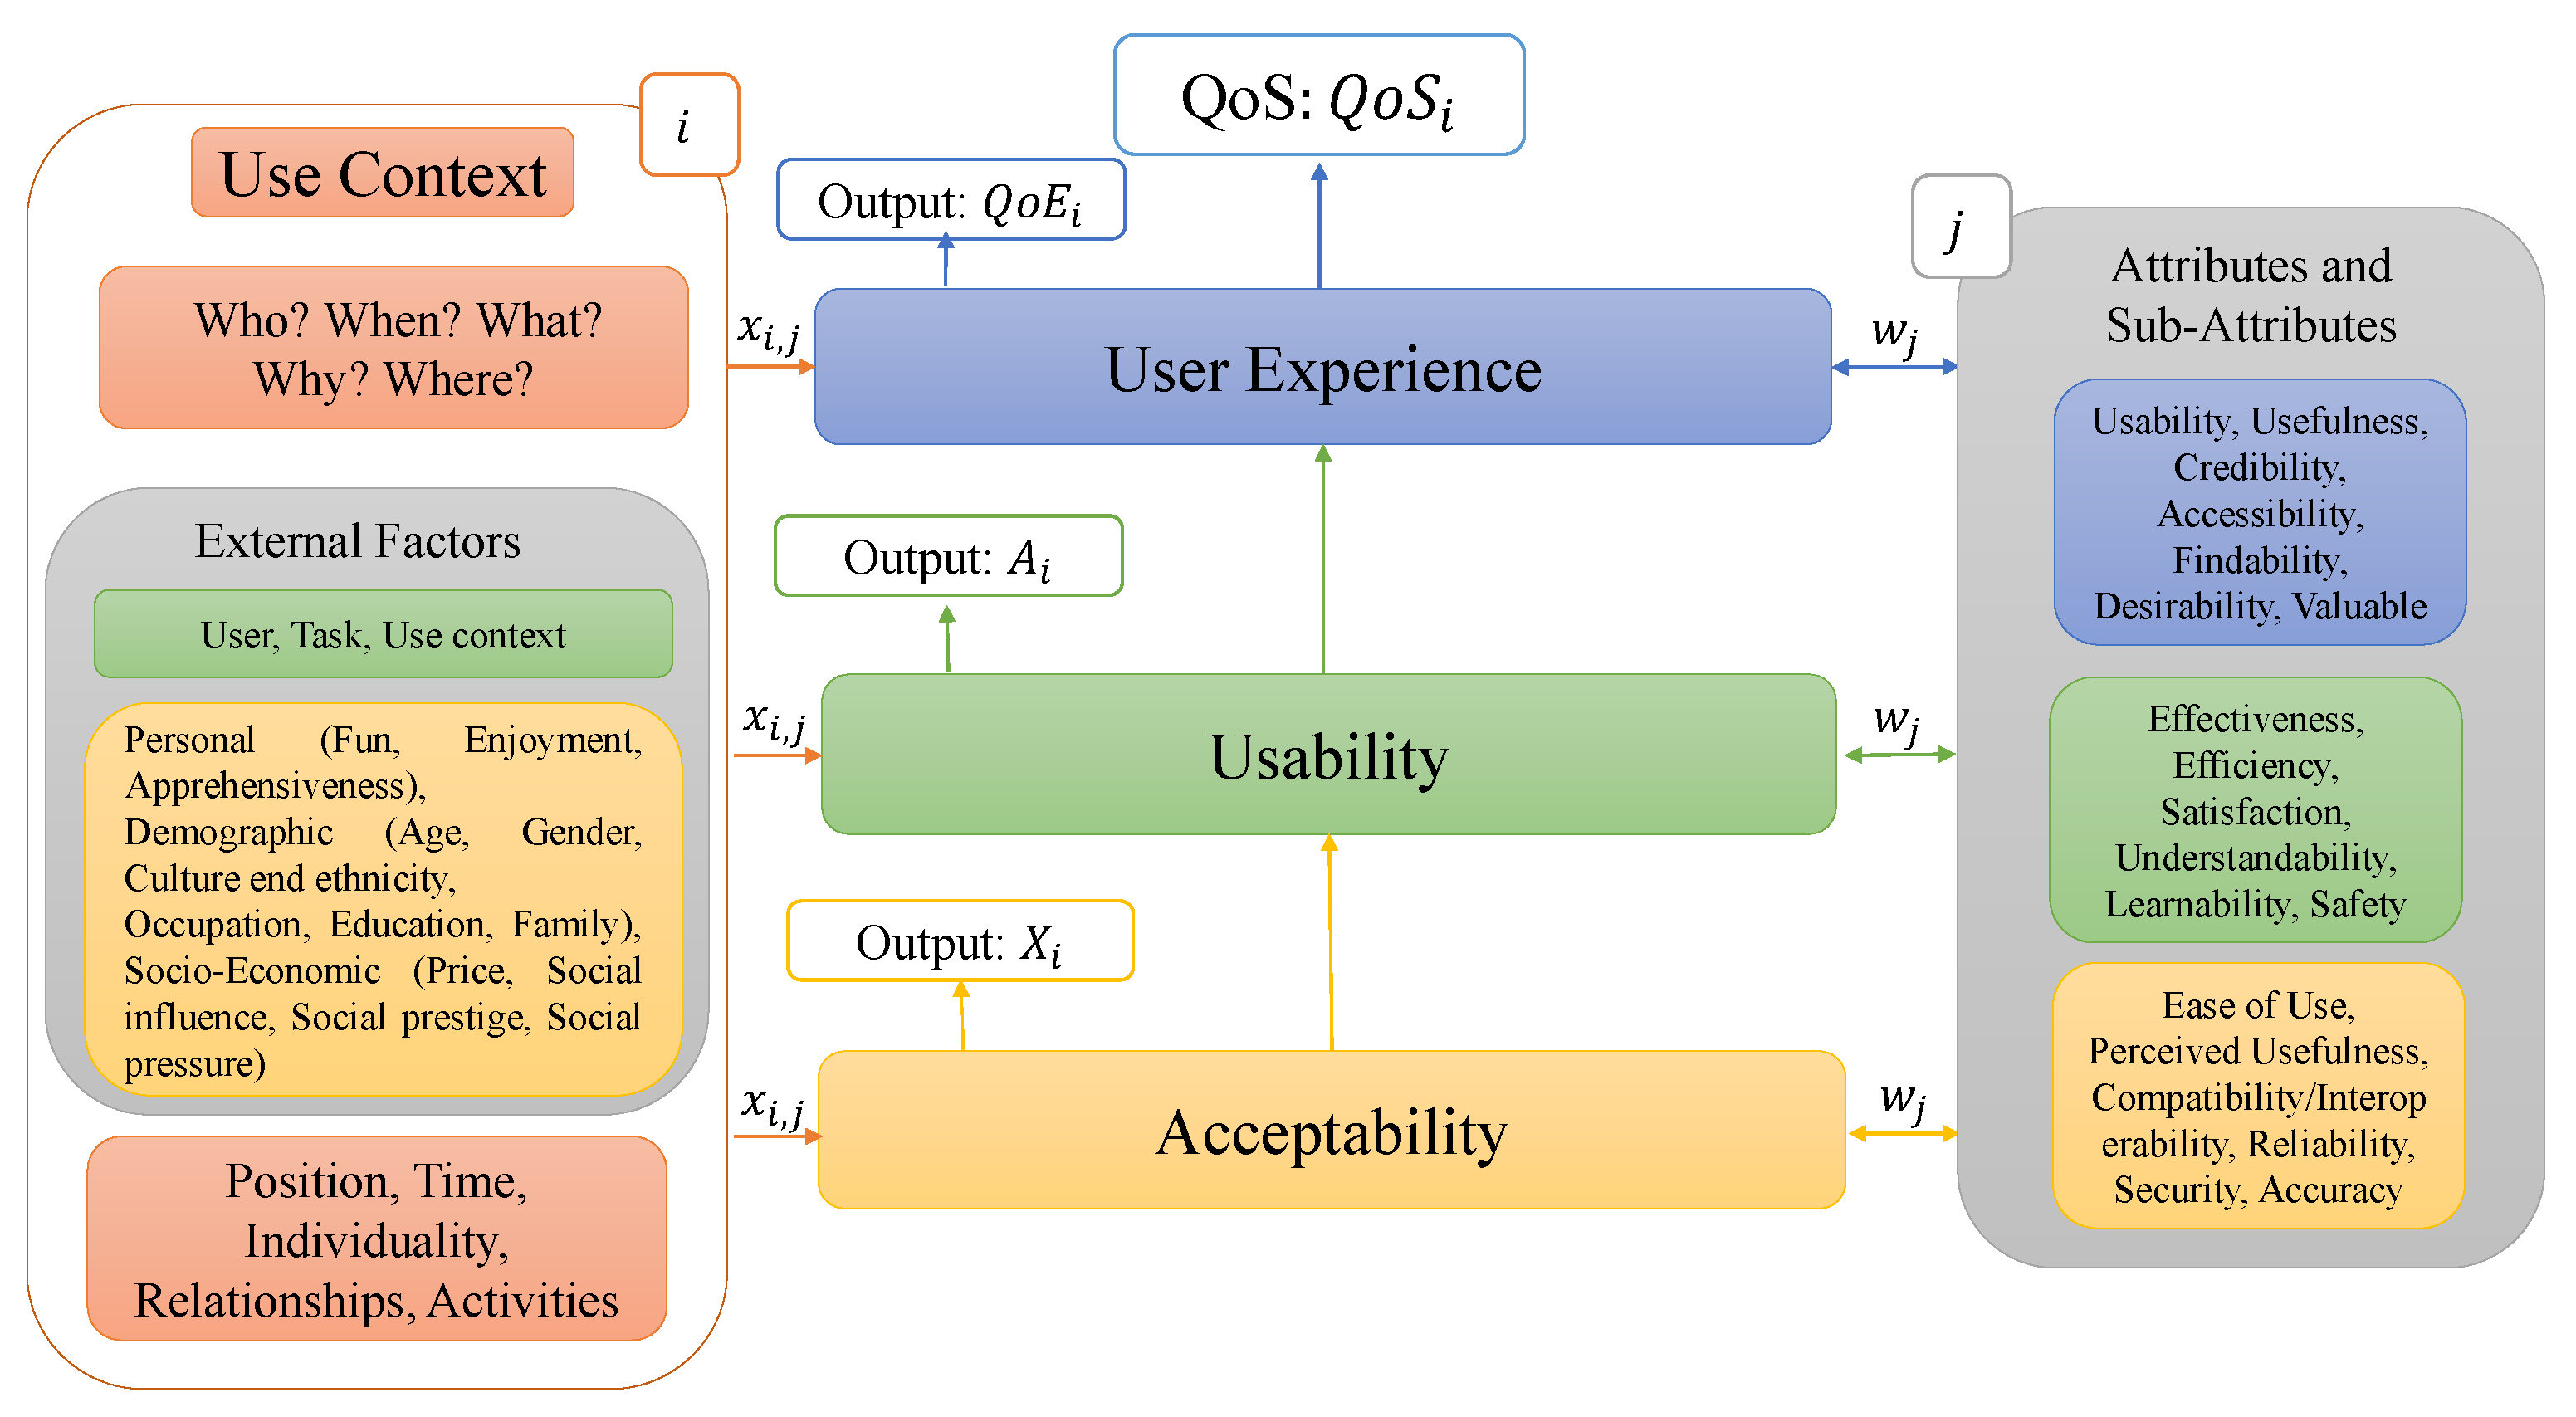
In this work, acceptability is considered as the first level of the proposed architectural model and it is studied thanks to the attributes and sub-attributes that characterize it and to the identification of metrics that allow its measurement, to understand when use of a service can be considered acceptable from users. For acceptability, six attributes are identified as follows: Ease of use, perceived usefulness, compatibility/interoperability, reliability, accuracy and security and eight secondary attributes: Availability, recoverability, fault tolerance, robustness, integrity, confidentiality, non-repudiation and authenticity. The acceptability assessment conducted at this level is valid both for its own use and as an input for the second; in fact, the result obtained is considered an attribute of the next level. This allows us to take into account acceptability within usability and moreover, thanks to the weight assigned to it, it is possible to establish its importance from the usability point of view.
3.3.3. Second Level: Usability
Usability, included in the second level of CoKnowEMe, can only be evaluated following the use of the service. This level also has the peculiarity of marking the boundary between objectivity and subjectivity of the evaluation as the use of the service is evaluated at the level of performance, through effectiveness, efficiency and of the emotional sphere of a user, through satisfaction. Therer are six considered attributes to evaluate usability—effectiveness, efficiency, satisfaction, learnability, safety and understanding—jointly with several sub-attributes. The usability evaluation can take place independently from the other levels, by considering this level as a single module that evaluates the usability of a service, or as an integral part of an overall evaluation of the service that takes into account all aspects. The usability keeps the underlying level incorporated by inserting it among its attributes and assigning it a weight. The result of the usability evaluation is subsequently given as input to the next level where it is treated as an attribute of the user experience.
3.3.4. Third Level: User Experience
The user experience (UX) is embedded in the last level of the architectural model proposed in this paper. The attributes taken into consideration for the UX evaluation are the following: Utility, usability, credibility, accessibility, findability, desirability and value; these attributes are key elements for successful software design and crucial to evaluate the UX as they allow us to identify what are the most important aspects of the user experience. For the user experience level the attributes and metrics identified and used within the model are detailed in the supplementary information document. By incorporating UX into the evaluation, it is possible to have a holistic view of the service since it represents the last step in the overall evaluation of the quality of service (QoS). However, the structure of the model allows to use the layer independently from the underlying layers. The evaluation of the service provides also the quality of experience (QoE). The different levels of the architectural model are connected to each other and able to provide a valid output for the evaluation of the single concept. Therefore it is possible to carry out a partial evaluation, referring to only one aspect of the service using the corresponding layer.
3.3.5. Use Context
The use context is the set of ideas, situations, events or information that makes it possible to fully understand the context in which a service is immersed. Ignoring the context means a lack of information related to the circumstances in which a statement, observation or concept is evaluated. Taking into account this information allows a deeper understanding, emphasizing key features and crucial aspects of the specific case. The use context influences the concepts of usability, acceptability and user experience and, in a constantly evolving environment, it is crucial for understanding the factors that influence both the service and the user’s interaction with the service itself. The user has a central role in the interaction with the service and his background or any physical limitations cannot be neglected in any way. The purpose for which the user decides to use the service affects the evaluation of the service itself; for this reason its functions should not be too complex in order to reduce the risk of compromising the understanding of the service and of its usability. In this paper, we consider the use context as a transverse element that impacts on each level by means of the weights assigned to each attribute (see Figure 2). These weights are established from time to time and allow to analytically consider the context of use and to modulate the importance of each attribute in accordance with it. The choice of which are the most relevant elements to be taken into consideration in order to define the context of use and the attributes’ weights depends on the information retrieved from the user-related data collected by the medical things, stand-alone sensors or embedded in patients’ devices. In this paper, we aim at identifying all the possible elements that characterize the context of use and relate them to the different concepts by means of their weights.
3.3.6. Analytical Model
Following the schematic architectural model shown in Figure 2, here we detail the mathematical model based on it. The model proposed is based on the WSM [31], which is widely used for multi-criteria analysis and allows, thanks to a composition of weights and parameters, to consider the importance of each parameter in a different way. In the proposed CoKnowEMe the parameters are the values resulting from the evaluation of individual attributes, while the weights are determined, from time to time, in accordance with the considered use context. In this way, the context of use determines the relevance of each attribute through the weights. Let us assume that is the weight of an attribute j in context i and that is the value of attribute j, calculated using the corresponding metrics, where , which are all the possible m contexts and , which is all the n attributes related to the considered concept. Therefore, denotes the value of the evaluation of the concept under consideration (acceptability, usability and user experience) in a context i and it is the weighted average of all the attributes related to the considered concept; is calculated as follows:
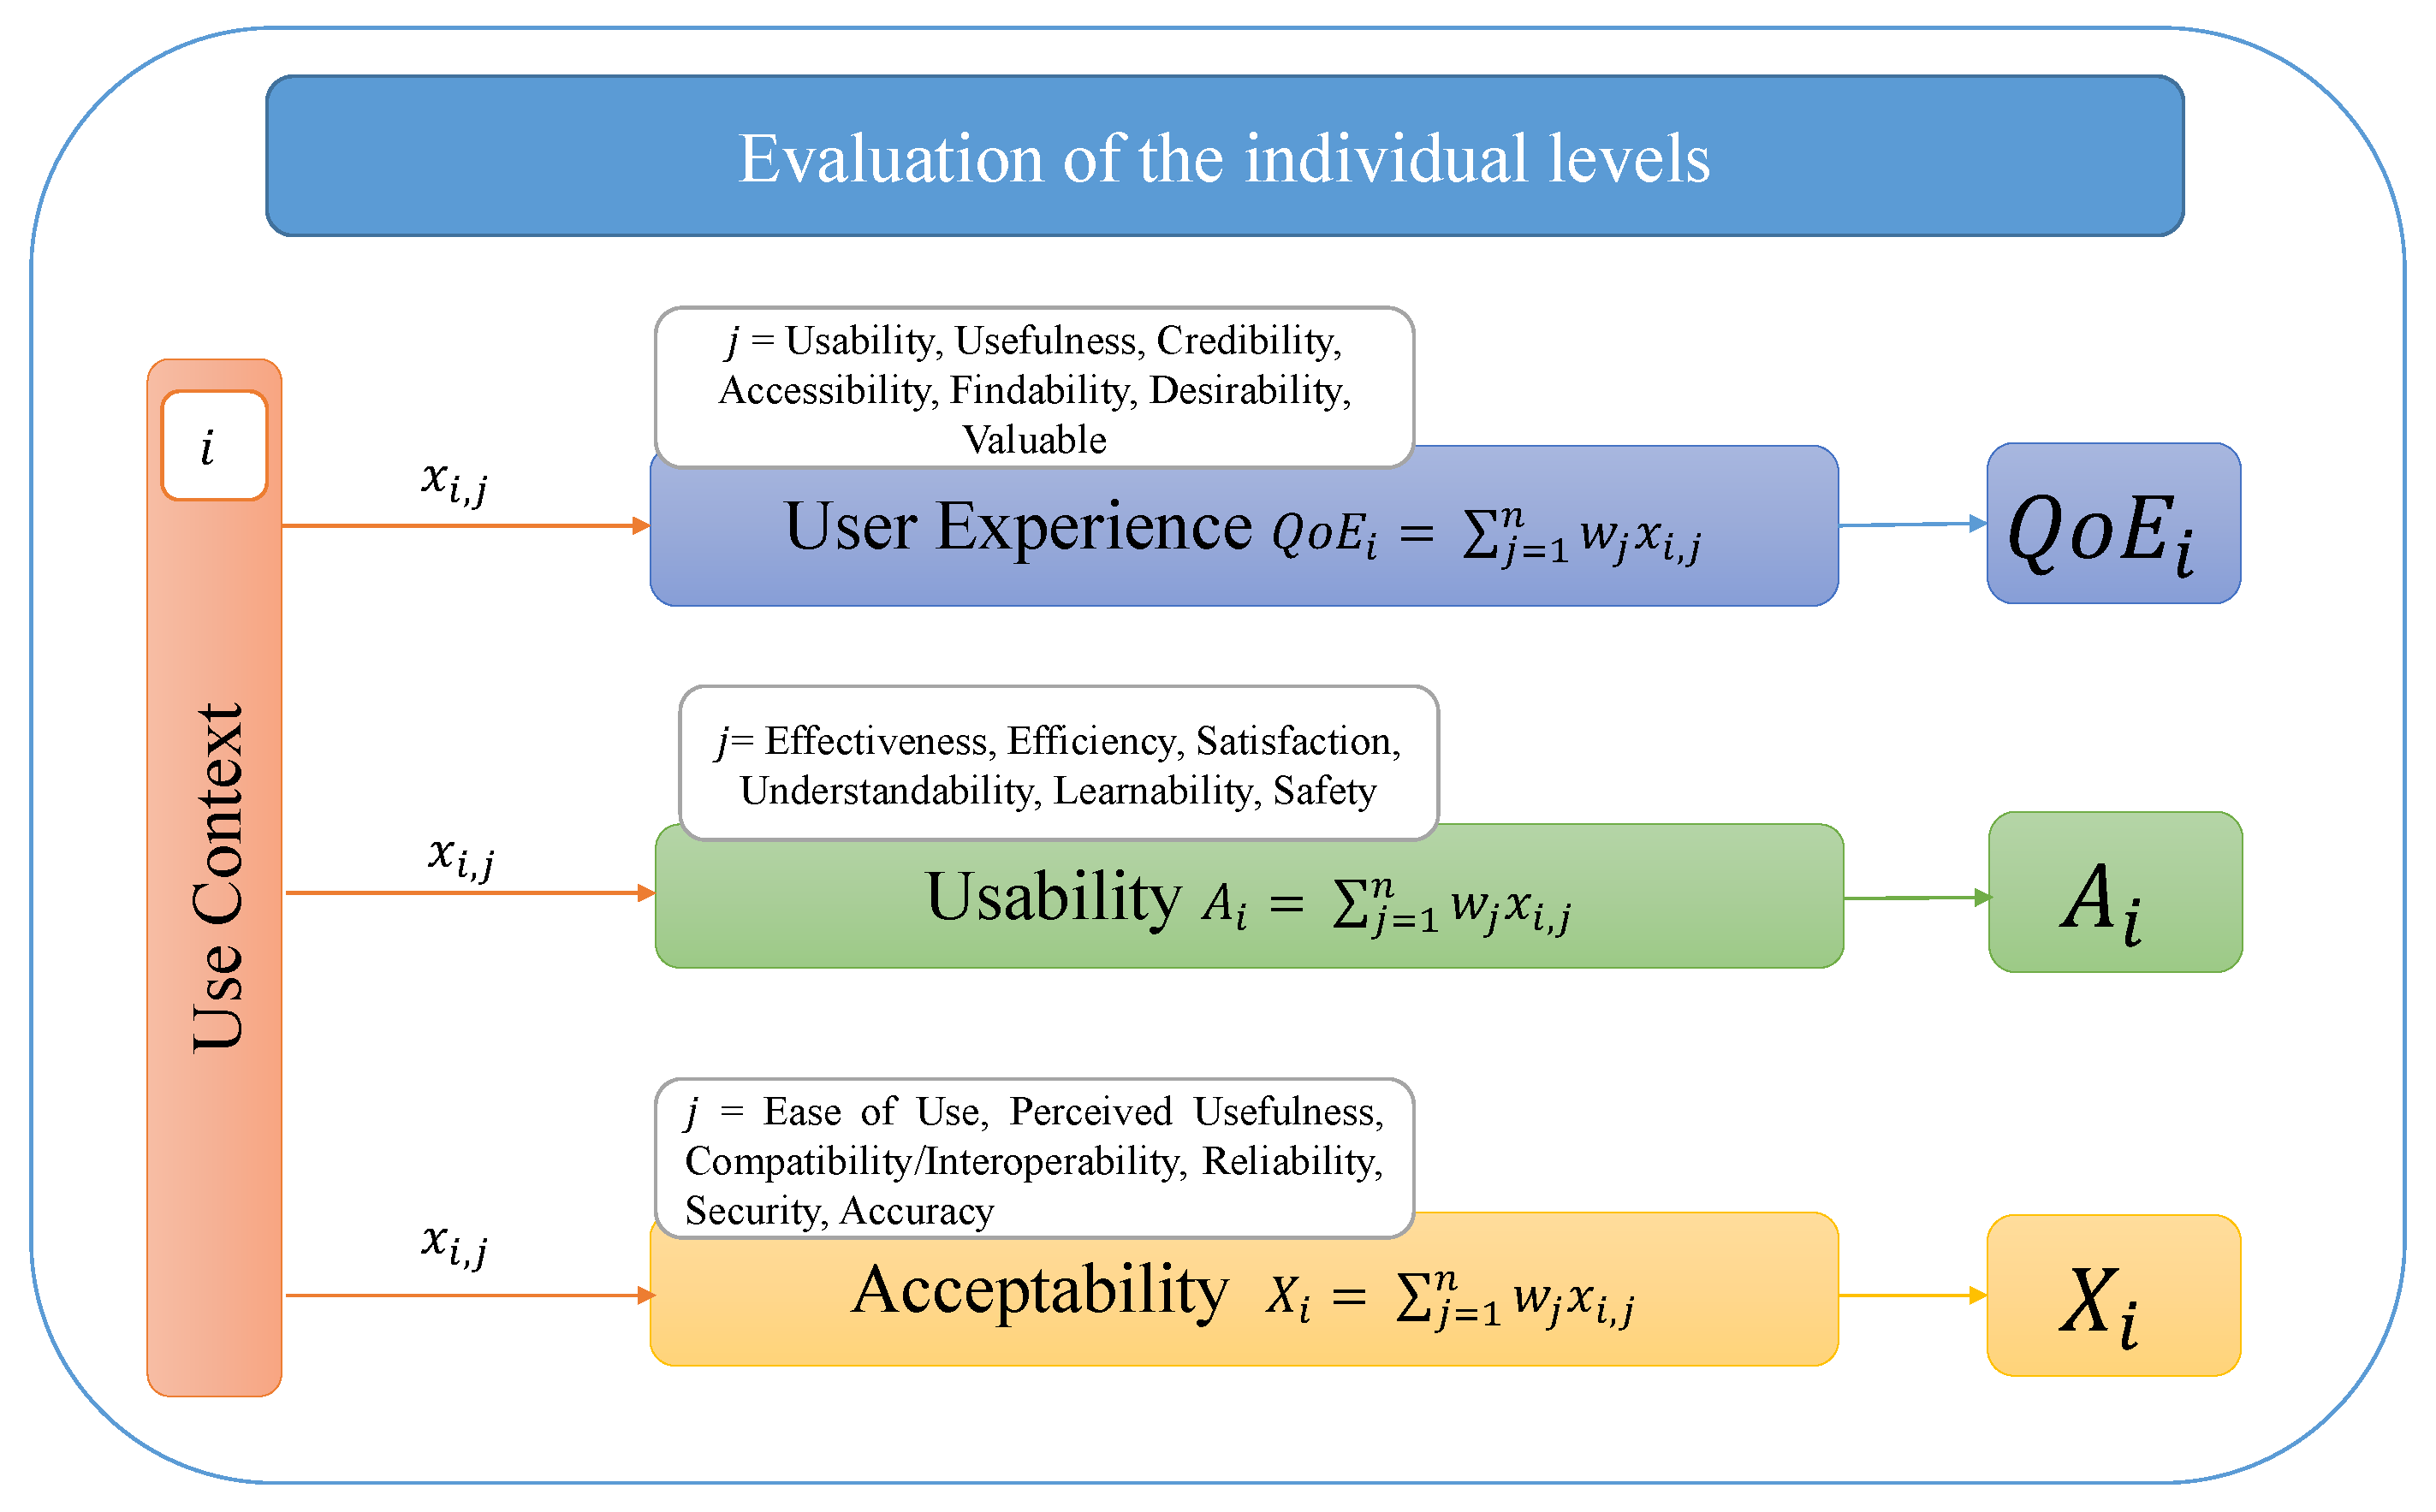
Equation (1) is applied at each level of the proposed architectural model and the obtained results indicate the degree of acceptability, usability or user experience of a service to be assessed in a given context of use. It should be noted that Equation (1) can be directly applied to evaluate a single level (see Figure 5), while, for an overall assessment which takes into account all the levels, it is necessary to consider the results obtained at the previous levels as an attribute of the next ones (see Figure 6).
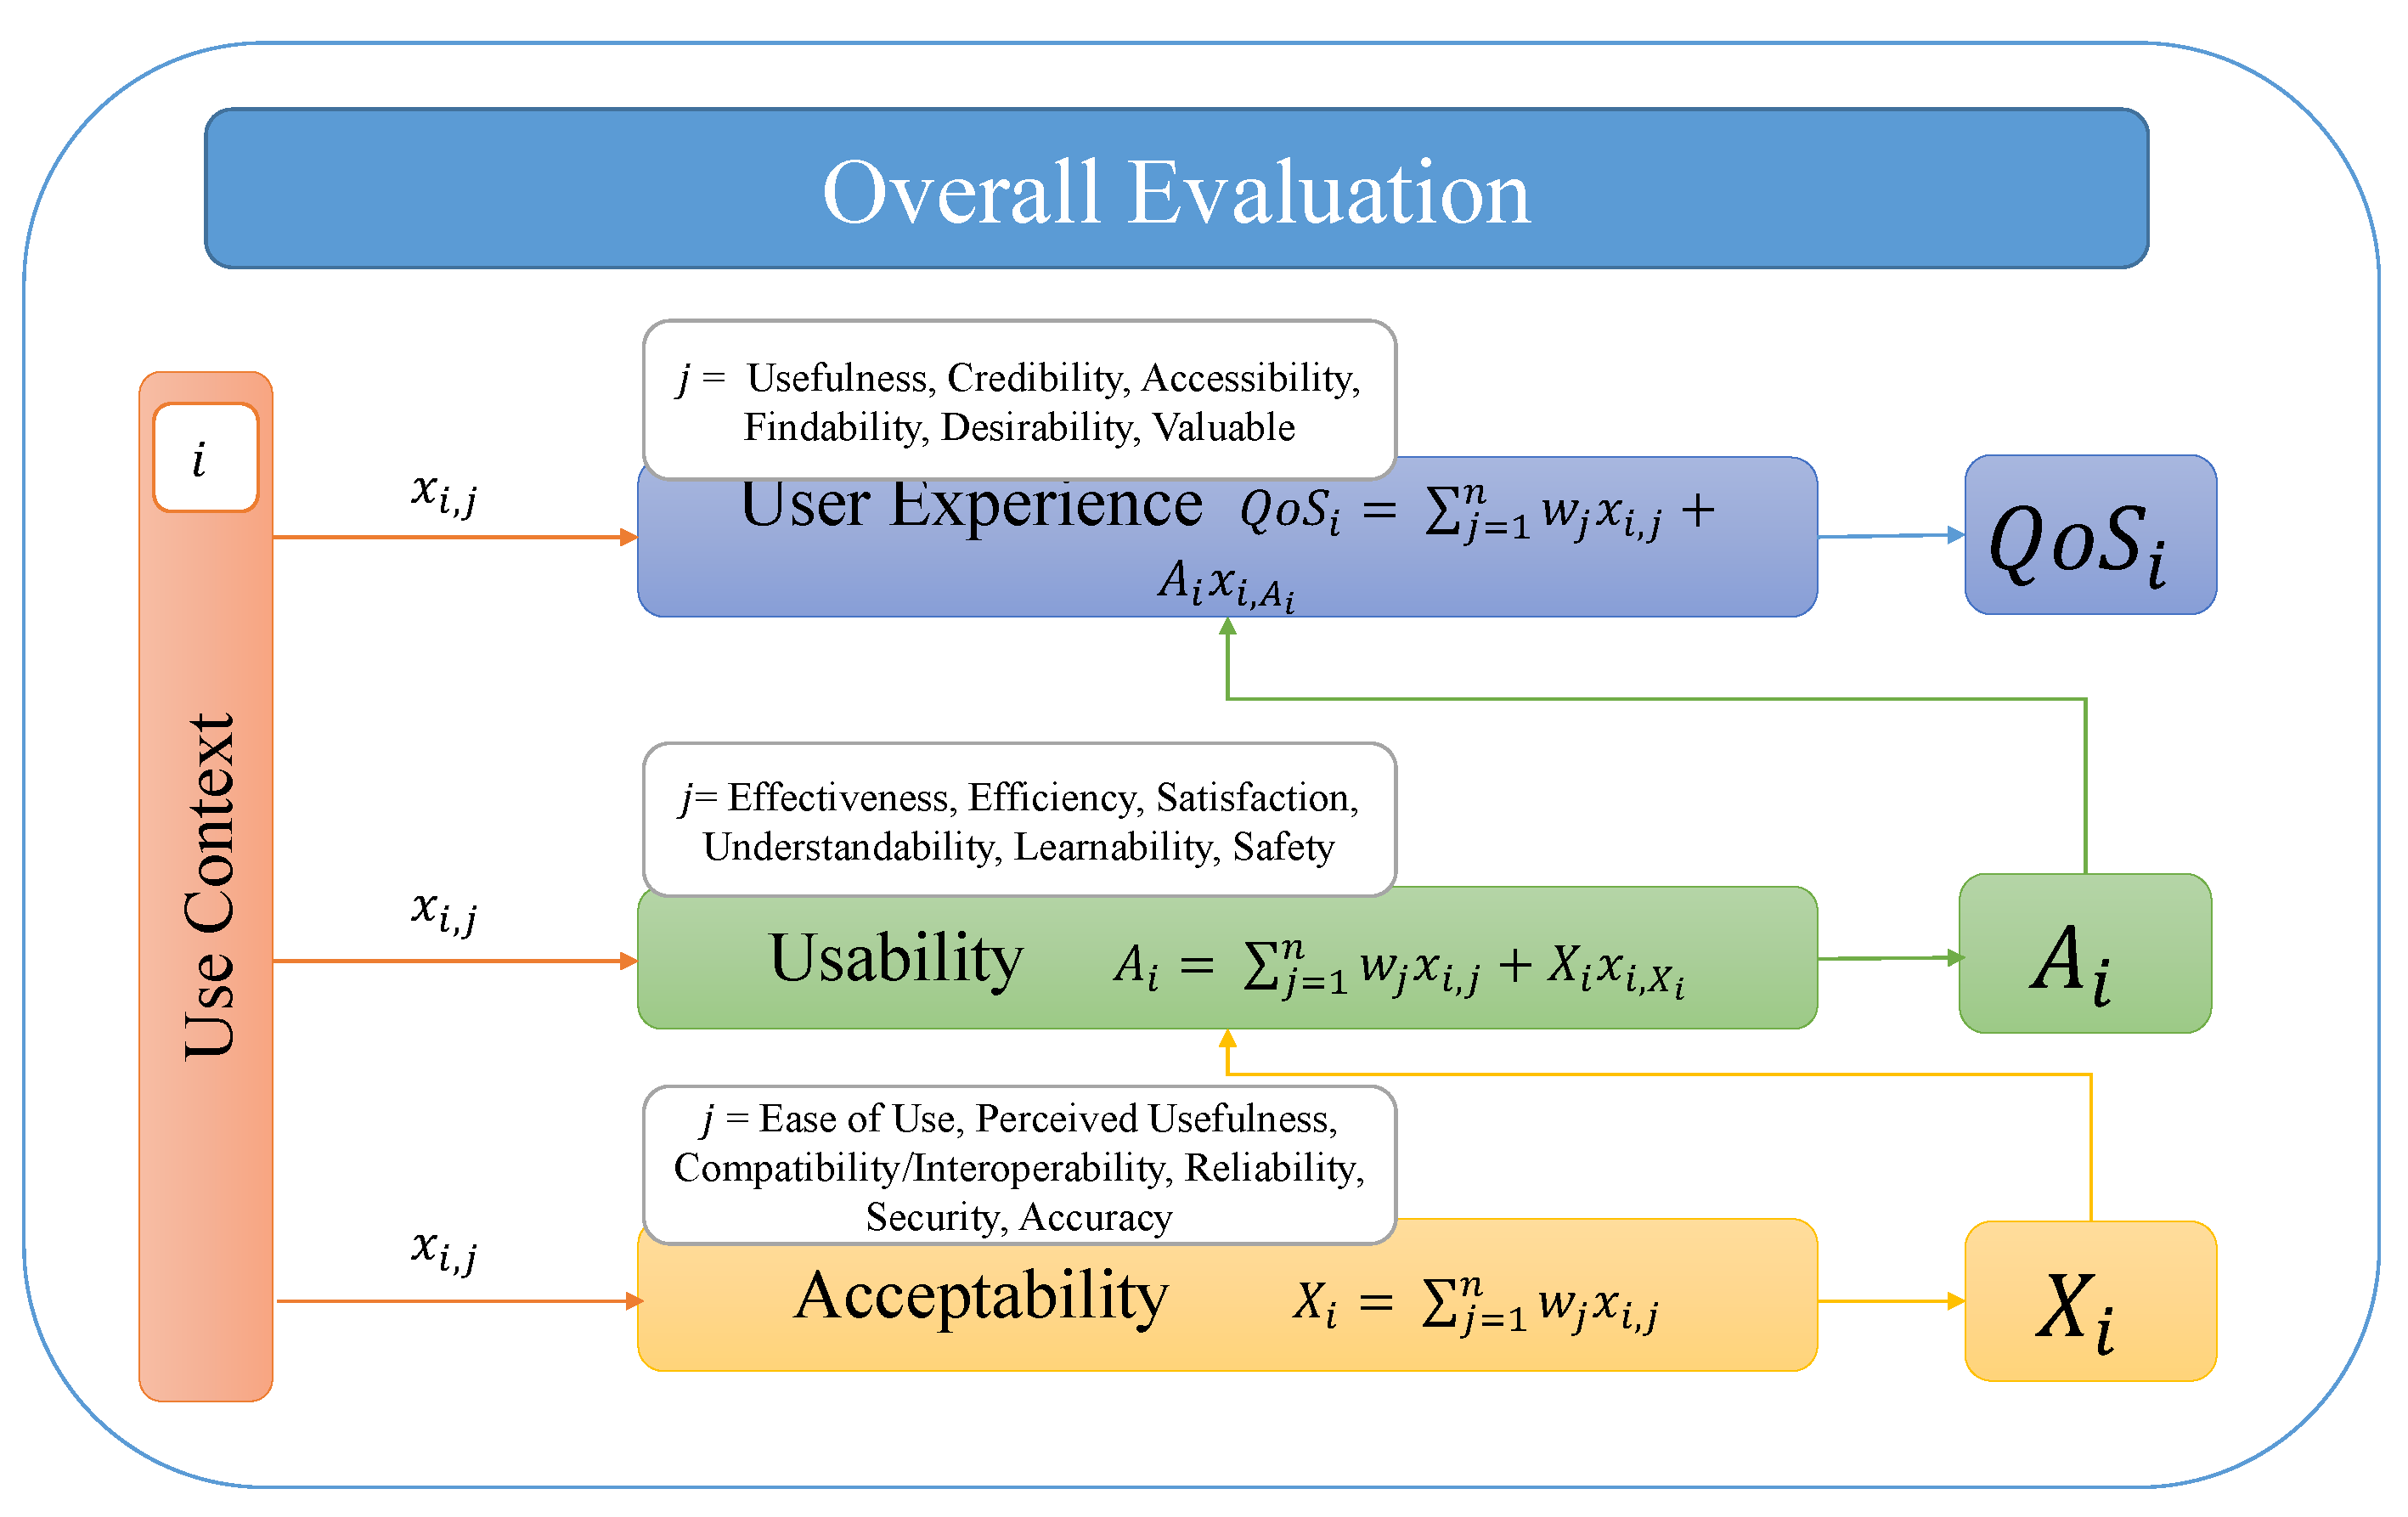
In more detail, if we want to conduct a complete assessment of the entire service, the steps to follow are:
- 1
- considering the level of acceptability, the first, starting from the bottom, calculated as expressed in Equation (1); this value will constitute the output of the considered level and quantifies the acceptability degree of the service;
- 2
- going up to the usability level, we have to consider what has been obtained at the level of acceptability, as expressed in Equation (2):where j indicates all the attributes of usability. By doing so, we are able to take into account the result obtained at the previous level, weighing it in accordance with its relevance in the current level;
- 3
- proceeding towards the last level, we iterate the procedure, obtaining:where j indicates all the attributes related to the user experience and takes into account the importance of the underlying levels.
3.3.7. Pseudocode of the Model
The pseudocode of the model is shown as Algorithm 1:
| Algorithm 1 CoKnowEMe Evaluation Algorithm for IoMT Microservices |
|
The various steps of our modelling approach and procedure allow us to quantify the quality of service of an IoMT microservice, in particular, starting from the attributes set, the use context and graph that represents the networked resources of the s microservice, we are able to quantify a measure of quality of service through a selection and clustering of the networked attributes and by applying the WSM methodology.
3.3.8. Performance Evaluation in a Complex Networked Scenario
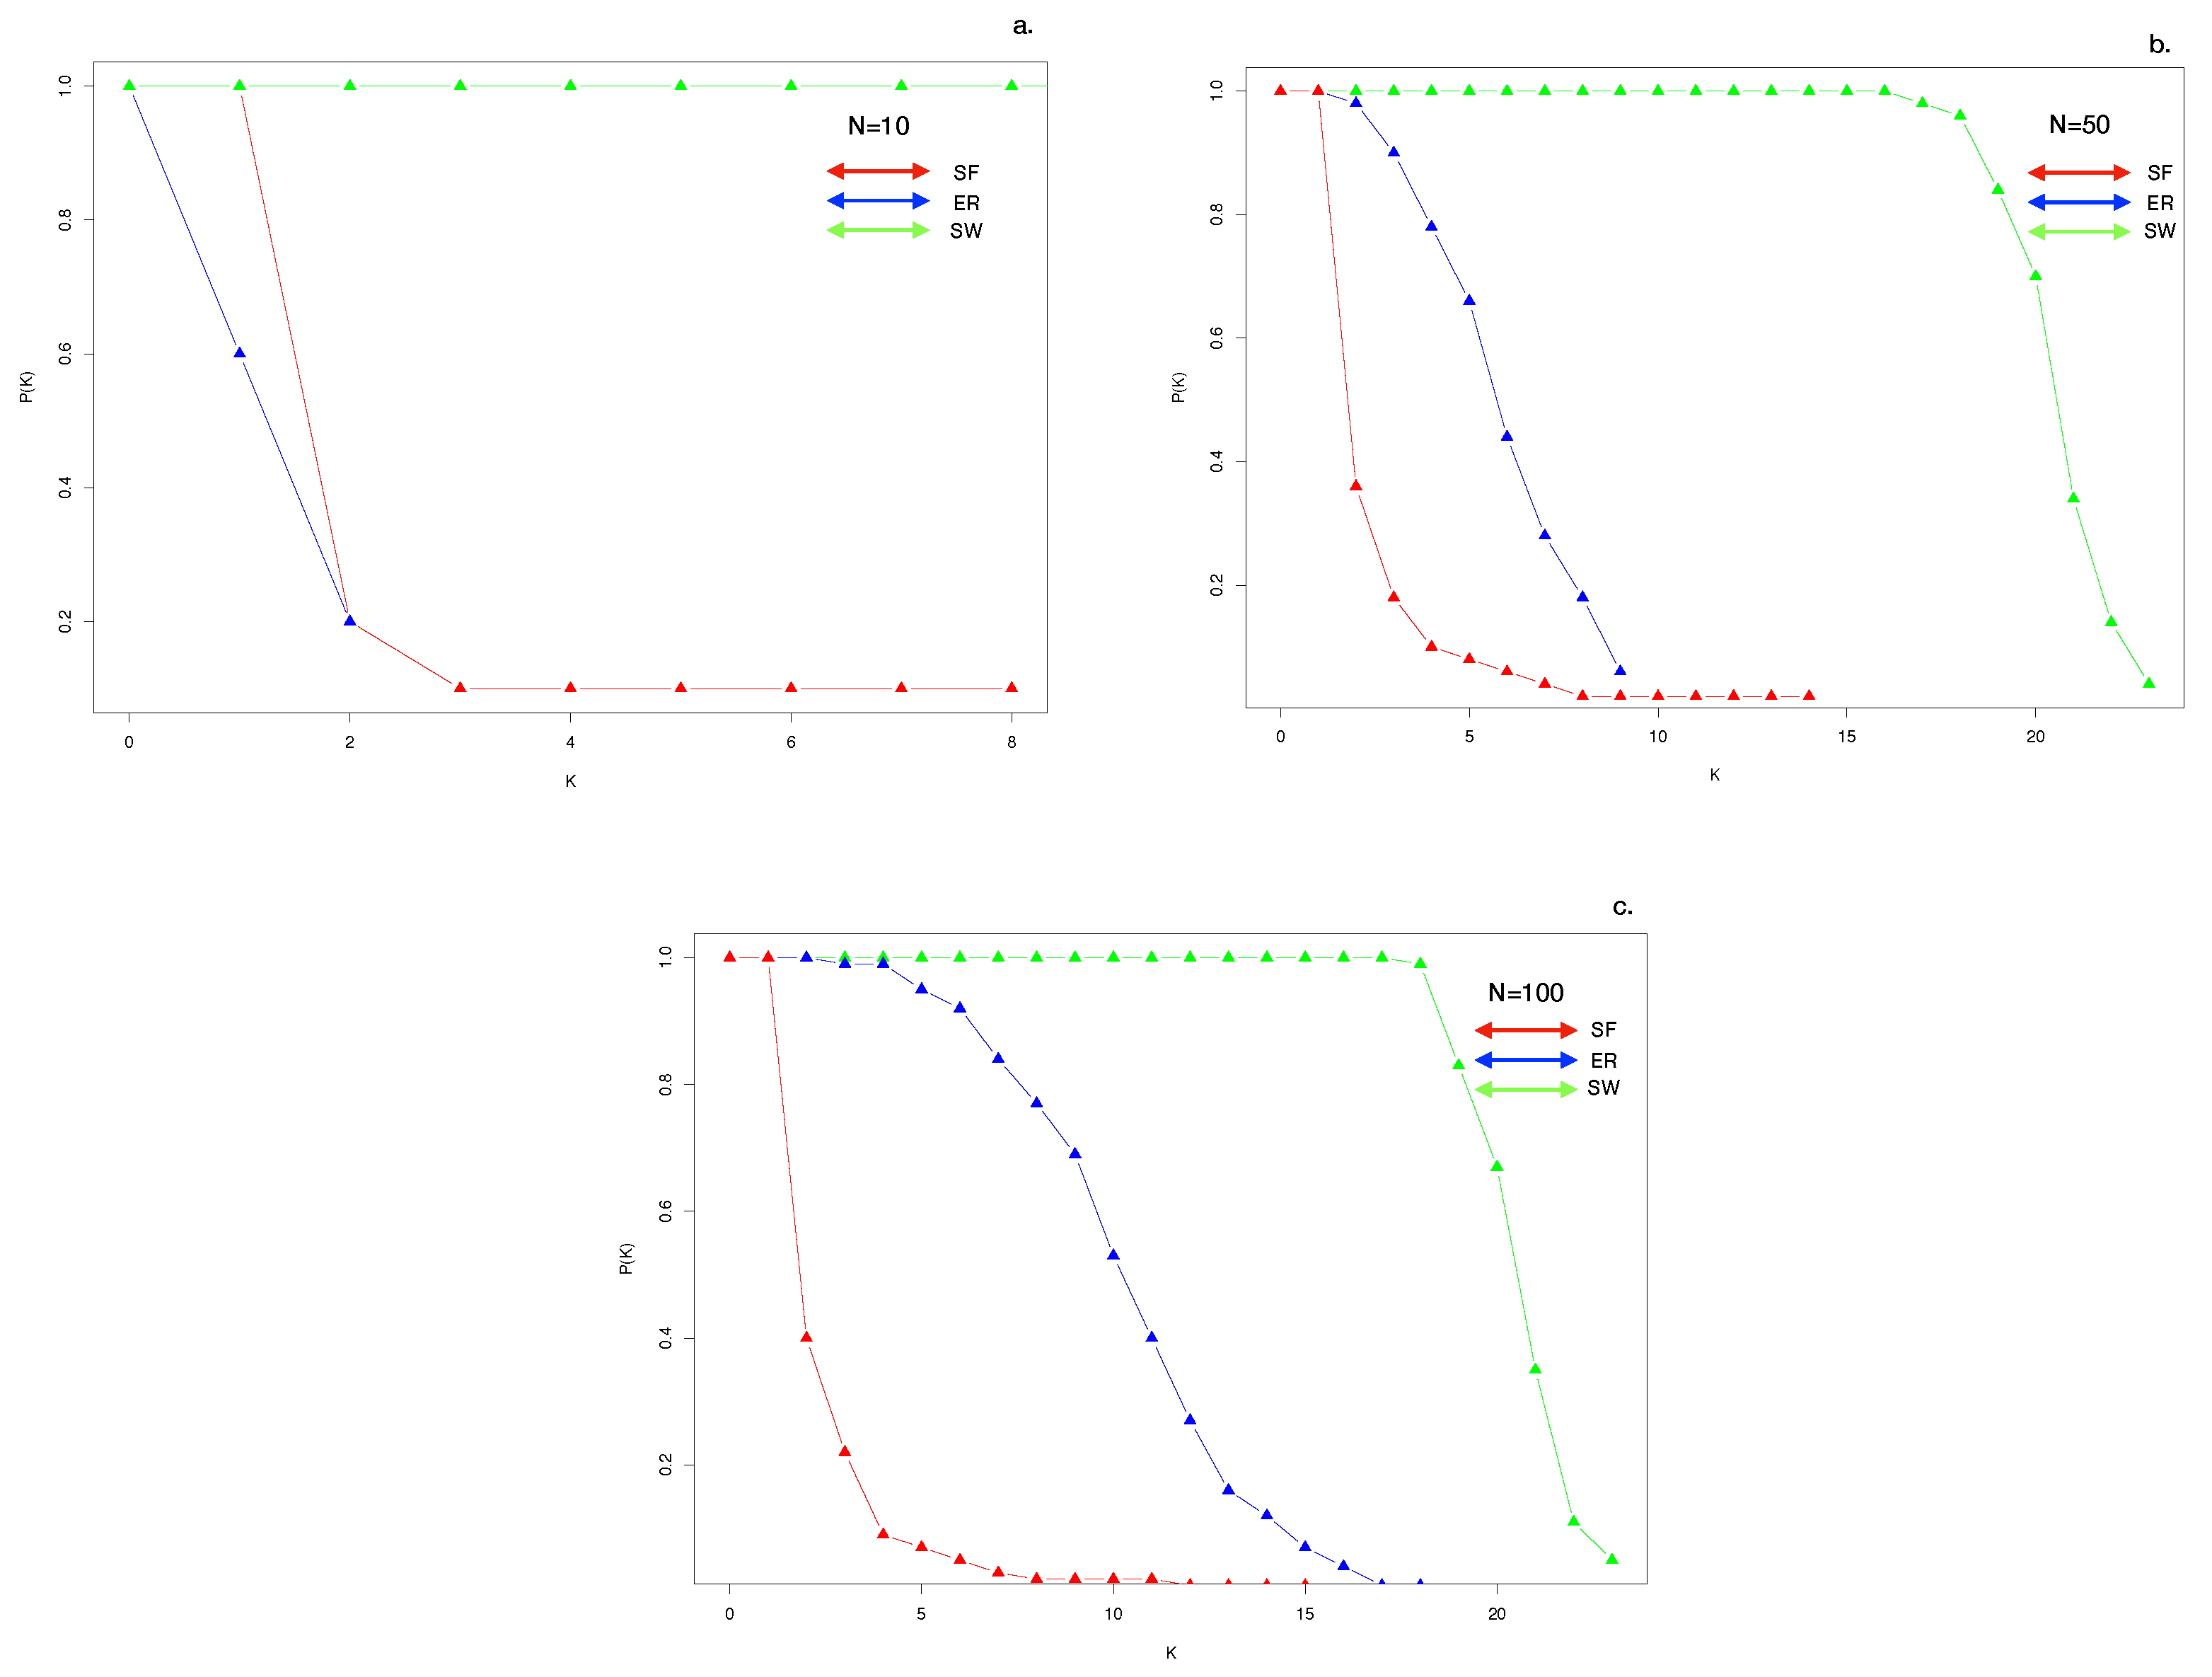
Taking into consideration the complex approach used for the evaluation scheme of IoMT microservices and in order to present a performance evaluation to support our viewpoint, we have performed simulations, as shown in Figure 7, to display how a networked set of heterogeneous attributes that characterize the module of evaluation scheme proposed can be represented as N, an interconnected population of node. We consider as a sample of a complex networked graph that enables us to detect what kind of attribute in structural terms can have a key role more than another. As explained in Section 2.6 we proceed through a WSM model, weighing up the contributions of each attribute and, as indicated in Figure 3, we assume that the attributes can be interconnected through weighted links. Thus, we consider a sample graph, having unit link weights, by varying the size of the set of attributes jointly with the complex topology that interconnect the attributes in the graph. We take into consideration three topologies: Scale-Free networks (SF), Erdős–Rényi networks (ER) and Small-World networks (SW). The ER is the classical random graph model, suitable in the case of networks governed only by stochasticity, characterized by a statistical homogeneity of the nodes. The SW network structure displays a high clustering coefficient and it is a network with a small diameter that generates homogeneous networks where the average of each metric is a typical value shared, with little variations, by all nodes of the network. SF is inherently heterogeneous, strictly resembling real-world networks displaying a skewed statistical distribution deriving from the preferential attachment rule. Many real-world networks exhibit levels of heterogeneity, structured in a hierarchy of nodes with a few nodes having very large connectivity (the hubs), while the vast majority of nodes have much smaller degrees. As shown in the Figure 7, varying the population size N, we can underline that, with a low value of N, both ER and SF display a skewed distribution. By increasing the size of the attributes, we detect a more homogenized distribution in ER and SW, while the higher heterogeneous distribution is in the SF topology. These findings can drive the choice of suitable topology, under specific assumptions, and the detection of certain attributes that exhibit a role of hub in the network structure, and therefore under conditions of particular requirements at edge level (e.g., load balancing issue); this suggests that certain attributes cannot be excluded from the assessment. Moreover, by considering a heterogeneous, dynamic and complex approach, in line with the trend of the forthcoming 6G, the more realistic network structure SF is able to unveil hidden properties and roles of nodes that can change dynamically based on use context and environment and requirement conditions.
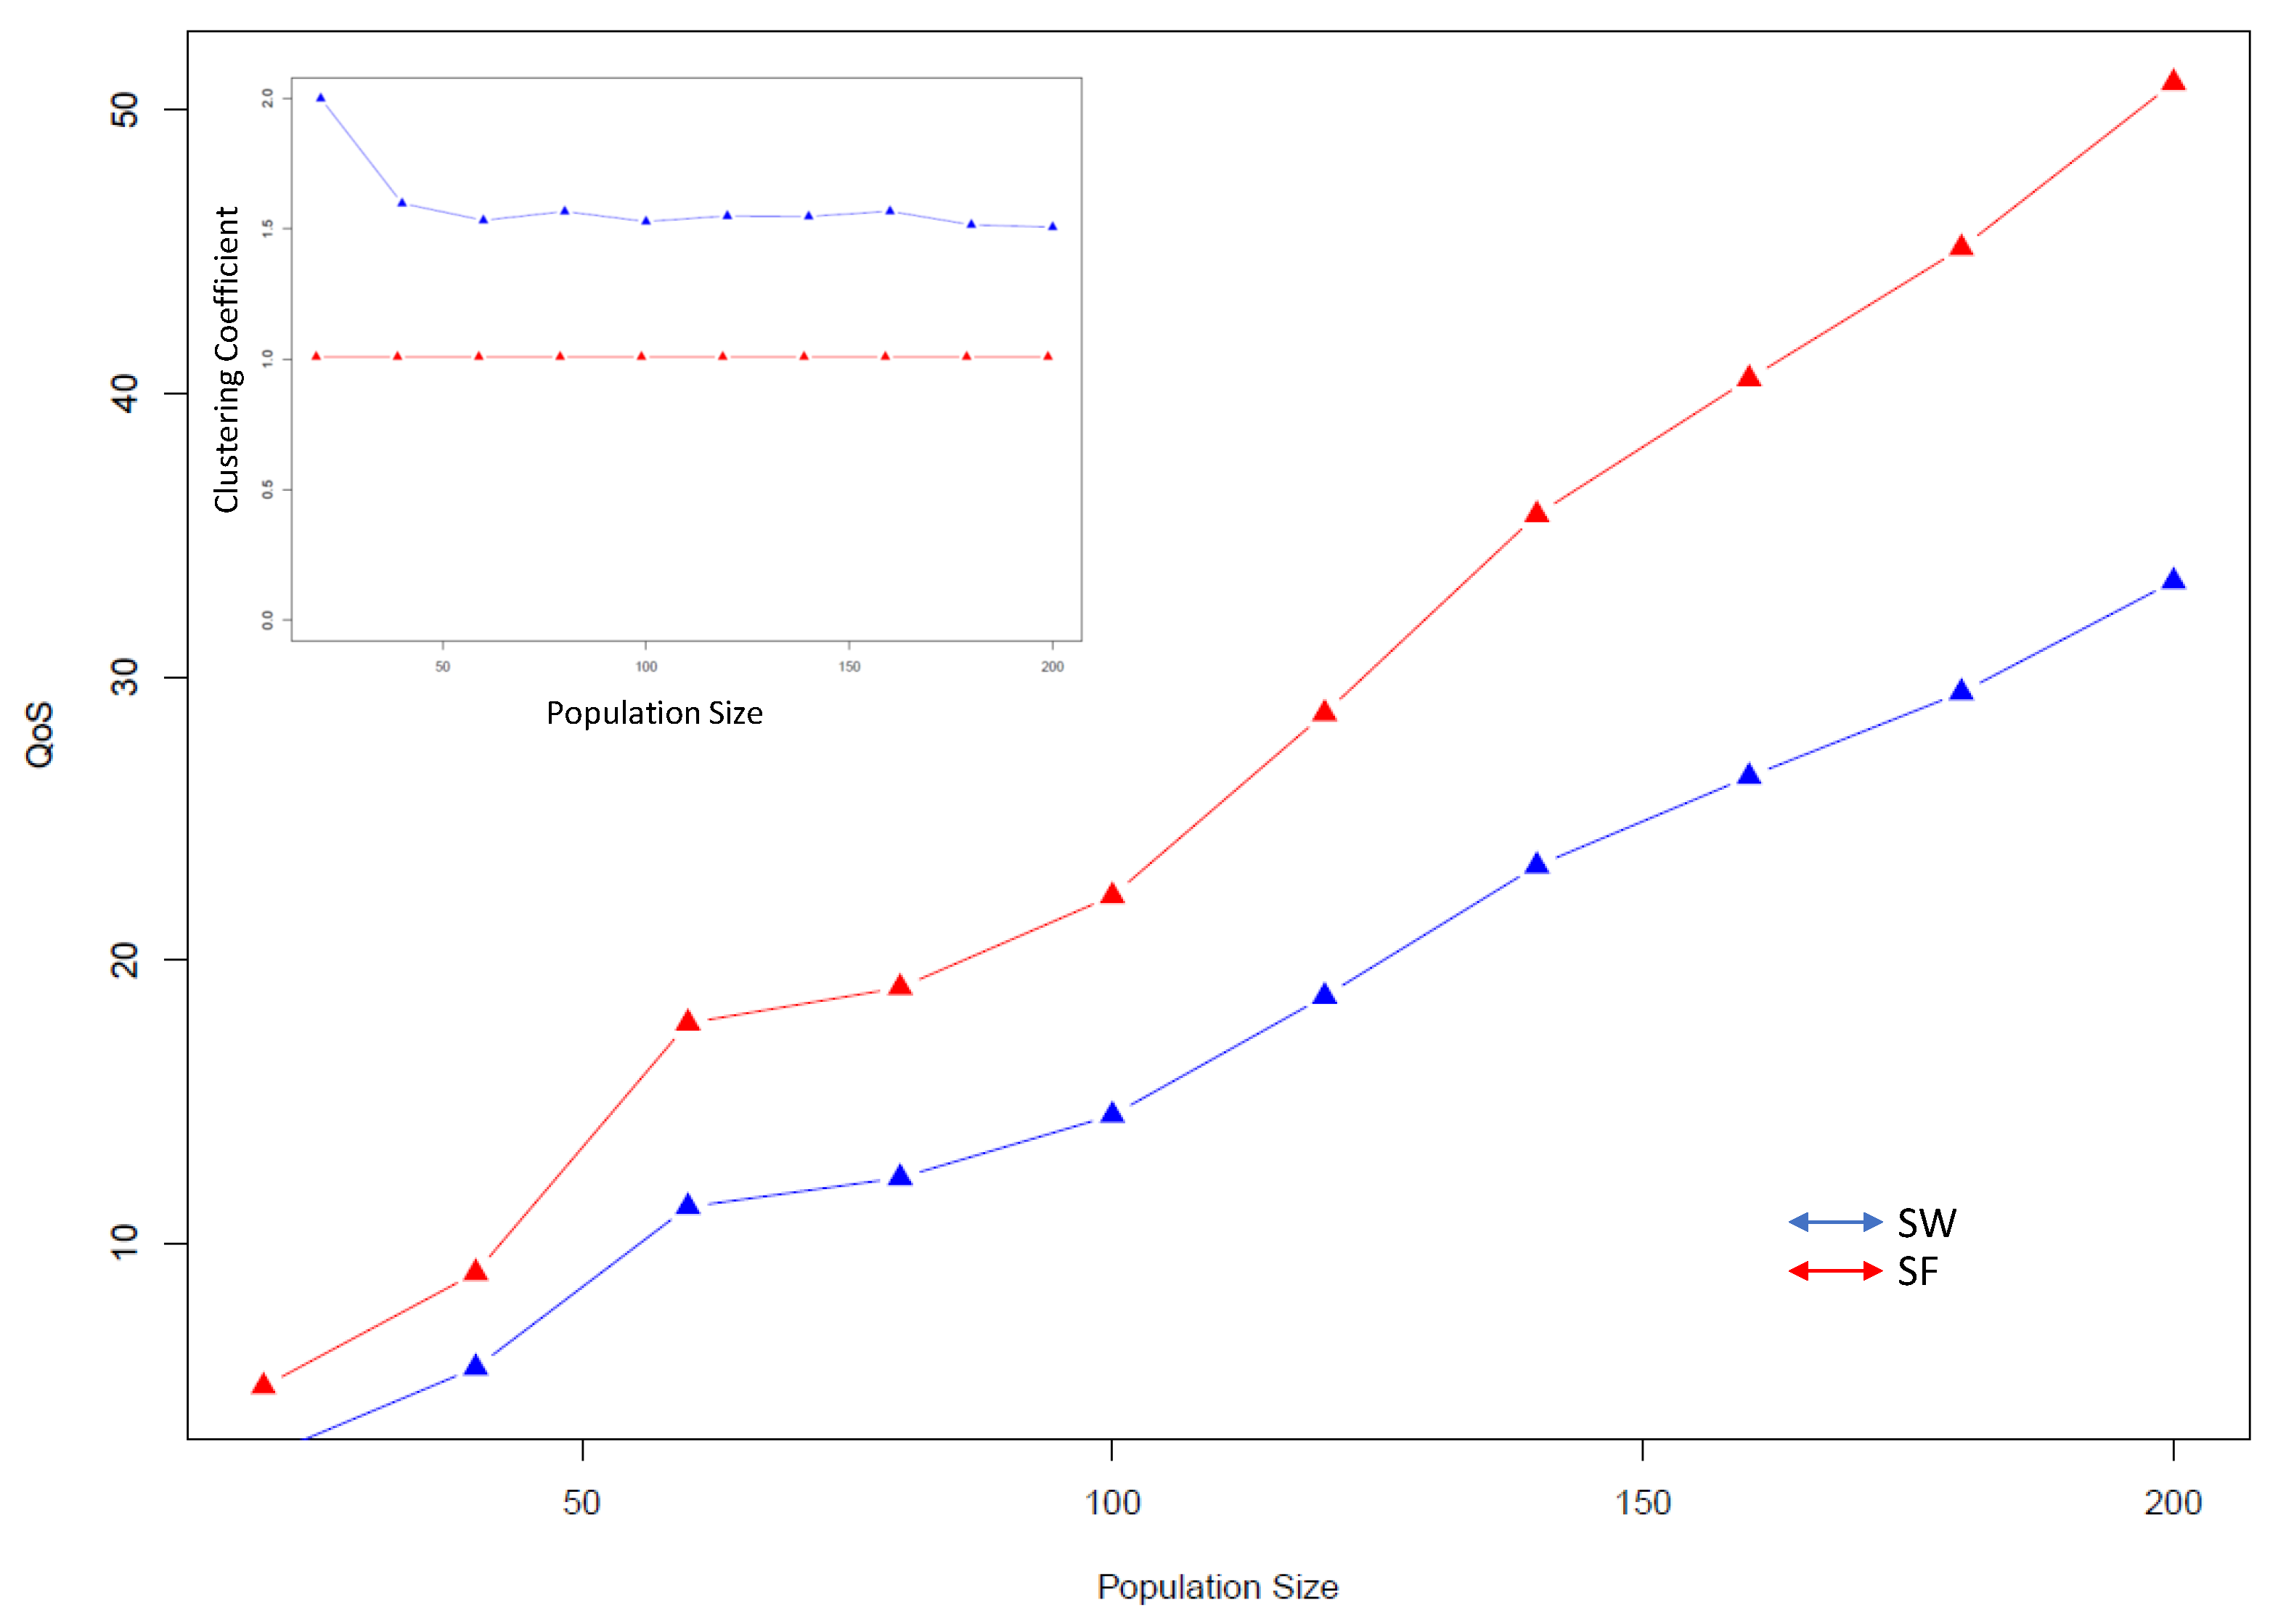
In addition, we conduct a performance evaluation on the quality-of-service measure, in function of the size of the attributes’ population jointly with the variation of the clustering coefficient of the networked structure topology. To this aim, we include Figure 8 where we show that the QoS value increases with the increasing of the attributes’ population size. The trend of QoS is shown in the case of two different topologies, the scale-free and the small-world structural network, assumed for both graphs, microservice’s graph and evaluation’s graph. The QoS depends on theoretical distribution of the values and weights of each attribute considered in the assumed sample. We shed light also on the clustering coefficient by varying the population size in both cases. The clustering coefficient is a complex metric, representing a measure of the degree to which nodes in a graph tend to cluster together and quantifying the abundance of connected triangles in a network. In the microservice graph the average clustering metric unveils the average measure for the resources nodes of the ratio of existing links connecting a node’s neighbours to each other to the maximum possible number of such links.
This is a key value to unveil the reuse of resources and how those nodes are connected together in groups, favouring small groups with high inter-links or big groups with high intra-links. This can impact the choice of the attributes’ population size to better evaluate the quality of service of a microservice composed by interconnected resources. The small-world model (blue line) generates a homogeneous network; then the heterogeneous scale-free hypothesis (red line) and this shed light on that, even if the increasing of population size is valuable for both structures; with more inter-links of high value of heterogeneity as in scale-free topology, we obtain a higher level of QoS since it corresponds to a high level of reuse of resources.
4. Conclusions
In this paper, we propose an evaluation scheme for IoMT microservices, thought of as lightweight applications at edge level in a future 6G scenario, that takes into consideration three main aspects to assess the quality, the acceptability, the usability and the user experience, modulating the output according to the use context. The proposed model, characterized by a multilevel architecture jointly with an analytical methodology based on complex system approach, is composed by different interoperable and chained modules that can assess several aspects of the quality of a service. We introduce a novel approach to design the evaluation scheme that follows the similar approach of the object to be assessed thanks to the advent of the 6G paradigm. The IoMT services are represented as dynamical resources organized at edge level in a resource-oriented infrastructure that enables a self-organized connectivity and intelligent reusability of data and resources to deliver services. In accordance with this scenario the evaluation model is based on dynamic and adaptable features, represented, for each module, in terms of weighted attributes and sub-attributes, that convey the knowledge mined from the assessment analysis. Each individual evaluation layer can be used independently of the others or jointly with the other ones in an interoperable way. The entities of IoMT at the edge level can use the evaluation mechanism in an intelligent distributed way by enabling the reuse of the extracted output as collective resources and data, based on the use context. The strength of our approach is represented by the introduction in the modern telecommunications networks of novel key features able to contribute to fully capture the complex ecosystem of the network, thus introducing the complex systems approach, heterogeneity at edge intelligence that can enable us, through the advent of 6G, to investigate and assess the networked sub-networks. The aim is to achieve a connected intelligence from the network design and control the service construction and quality assessment.
Supplementary Materials
The following are available at https://0-www-mdpi-com.brum.beds.ac.uk/article/10.3390/fi13070177/s1, Supplementary Table List and Supplementary Reference List.
Author Contributions
All the authors (G.V.A., B.A., M.S. and A.L.C.) have equally contributed to the conceptualization, methodology, software, validation, formal analysis, investigation, resources, data curation, writing—original draft preparation and funding acquisition. All authors have read and agreed to the published version of the manuscript.
Funding
This research received no external funding.
Data Availability Statement
Not Applicable, the study does not report any data.
Acknowledgments
This work was partially supported by the Research Grant: Italian Ministry of University and Research (MIUR)—PON REC 2014–2020 within the project ARS01 01116 TALIsMAN and PO FESR 2014–2020 Regione Sicilia—Azione 1.1.5 within the project “PRE-CUBE”.
Conflicts of Interest
The authors declare no conflict of interest.
References
- Zhang, Z.; Xiao, Y.; Ma, Z.; Xiao, M.; Ding, Z.; Lei, X.; Karagiannidis, G.K.; Fan, P. 6G wireless networks: Vision, requirements, architecture and key technologies. IEEE Veh. Technol. Mag. 2019, 14, 28–41. [Google Scholar] [CrossRef]
- Forge, S.; Vu, K. Forming a 5G strategy for developing countries: A note for policy makers. Telecommun. Policy 2020, 44, 101975. [Google Scholar] [CrossRef]
- Mcketta, I. Massive Expansions and Huge Improvements in Speed: The Worldwide Growth of 5G in 2020. Available online: https://www.speedtest.net/insights/blog/world-5g-report-2020 (accessed on 2 July 2021).
- OOKLA 5G MAP. Available online: https://www.speedtest.net/ookla-5g-map (accessed on 2 July 2021).
- KNOEMA. Status of 5G Commercial Deployment in OECD Countries. Available online: https://knoema.com/uhgjnwd/status-of-5g-commercial-deployment-in-oecd-countries/ (accessed on 2 July 2021).
- Bank, E.I. Accelerating the 5G Transition in Europe: How to Boost Investments in Transformative 5G Solutions Main Report. Available online: https://op.europa.eu/en/publication-detail/-/publication/85f94ef8-86d0-11eb-ac4c-01aa75ed71a1/language-en (accessed on 2 July 2021).
- Ericsson Mobility Report: More than Half a Billion 5G Subscriptions by the End of 2021. Available online: https://www.ericsson.com/en/mobility-report/reports/june-2021 (accessed on 2 July 2021).
- Chowdhury, M.Z.; Shahjalal, M.; Ahmed, S.; Jang, Y.M. 6G wireless communication systems: Applications, requirements, technologies, challenges and research directions. IEEE Open J. Commun. Soc. 2020, 1, 957–975. [Google Scholar] [CrossRef]
- Giordani, M.; Polese, M.; Mezzavilla, M.; Rangan, S.; Zorzi, M. Toward 6G networks: Use cases and technologies. IEEE Commun. Mag. 2020, 58, 55–61. [Google Scholar] [CrossRef]
- Sergiou, C.; Lestas, M.; Antoniou, P.; Liaskos, C.; Pitsillides, A. Complex Systems: A Communication Networks Perspective Towards 6G. IEEE Access 2020, 8, 89007–89030. [Google Scholar] [CrossRef]
- Saad, W.; Bennis, M.; Chen, M. A vision of 6G wireless systems: Applications, trends, technologies, and open research problems. IEEE Netw. 2019, 34, 134–142. [Google Scholar] [CrossRef] [Green Version]
- Akyildiz, I.F.; Kak, A.; Nie, S. 6G and beyond: The future of wireless communications systems. IEEE Access 2020, 8, 133995–134030. [Google Scholar] [CrossRef]
- Nayak, S.; Patgiri, R. A Vision on Intelligent Medical Service for Emergency on 5G and 6G Communication Era. EAI Endorsed Trans. Internet Things 2020, 6, e2. [Google Scholar] [CrossRef]
- Scatá, M.; Attanasio, B.; Aiosa, G.V.; La Corte, A. The Dynamical Interplay of Collective Attention, Awareness and Epidemics Spreading in the Multiplex Social Networks During COVID-19. IEEE Access 2020, 8, 189203–189223. [Google Scholar] [CrossRef]
- Gatouillat, A.; Badr, Y.; Massot, B.; Sejdić, E. Internet of medical things: A review of recent contributions dealing with cyber-physical systems in medicine. IEEE Internet Things J. 2018, 5, 3810–3822. [Google Scholar] [CrossRef] [Green Version]
- Peltonen, E.; Bennis, M.; Capobianco, M.; Debbah, M.; Ding, A.; Gil-Castiñeira, F.; Jurmu, M.; Karvonen, T.; Kelanti, M.; Kliks, A.; et al. 6G white paper on edge intelligence. arXiv 2020, arXiv:2004.14850. [Google Scholar]
- Xiao, Y.; Shi, G.; Li, Y.; Saad, W.; Poor, H.V. Toward Self-Learning Edge Intelligence in 6G. IEEE Commun. Mag. 2020, 58, 34–40. [Google Scholar] [CrossRef]
- Gupta, R.; Reebadiya, D.; Tanwar, S. 6G-enabled Edge Intelligence for Ultra-Reliable Low Latency Applications: Vision and Mission. Comput. Stand. Interfaces 2021, 77, 103521. [Google Scholar] [CrossRef]
- Pustokhina, I.V.; Pustokhin, D.A.; Gupta, D.; Khanna, A.; Shankar, K.; Nguyen, G.N. An effective training scheme for deep neural network in edge computing enabled Internet of medical things (IoMT) systems. IEEE Access 2020, 8, 107112–107123. [Google Scholar] [CrossRef]
- Guerreiro, J.; Rodrigues, L.; Correia, N. Allocation of Resources in SAaaS Clouds Managing Thing Mashups. IEEE Trans. Netw. Serv. Manag. 2020, 17, 1597–1609. [Google Scholar] [CrossRef]
- Fernández-Villamor, J.I.; Iglesias, C.A.; Garijo, M. Microservices-Lightweight Service Descriptions for REST Architectural Style. In Proceedings of the ICAART, Valencia, Spain, 22–24 January 2010; pp. 576–579. [Google Scholar]
- Ziegler, V.; Viswanathan, H.; Flinck, H.; Hoffmann, M.; Räisänen, V.; Hätönen, K. 6G architecture to connect the worlds. IEEE Access 2020, 8, 173508–173520. [Google Scholar] [CrossRef]
- Moloja, D.; Mpekoa, N.; Van Greunen, D. Evaluating two security systems for mobile voting fortification. In Proceedings of the 2nd International Conference on Intelligent and Innovative Computing Applications, Plaine Magnien, Mauritius, 24–25 September 2020; pp. 1–6. [Google Scholar]
- Bevan, N.; Carter, J.; Harker, S. ISO 9241-11 revised: What have we learnt about usability since 1998? In International Conference on Human-Computer Interaction; Springer: Berlin/Heidelberg, Germany, 2015; pp. 143–151. [Google Scholar]
- Jordan, P.W. An Introduction to Usability; CRC Press: Boca Raton, FL, USA, 2020. [Google Scholar]
- Harrison, R.; Flood, D.; Duce, D. Usability of mobile applications: Literature review and rationale for a new usability model. J. Interact. Sci. 2013, 1, 1–16. [Google Scholar] [CrossRef] [Green Version]
- Saleh, A.; Ismail, R.; Fabil, N. Evaluating usability for mobile application: A MAUEM approach. In Proceedings of the 2017 International Conference on Software and e-Business, Essen, Germany, 12–13 June 2017; pp. 71–77. [Google Scholar]
- Kamal, S.A.; Shafiq, M.; Kakria, P. Investigating acceptance of telemedicine services through an extended technology acceptance model (TAM). Technol. Soc. 2020, 60, 101212. [Google Scholar] [CrossRef]
- Alexandru, A.; Coardos, D.; Tudora, E. Acceptance of the technologies deployed for the development of online public services and systems used by elderly. In Proceedings of the IEEE 2019 11th International Conference on Electronics, Computers and Artificial Intelligence (ECAI), Pitesti, Romania, 27–29 June 2019; pp. 1–4. [Google Scholar]
- Tang, P.; Dong, Y.; Chen, Y.; Mao, S.; Halgamuge, S. QoE-aware Traffic Aggregation Using Preference Logic for Edge Intelligence. IEEE Trans. Wirel. Commun. 2021. [Google Scholar] [CrossRef]
- Zavadskas, E.K.; Turskis, Z.; Antucheviciene, J.; Zakarevicius, A. Optimization of weighted aggregated sum product assessment. Elektron. Elektrotechnika 2012, 122, 3–6. [Google Scholar] [CrossRef]
- Kaiser, M.S.; Zenia, N.; Tabassum, F.; Al Mamun, S.; Rahman, M.A.; Islam, M.S.; Mahmud, M. 6G Access Network for Intelligent Internet of Healthcare Things: Opportunity, Challenges and Research Directions. In Proceedings of the International Conference on Trends in Computational and Cognitive Engineering, Parit Raja, Malaysia, 21 October 2021; Springer: Berlin/Heidelberg, Germany, 2021; pp. 317–328. [Google Scholar]
- Attanasio, B.; La Corte, A.; Scatà, M. Evolutionary dynamics of MEC’s organization in a 6G scenario through EGT and temporal multiplex social network. ICT Express 2021, 7, 138–142. [Google Scholar] [CrossRef]
- Bevan, N.; Carter, J.; Earthy, J.; Geis, T.; Harker, S. New ISO standards for usability, usability reports and usability measures. In Proceedings of the International Conference on Human-Computer Interaction, Toronto, ON, Canada, 17–22 July 2016; Springer: Berlin/Heidelberg, Germany, 2016; pp. 268–278. [Google Scholar]
- Wardhana, S.; Sabariah, M.K.; Effendy, V.; Kusumo, D.S. User interface design model for parental control application on mobile smartphone using user centered design method. In Proceedings of the IEEE 2017 5th International Conference on Information and Communication Technology (ICoIC7), Melaka, Malaysia, 17–19 May 2017; pp. 1–6. [Google Scholar]
- Tan, J.; Rönkkö, K.; Gencel, C. A framework for software usability and user experience measurement in mobile industry. In Proceedings of the IEEE 2013 Joint Conference of the 23rd International Workshop on Software Measurement and the 8th International Conference on Software Process and Product Measurement, Ankara, Turkey, 23–26 October 2013; pp. 156–164. [Google Scholar]
- Rahman, M.A.; Hossain, M.S. An internet of medical things-enabled edge computing framework for tackling COVID-19. IEEE Internet Things J. 2021. [Google Scholar] [CrossRef]
- Mazayev, A.; Correia, N. A Distributed CoRE-Based Resource Synchronization Mechanism. IEEE Internet Things J. 2019, 7, 4625–4640. [Google Scholar] [CrossRef]
- Bucchiarone, A.; Dragoni, N.; Dustdar, S.; Lago, P.; Mazzara, M.; Rivera, V.; Sadovykh, A. Microservices. In Science and Engineering; Springer: Berlin/Heidelberg, Germany, 2020. [Google Scholar]
- Pastor-Satorras, R.; Castellano, C.; Van Mieghem, P.; Vespignani, A. Epidemic processes in complex networks. Rev. Mod. Phys. 2015, 87, 925. [Google Scholar] [CrossRef] [Green Version]
- Barrat, A.; Barthelemy, M.; Pastor-Satorras, R.; Vespignani, A. The architecture of complex weighted networks. Proc. Natl. Acad. Sci. USA 2004, 101, 3747–3752. [Google Scholar] [CrossRef] [Green Version]
- Menichetti, G.; Remondini, D.; Panzarasa, P.; Mondragón, R.J.; Bianconi, G. Weighted multiplex networks. PLoS ONE 2014, 9, e97857. [Google Scholar] [CrossRef] [Green Version]
- Kivelä, M.; Arenas, A.; Barthelemy, M.; Gleeson, J.P.; Moreno, Y.; Porter, M.A. Multilayer networks. J. Complex Netw. 2014, 2, 203–271. [Google Scholar] [CrossRef] [Green Version]
- Distler, V.; Lallemand, C.; Koenig, V. How acceptable is this? How user experience factors can broaden our understanding of the acceptance of privacy trade-offs. Comput. Hum. Behav. 2020, 106, 106227. [Google Scholar] [CrossRef]
- Islam, M.S.; Grönlund, Å. Factors influencing the adoption of mobile phones among the farmers in Bangladesh: Theories and practices. ICTer 2011, 4, 4–14. [Google Scholar] [CrossRef] [Green Version]
- Beldad, A.D.; Hegner, S.M. Expanding the technology acceptance model with the inclusion of trust, social influence and health valuation to determine the predictors of German users’ willingness to continue using a fitness app: A structural equation modeling approach. Int. J. Hum. Interact. 2018, 34, 882–893. [Google Scholar] [CrossRef] [Green Version]
- Weichbroth, P. Usability of mobile applications: A systematic literature study. IEEE Access 2020, 8, 55563–55577. [Google Scholar] [CrossRef]
- Hussain, A.; Kutar, M. Usability metric framework for mobile phone application. In Proceedings of the 10th Annual PostGraduate Symposium on The Convergence of Telecommunications, Networking and Broadcasting, Liverpool, UK, 22–23 June 2009. [Google Scholar]
- Hertzum, M. Usability Testing: A Practitioner’s Guide to Evaluating the User Experience. Synth. Lect. Hum. Cent. Inform. 2020, 13, i-105. [Google Scholar] [CrossRef]
- Mashapa, J.; van Greunen, D. User experience evaluation metrics for usable accounting tools. In Proceedings of the 2010 Annual Research Conference of the South African Institute of Computer Scientists and Information Technologists, Bela Bela, South Africa, 11–13 October 2010; pp. 170–181. [Google Scholar]
- Helff, F.; Gruenwald, L.; d’Orazio, L. Weighted Sum Model for Multi-Objective Query Optimization for Mobile-Cloud Database Environments. In Proceedings of the EDBT/ICDT Workshops, Bordeaux, France, 15 March 2016. [Google Scholar]
- Huang, A.F.; Lan, C.W.; Yang, S.J. An optimal QoS-based Web service selection scheme. Inf. Sci. 2009, 179, 3309–3322. [Google Scholar] [CrossRef]
- Kohar, R. Optimal Web Service Selection Model using Fuzzy Extended AHP and Weighted Sum Method. J. Digit. Inf. Manag. 2018, 16. [Google Scholar] [CrossRef]
- Sarika, S. Server selection by using weighted sum and revised weighted sum decision models. IJICTR J. 2012, 2, 499–511. [Google Scholar]
- Guerron, X.; Abrahão, S.; Insfran, E.; Fernández-Diego, M.; González-Ladrón-De-Guevara, F. A taxonomy of quality metrics for cloud services. IEEE Access 2020, 8, 131461–131498. [Google Scholar] [CrossRef]
- Krzewińska, J.; Indyka-Piasecka, A.; Kopel, M.; Kukla, E.; Telec, Z.; Trawiński, B. Usability testing of a responsive web system for a school for disabled children. In Proceedings of the Asian Conference on Intelligent Information and Database Systems, Dong Hoi City, Vietnam, 19–21 March 2018; Springer: Berlin/Heidelberg, Germany, 2018; pp. 705–716. [Google Scholar]
- Da Costa, R.P.; Canedo, E.D.; De Sousa, R.T.; Albuquerque, R.D.O.; Villalba, L.J.G. Set of usability heuristics for quality assessment of mobile applications on smartphones. IEEE Access 2019, 7, 116145–116161. [Google Scholar] [CrossRef]
- Kabir, M.A.; Salem, O.A.; Rehman, M.U. Discovering knowledge from mobile application users for usability improvement: A fuzzy association rule mining approach. In Proceedings of the 2017 8th IEEE International Conference on Software Engineering and Service Science (ICSESS), Beijing, China, 24–26 November 2017; pp. 126–129. [Google Scholar]
- Saleh, A.M.; Al-Badareen, A.B.; Enaizan, O. Automated User Experience Tool Development for Mobile Application. Int. J. Adv. Sci. Technol. 2020, 29, 4929–4940. [Google Scholar]
- Vermeeren, A.P.; Law, E.L.C.; Roto, V.; Obrist, M.; Hoonhout, J.; Väänänen-Vainio-Mattila, K. User experience evaluation methods: Current state and development needs. In Proceedings of the 6th Nordic Conference on Human-Computer Interaction: Extending Boundaries, Reykjavik, Iceland, 16–20 November 2010; pp. 521–530. [Google Scholar]
- International Organization for Standardization ISO:9241-11:2018. Ergonomics of Human-System Interaction Part 11: Usability: Definitions and Concepts; International Organization for Standardization: Geneva, Switzerland, 2018. [Google Scholar]
Short Biography of Authors
 | Grazia Veronica Aiosa received her B.S. degree in Computer Engineering (2016) and M.S. degree in Telecommunication Engineering (2019) from the Dipartimento di Ingegneria Elettrica, Elettronica e Informatica (DIEEI) at University of Catania, Italy. She is currently an Early Stage Researcher at DIEEI, University of Catania. Her research interests include multi-layer networks, social contagion and collective attention. |
 | Barbara Attanasio received her B.S. degree in Computer engineering (2016) and M.S. degree in Telecommunications engineering (2018) from the Dipartimento di Ingegneria Elettrica, Elettronica e Informatica (DIEEI) at University of Catania, Italy. She is currently a Ph.D. student in Systems, Energy, Computer and Telecommunications Engineering at DIEEI, University of Catania. Her research interests Multi Access Edge Computing, Evolutionary Game Theory, Multi-layer networks, Data Science and IoT. |
 | Aurelio La Corte is Associate Professor in Telecommunication Engineering at the University of Catania, Italy. He received the degree in electrical engineering in 1988 and the Ph.D. in Electronic Engineering and Computer Science in 1994. He has more than 25 years of experience in scientific and teaching activity and specific experience in designing telecommunications networks and systems and in managing complex projects. Responsible for various ICT-related activities at the University of Catania, he has been involved in coordinating, designing and developing networks and ICT services.His scientific interests include telecommunication systems and integrated services, innovative ICT services and technological innovation. |
 | Marialisa Scatá received her B.S. and M.S. degrees in Telecommunication Engineering, from (DIEEI), University of Catania, Italy. She received the Ph.D. in Computer Science and Telecommunication Engineering from University of Catania under the supervision of Prof. Aurelio La Corte, with whom she has been collaborating since 2009. During the Ph.D. she attended several schools and conferences. Currently, she works as Postdoctoral Researcher at DIEEI, University of Catania. She serves as reviewer for several top-tier journals. She has an interdisciplinary approach to research and her interests include bio-inspired models, ICT, telecommunications, social networks, complex networks, multi-layer networks, social contagion and epidemic spreading, evolutionary game theory, data mining, machine learning, healthcare applications and cognitive networks. |
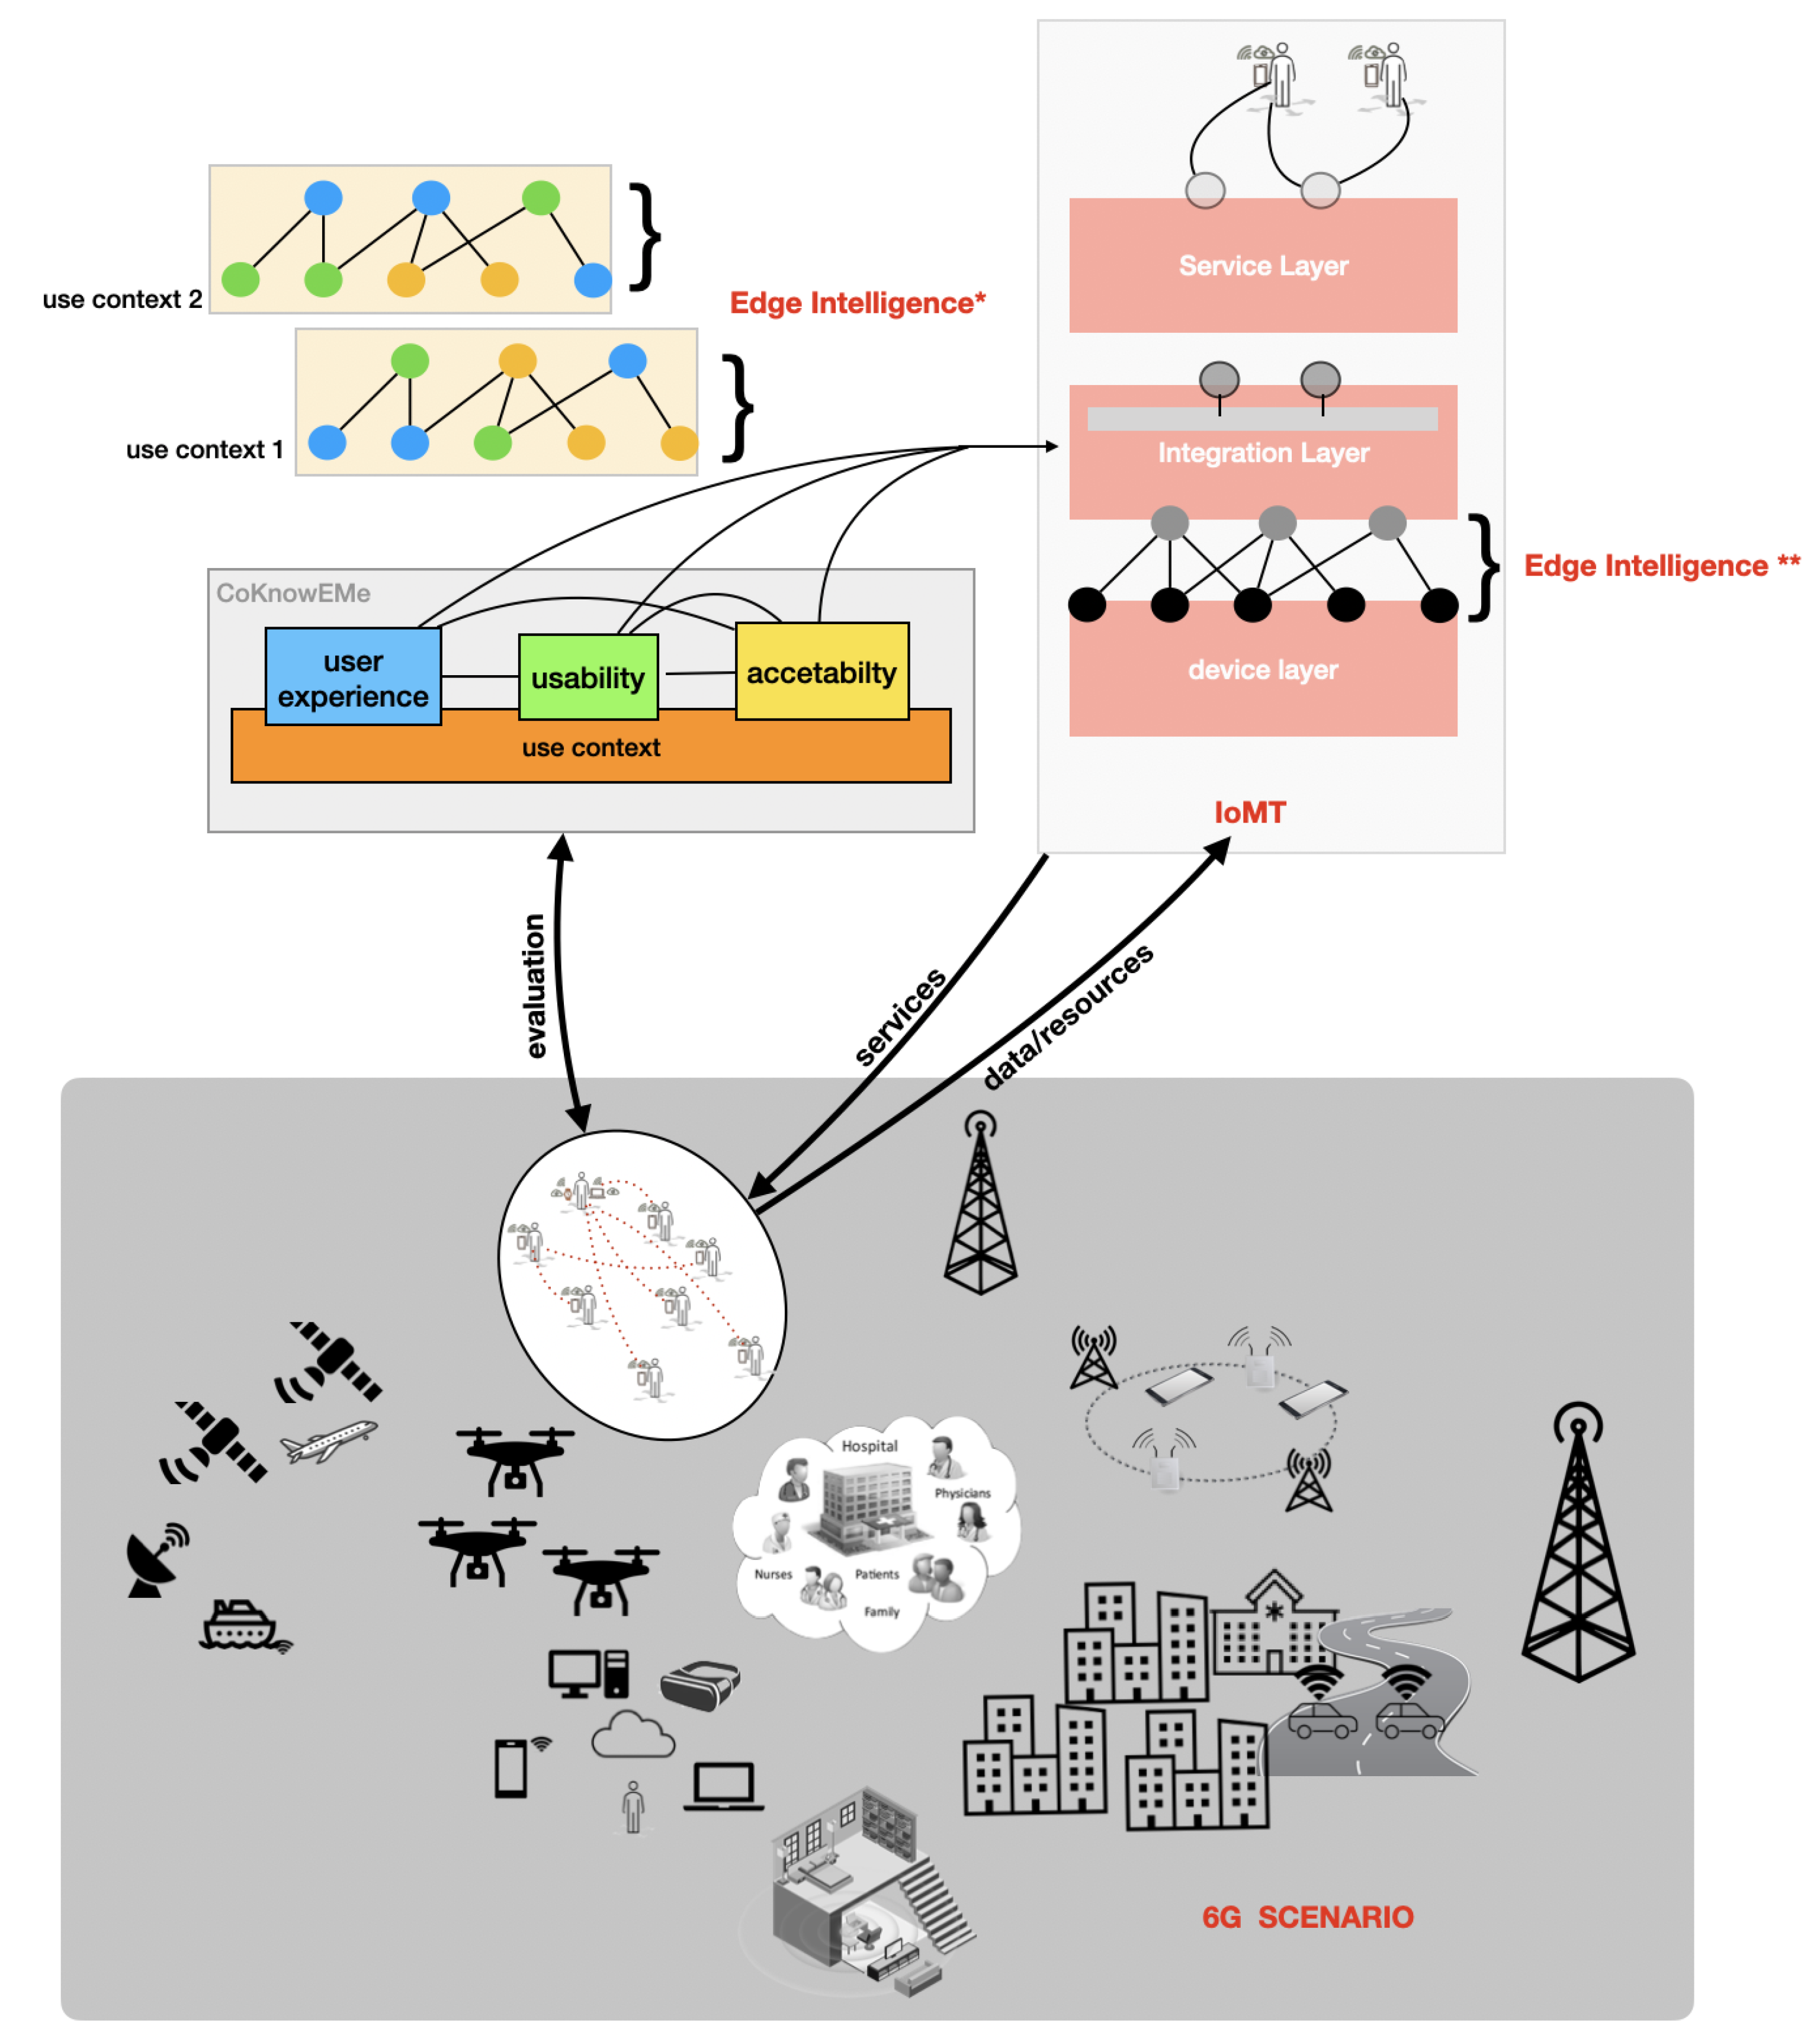
Figure 1.
Evaluation in a 6G scenario for IoMT microservices. This figure shows the schematic representation of the evaluation scheme following the complex approach for IoMT services as dynamical resources organized at the edge level in a multilevel architecture of IoMT systems. The edge intelligence level is intended as a complex evolutionary strategical approach for the distributed resources’ organization, both in terms of evaluation modules (*) and of IoMT integration layer (**).

Figure 2.
CoKnowEMe. The figure describes the architectural model for evaluation Qos of IoMT microservices and shows the modular structure, the concepts taken into account for the evaluation with their attributes and sub-attributes.
Figure 2.
CoKnowEMe. The figure describes the architectural model for evaluation Qos of IoMT microservices and shows the modular structure, the concepts taken into account for the evaluation with their attributes and sub-attributes.

Figure 3.
Complex Approaches for Microservices and their Evaluation. The figure shows and details the methodology of applying the evaluation procedure to a microservice S. At the left, we shed light on the complex approach for both the microservice dynamic construction and the evaluation scheme applied on it. At the right the step-by-step methodology is detailed.

Figure 4.
Selected Categories and classification for each level of the evaluation model. The synthesis and the procedure of the literature survey conducted and detailed in the supplementary information document, in order to select, classify and assess several attributes and sub-attributes for each level of the proposed evaluation model.

Figure 5.
Evaluation of the individual levels. The figure shows the different outputs of the different individual levels and the role of the use context in the definition of the attributes’ weights.
Figure 5.
Evaluation of the individual levels. The figure shows the different outputs of the different individual levels and the role of the use context in the definition of the attributes’ weights.

Figure 6.
Overall Evaluation. The figure puts in evidence how the different individual levels of the proposed architectural model can be chained to provide an overall evaluation.The figure also takes into account the role of the use context in the definition of the attributes’ weights.
Figure 6.
Overall Evaluation. The figure puts in evidence how the different individual levels of the proposed architectural model can be chained to provide an overall evaluation.The figure also takes into account the role of the use context in the definition of the attributes’ weights.

Figure 7.
Degree distribution of three different complex topologies of the networked structure of attributes. The figure show the degree distribution in function of the degree k. In (a) we consider a population size , in (b) , in (c) . In the three plots we shed lights on three different topologies: Scale-Free network (SF) (red line), Erdős–Rényi networks (ER)(blue line), Small-World networks (SW) (green line).

Figure 8.
QoS in function of the population size.The figure displays the trend of QoS considering two different structural networks, the scale-free (red line) and the small-world (blue line), assumed as topology for both the microservice and evaluation graphs. The inset shows the clustering coefficient versus the population size in both cases.

Table 1.
Status of 5G deployment and forecast.
| Region | Operator (Number of Covered Cities) | Launch | Penetration Rate Forecast |
|---|---|---|---|
| Australia | Optus (14), Telstra (46), Vodafone (8) [5] | 05/22/2019 [5] | - |
| Austria | A1 Telekom (129), Drei (Three) Austria (4), Magenta Telekom (T-Mobile Austria) (28) [5] | 03/26/2019 [5] | - |
| Belgium | Proximus (79) [5] | 04/02/2020 [5] | - |
| Canada | Bell (5), Rogers (4), Telus (5) [5] | 01/15/2020 [5] | - |
| Czech Republic | O2 (2) [5] | 06/19/2020 [5] | - |
| Finland | DNA (21), Elisa (30), Telia (8) [5] | 07/01/2019 [5] | - |
| European Union | - | - | 29% (2025) [6] |
| Germany | Telecom Deutschland (20), Vodafone (96) [5] | 07/16/2019 [5] | 98% (2022) [2] |
| Gulf Cooperation Council | - | - | 73% (2026) [7] |
| Hungary | Maygar Telekom (2), Vodafone (2) [5] | 10/17/2019 [5] | - |
| India | - | - | 26% (2026) [7] |
| Ireland | Eir (19), Vodafone (5) [5] | 08/13/2019 [5] | - |
| Italy | TIM (8), Vodafone (5) [5] | 06/06/2019 [5] | - |
| Japan | KDDI (15), NTT Docomo (35), Softbank (12) [5] | 03/25/2020 [5] | - |
| Korea | KT (85), LGU+ (85), SKT (85) [5] | 04/03/2019 [5] | 90% (2026) [2] |
| Latin America | - | - | 34% (2026) [7] |
| Latvia | Tele2 (2) [5] | 01/22/2020 [5] | - |
| Middle East and North Africa | - | - | 18% (2026) [7] |
| Netherlands | Vodafone Ziggo (50% of the Netherlands) [5] | 04/28/2020 [5] | - |
| New Zeland | Vodafone (4) [5] | 12/10/2019 [5] | - |
| Norway | Telenor (4), Telia (2) [5] | 03/13/2020 [5] | - |
| North America | - | - | 84% (2026) [7] |
| North-East Asia | - | - | 65% (2026) [7] |
| Poland | Plus (7), T-Mobile (11) [5] | 05/12/2020 [5] | - |
| South East Asia and Oceania | - | - | 33% (2026) [7] |
| Spain | Vodafone (22) [5] | 15/06/2019 [5] | - |
| Sub-Saharan Africa | - | - | 7% (2026) [7] |
| Sweden | 3-Sweden (5), Tele2 (3), Telia (12) [5] | 24/05/2020 [5] | - |
| Switzerland | Sunrise (384), Swisscom (90% population) [5] | 01/04/2019 [5] | - |
| United Kingdom | EE (80), O2 (60), Three (66), Vodafone (44) [5] | 30/05/2019 [5] | - |
| United States | AT&T (335), Sprint (9), T-Mobile (6000), Verizon Wireless (35) [5] | 03/04/2019 [5] | - |
| World | - | - | 12% (2024), 50% (2034) [2] |
Publisher’s Note: MDPI stays neutral with regard to jurisdictional claims in published maps and institutional affiliations. |
© 2021 by the authors. Licensee MDPI, Basel, Switzerland. This article is an open access article distributed under the terms and conditions of the Creative Commons Attribution (CC BY) license (https://creativecommons.org/licenses/by/4.0/).
Share and Cite
MDPI and ACS Style
Aiosa, G.V.; Attanasio, B.; La Corte, A.; Scatá, M. CoKnowEMe: An Edge Evaluation Scheme for QoS of IoMT Microservices in 6G Scenario. Future Internet 2021, 13, 177. https://0-doi-org.brum.beds.ac.uk/10.3390/fi13070177
AMA Style
Aiosa GV, Attanasio B, La Corte A, Scatá M. CoKnowEMe: An Edge Evaluation Scheme for QoS of IoMT Microservices in 6G Scenario. Future Internet. 2021; 13(7):177. https://0-doi-org.brum.beds.ac.uk/10.3390/fi13070177
Chicago/Turabian StyleAiosa, Grazia Veronica, Barbara Attanasio, Aurelio La Corte, and Marialisa Scatá. 2021. "CoKnowEMe: An Edge Evaluation Scheme for QoS of IoMT Microservices in 6G Scenario" Future Internet 13, no. 7: 177. https://0-doi-org.brum.beds.ac.uk/10.3390/fi13070177
Note that from the first issue of 2016, this journal uses article numbers instead of page numbers. See further details here.