
Research on the General Algorithm and Benefit of Real-Time Positioning Advertising System—Based on the Use of 5G Base Station Data

1
Doctoral Program in Design, College of Design, National Taipei University of Technology, Taipei 10608, Taiwan
2
Department of Interaction Design, National Taipei University of Technology, Taipei 10608, Taiwan
*
Author to whom correspondence should be addressed.
Future Internet 2021, 13(8), 187; https://0-doi-org.brum.beds.ac.uk/10.3390/fi13080187
Submission received: 20 June 2021
/
Revised: 18 July 2021
/
Accepted: 18 July 2021
/
Published: 22 July 2021
(This article belongs to the Section Big Data and Augmented Intelligence)
Abstract
:Due to the limitations of mobile phone positioning technology in the past, it is difficult for an advertising system to obtain users’ locations. Although there are many advertising delivery ideas in the market, time and location-based advertising delivery system have not been able to meet the delivery needs of advertisers. This study investigates various time and location-based advertising needs in the market and finds a universal data processing model that can quickly organize user positioning data from telecom base stations into screening information. It helps us to find specific audiences and to deliver advertisements to target audiences quickly. This study evaluated various advertising scenarios’ effectiveness and explained why there is a performance gap usually between five to ten times worse compared to the past. This study discusses the problems encountered when implementing the advertising system and how to improve them. This study also examines advertising interaction methods based on 5G features, business cooperation and profit splitting with telecom operators, and more diversified data application orientations and possibilities such as market surveys, urban traffic, security issues, and epidemic prevention. The future challenge is to develop footprint tracking technologies based on 5G and provide smart cities with lives-protecting or cost-saving solutions.
1. Introduction
Advertising has always been an indispensable element in the business world. Since the internet began to flourish in 2000, online advertising has always been closely related to our lives. Since 2010, mobile advertising has gradually replaced online advertising and has entered the mainstream in the advertising industry. However, what has not changed, whether it is online or mobile advertising, is the fact that it is tough to obtain audiences’ location. Therefore, in the past 20 years, digital advertising has not been able to deliver advertising effectively based on the audiences’ location.
All advertising systems have always cared about the audiences’ location since if the audiences’ position can be obtained, the audiences’ identity can be more effectively distinguished. In the early days of non-mobile advertising, the advertising system was often only able to judge the audiences’ location based on the audiences’ connection IP. This was indeed a suitable method in the early days since the IP locations of cities, schools, or institutions are fixed. Once you know the IP, you can know the audiences’ location and then consider their identity. However, the problem with this approach is that it is limited to places where the IP is known. If an audience is in a place where the IP cannot be determined, it is impossible to know its location. For audiences with the same IP address, it is also impossible to distinguish between audiences. Or, if the same audience appears or moves in different places, it is impossible to track and analyze the path of their movement, too.
Since the beginning of the era of the popularization of mobile devices, the dilemmas have gradually improved. Each advertising system has used a variety of methods to detect the location of the audience. With the aid of geographic information on mobile devices, the advertising system has finally been able to get rid of the geographic location analysis limited by IP. It can further accurately locate and analyze the audience. There are three main methods of geographic location analysis through mobile devices. The first is to use the mobile phone’s GPS for positioning, the second is to use the mobile phone’s WIFI for positioning, and the third is to use the mobile phone’s Bluetooth for positioning. However, these positioning methods are not without defects.
When GPS is used for positioning, the mobile device will consume a lot of power. If an APP keeps the GPS positioning function on, the mobile device may soon run out of energy. If the user encounters such a situation, they will often remove the APP directly. Thus, most APPs will not always turn on the GPS function. Another possible solution is to use WiFi for positioning. Since a mobile phone can collect nearby WiFi signal sources, if you further analyze the WiFi signals in the current area you can infer a user’s current location. The advantage of this is that there is no need to keep the GPS positioning function always on, there will be no problem of excessive power consumption, and the app will be less likely to be removed due to customer dislike. However, this approach is not without other costs. If you want to use WiFi for positioning, you must regularly collect WiFi signals for each specific location. For the advertising system, this is also a cost, but the advantage is that it is no need to worry about power consumption issues such as collecting user location through GPS. Compared with the positioning method using GPS, although the operating cost is higher, and its feasibility is greatly improved once it is passed on to advertisers. Looking at it from another aspect, the task of regularly updating WiFi signals has become a very troublesome and costly problem.
Finally, let’s look at the problem of using Bluetooth for positioning. The Bluetooth function on early mobile phones is often not turned on. In recent years, thanks to the rise of various wireless connection devices and the popularization of IoT (such as wearable bracelets, wireless earphones, etc.), the default of the Bluetooth function on mobile devices is on, which also makes it possible to obtain location through Bluetooth. To collect the mobile device’s location through Bluetooth it is necessary to deploy the Bluetooth signal to the field where the location will be detected (generally it can be achieved through Beacon) and determine the user’s location based on the collected signals. When more accurate or diversified location references are needed, the advertising system needs to deploy more Beacon reference points. Although the cost is still within an acceptable range, subsequent updates and maintenance are also complicate things (such as battery replacement). Even after completing the deployment, other companies can be directly used since all devices can read the Beacon signal. How to collect and analyze the Beacon signal through the mobile device is also a professional problem. These dilemmas finally make the general advertisement delivery system dare to not easily try location collection solutions, which has caused a gap in demand.
In some recent researches, there are also some research studies related to indoor positioning that are often mentioned. Through some improvements to signal algorithm processing and the use of IoT-specific communication protocols, indoor positioning accuracy has dramatically surpassed outdoor positioning accuracy.
For example, we can use the RSSI signal strength of BLE to improve the accuracy of indoor footprint tracking [1] or, as mentioned here [2], we can use a specific grouping method to improve the accuracy of WiFi for footprint tracking in multi-floor buildings. In addition, this article [3] also mentions that you could use Rola or other IoT-related signal collection for indoor positioning and completely abandon GPS. Even this research [4] also mentioned how to enhance indoor transmission’s safety and speed when using 5G wireless technology.
However, due to the limitations of some practical problems, such indoor positioning technology still cannot directly replace outdoor positioning technology. This type of indoor communication protocol usually has similar problems, including limited transmission distance or transmission times to save power, the inability to deploy extensively on a large scale, and the lack of extensive support by standard mobile devices. Therefore, even if accuracy has its advantages, it still cannot replace the current mainstream outdoor positioning technology.
After 5G appeared, there was a glimmer of hope for the positioning problem. Numerous applications have emerged with 5G, such as the Internet of Vehicles (VANET) and Wireless Metropolitan Area Network (WMAN) [5,6]. Due to the maturity of various software-defined networks (SDNs) [7], device-to-device (D2D) direct communication [8], and dynamic allocation of connection resources [9], the transmission speed and volume of the 5G environment have been significantly improved compared to the past. Even in some places where it is not easy to build a base station, there are studies to provide UAV-assisted technology as a wireless transmission solution [10]. Since the high-speed wireless transmission has covered the entire city, outdoor positioning in the 5G era is no longer a problem.
In fact, telecom operators have had better ways to do this in the past than the advertising system companies that use GPS, WiFi, and Bluetooth for positioning. Through the base station signal and the three-point positioning algorithm, telecom operators can locate the mobile device’s location. However, its accuracy is still limited. Besides, being limited by storage space, it is impossible to store all the data all the time. Most importantly, since the information can only be obtained by telecom operators, such a geographic positioning solution does not actually appear in the general advertising system. Now thanks to the advent of the 5G era, various nearby mobile devices can be quickly connected to each other. Through the low-latency and multi-connection characteristics of 5G, not only the positioning problem can be solved, but also the mobile devices in the same area can interact with one another. Such technological changes will also transform the mobile advertising market based on real-time positioning and trigger more development.
As mentioned in some studies [11,12,13], comprehensive open 5G competition will cause market volatility. Advertising companies have the opportunity to collect some detailed audience information through the deployment of private networks [12], and telecom companies also have the opportunity to profit from various public or private network deployment services [13]. Of course, if the commercial market changes too much, it may also attract the government’s attention and compel legislation to restrict such market competition [11].
The rest of this study is as follows. The second section describes the current market’s situation and tries to clear the focus and find the goal to aim. The third section describes the general methods of process the base station data for the proposed scenarios. The fourth section describes the experimental parameters used in the model and analysis the performance difference of results. The fifth section discusses how to optimize the processing, the delivery restrictions, and some privacy issues. The sixth section describes the study’s contribution, business cooperation, and diversified application for future research and practice.
2. The Current Study
Although advertising is needed by various industries, which industries should be the focus of our attention? Let us start with the vast budget industries to observe. According to some well-known market research companies’ annual market scale survey results, it is not difficult to find that the markets related to people’s livelihood consumption are usually concentrated in travel, education, entertainment, beauty, jewelry, electronic products, and cars.
In addition, governments of various countries usually formulate various laws and regulations to manage finance-related industries and strictly limit the number of bank loans. It is mainly due to the fact that the real estate agency and financial insurance-related industries have a massive impact on the market, which also indicates high profits in these industries, so this will also be the option for us to observe.
If we observe the so-called wealthy users, then those places such as concert halls or museums will be the focus of our observation. On the other hand, we also need to pay attention to some ordinary people in the market who may go places such as chain stores, department stores, or night markets.
Another industry that has enormous profits and has never fallen should be the game industry. From the PC era, the web era, to the current mobile game era, the game industry has never been absent, and well-known games companies constantly introduce the old and the new in the game industry, such as the well-known Angry Birds. If the advertisements platform in this study can help game companies find high-value players, we believe these game companies will definitely be willing to spend more of their advertising budgets.
If we sort out the above industries, carefully analyze the audiences, and classify them, we can roughly draw the following common business problems that have advertising needs but can not be satisfied as follows:
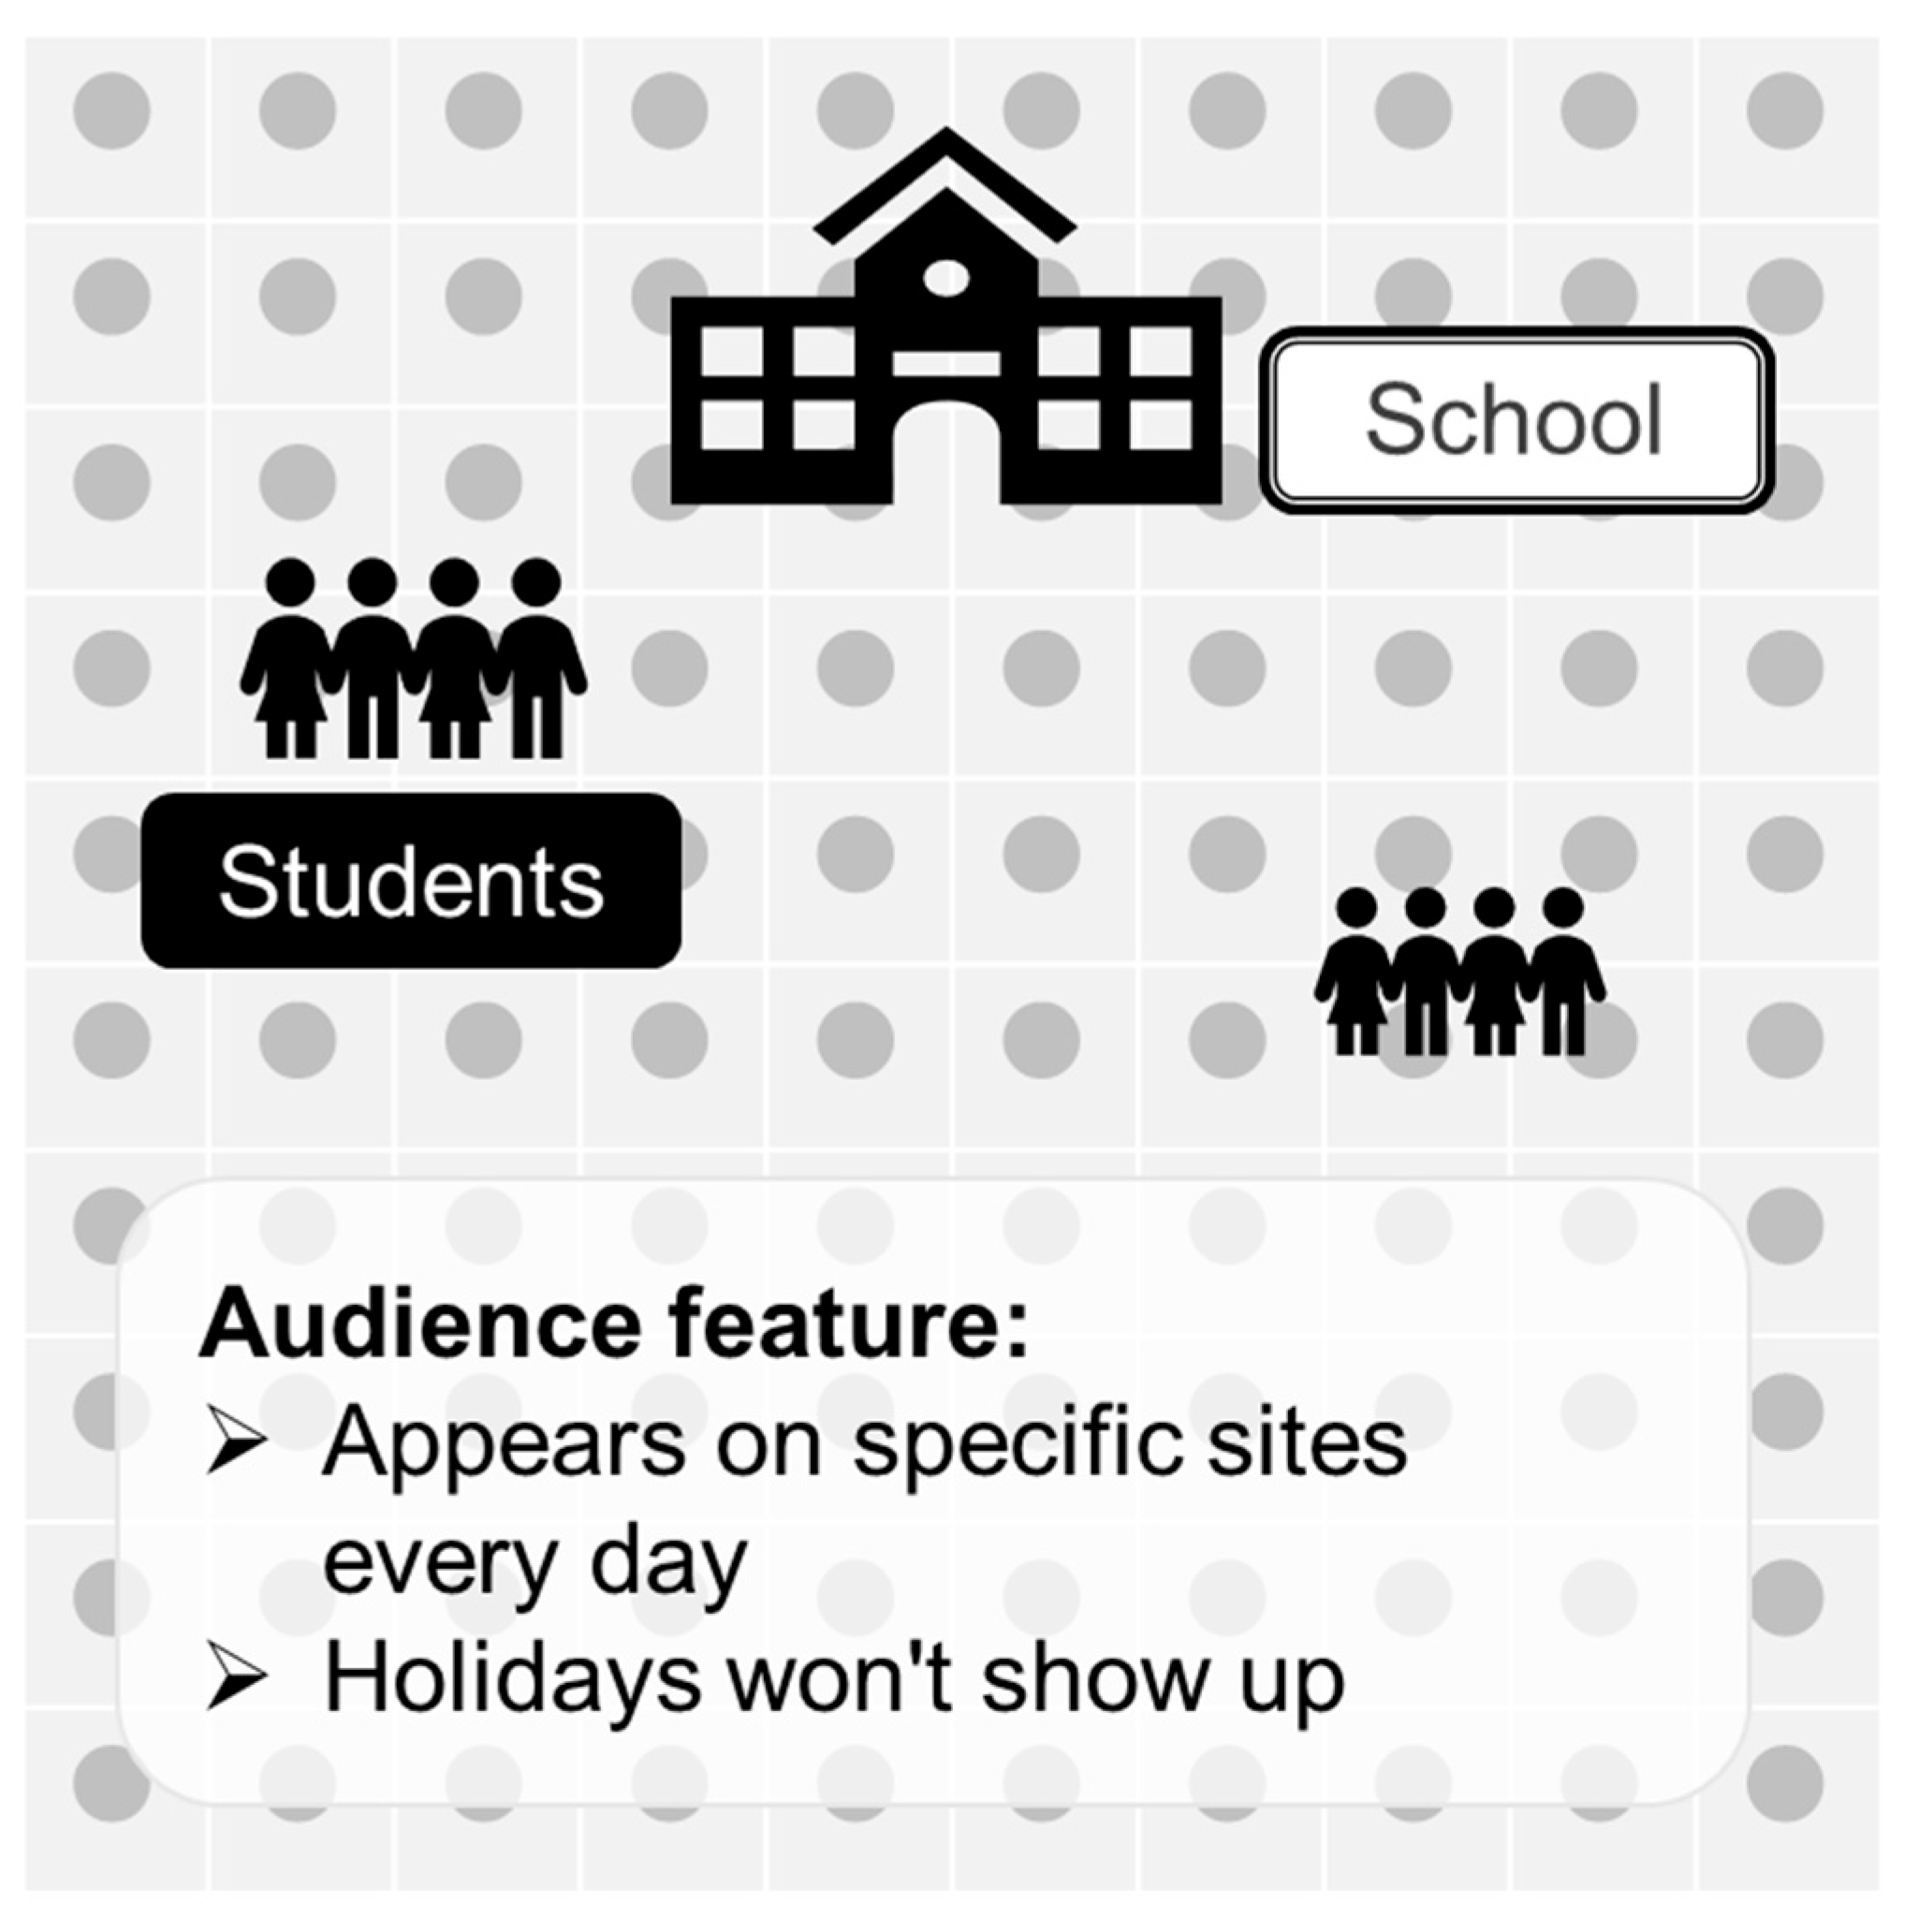
Case 1: Delivery to audiences in specific locations
For example, business people appearing at the airport or students appearing at the school. For instance, travel agencies often hopes to promote high-end travel players or business people who haunt the airport. However, there is currently no appropriate advertising platform that can assist in such advertising needs. Another example is that the tutoring industry may be very interested in promoting students in a particular school (see Figure 1). Still, they suffer from the lack of student contact information or the restriction of campus access control, and there is no way to enroll students on campus. Compared with schools, there may be opportunities for field hardware deployment in the airport through business cooperation to collect geographic information to assist in advertising. However, for academic units relatively closed, such as national and high schools, there is no opportunity to do business cooperation with them. Hence, the tutoring industry can often use other illegal or unorthodox methods to conduct offline campus publicity.
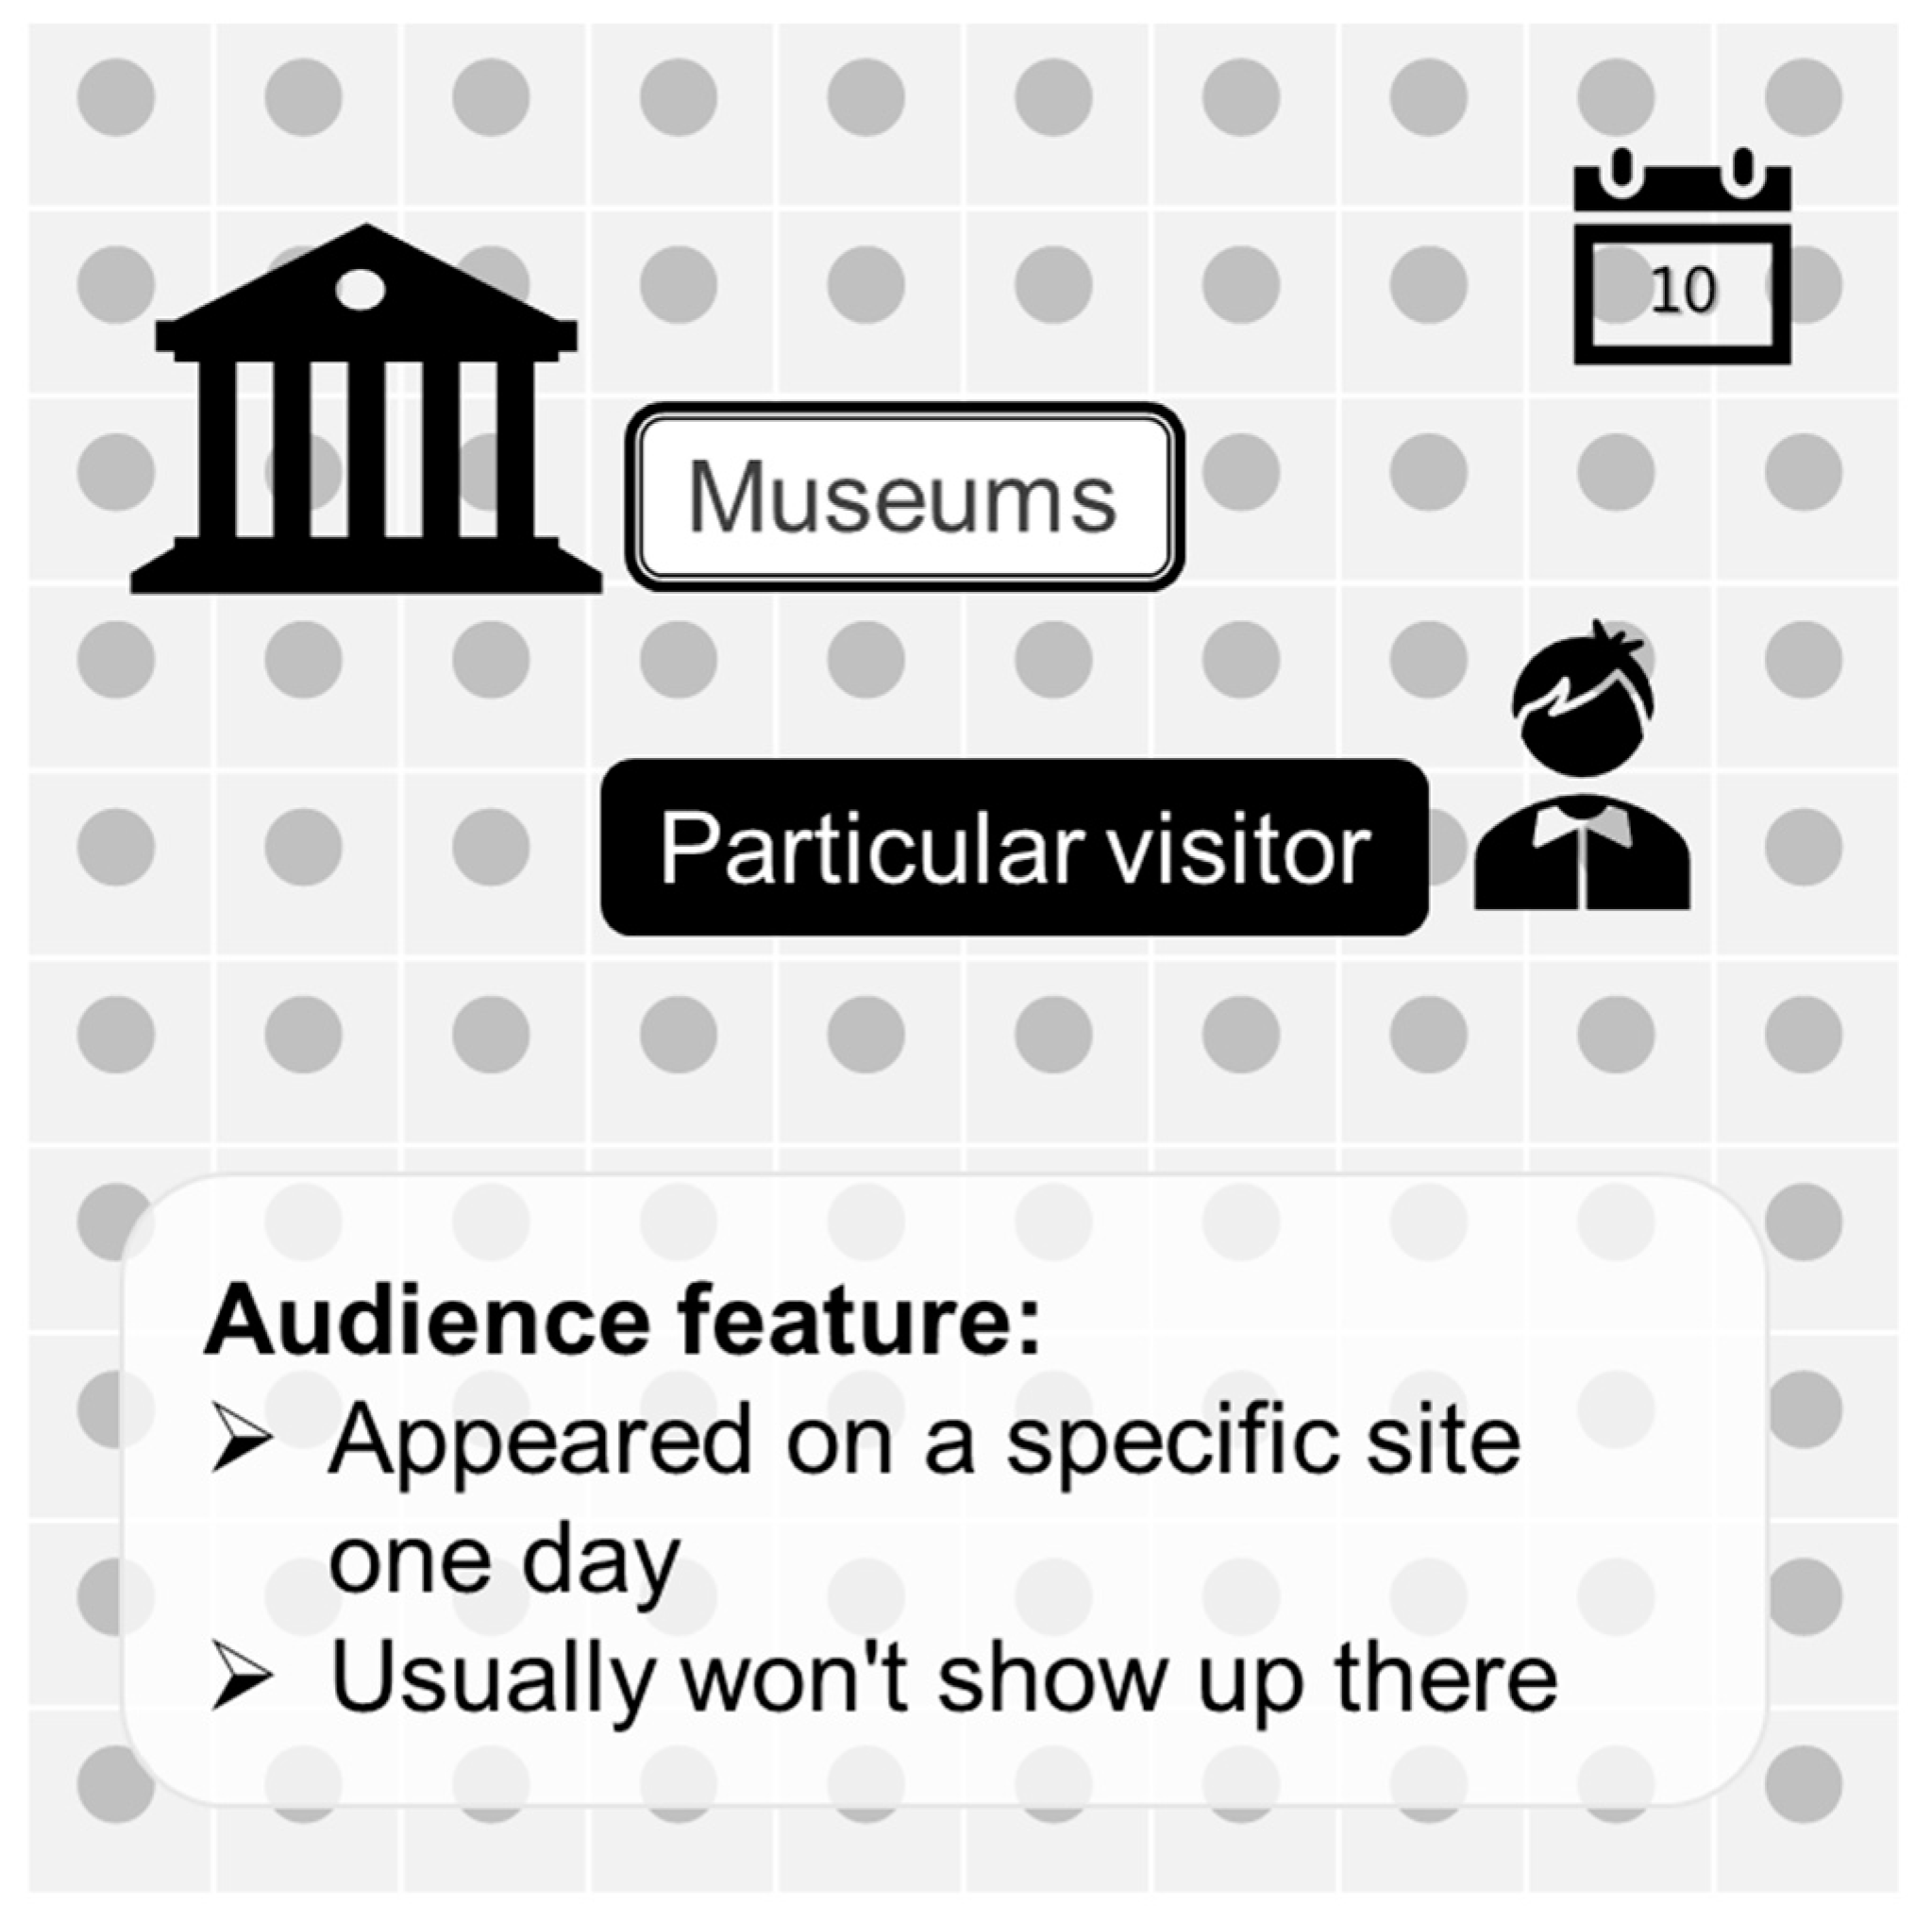
Case 2: Delivery to audiences at a specific time and location
Take, for example, visitors to animation exhibitions or museums. When a game company wants to promote games for groups that have been to a specific animation exhibition or will go to a specific animation exhibition in the future, it will need an advertising system to target people who have appeared at these specific times and places. However, the advertisement delivery system is often only able to deliver to some groups because not all users will turn on the positioning function at that point in time. This also makes it very difficult for this kind of advertisement to screen based on a specific time and location. Even telecom operators cannot keep information about the location of any particular visitor for a long time, so at most, it can only make a scheduled to collect data from audiences who will appear at a specific time and location in the future (see Figure 2). Another example is museums. Most visitors will not leave any personal data at the time of ticket sales. Therefore, if there are similar events in the future and want to reach the past visitors, they can only be implemented through extensive advertising again but lack more effective media exposure.
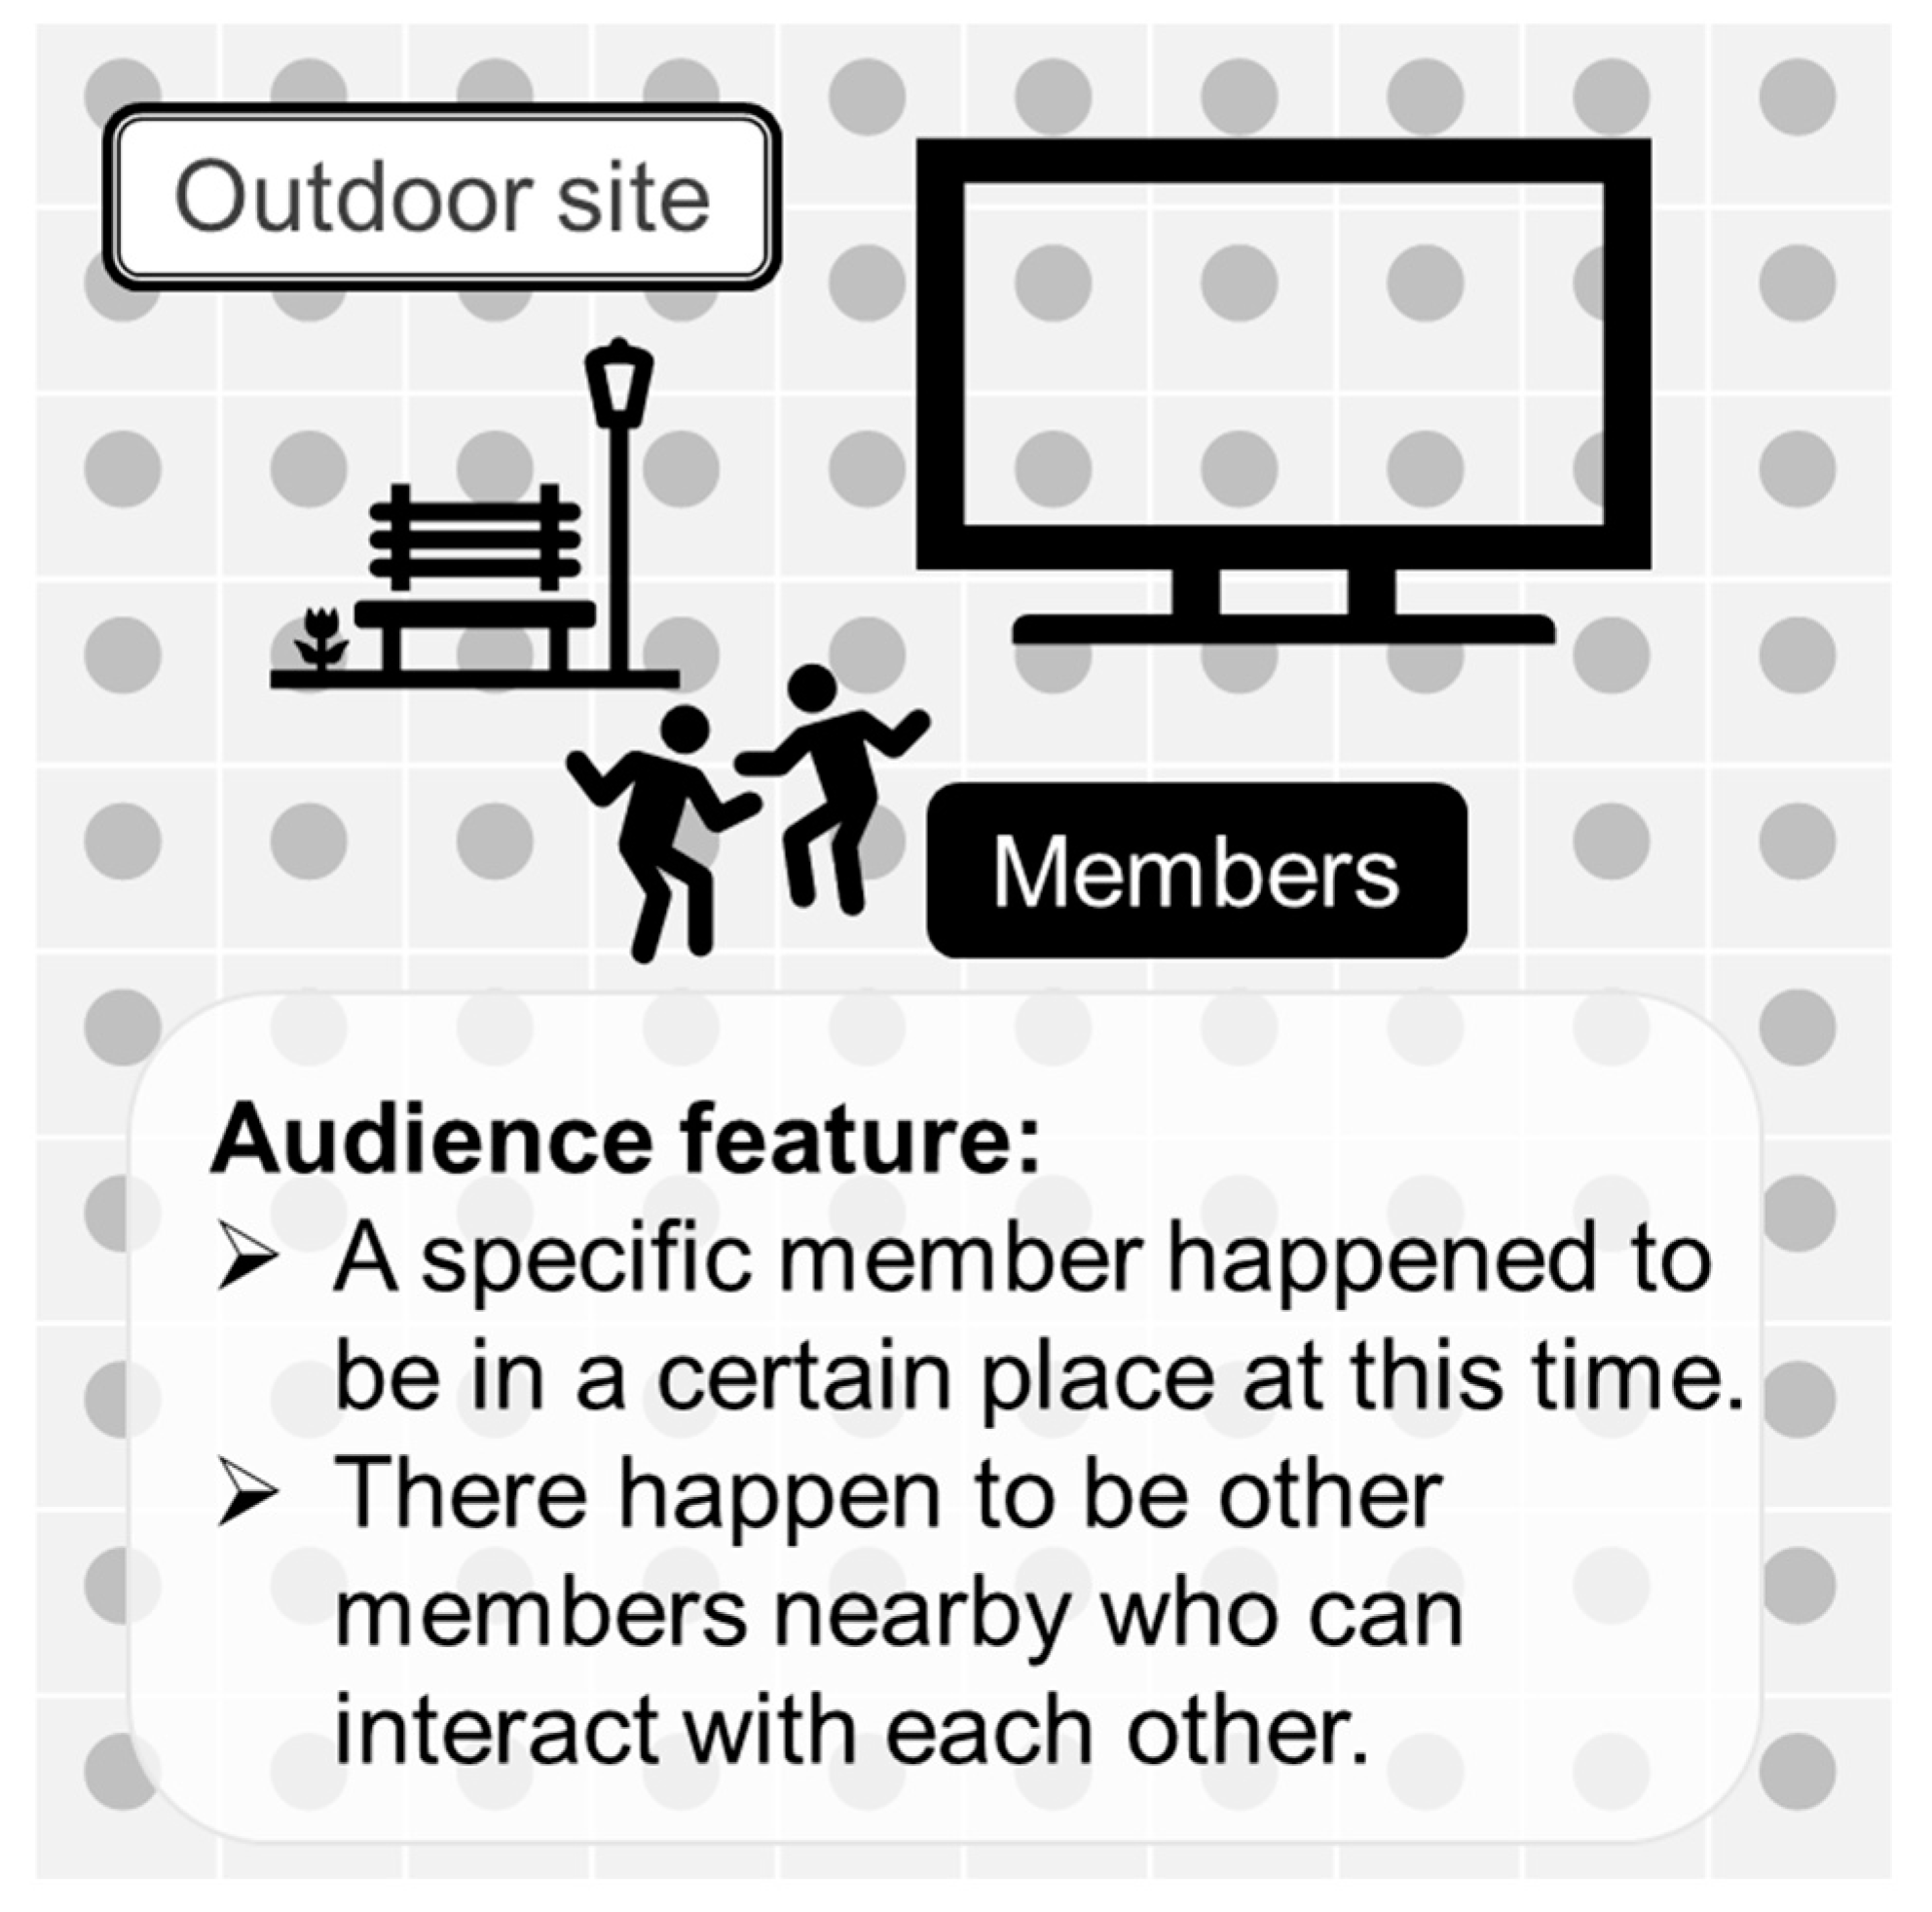
Case 3: Delivering according to specific audience types at the current location
For example, passersby in front of specific outdoor media, or men and women who want to marry in front of Yuelao Temple. Large brand companies often have the budget to purchase outdoor media and can advertise to offline audiences. However, if they want to interact across screens with audiences, the only way to do so is to let audiences scan the QR code on outdoor media screens. Then they can participate through their phone, and there is no way for the brand owner to directly contact the audience in front of the outdoor media. Another example is the dating platform services, which can only be matched online and cannot match real-time and on-site through the data of a specific time and location (as shown in Figure 3). Although some apps have done similar services before (such as finding nearby people), this kind of matching is still only suitable for people who have appeared in the place now (or not long ago). It is also through the server to do non-immediate matching, and it is still a gap compare to real-time and on-site matching.
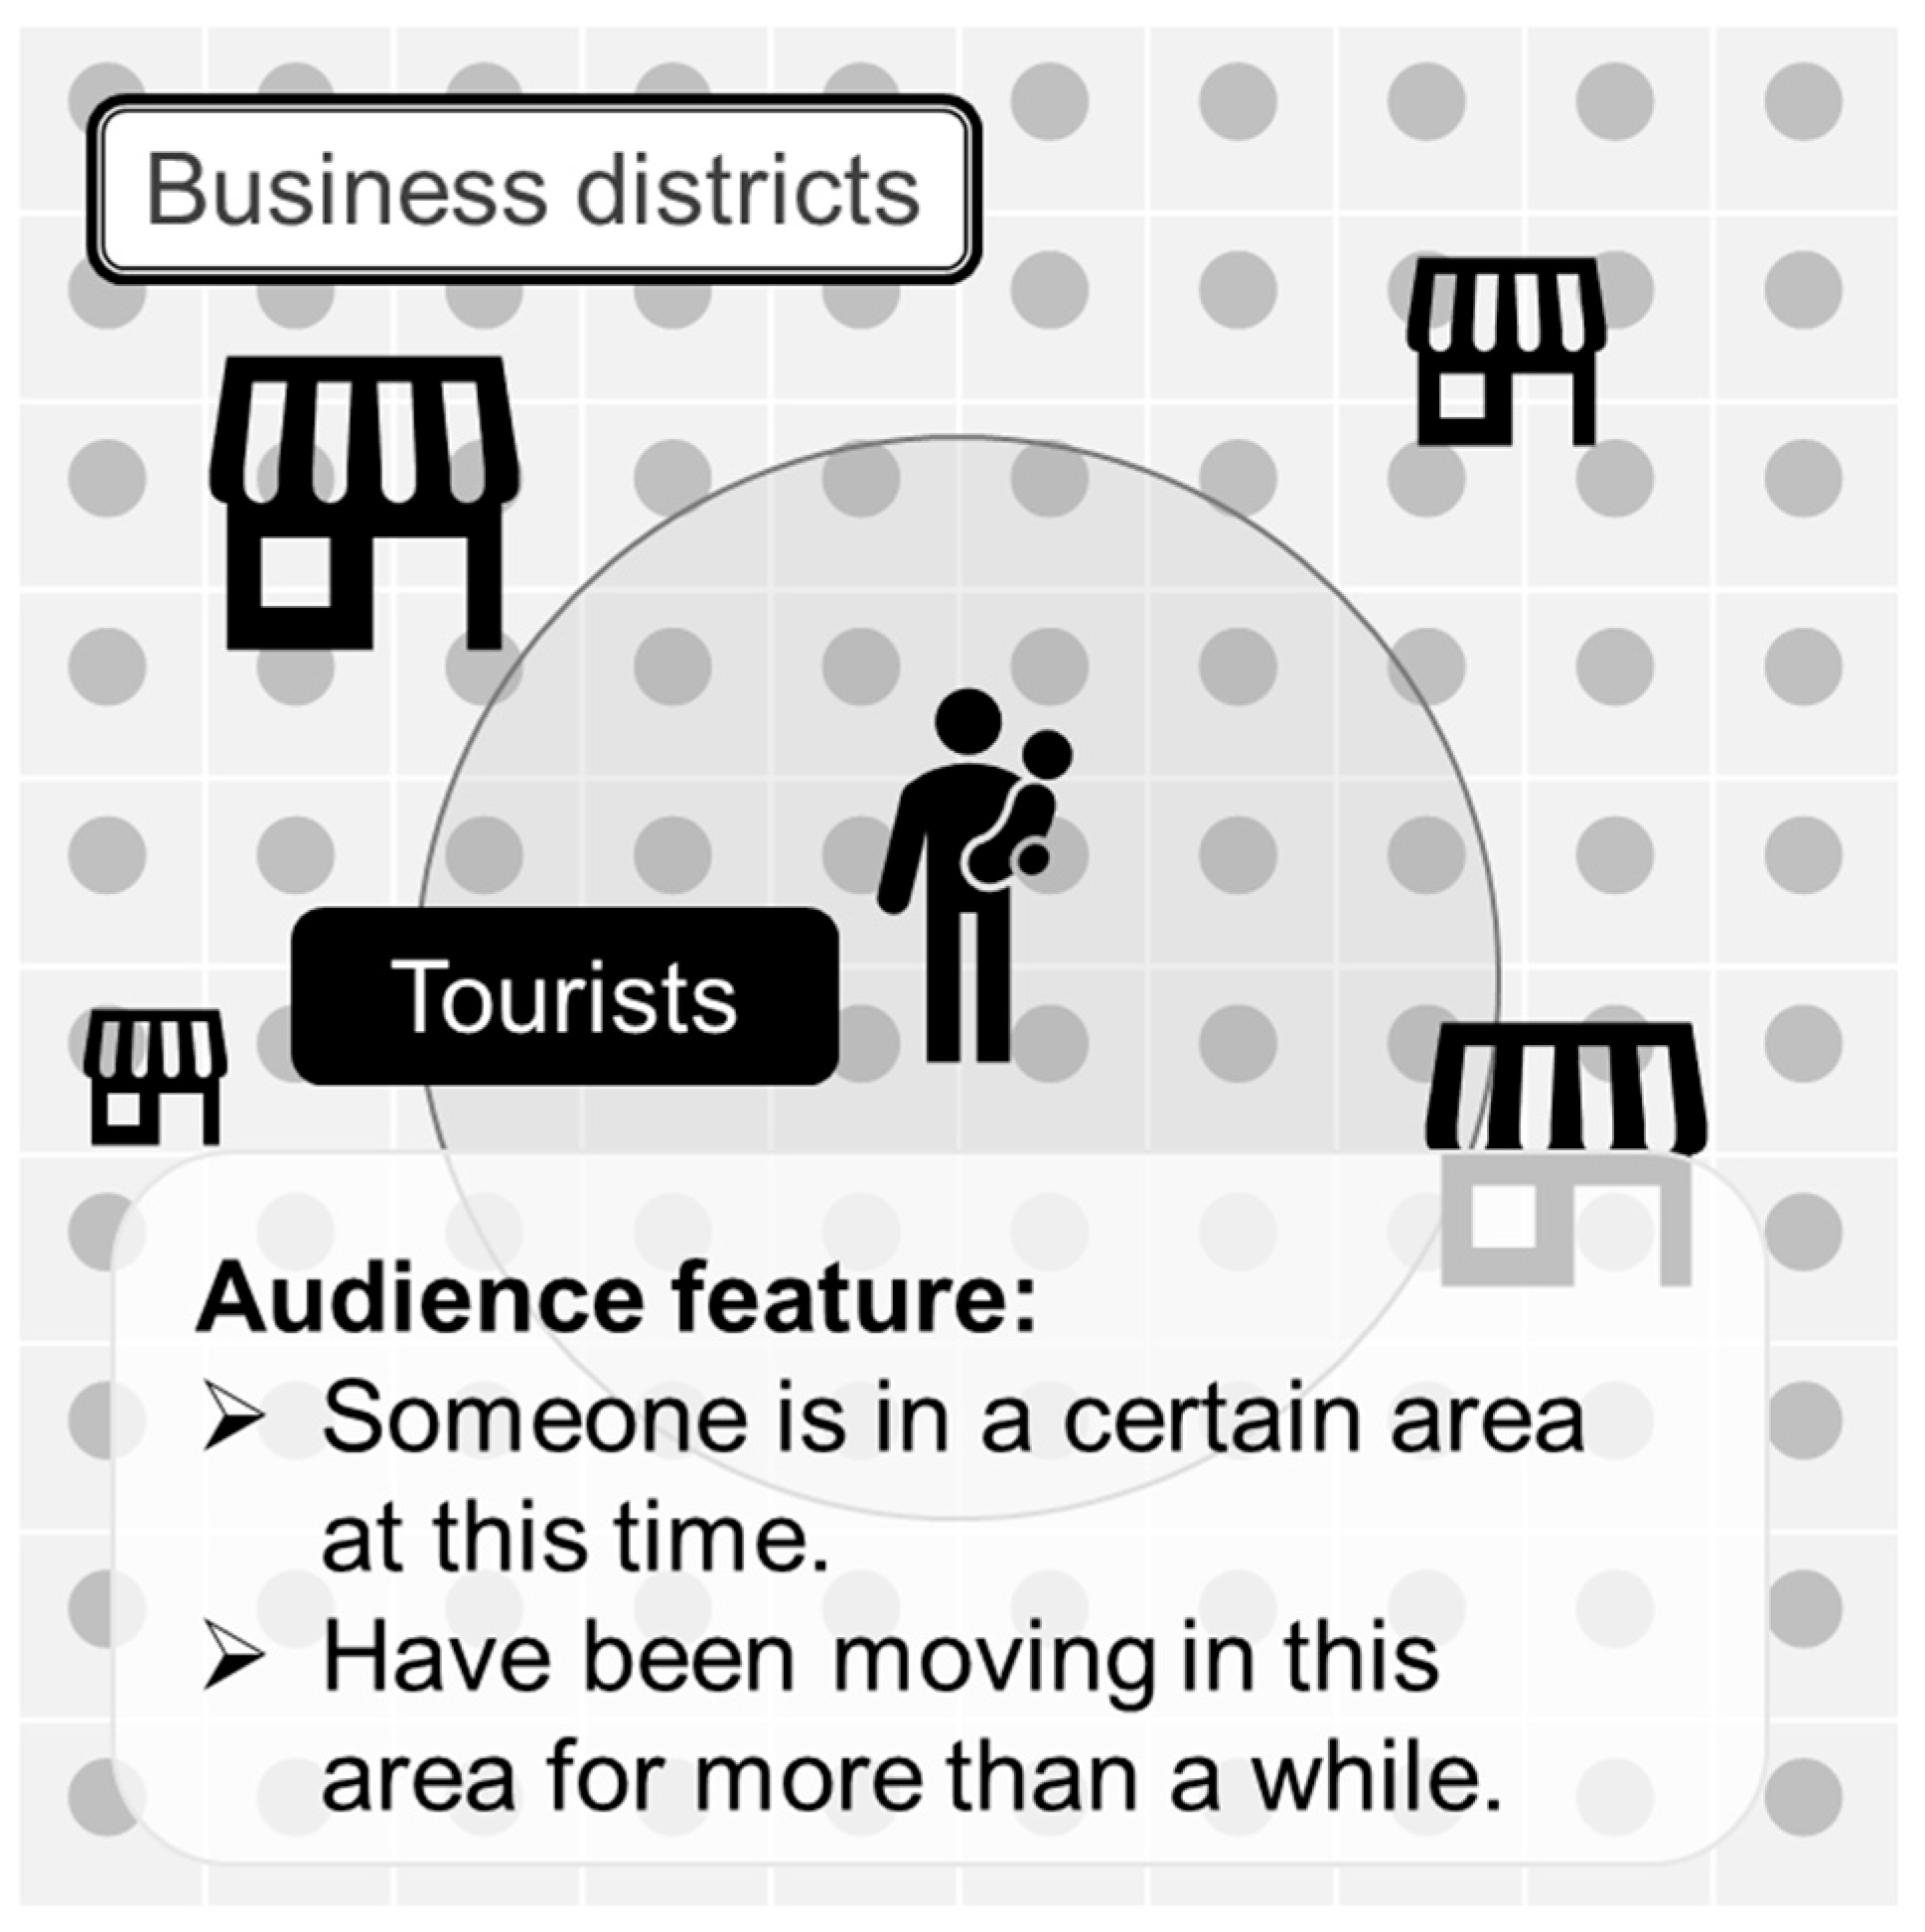
Case 4: Real-time delivery based on movement trajectory
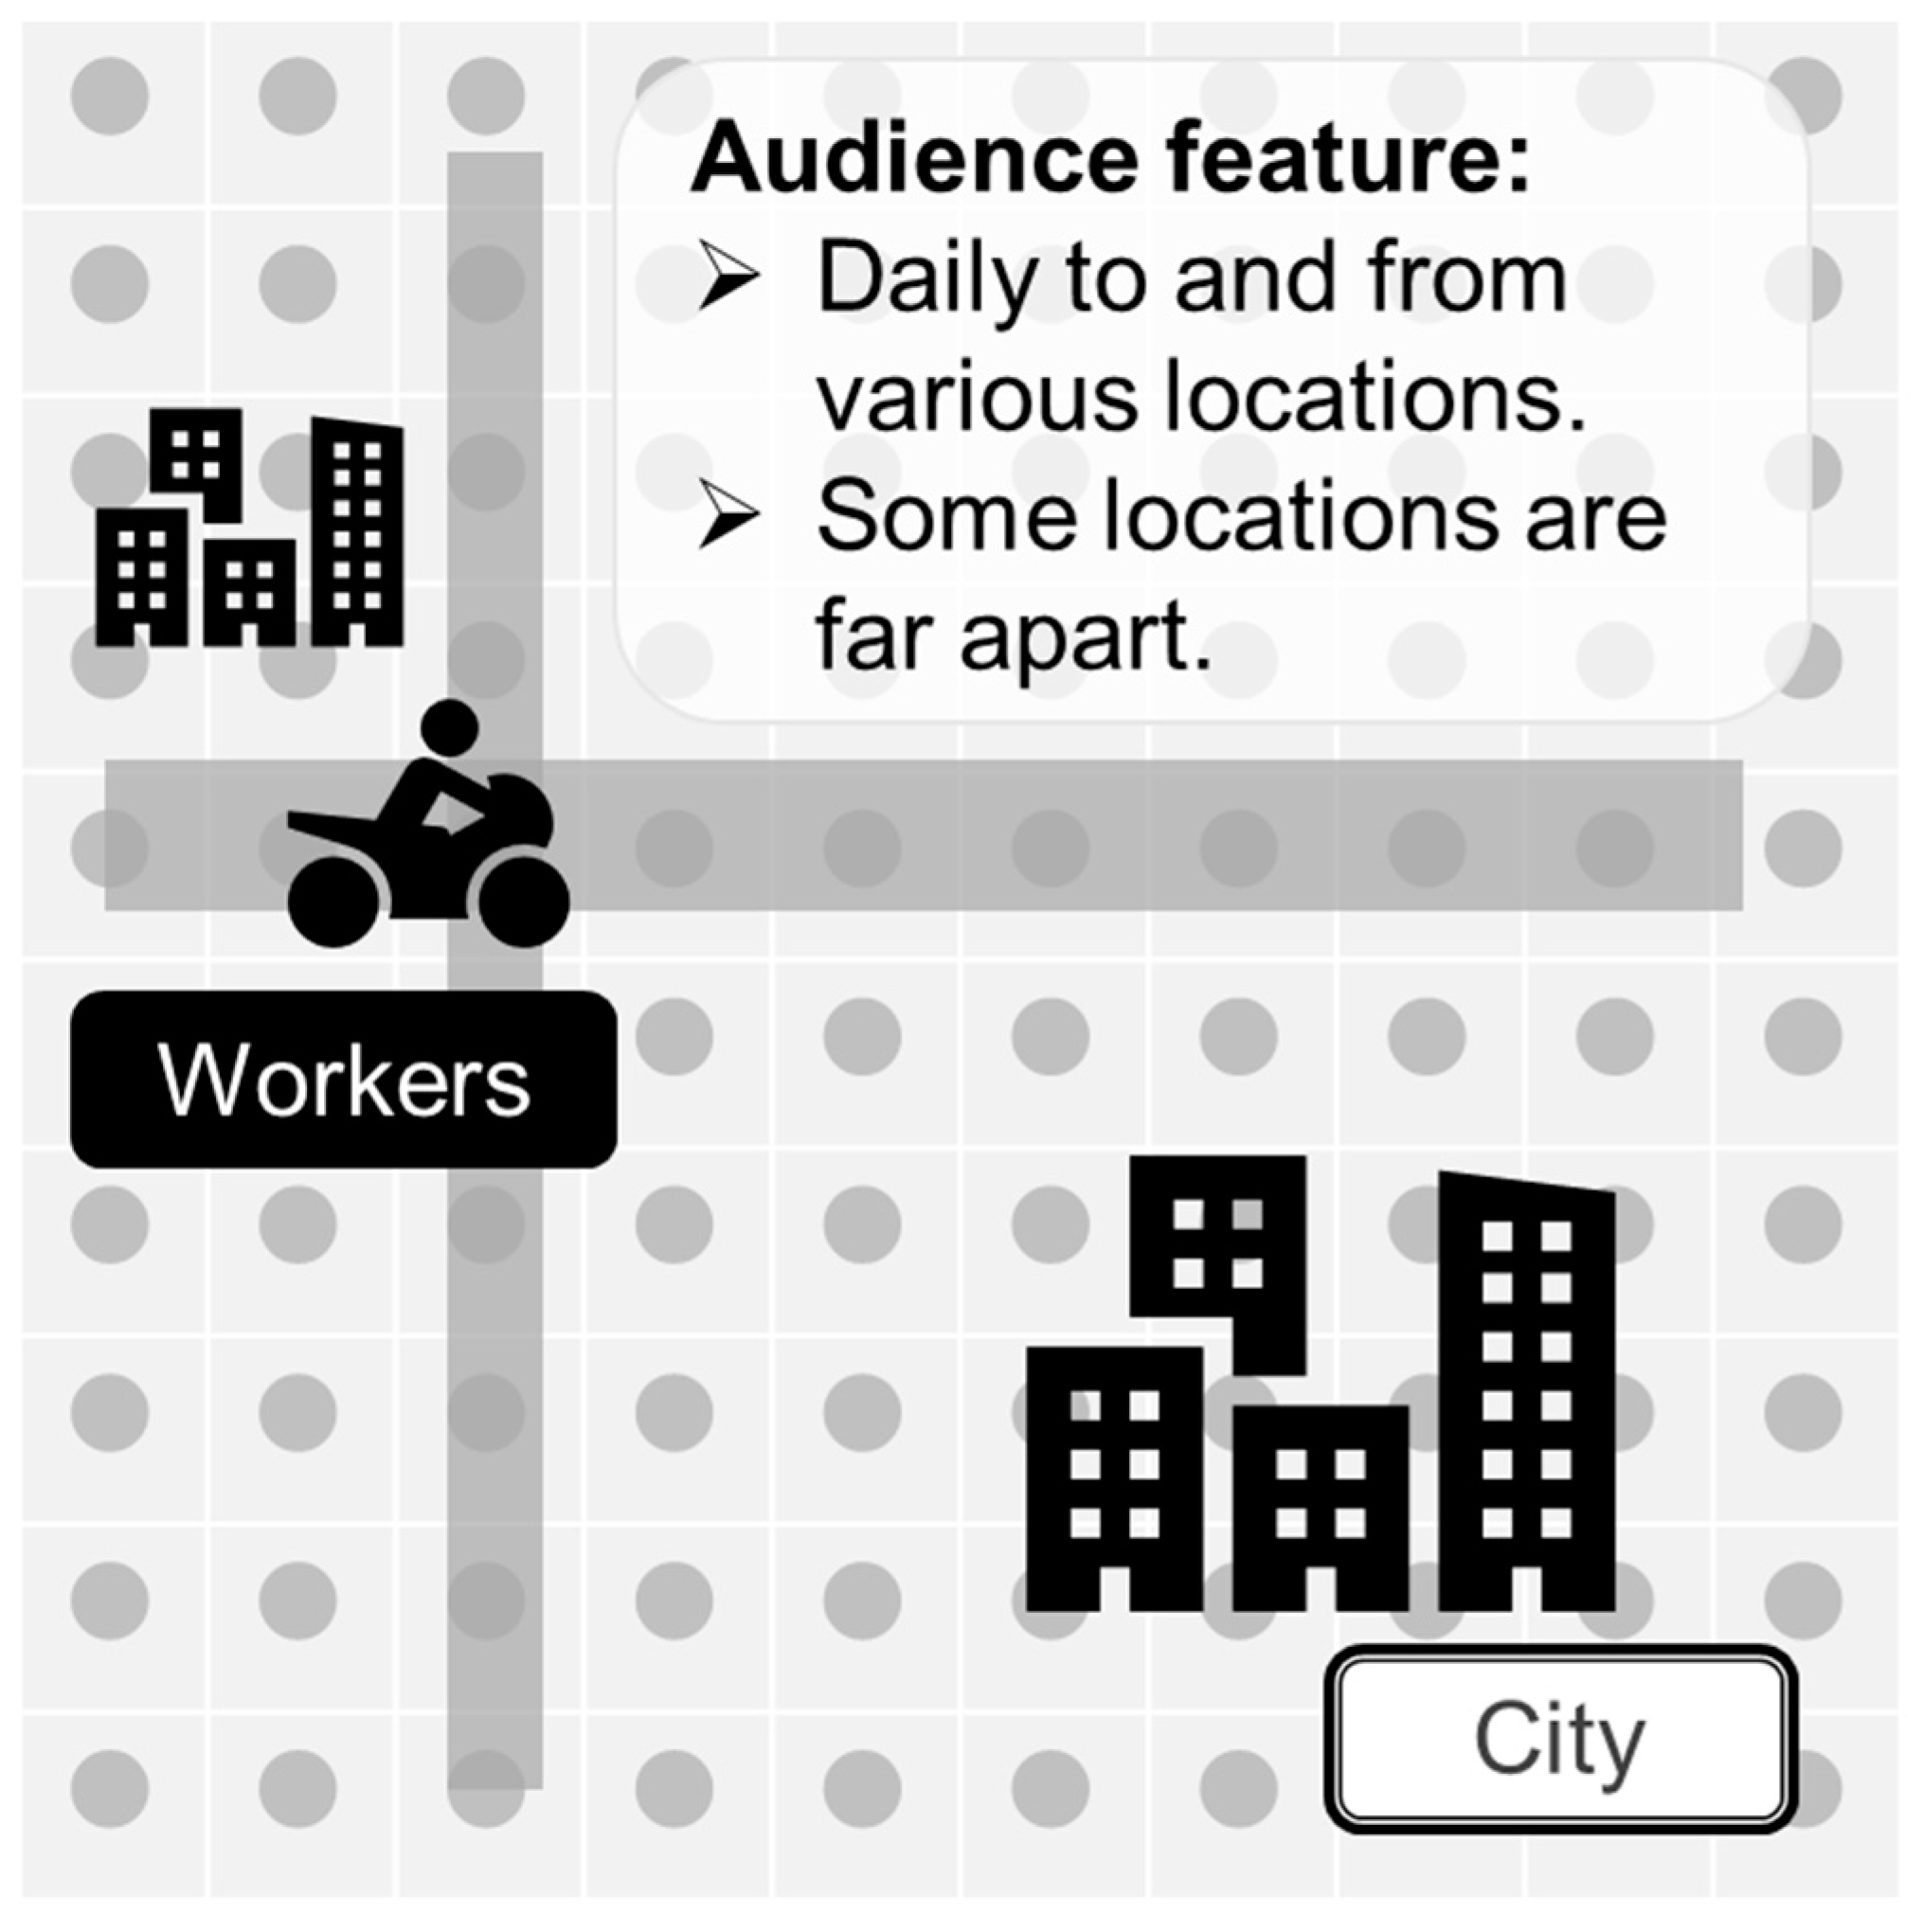
For example, tourists from nearby business districts or drivers start from a particular place and will pass by a specific location. Many famous shopping districts or night markets will have some foot massage shops. Their most desired advertising targets are passersby who have just been shopping nearby for a while (as shown in Figure 4), but such advertising audiences are difficult to receive under the traditional advertising system. Since the traditional advertising system cannot collect and analyze all the object positions in a specific location in real-time, this kind of advertising audience screening needs eventually becomes a situation. That is, there is only market demand but no solution. Similarly, suppose a specific business wants to capture the employees of a few specific commercial buildings nearby and hopes to place advertisements when these employees pass near their own stores after get off work. It is also impossible to implement these kinds of needs in the current advertising system on the market.
Case 5: Serving according to mobile location habits
For example, office workers who commute for a long time or couriers who move frequently. Real estate brokers or landlords often want to promote to potential housing demand users. The common feature of these users is that they will have a long commuting distance or commuting time. Because the location information collected by the current advertising system is usually not continuous, it is difficult to ensure that all objects on a specific commuting route can be reached. It is impossible to find an advertising delivery service that can provide this kind of advertising delivery service in the current market.
Another example is an insurance company or a nutritious food company that may be very interested in long-distance moving business or courier personnel. Still, in terms of advertising systems that can be found on the market, no system can achieve this type of advertising (see Figure 5). The main reason lies in the difficulty of collecting location information, and the audience that can be reached based on the location is not broad enough [14,15,16].
These advertisement requirements, as mentioned above, are all business problems that cannot be implemented or are costly to implement in the current advertising market. This research aims to find out a general data processing mode based on the real-time user geographic data returned by a base station through the development of positioning technology brought by 5G. By this method, we can quickly obtain various types of user screening based on time and location information and makes it possible for the above various advertising problems.
3. Related Work
3.1. Data Requirement
In the past, ad delivery systems have a minimal support for the delivery requirements based on time and location as the screening element. Our goal is to develop an advertising platform that uses time and location as the screening element with 5G base station data. This platform must use time type, time length, location type, number of locations, frequency of locations, and other items as the primary screening criteria for advertising, and it also needs to support typical time and location and other complex criteria screening requirements (such as Table 1).
3.2. Data Collection
In order to design the screening mechanism mentioned above, appropriate information must be collected. Compared to the past, only non-telecom data (such as GPS, WiFi, Bluetooth) can be used to obtain non-real-time audience location data through audiences’ mobile phone report. Now, the telecom base station can be used to collect an audience’s location directly. The location is reported to the ad delivery system in real-time (such as Table 2). The ad delivery system uses real-time computing or edge computing to find the most appropriate advertising content for the audience and launch the advertising.
3.3. Data Preprocessing
The geographic data of the audience collected from the base station mainly needs to include fields such as audience number, site number, and appearance time (such as Table 3), in order to be able to use the information for subsequent, relevant information must be further organized.
We use the data of a specific object to explain. First, the time part must be properly normalized. A data table, for example (such as Table 4), can unify the minutes and seconds of the original data to get lesser data items (e.g., a unit of 15 min). Since the data returned by the base station is unprocessed first-hand data, there may be a lot of data for the same user at the same location. Such data is difficult to analyze and use directly, so it must be merged through the time unit first. To reduce the amount of data collected (such as Table 5), subsequent analysis work can be carried out.
Obviously, we can further organize the time fields and obtain more available time information, including necessary time reference fields such as stay time, day of the week, and holidays (such as Table 6).
Similarly, we can organize the information obtained from the base station based on the site. As long as the average number of appearances, average stay time, and appearance time of each audience at each site are counted first (such as Table 7), the relevant frequency and time data can be used to infer further the audience’s home and company, and the corresponding fields such as time to go out, time to go home and commuting time (such as Table 8).
We can also produce statistics according to the distance between base stations in a period, and obtain relevant information such as the total number of places visited by each audience every day, the average stay time, the average travel time, and the average travel distance (such as Table 9). Even further, we can calculate the statistical results in weekly or monthly units. We can often find further audience profiles from such differences in results (such as Table 10). For example, Person02 in Table 10 has a much lower average number of locations and average moving distance than Person01, so it is easy to know that these are two different types of user groups.
3.4. Recommendation System Models
Based on the above results, various time and location statistical attributes of each audience can be obtained. Most of these attributes belong to numerical data, and a few belong to categorical data. Through appropriate conversion methods, all categorical data can be converted into numerical data (for example, the location data can be converted into two-dimensional latitude and longitude numerical data, or the normal day and holiday can be changed to zero or one), and obtain all of the attributes of each audience (such as Table 11).
If each audience data in the table above is regarded as a set of multidimensional vectors, cluster analysis can be performed in many ways, and various ethnic groups can be distinguished according to the similarity of the object data. If we simply want to group audiences, we can use the cosine similarity algorithm or the k-means algorithm to achieve the goal. Since we plan to include the audiences’ preference for different advertising items into the analysis and hope to find out the attribute factor that affects the degree of preferences, the collaborative filtering algorithm will be used here to continue analyzing the data.
Refer to the table (such as Table 12). Assuming that there are existing audiences’ preferences for various advertising items, you can use the previously known preferences records of advertising items among the audiences to guess the possible preferences of any audience for a particular advertisement. The possible preferences mentioned here can be measured by click-through rate or other values such as conversion rate in practice.
The advertising ethnic group can be obtained through the k-means algorithm first, and then the specific audience can be classified into the advertising ethnic group through the cosine similarity algorithm. The preference of this ethnic group for the specific advertisement AD_N is used as a reference for the inference of the preference of the next exposed audience Person_N.
We can also find out the influence on advertising preferences based on the attributes of each user by using simple linear regression. The various attributes of the user are regarded as independent variables, and the preference of AD is regarded as the dependent variable. The regression analysis can then be performed (such as Table 13). At the same time, the regression coefficients of the influence of each attribute on the preferences of each advertisement are obtained (such as Table 14) and used as a reference for weights of the advertisement recommendation system.
4. Results
This research is designed to screen the audience by obtaining 5G base station positioning data. Compared with the advertising system that uses traditional GPS positioning data, its advertising effectiveness will be significantly different. Before starting the comparison, the usage rate and usage context of the GPS service to be compared will be defined and explained.
The traditional advertising system is mainly limited by whether the positioning function of the audience is enabled for the information collection of the geographic location. When the positioning function is not enabled, the traditional advertising system has no way of knowing where the audience actually is. Therefore, when the placement needs are generated, it can only be inferred based on past data that the placed audience once appeared in a specific location.
In addition, observe the actual data collection situation. Except for several apps with a large number of users, such as Google and Facebook, there are generally not many apps that use mobile phone GPS, and these apps do not have many users. If the advertising system cooperates with these APP services to obtain the geographic location of the audience, its audience coverage is obviously less than 10% of the total audience. Generally speaking, when the APP service uses GPS, most of it is turned on when there is a temporary positioning need. It is basically impossible for the user to keep the GPS continuously turned on. Therefore, the inference of the movement path is actually very difficult to do. If you further observe the GPS data of the user’s location occasionally, you can find that most of the location data is generated by special scenic spots or when traffic positioning is required, so the reference of the obtained location data is open to question.
To sum up, this study assumes that the users who use mobile GPS account for 10% of the total number of users, and that all the information obtained is correct, and based on the following types of advertising scenarios and audiences to compare the performance between using traditional GPS data and using 5G base stations data. For some experimental background condition parameters, please refer to Table 15.
4.1. Targeting a Single Non-Moving Object at a Specific Location
Taking the scenario where the target audience is the students in school as an example, through the analysis of 5G base station data we can grasp all the audience in the field and can also accurately analyze the identity of the audiences that frequently appear in the field. Even if there are errors in the data analysis, there is at least 80% accuracy (maybe misestimated, such as teachers). Compared with the delivery results through GPS positioning data that at most 10% audience only can be obtained, even if the analysis results are completely correct, the performance gap of the two methods is at least eight times worse (such as Table 16).
4.2. Targeting a Single Object Currently Moving in a Specific Location
Taking the scenario where the target audience is the tourists in the night market as an example. As mentioned in the previous analysis, it is assumed that the accuracy after using the 5G base station data is only 80% (excluding the stall vendors who may be misestimated). If you want to obtain the user’s GPS data twice in a period of time in the same place, assuming that the probability of obtaining GPS data from each user at each time and location is 10%, then the chance of obtaining data twice from the same user is only 1%. Therefore, the performance gap of the two methods may be 80 times worse (such as Table 17).
4.3. Targeting a Single Object Currently Nearby in a Specific Location
Take the scenario where the target audience is an anniversary consumer near a specific business as an example. There will be no misestimation through 5G to confirm that the target audience is currently nearby (in this scenario, only the location needs to be judged without identifying the identity characteristics). If you plan to deal with GPS data, the probability that you can get it right now is only 10% and the data must be taken at the place where the advertisement is expected to be placed. Even if all audiences who have appeared in the place in the past month are counted and assumed the audiences’ coverage can reach 20%, the performance gap of the two methods is also at least five times worse or more (such as Table 18).
4.4. Targeting a Pair of Objects Currently Nearby in a Specific Location
Take the scenario where the target audience is a single member’s street paired as an example. If 5G is used, under the premise that the targeted audience is determined (members only), the hit rate of hitting two audiences targeted at the same time is 100%, which is impossible to miss. However, if GPS data is used, it must be ensured that both members must have made location notifications at that time and location. If the probability of both members reporting at the same time is 10%, then the probability of simultaneous notification is at most 1%, the performance gap of the two methods is obviously as high as 100 times (such as Table 19). (Without considering other details of the variables, such as how many members can be matched, or the time difference of location reporting, etc.)
4.5. Targeting Many Objects That Are Currently Approaching at a Specific Location
Take the scenario where the target audience is upcoming passersby nearby outdoor media as an example. For a group of audiences closing to a specific outdoor audio-visual advertising media, they may have different interests and preferences. The best ideal advertising method is to select the materials for the most current ethnic group to be delivered. For each round of advertising, we can also calculate the materials to be chosen for the following exposure based on the nearby upcoming audiences and make pre-arrangements.
We can discuss the effectiveness of randomly placing materials and placing materials after statistical identities in two cases. There are either obvious differences between the audience groups, or there are no obvious differences between the audience groups.
To facilitate the discussion, use the following hypothetical situation to illustrate. Suppose there are two kinds of materials, A material is suitable for viewing by A group, and B material is suitable for viewing by B group. A total of two rounds will be executed. Each round advertisement will be exposed twice. The ratio of the number of audiences in group A to group B when the two advertisements are executed is 1:1 and 2:8, respectively.
CASE1: When the ratio of the number of audiences from group A to group B is 1:1
At this time, regardless of whether it is playing A or B advertisements, exactly half of the people will represent the audience. Therefore, the ratio of the number of people who are correctly placed is 0.5 × 0.5 + 0.5 × 0.5 = 0.5. That is, it is about a 50% hit rate when the advertisement is delivered.
CASE2: When the ratio of the number of audiences from group A to group B is 2:8
Because the audience in the same place will have different differences due to different times, it is necessary to consider the current audiences and materials matching situation of the advertisement to discuss. The possible four situations are: A material is delivered to A group, A material is delivered to B group, B material is delivered to A group, or B material is delivered to B group.
Since a total of two times advertising have been executed, the result of each placement may be one of the above four possibilities. Suppose the audience analysis of each placement is carried out by obtaining 5G base station data. In that case, although the audience cannot be 100% satisfied, the average delivery effectiveness is still better due to the best material choices that are suitable for the largest audience.
When using GPS data for audience analysis, due to the uncertainty of obtaining the data, it is almost the same as random placement. If you consider the probability of random placement, you will find that the best placement effect is only equivalent to using the 5G base station data (when the best material is selected for both placements), and in most cases, the delivery effectiveness is not good (the best material is often selected once or not selected on both times).
Since, no matter at any time, there will hardly be a situation where the audience groups are exactly half-and-half for a field. Therefore, if the average effect difference is calculated, the performance gap of the two methods may be close to about 1.6 times (such as Table 20).
4.6. Targeting a Single Object Moving in a Specific Area on a Particular Path
Take the scenario where the target audience is commuters traveling between specific two places as an example. With 5G data used, advertising can undoubtedly select the target conditions to be delivered accurately. Still, if you use GPS data to analyze the target, this delivery will be similar to random delivery as discussed in the previous cases. Relatively speaking, the probability of accurately hitting the target will drop significantly. We can discuss the case according to the situation of the target population and the total population in different proportions:
CASE1: When the correct audience accounts for 10% of the total population
Since this case is to designate commuters traveling between specific two places, the total number of audiences delivered under this requirement is generally unlikely to be very high. We assume that only 10% of people meet such conditions. Focusing on these targets is not practical. It is challenging to spend ten times the budget for total advertising exposure; even if the budget is not a problem, it will cause trouble to the other 90% of the non-audience.
CASE2: When the correct audience accounts for 1% of the total population
When the audience accounted for only 1% of the total population, only some business owners in some specific industries could use random placement for advertising exposure. It means that the profit ratio of the business is very high and can cover the high advertising budget by the vast profits from customers. Even for business owners who can have such profit, they generally do not use random placement for advertising exposure. There are other ways in many practical applications.
When the ratio of the audience to the total population is too low, the owners will often advertise by filtering the area. Due to the use of the area as a filtering condition, the total number of audiences that need to promote is less, so the accuracy is improved. Although the final hit ratio is still the same as the full-scale delivery, this change saves the advertising budget and does not bore too many audiences. Hence, it becomes a compromise that can be implemented. Regardless of the ratio of the audience to the total population, there is always a significant performance gap for audience analysis between the use of GPS data and 5G data (see Table 21).
5. Discussion
5.1. Optimizations of Data Processing
In order to quickly process a large amount of base station data in the aforementioned raw data processing, we simply organize the time part of the data in an interval of 0.25 h and use it for calculation. However, the size of the selected time interval may significantly affect the calculation performance and accuracy. With different application scenarios and requirements, the time interval size can be appropriately adjusted to obtain better calculation results.
In addition, when processing various types of time and location-based data statistics, various frequently used data should be pre-calculated as much as possible, and various pre-calculated results should be updated regularly in a near-real-time manner according to the probability of use. The discussion of the process is more complex, and it is not within the scope of this study.
In the data processing of user attributes, in order to simplify the calculation, we convert part of the categorical data into numerical data and normalize some of the numerical data into consistent numerical types or intervals. If the aforementioned processing is implemented using a deep neural network, the above numerical interval unity may be omitted.
However, in practical applications, it is often impossible to perform real-time calculations at the moment of launch. In order to improve the modeling speed and match actual applications, the data processing methods and selected algorithms need to be changed according to the existing system hardware resources.
More attention should focus on the processing of categorical data. The processing of categorical data into numerical data often has a crucial impact on the accuracy of model predictions. Many algorithms and statistical conversion techniques can assist in converting categorical data, such as statistical dummy variables skills. If the best conversion value can be directly determined manually, the prediction accuracy will, of course, significantly surpass the results of other direct-use model training.
In order to quickly obtain similar advertising audiences in the practical application of real-time delivery, this study selected collaborative analysis and cooperated with similar algorithms to achieve this goal. However, if the system’s computing resources are fast enough, or in an application scenario that does not require real-time delivery, other deep learning algorithms can be tried, and it may help to improve prediction accuracy.
5.2. Practical Delivery Restrictions
The actual ad delivery system may have more issues that must be dealt with. For example, properly sorting the order of advertisements and digesting the amount of advertisements to be executed is a common problem. In addition to trying to improve the accuracy of advertising, the advertising system must also digest the amount of advertising to be executed. Different advertisers may want to advertise to audiences at a specific time and location. Generally speaking, they can (on average) digest the budget of each advertiser through random exposure. However, if there is a huge disparity in the budget size between advertisers, then the implementation of average exposure may cause additional problems.
For example, if ad placement is executed by average placement, then after a while, ad exposures with a smaller budget will be run out first. After that, all of the advertising volume may expose to the advertising with the largest budget. Of course, this situation is not abnormal for the advertising delivery system, but it is easy to cause dissatisfaction among the exposed audience. At this time, the audience is very likely to lose interest in the advertisement because of the repeated appearance of the ad and they may even become dissatisfied. The result may be a decline in the click-through rate of ads, and continuous waste of ad exposure resources. Unlike general advertisements, there are many opportunities for exposure. Because the number of audiences that appear at a specific time and location is limited, the use of exposure must be managed more effectively.
Bidding can be used to deal with the priority of exposure. However, simply using the general bidding system cannot avoid the above problems. Once a large advertising budget enters the system’s exposure schedule, its funding will take up a lot of exposure. If you want to suppress the above problems, you must adopt a staged bidding pricing strategy. That is, in addition to the general single-exposure bidding, you must also make an additional bid budget plus requirements for the total amount of exposure to avoid the dilemma of resources being monopolized by advertisers with large budgets.
If you want to make such an evaluation mechanism, the first thing you need to know is the upper limit of the total amount of exposure. It is necessary to obtain the total amount of exposure before the reasonable value of the additional bid budget plus can be estimated. By accumulating data and establishing predictive models, we can more clearly know the required advertising exposure quota and the available advertising exposure quota and make more advanced exposure management strategies based on these quotas.
For example, if there are multiple advertisers today, and several of them account for the majority of the total exposure available, then their exposure weight and bidding price should be adjusted according to their different proportions. Of course, such adjustments will not be known to advertisers. For advertisers, it is just a bidding number, and if the quotas of advertisements are not exposed enough, from the advertiser’s point of view, it is only because the bidding price is not high enough.
What the system needs to deal with is to determine a relatively reasonable bidding price evaluation mechanism so that advertisements with a large amount of exposure can be exposed according to the premium price. Because the specific design of this part is more complicated and has deviated from the subject of this research, it is not within the scope of this research. Here, we will only outline possible problems and solutions.
5.3. Cross-Platform Cooperation and Privacy Issues
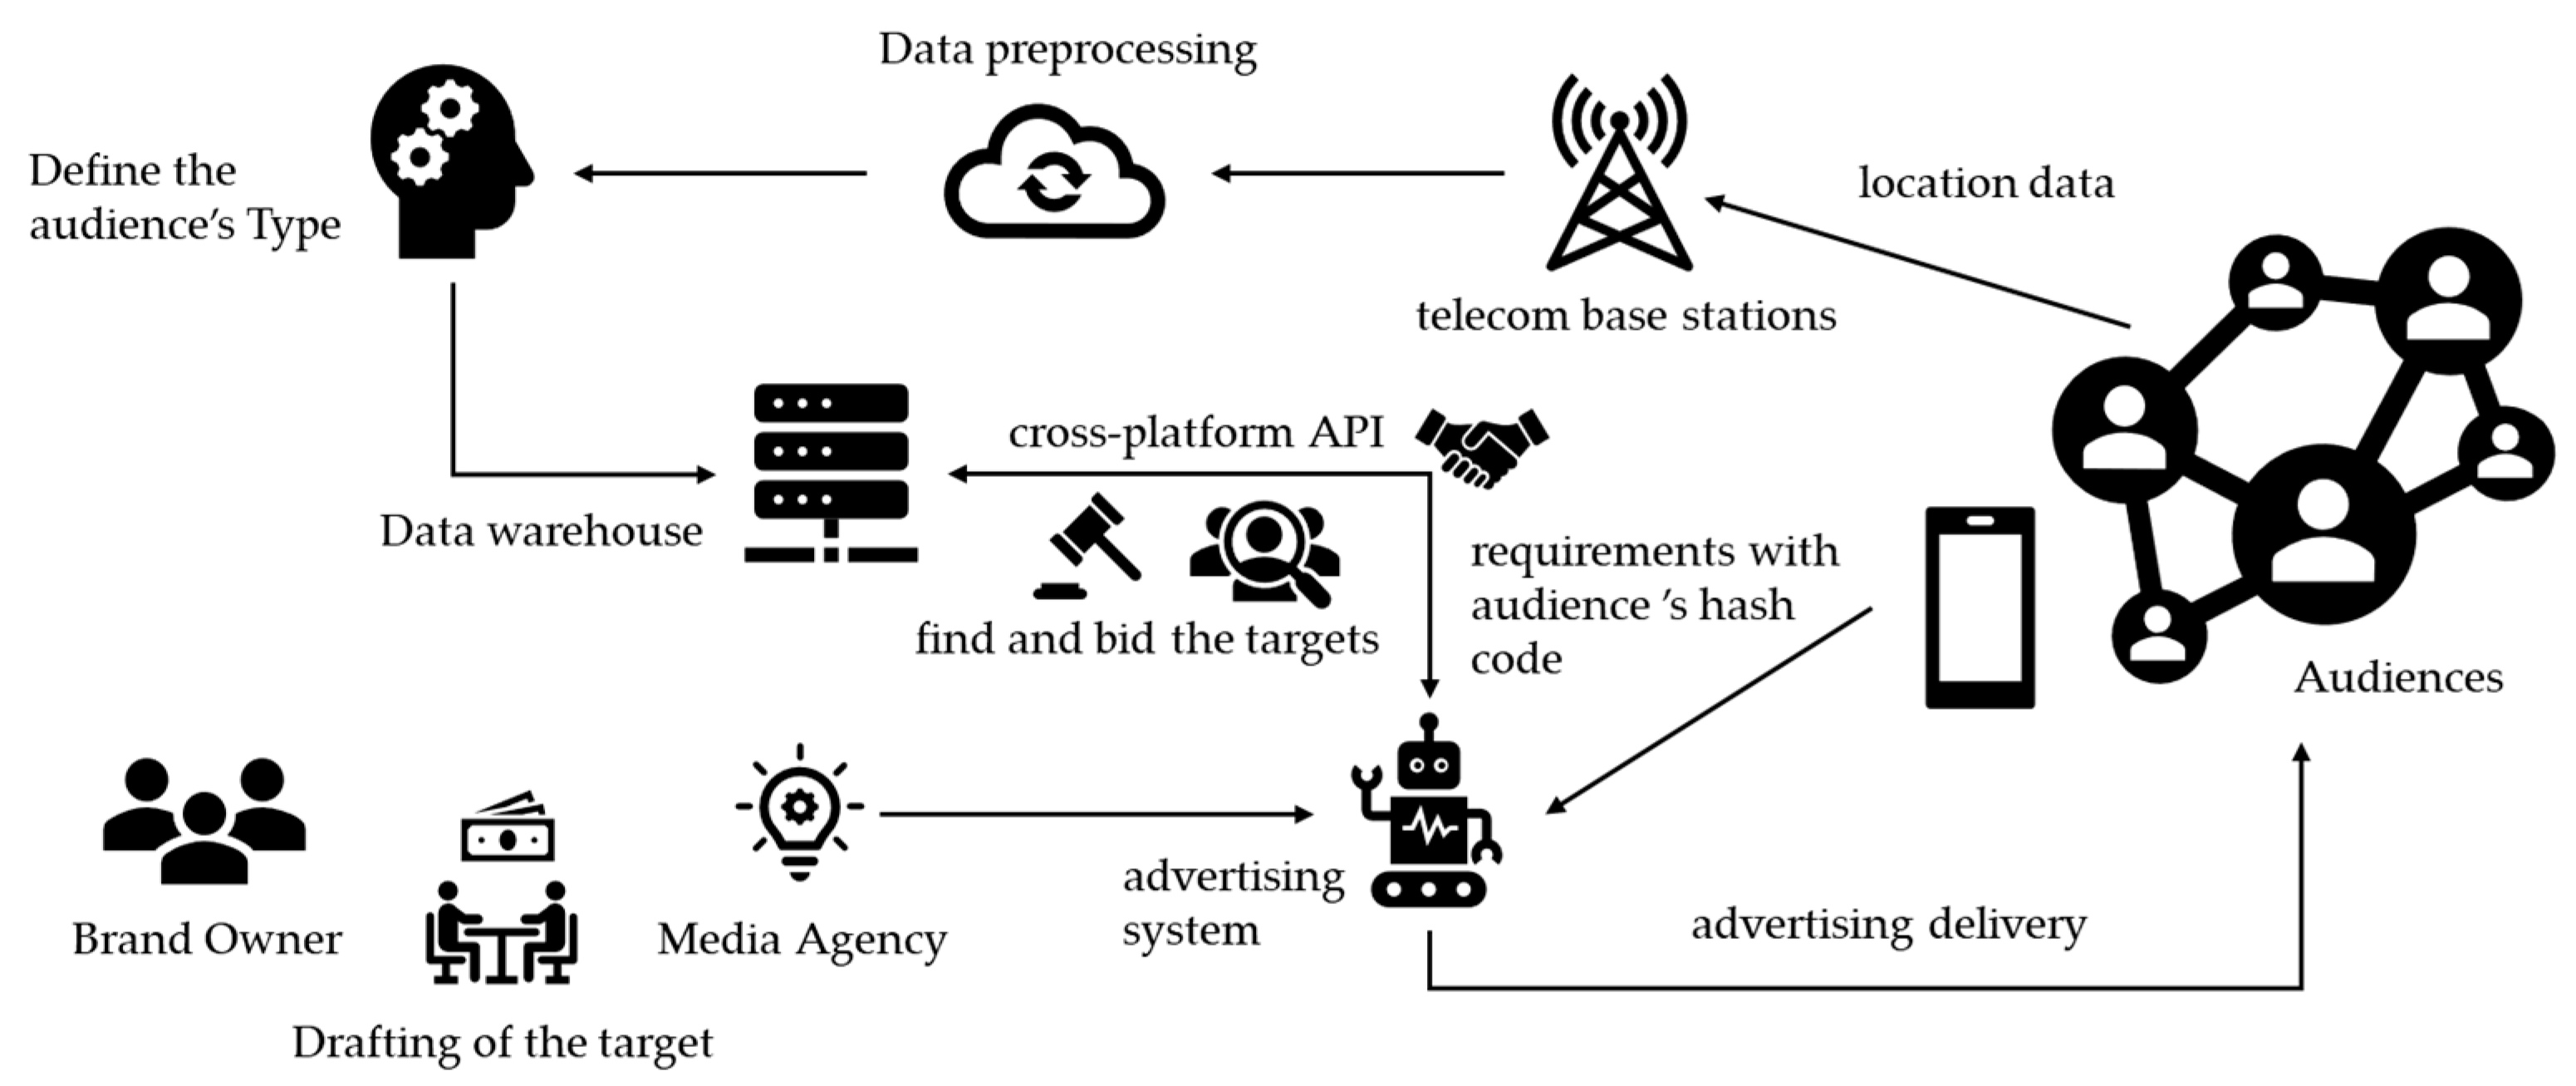
Currently, most advertising platforms on the market are based on traditional network advertising or mobile advertising. Each has its inherent mechanism for the operation of the advertising system. If you want to quickly integrate the time and location-based delivery mechanism mentioned in this study into the existing advertising platform on the market, it will also involve the issue of obtaining information and cooperation mechanism agreements with telecom operators. Hence, it’s best not to reconstruct and develop the advertising platform on the existing market. Maybe it can try to use a cross-platform API connection method to cooperate with another advertising system that focuses on time and location-based delivery and quickly integrate the mechanism into the market for use (as depicted in Figure 6).
If you want to cooperate across platforms, the first thing you have to deal with is user privacy. The processing of privacy rights is mainly to prevent any personal data of the user from being obtained. Therefore, the method used in the system to identify the user must be a set of codes that have nothing to do with the original personal data, and the user can be identified with such a set of user identification codes when advertising.
There may be two modes to deliver advertisements to the audience. First, place it through a telecom operator, and second, place it through an advertising platform.
For telecom operators, the audience basically has no privacy at all. Even if the audience is replaced with a new mobile phone device, the telecom operators can still use the mobile phone number to identify the audience. Therefore, the best way to accumulate the audience’s behavior data for user identification and advertising is through telecom operators. It will be the best solution among all feasible solutions, and the only possible problem is the degree of permission and tolerance of governments of various countries for this model.
If you want to through the advertising platform to deliver, the first thing to solve is the identification of mobile devices. Telecom base stations only need to use the SIM card to distinguish mobile phone devices. Still, for advertising platform providers, if they want to identify mobile phone devices, they can only identify users through the standards provided by the mobile phone operating system. If there is no way to find a common form of identification and communication between these two mechanisms, the cooperation may only be with telecom operators.
The main problem is that mobile phone operating system vendors are also based on the protection of user privacy, so there are many restrictions on the underlying mobile phone information that software developers can obtain. With the market changes of the times, various privacy policies or the user identification method provided are also constantly changing. Whether a feasible solution can be found or not can only be decided based on the actual market conditions.
Since the core purpose of this research is not to discuss the above issues, we only present here the actual situation and the focus of the problem to organize and deal with the conceptual explanation. As for the real feasible solution, the relative necessary adjustments must be made under the system architecture.
6. Conclusions and Future Work
6.1. Research Contribution
Through the research and analysis of various cases and the trial evaluation of advertising effectiveness, we can find that the application of 5G technology can indeed fill the current advertising market gap and provide a time and location-based audience exposure evaluation tool. There are three main contributions of this research:
- This research has sorted out the needs of business application scenarios in various markets and specifically explained the customer groups that different application scenarios hope to target and the difficulties encountered.
- This study presents a generic 5G data collection and processing mode, demonstrating how to organize time and location data and implement it in advertising contextual applications.
- This study evaluated the possible benefits of various deployment scenarios in conjunction with the use of 5G data and discussed the practical problems and improvement directions that may be encountered in practical deployment.
- This study provides additional 5G footprint tracking technology applications by reference, including market research, urban transport, security, epidemic prevention, and other fields.
6.2. More Diversified Ways of Interaction
Here is a point worthy of further research in the future. Among the many features of 5G, there are two most worthy of use: near-end connection and large transmission volume [17,18,19]. Since instant communication between neighboring nodes can be implemented, as long as the cloud host can make a preliminary match and send the pairing to the node through the base station, the node can directly interact with each other and generate more interactive sparks. Even the interaction results can be sent back to the cloud host through the base station to do more analysis and calculations and continue to execute this process repeatedly to expand more interactive possible. The dating and matching part mentioned in the case study represent a demonstration of this type of use.
In addition, thanks to the characteristics of large transmission volume, advertisements can be executed together with 3D models that require a large amount of data. It also means that multiple people in front of the same screen or holographic projection at each node in the field are likely to interact together. In the 5G advertising interaction model, if you can make full use of this interactive method to cooperate the time and location-based advertising platform, then its development will be unlimited, which can shorten the time and space constraints and let the audiences from neighboring nodes create fun together.
6.3. Cooperation and Negotiation with Telecom Operators
It is undoubtedly an excellent way to locate users through 5G, but how to carry out cooperation and profit distribution is another issue that is both practical and yet to be discussed. Since it is impossible for telecom operators to provide user positioning information for free, besides rental fees even discussing profit splitting or intermediary rental bargaining has become an interesting issue.
For the advertising platform, the more telecom base station data, the more accurate the analysis and utilization will be. Of course, more base stations have to be rented, so the cost of obtaining audience location information will be higher. However, if the number of leased base stations is not enough, the data will be analyzed and the accuracy and the range of services provided will be limited. The advantage of renting is that it needn’t invest a large amount of capital in the initial stage to collect audiences’ geographic data and adjust the number of base stations rented according to the effectiveness anytime. If the business can obtain huge profits from it in the future, the renting cost also may not necessarily increase.
To respond to government policies, telecom operators must invest a large amount of capital for base station construction in the early stage. After the completion of the construction, apart from being unable to directly recover a large amount of money invested in a short time, they must also pay regular maintenance fees to ensure the smooth operation of the base station system.
For other operators who are willing to lease equipment, telecom operators will certainly be happy to cooperate. However, whether the two sides can profit or at least break even, it still relies on business negotiations or the mutual running-in to decide. Due to the huge investment cost and the fact that it is difficult to estimate the partner’s profit, it will be more difficult for telecom operators to decide on the rental fee.
Another critical reason for cooperating with telecom companies is that they have an important influence in dominating the market. All communication software and hardware will be replaced and updated with the progress of the times, whether it is the communication protocol or the service used in the user’s mobile phone. Even if a user may be unwilling to update the software and hardware of the mobile phone due to cost considerations or other factors, it will eventually be forced to update due to the replacement of the telecom company’s system.
Telecom companies will also continue to provide various transitional technical solutions during the transitional period of technology replacement through online updates or technology compatibility. Thus, some old-style communication equipment can continue to operate, and it is why other companies cannot easily enter the communication service market and only telecom companies can stabilize the communication operations in these markets. That is also the value of the existence of telecom companies.
6.4. Use in Market Surveys and Urban Traffic
The data received through the 5G base station can not only be used for advertising. Through collating information, we can accurately count the location information of each citizen at a particular time. In addition to advertising, there are two other important uses of such data: market surveys and urban traffic.
In the past, if a regional city survey was to be done, it was necessary to use city survey personnel to conduct a survey of the passerby in a specific location. It is not only extremely labor-intensive, and the results of the sample survey are not very accurate. At most, it can only be determined that the user has passed through a specific location. Still, it is impossible to determine its true movement purpose or living area, let alone obtain its frequency of occurrence or other background information.
However, if the data obtained by 5G base stations is used for analysis, all of this will become much simpler. Investigation agencies no longer need to ask investigators to intercept passersby. As long as they obtain time and location information from all base stations, they can determine whether the user is suitable for the subject of investigation.
After cooperating with other third-party data, they can even take further information about the audience’s description, such as the background appearance, proportion statistics, or similar audiences in the area. In other words, the market competition of market research companies will also face brand-new changes and impacts due to the use of 5G base station data.
In the same way, 5G base station data is also beneficial for planning urban traffic and transportation [20]. In the past, due to the limitations of objective conditions such as mobile devices and positioning technology, when the government wanted to plan urban or national transportation routes it often could only use human resources surveys or refer to some telecom data for evaluation.
With the popularization of mobile devices and the evolution of 5G technology, it has become possible to obtain citizens’ time and location information quickly. For governments of various countries, by directly analyzing such data, they can know how many mobile people there are in each city at each time. And even further, through real-time changes in the number of moving paths, they can dynamically adjust urban traffic flow or accommodate transportation schedules according to the transportation volume.
Governments also can use traffic movement data as the standard for open business routes, and taxi or self-driving car operators can also plan more effective market pricing strategies or vehicle scheduling arrangements based on such data.
6.5. Prevention of Accidents and the Spread of Epidemics
If the tracking technology based on time and location can be developed into security-related applications, it is believed that governments and private enterprises will also be very interested. The faster and more real-time features of 5G will also bring more safety to the lives of citizens. The following explains how some 5G footprint tracking technologies are applied in security-related fields.
For governments of all countries, maintaining urban traffic is a critical matter [21], and road repairs are also the most frequently complained item by citizens or questioned by parliamentarians. There are many roads in a city, and it is pretty expensive to do a road condition survey on each road. If governments wait for road conditions to cause problems before repairing, it will often cause citizens to complain and significantly impact citizens’ traffic safety. However, if governments choose to repair regularly, it is not appropriate to formulate a fixed repair cycle due to the different usage conditions of each road. If the cycle is set too long, traffic safety issues will be generated. If the cycle is set too short, it may be questioned. If there is no more useful data to prove it, this will always be a puzzle. However, if it is through the vehicle trajectory data, we can clearly see each road’s passing status. Not only does it not need to spend much budget to conduct a road condition survey, but it can also dynamically formulate the repair cycle of each road in real-time and accurately and reduce various possible disputes.
For private enterprises, security issues are always the most business opportunities [22,23]. If we take an apartment complex as an example, several common safety issues are related to real-time footprint tracking. Take an unruly visitor as an example. When he moves in the building, his real-time movement trajectory may differ from the typical movement trajectory. Through systematized automatic alarms, security personnel can reach the scene more quickly to support. Alternatively, take a resident who intends to commit suicide as an example. When a resident moves to the roof of the building abnormally, if the movement trajectory can be automatically linked with the access control system, there is a chance to lock the door at the last minute and avoid tragedy. In addition, with the advent of an aging society, the care of dementia in the elderly and location tracking may also become the new normal in a community. It seems that only the real-time footprint tracking technology of 5G can successfully complete these protective applications with urgent time requirements for the time being.
The current COVID-19 epidemic has spread throughout the world and has caused countless deaths. If 5G footprint tracking technology can be used to alert more quickly and list those who need to be quarantined, this will be the best demonstration to use technology to protect the lives of whole peoples. At present, when a confirmed person is found, an epidemic investigation is often carried out. Once the number of confirmed cases is too large, the need for an epidemic investigation will paralyze all human resources. If the epidemic investigation is not carried out or the speed of the epidemic investigation is too slow, it will cause the epidemic to become more difficult to control. The slow speed referred to here means more than one day. Since the epidemic is growing exponentially, even if it is only a short day, the impact on the spread is still considerable. When faced with hundreds of confirmed cases a day, the limited staffing of a country cannot complete the epidemic investigation work in time. In addition, due to personal privacy, the results of the epidemic investigation may often be concealed, which will represent a significant epidemic prevention breach for the entire epidemic prevention operation. If the survey work can be changed to 5G footprint tracking technology [24], besides saving a massive workforce, it will also be of great help to the accuracy of the collected footprints and the immediacy of notifying the listed people. We believe that such technological application will also be an essential tool for us to defeat the virus, and it is also left to everyone as a reference for the follow-up development direction of this research.
Author Contributions
Writing—review and editing, W.-M.C.; supervision, S.-M.W. All authors have read and agreed to the published version of the manuscript.
Funding
This research received no external funding.
Institutional Review Board Statement
Not applicable.
Informed Consent Statement
Not applicable.
Data Availability Statement
Data sharing not applicable.
Conflicts of Interest
The authors declare no conflict of interest.
References
- de Blasio, G.S.; Rodriguez-Rodriguez, J.C.; Garcia, C.R.; Quesada-Arencibia, A. Beacon-Related Parameters of Bluetooth Low Energy: Development of a Semi-Automatic System to Study Their Impact on Indoor Positioning Systems. Sensors 2019, 19, 3087. [Google Scholar] [CrossRef] [PubMed] [Green Version]
- Hosseini, K.S.; Azaddel, M.H.; Nourian, M.A.; Azirani, A.A. Improving Multi-floor WiFi-based Indoor positioning systems by Fingerprint grouping. In Proceedings of the 2021 5th International Conference on Internet of Things and Applications (IoT), IEEE, Isfahan, Iran, 19–20 May 2021; pp. 1–6. [Google Scholar]
- Kanakaraja, P. IoT Enabled BLE and LoRa based Indoor Localization without GPS. Turk. J. Comput. Math. Educ. 2021, 12, 1637–1651. [Google Scholar]
- Shaaban, R.; Faruque, S. An enhanced indoor visible light communication physical-layer security scheme for 5G networks: Survey, security challenges, and channel analysis secrecy performance. Int. J. Commun. Syst. 2021, 34. [Google Scholar] [CrossRef]
- Geetha, B.T.; Vidhya, B.; Pushpalatha, K.; Priyadharshini, M. A comparitive study of 5G technology with other generations of mobile technologies. In Proceedings of the 2017 IEEE International Conference on Power Control, Signals and Instrumentation Engineering (ICPCSI), IEEE, Chennai, India, 21–22 September 2017; pp. 1778–1782. [Google Scholar]
- Duan, X.; Liu, Y.; Wang, X. SDN Enabled 5G-VANET: Adaptive Vehicle Clustering and Beamformed Transmission for Aggregated Traffic. IEEE Commun. Mag. 2017, 55, 120–127. [Google Scholar] [CrossRef]
- Hans, C.Y.; Quer, G.; Rao, R.R. In Wireless SDN mobile ad hoc network: From theory to practice. In Proceedings of the 2017 IEEE International Conference on Communications (ICC), IEEE, Paris, France, 21–25 May 2017; pp. 1–7. [Google Scholar]
- Hussein, H.H.; Elsayed, H.A.; El-Kader, S.A. Intensive Benchmarking of D2D communication over 5G cellular networks: Prototype, integrated features, challenges, and main applications. Wirel. Netw. 2019, 26, 3183–3202. [Google Scholar] [CrossRef]
- Harishankar, M.; Tague, P.; Joe-Wong, C. Network Slicing as an Ad-Hoc Service: Opportunities and Challenges in Enabling User-Driven Resource Management in 5G; Vanderbilt University: Nashville, TN, USA, 2018. [Google Scholar]
- Khan, S.K.; Naseem, U.; Sattar, A.; Waheed, N.; Mir, A.; Qazi, A.; Ismail, M. UAV-aided 5G Network in Suburban, Urban, Dense Urban, and High-rise Urban Environments. In Proceedings of the 2020 IEEE 19th International Symposium on Network Computing and Applications (NCA), IEEE, Cambridge, MA, USA, 24–27 November 2020; pp. 1–4. [Google Scholar]
- Hou, J.; Li, B. The Evolutionary Game for Collaborative Innovation of the IoT Industry under Government Leadership in China: An IoT Infrastructure Perspective. Sustainability 2020, 12, 3648. [Google Scholar] [CrossRef]
- Lehr, W.; Queder, F.; Haucap, J. 5G: A new future for Mobile Network Operators, or not? Telecommun. Policy 2021, 45, 102086. [Google Scholar] [CrossRef]
- Maman, M.; Strinati, E.C.; Dinh, L.N.; Haustein, T.; Keusgen, W.; Wittig, S.; Schmieder, M.; Barbarossa, S.; Merluzzi, M.; Costanzo, F. Beyond Private 5G Networks: Applications, Architectures, Operator Models and Technological Enablers. 4 May 2021; PREPRINT (Version 1) Available at Research Square. [Google Scholar] [CrossRef]
- Cheng, N.; Lyu, F.; Chen, J.; Xu, W.; Zhou, H.; Zhang, S.; Shen, X.S. Big Data Driven Vehicular Networks. IEEE Netw. 2018, 32, 160–167. [Google Scholar] [CrossRef] [Green Version]
- Din, S.; Paul, A.; Rehman, A. 5G-enabled Hierarchical architecture for software-defined intelligent transportation system. Comput. Netw. 2019, 150, 81–89. [Google Scholar] [CrossRef]
- Franco, D.; Aguado, M.; Toledo, N. An Adaptable Train-to-Ground Communication Architecture Based on the 5G Technological Enabler SDN. Electronics 2019, 8, 660. [Google Scholar] [CrossRef] [Green Version]
- Erol-Kantarci, M.; Sukhmani, S. Caching and Computing at the Edge for Mobile Augmented Reality and Virtual Reality (AR/VR) in 5G. Ad Hoc Netw. 2018, 223, 169–177. [Google Scholar] [CrossRef]
- Madduru, P. Artificial Intelligence as A Service in Distributed Multi Access Edge Computing On 5g Extracting Data Using IOT And Including AR/VR For Real-Time Reporting. Inf. Technol. Ind. 2021, 9, 912–931. [Google Scholar] [CrossRef]
- Rychkov, E.; Pirogov, Y.A. The 5G Communication System Algorithms Modelling for the Usage in Robotics and Internet of Things. Inf. Innov. Technol. 2018, 1, 406–414. [Google Scholar]
- Zhang, D.; Liu, L.; Xie, C.; Yang, B.; Liu, Q. Citywide Cellular Traffic Prediction Based on a Hybrid Spatiotemporal Network. Algorithms 2020, 13, 20. [Google Scholar] [CrossRef] [Green Version]
- Ochoa-Ruiz, G.; Angulo-Murillo, A.A.; Ochoa-Zezzatti, A.; Aguilar-Lobo, L.M.; Vega-Fernández, J.A.; Natraj, S. An Asphalt Damage Dataset and Detection System Based on RetinaNet for Road Conditions Assessment. Appl. Sci. 2020, 10, 3974. [Google Scholar] [CrossRef]
- Khan, S.S.; Sooriyakumaran, T.; Rich, K.; Spasojevic, S.; Ye, B.; Newman, K.; Iaboni, A.; Mihailidis, A. Tracking agitation in people living with dementia in a care environment. arXiv 2021, arXiv:2104.09305. [Google Scholar]
- Pegoraro, J.; Rossi, M. Real-Time People Tracking and Identification from Sparse mm-Wave Radar Point-Clouds. IEEE Access 2021, 9, 78504–78520. [Google Scholar] [CrossRef]
- Alawad, H.; Kaewunruen, S. 5G Intelligence Underpinning Railway Safety in the COVID-19 Era. Front. Built Environ. 2021, 7, 14. [Google Scholar] [CrossRef]
Figure 1.
Audience feature in Case 1.

Figure 2.
Audience feature in Case 2.

Figure 3.
Audience feature in Case 3.

Figure 4.
Audience feature in Case 4.

Figure 5.
Audience feature in Case 5.

Figure 6.
System scope in the study.


Table 1.
Common time and location filtering conditions.
| Screening Conditions | |||||
|---|---|---|---|---|---|
| Time | Location | Time + Location | |||
| Type | Length | Type | Number | Frequency | Screening Requirements |
| Holiday Weekday Monday Tuesday Wednesday Thursday Friday Saturday Sunday (Specified date) (Now) (Unlimited) | Longer than Shorter than Longer than average Shorter than average (Unlimited) | Traffic station MRT station Special place (Unlimited) | More than n footprints Less than n footprintsThere are more than n footprints in a fixed time interval There are fewer than n footprints in a fixed time interval Number of footprints is higher than average Number of footprints is lower than average (Unlimited) | More than n times Less than n times Occurs more than n times in a fixed time interval Occurs less than n times in a fixed time interval More than average occurrences Less than average occurrences (Unlimited) | Those who stay in an area more than a period Those who travel from company to home more than a period Those who are not far from a place for a period Those who with different commuting routes Those who don’t go home every day Those who go out in the morning Those who go out at night |
Table 2.
Comparison of audience data collection methods.
| Return Method | Timeliness | Delivery Method | |
|---|---|---|---|
| In the Past | Reported by the audience | Non-real time location | Send via APP (SDK required) |
| Through 5G | Obtained by a neighboring base station | Real-time location | Send via Phone (base station required) |
Table 3.
Audience geographic information provided by the base station.
| Audience Number | Site Number | Appearance Time |
|---|---|---|
| Person01 | Station 01 | 1 May 2021 12:23:57 |
| Person02 | Station 01 | 1 May 2021 12:25:10 |
| Person01 | Station 02 | 1 May 2021 12:32:44 |
| Person03 | Station 02 | 1 May 2021 12:34:37 |
| Person03 | Station 03 | 1 May 2021 12:48:54 |
| Person02 | Station 04 | 1 May 2021 12:50:15 |
| Person04 | Station 01 | 1 May 2021 12:59:28 |
Table 4.
Specific audience data.
| Audience Number | Site Number | Appearance Time |
|---|---|---|
| Person01 | Station 01 | 20 April 2021 07:58:12 |
| Person01 | Station 01 | 20 April 2021 08:02:43 |
| Person01 | Station 01 | 20 April 2021 08:15:25 |
| Person01 | Station 01 | 20 April 2021 09:23:06 |
| Person01 | Station 02 | 20 April 2021 08:32:45 |
| Person01 | Station 02 | 20 April 2021 08:39:57 |
| Person01 | Station 02 | 20 April 2021 08:43:53 |
| Person01 | Station 03 | 20 April 2021 08:59:22 |
| Person01 | Station 03 | 20 April 2021 09:01:17 |
Table 5.
Specific audience data after unified time.
| Audience Number | Site Number | Appearance Time |
|---|---|---|
| Person01 | Station 01 | 20 April 2021 08:00:00 |
| Person01 | Station 02 | 20 April 2021 08:30:00 |
| Person01 | Station 03 | 20 April 2021 09:00:00 |
| Person01 | Station 05 | 20 April 2021 09:15:00 |
| Person01 | Station 08 | 20 April 2021 12:00:00 |
| Person01 | Station 05 | 20 April 2021 13:00:00 |
| Person01 | Station 03 | 20 April 2021 19:00:00 |
| Person01 | Station 02 | 20 April 2021 19:30:00 |
| Person01 | Station 01 | 20 April 2021 20:00:00 |
Table 6.
Advanced time characteristics of specific audience.
| Audience | Site Number | Date | Hour | Minute | Stay Time | Day | Holidays |
|---|---|---|---|---|---|---|---|
| Person01 | Station 01 | 20 April 2021 | 8 | 0 | 12.5 h | Tuesday | weekday |
| Person01 | Station 02 | 20 April 2021 | 8 | 30 | 0.5 h | Tuesday | weekday |
| Person01 | Station 03 | 20 April 2021 | 9 | 0 | 0.25 h | Tuesday | weekday |
| Person01 | Station 05 | 20 April 2021 | 9 | 15 | 2.75 h | Tuesday | weekday |
| Person01 | Station 08 | 20 April 2021 | 12 | 0 | 1 h | Tuesday | weekday |
| Person01 | Station 05 | 20 April 2021 | 13 | 0 | 6 h | Tuesday | weekday |
| Person01 | Station 03 | 20 April 2021 | 19 | 0 | 0.5 h | Tuesday | weekday |
| Person01 | Station 02 | 20 April 2021 | 19 | 30 | 0.5 h | Tuesday | weekday |
| Person01 | Station 01 | 20 April 2021 | 20 | 0 | 12.5 h | Tuesday | weekday |
Table 7.
Audience’s time and location frequency data.
| Audience | Date | Site Number | Avg Number of Appearances | Average Stay Time | Earliest Appearance | Latest Appearance |
|---|---|---|---|---|---|---|
| Person01 | 20 April 2021 | Station 01 | 2 | 12.5 h | 8:00 | 18:00 |
| Person01 | 20 April 2021 | Station 02 | 30 | 0.5 h | 8:15 | 18:15 |
| Person01 | 20 April 2021 | Station 03 | 2 | 0.25 h | 8:45 | 18:45 |
| Person01 | 20 April 2021 | Station 05 | 15 | 6.75 h | 9:15 | 17:45 |
| Person01 | 20 April 2021 | Station 08 | 28 | 10 h | 8:00 | 21:00 |
| Person02 | 20 April 2021 | Station 03 | 2 | 0.5 h | 8:00 | 18:00 |
| Person02 | 20 April 2021 | Station 06 | 2 | 0.5 h | 8:30 | 18:30 |
| Person02 | 20 April 2021 | Station 07 | 30 | 0.25 h | 19:30 | 19:45 |
| Person02 | 20 April 2021 | Station 09 | 24 | 12.5 h | 7:00 | 20:00 |
Table 8.
Audience’s home and company locations and commuting schedule information.
| Audience | Home Site | Company Site | Commuting Time | Time to Go Out | Time to Go Home |
|---|---|---|---|---|---|
| Person01 | Station 01 | Station 05 | 1.5 h | 8:15 | 19:00 |
| Person02 | Station 02 | Station 07 | 0.5 h | 8:00 | 18:45 |
| Person03 | Station 06 | Station 03 | 1.25 h | 7:45 | 18:30 |
| Person04 | Station 04 | Station 05 | 0.75 h | 9:15 | 19:45 |
| Person05 | Station 07 | Station 02 | 1 h | 8:30 | 22:30 |
| Person06 | Station 03 | Station 09 | 0.5 h | 7:30 | 17:45 |
| Person07 | Station 08 | Station 01 | 0.25 h | 8:45 | 19:15 |
| Person08 | Station 04 | Station 02 | 0.5 h | 9:00 | 20:45 |
| Person09 | Station 09 | Station 07 | 1 h | 9:30 | 20:15 |
Table 9.
Audiences’ daily mobile-related data.
| Audience | Date | Total Number of Places Visited | Average Stay Time | Average Travel Time | Average Travel Distance |
|---|---|---|---|---|---|
| Person01 | 20 April 2021 | 6 | 2.5 h | 0.25 h | 2 km |
| Person01 | 21 April 2021 | 2 | 0.5 h | 0.5 h | 5 km |
| Person01 | 22 April 2021 | 5 | 0.25 h | 0.25 h | 3 km |
| Person01 | 23 April 2021 | 7 | 2.75 h | 0.75 h | 2 km |
| Person01 | 24 April 2021 | 4 | 1 h | 0.25 h | 7 km |
| Person02 | 20 April 2021 | 3 | 0.25 h | 0.25 h | 2 km |
| Person02 | 21 April 2021 | 3 | 0.5 h | 0.25 h | 2 km |
| Person02 | 22 April 2021 | 3 | 1.5 h | 0.5 h | 2 km |
| Person02 | 23 April 2021 | 2 | 2.5 h | 0.25 h | 2.5 km |
| Person02 | 24 April 2021 | 3 | 1.5 h | 0.25 h | 2 km |
Table 10.
Audiences’ monthly mobile-related data.
| Audience | Month | Avg Number of Places Visited | Average Stay Time | Average Travel Time | Average Travel Distance |
|---|---|---|---|---|---|
| Person01 | April 2020 | 24 | 2.5 h | 0.25 h | 12 km |
| Person01 | May 2020 | 32 | 2.75 h | 0.5 h | 15 km |
| Person01 | June 2020 | 51 | 3.5 h | 0.25 h | 13 km |
| Person01 | July 2020 | 27 | 2.75 h | 0.75 h | 12 km |
| Person01 | August 2020 | 42 | 3.75 h | 0.25 h | 17 km |
| Person01 | September 2020 | 37 | 2.25 h | 0.25 h | 12 km |
| Person02 | April 2020 | 3 | 0.5 h | 0.25 h | 2 km |
| Person02 | May 2020 | 2 | 1.5 h | 1.25 h | 2.5 km |
| Person02 | June 2020 | 3 | 0.5 h | 0.25 h | 2 km |
| Person02 | July 2020 | 2 | 1.5 h | 1.25 h | 2.5 km |
| Person02 | August 2020 | 3 | 0.5 h | 0.25 h | 2 km |
| Person02 | September 2020 | 3 | 0.5 h | 0.25 h | 2 km |
Table 11.
All referenceable attributes of the audience.
| Audience | attr1 | attr2 | attr3 | attrN | |
|---|---|---|---|---|---|
| Person01 | A | A | C | … | A |
| Person02 | B | C | B | … | B |
| Person03 | A | B | B | … | B |
| Person04 | C | A | C | … | A |
| Person05 | B | B | B | … | B |
| Person06 | B | A | C | … | B |
| Person07 | A | C | B | … | A |
| Person08 | E | B | B | … | E |
| Person09 | D | A | A | … | B |
Table 12.
The audiences’ preference for different advertising items.
| Person01 | Person02 | Person03 | Person04 | Person_N | |
|---|---|---|---|---|---|
| AD01 | 1 | 4 | |||
| AD02 | 2 | 3 | 1 | 3 | |
| AD03 | 1 | 1 | 1 | ||
| AD04 | 3 | 1 | |||
| AD05 | 5 | 4 | 5 | ||
| AD06 | 3 | 4 | 2 | 4 | |
| AD07 | 1 | ||||
| AD08 | 1 | 8 | 7 | 1 | 9 |
| AD09 | 1 | 1 | |||
| AD_N | 5 | 6 | ? |
Table 13.
Regression analysis using various attributes of all audiences and advertising preference results.
Table 13.
Regression analysis using various attributes of all audiences and advertising preference results.
| Audience | attr1 | attr2 | attr3 | attrN | AD01 | … | AD_N | |
|---|---|---|---|---|---|---|---|---|
| Person01 | 2 | 3 | 4 | … | 3 | 1 | … | … |
| Person02 | 1 | 2 | 8 | … | 1 | 0 | ... | ... |
| Person03 | 1 | 0 | 6 | … | 3 | 2 | … | … |
| Person04 | 6 | 4 | 2 | … | 2 | 4 | … | … |
| Person05 | 2 | 3 | 3 | … | 5 | 6 | … | … |
| Person06 | 3 | 9 | 3 | … | 8 | 1 | … | … |
| Person07 | 5 | 7 | 5 | … | 4 | 2 | … | … |
| … | … | … | … | … | … | … | … | … |
| Person_N | … | … | … | … | … | … | … | … |
Table 14.
Regression coefficients of the influence of various attributes on advertising preference results.
Table 14.
Regression coefficients of the influence of various attributes on advertising preference results.
| AD Items | attr1 | attr2 | attrN | |
|---|---|---|---|---|
| AD01 | 0.35 | 2.25 | … | 0.16 |
| AD02 | 0.01 | 1.38 | … | 1.73 |
| AD03 | 0.12 | 0.01 | … | 0.69 |
| AD04 | 0.38 | 0.19 | … | 5.43 |
| AD05 | 0.02 | 0.56 | … | 0.98 |
| AD06 | 0.86 | 0.32 | … | 7.77 |
| AD07 | 0.23 | 2.19 | … | 0.25 |
| AD08 | 1.32 | 3.14 | … | 1.19 |
| AD09 | 0.11 | 0.38 | … | 1.41 |
Table 15.
Experimental background condition parameters.
| Through 5G | Through GPS | |
|---|---|---|
| Obtained limit | None | Users need to open the GPS function |
| Correctness | Absolutely correct, the user is at that location | Inferred data, the user may not be at the location |
| Source of information | Consistent, all obtained through telecom base stations | No consistency, it may be aggregated from multiple APP sources |
| Context of data acquisition | Available anytime, anywhere, without any data sampling bias | The data sampling may be biased, because most of the data are provided with special motives |
| Continuity of data acquisition | Data can be obtained continuously, and the data can be sorted into movement trajectory | The data cannot be obtained continuously, and there may be a huge gap between the obtained data and the inferred movement trajectory |
| Coverable audience ratio | All 100% audiences | About 10% of the audience |
Table 16.
Comparison of delivery effectiveness on school students.
| Data Source | Reach Rate | Accuracy | Delivery Result | Times |
|---|---|---|---|---|
| Through 5G | 100% | 80% | 80% | 8 |
| Through GPS | 10% | 100% | 10% |
Table 17.
Comparison of delivery effectiveness on night market tourists.
| Data Source | Reach Rate | Accuracy | Delivery Result | Times |
|---|---|---|---|---|
| Through 5G | 100% | 80% | 80% | 80 |
| Through GPS | 10% × 10% = 1% | 100% | 1% |
Table 18.
Comparison of delivery effectiveness on anniversary consumers near a specific business.
| Data Source | Reach Rate | Accuracy | Delivery Result | Times |
|---|---|---|---|---|
| Through 5G | 100% | 100% | 100% | 5 |
| Through GPS | Unique users about 20%, monthly | 100% | 20% |
Table 19.
Comparison of delivery effectiveness on single members’ street paired.
| Data Source | Reach Rate | Accuracy | Delivery Result | Times |
|---|---|---|---|---|
| Through 5G | 100% | 100% | 100% | 100 |
| Through GPS | 10% × 10% = 1% | 100% | 1% |
Table 20.
Comparison of delivery effectiveness on upcoming passers nearby outdoor media.
| Data Source | Reach Rate | Material | Delivery Result | Times |
|---|---|---|---|---|
| Through 5G | A: 50%, B: 50% | Random | 50% | Max: 4 |
| A: 80%, B: 20% | A | 80% | (80%/20%) | |
| A: 20%, B: 80% | B | 80% | ||
| Through GPS | A: 50%, B: 50% | Random | 50% | Avg: 1.6 |
| A: 80%, B: 20% | A | 80% | (80%/50%) | |
| A: 80%, B: 20% | B | 20% | ||
| A: 20%, B: 80% | A | 20% | Min: 1 | |
| A: 20%, B: 80% | B | 80% | (50%/50%) |
Table 21.
Comparison of delivery effectiveness on commuters traveling between specific two places.
| Data Source | Reach Rate | Accuracy | Delivery Result | Times |
|---|---|---|---|---|
| Through 5G | 100% | 100% | 100% | 100 or ∞ (the times is calculated as ∞ when a result is too small) |
| Through GPS | 100% | 10% | 10% | |
| 100% | 1% | 0% (too small) | ||
| 25% | 4% | 1% |
Publisher’s Note: MDPI stays neutral with regard to jurisdictional claims in published maps and institutional affiliations. |
© 2021 by the authors. Licensee MDPI, Basel, Switzerland. This article is an open access article distributed under the terms and conditions of the Creative Commons Attribution (CC BY) license (https://creativecommons.org/licenses/by/4.0/).
Share and Cite
MDPI and ACS Style
Cheng, W.-M.; Wang, S.-M. Research on the General Algorithm and Benefit of Real-Time Positioning Advertising System—Based on the Use of 5G Base Station Data. Future Internet 2021, 13, 187. https://0-doi-org.brum.beds.ac.uk/10.3390/fi13080187
AMA Style
Cheng W-M, Wang S-M. Research on the General Algorithm and Benefit of Real-Time Positioning Advertising System—Based on the Use of 5G Base Station Data. Future Internet. 2021; 13(8):187. https://0-doi-org.brum.beds.ac.uk/10.3390/fi13080187
Chicago/Turabian StyleCheng, Wei-Min, and Sheng-Ming Wang. 2021. "Research on the General Algorithm and Benefit of Real-Time Positioning Advertising System—Based on the Use of 5G Base Station Data" Future Internet 13, no. 8: 187. https://0-doi-org.brum.beds.ac.uk/10.3390/fi13080187
Note that from the first issue of 2016, this journal uses article numbers instead of page numbers. See further details here.