
Vision System Experimentation in Furniture Industrial Environment
by
Gurbaksh Bhullar
1, 
Simon Osborne
1,
María José Núñez Ariño
2,
Juan Del Agua Navarro
2 and
Fernando Gigante Valencia
2,* 1
Control 2K, Waterton Technology Centre, Waterton Industrial Estate, Bridgend CF31 3WT, UK
2
AIDIMME, Benjamin Franklin, 13 Parque Tecnológico, 46980 Paterna, Spain
*
Author to whom correspondence should be addressed.
Future Internet 2021, 13(8), 189; https://0-doi-org.brum.beds.ac.uk/10.3390/fi13080189
Submission received: 17 May 2021
/
Revised: 12 July 2021
/
Accepted: 12 July 2021
/
Published: 23 July 2021
(This article belongs to the Special Issue Human–Computer Interaction Models and Experiences for Internet of Things Systems and Edge Computing)
Abstract
:The integration of devices that support manufacturing activities and the interaction of workers with these devices in production plants, leads to potential benefits in the industrial environment. Problems, bottlenecks and improvement opportunities throughout production times need to be detected, analyzed and prioritized in order to select the most suitable solutions and address them properly. The integration of particular devices supports the manufacturing process and prevents the need for contingency planning; it also increases the quality of the produced goods, which leads to higher customer confidence and satisfaction. The scope of this article focuses on the development and experimentation of a vision system for the recognition of product components in order to support the classification of such items by the users working in a particular area of the production line. Even if the proposed solution presents a low level of human interaction and innovation, the objective of this paper is to demonstrate how the proposed classification system brings valuable benefits to the overall manufacturing process in a traditional furniture environment, with the inherent advantage that workers can perform this task in a more guided and riskless manner. The Overall Equipment Effectiveness (OEE) approach was adopted to measure the benefits of the solution, which are described in article.
1. Introduction
This paper focuses on the practical experimentation of a vision system deployed in a furniture industrial environment and how this deployment affects the performance of the tasks carried out by workers at a particular point of the production line. The vision system implemented brings benefits not only to the production performance but also to the quality of the work performed by the operators in charge of the classification process that becomes supported by the system. The presented implementation, a vision solution for the recognition of codes attached to pieces that are processed by an edge-banding machine, does not present a high level of human interaction and innovation, but the focus of this paper is more on how a ‘traditional’ production line adopts a particular system to improve its efficiency. The system interacts with the Enterprise Resource Planning (ERP) of the company in order to provide the workers with information about how to manage the pieces. This way, the classification process is sped up, becoming easier for the workers and reducing the risk of errors. The impact of this deployment is measured by performance indicators related to the overall effectiveness of the production process. A comprehensive context is provided in this article by describing the industrial experimentation environment and the solution deployed in the company LAGRAMA, a furniture producer located in Spain. The definition of three different scenarios (optimistic, basic and pessimistic) depicting conditions in the factory, based on real measurements, enabled the calculation of the effective impact of the solution on the traditional way of working in the company. After a review of the related literature, the applied methodology is explained, including some technical details about the deployed solutions. The experimentation in the industrial environment is described in order to later conclude the most relevant results of the experimentation, as well as particular remarks.
2. Literature Review
The automation of code recognition has become both a necessity and a challenge in industrial environments, considering the adverse conditions related to the orientation, illumination and quality of images that can be found. Computer vision algorithms can be implemented to read and decode these codes accurately and overcome these difficulties [1]. All these aspects are mainly focused on readability, which affects the interpretation of codes regardless of the industrial sector. Intensive studies and trials have been performed in order to reduce errors and improve reading time [2].
The placement of the scanning system is also critical, depending on the environment. For activities such as price calculation, handheld devices are considered an optimal approach, but in situations where the volume of information is high and readings should be rapidly taken, this is not a proper solution. The software that comes with the scanning system usually simulates the behavior of the handheld device, tracing lines through the laser beam in order to calculate the dimensions of the code to be scanned. In order to improve this mechanism and fix the noise problems that lead to poor quality for code recognition, a Hough transform approach can be adopted [3]. The software that supports code reading usually uses specific algorithms to improve the reading ability of the system.
The practical experience exposed in this paper assumes nearly constant values for the position, lighting, and distance of the scanning system during the management of the pieces within acceptable ranges for the interpretation of codes, so the manufacturer generally maintains regular conditions during the workflow. Furthermore, the hardware deployed for the implementation of the vision system is flexible enough to save any minor program changes in these parameters.
Vision systems are widely used in smart factories in the scope of Industry 4.0, where information from industrial equipment is collected. This allows a higher level of integration in the production environment, which, in turn, becomes more flexible. Relevant examples include production environments, where the identification technology involves local decoding software, enabling communication between the production line and the server, improving production efficiency and reducing errors [4].
In addition to QR codes and barcodes, a significant improvement for the identification of pieces is the use of smart labels containing embedded modules to enable communication via wireless and integration with sensors [5]. Thus, the practical experimentation covered in this paper considers the factory as a single production unit. The retrieval of piece information from an ERP system is enough to obtain the status of the piece and its track, providing full traceability throughout the factory. Furthermore, for several reasons, barcode technology is adopted instead of Radio Frequency IDentification (RFID). RFID is a wireless communication technology that allows capturing data that may be linked to identification attributes (i.e., serial number, position, color, date) of items carrying labels. Its use is increasing, and its performance is being refined [6]. However, in the production environment, which is the focus of this experiment, the use of barcodes is preferred as the RFID technology may present problems with the metal rollers of the edge-banding machine. The shift of the resonance frequency and the use of metallic objects in RFID applications often degrade the efficiency and readable range of the tag antennas. To overcome these problems, researchers have proposed different approaches [7]. However, many of the standard solutions currently available do not guarantee compatibility with this type of environment. Furthermore, the resistance and durability of the barcode labels are higher than the RFID, and its deployment, considering that this is the current implementation in the selected factory, is less costly.
Measuring the impact through the Overall Equipment Effectiveness (OEE) approach has been adopted by previous research [8]. Furthermore, this has been targeted at companies in the furniture industry [9]. Instead of applying different improvements at the same time, the present experimentation is focused on the velocity parameter in the OEE, while the rest of the parameters remain constant.
The described experimentation compares a traditional approach for the recognition of pieces to a detailed extraction of results, focusing on the impact of the vision system display for workers’ instructions. The OEE approach provides a reliable mechanism to measure this impact.
3. Applied Methodology
In order to get a reliable and comprehensive vision of the components and mechanisms put in place to improve the performance in the production plant, the solution for Factory Connectivity and the deployment in the industrial premises are described in the following subsections.
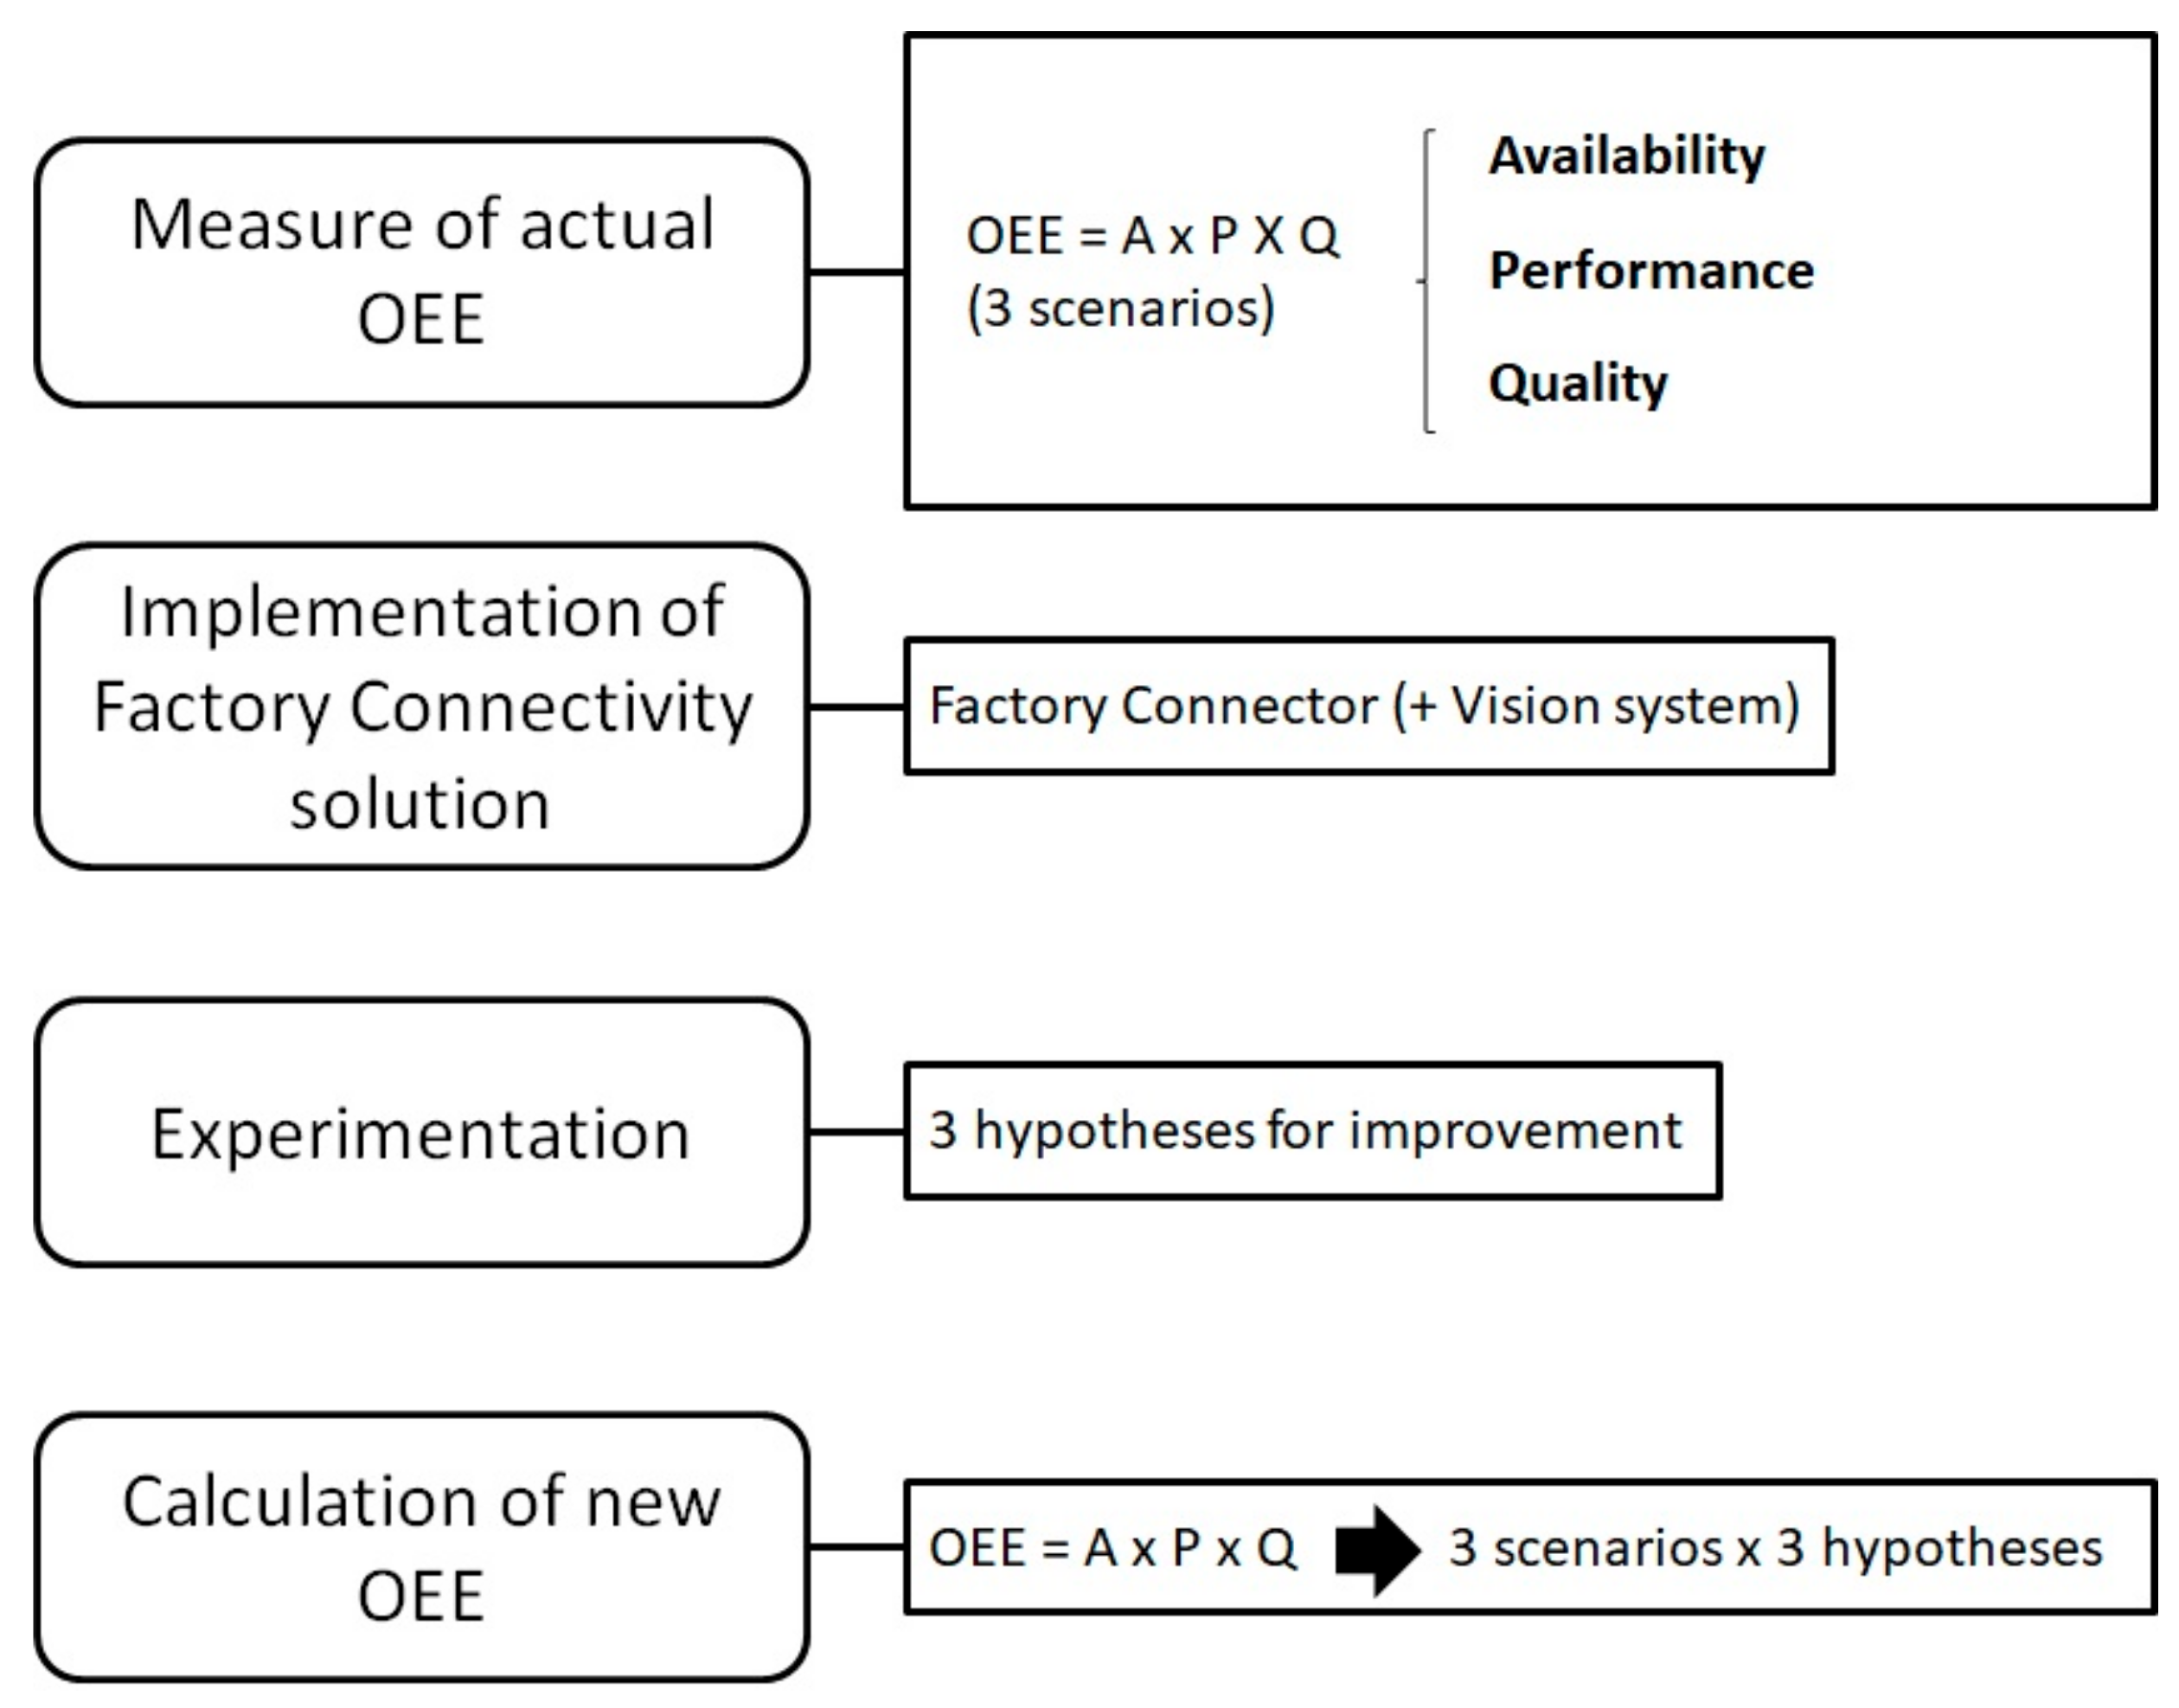
As a general overview, the steps involved in the research are shown in Figure 1. Firstly, the Overall Equipment Effectiveness (OEE) indicator in the machine considered in the experimentation has been measured before deploying the solution. Then, the Factory Connectivity solution has been implemented and tested. Finally, once the solution has been deployed, the new OEE value has been calculated.
This situation is measured in this experimentation by the OEE manufacturing KPI [10]. This indicator, usually used in companies with Lean Manufacturing methodology implanted, measures the use of equipment by the composition of three basic indicators: availability, performance and quality.
The availability is quantified as the time available for the machine to work respect the planned time:
The performance is strongly related to the speed of the process. This can be affected by some non-productive tasks (i.e., the classification activities carried out around the bending machine area):
Finally, the quality depends on the number of right and wrong pieces that the process is able to manufacture:
Traditionally, the OEE indicator decreases because of the following 6 parameters that affect the measurement of its value in the industrial environment [11]:
- the equipment failure/breakdown losses;
- the set-up time;
- the idling and minor stops;
- the reduced speed;
- the reduced yield;
- the quality defects.
The losses of the list above decrease the Availability, Performance, and Quality of the machine, and therefore OEE value.
Automating the calculations of the OEE indicator becomes difficult in the scope of SMEs [12]. Manufacturing Execution Systems (MES) generally allow companies to obtain a machine’s OEE, however in the presented experimentation the manufacturer does not manage a MES system that supports the automatic acquisition of this information. Therefore, in order to obtain an accurate OEE estimation for the edge banding machine in LAGRAMA, several scenarios have been defined, with the support of the operational manager of the company. The possible types of waste have been evaluated and those related to the focus of this research have been fully considered. Through this methodology, the initial OEE value (based on different scenarios) has been calculated, as well as the corresponding impact on the OEE, according to the savings achieved from the experimentation.
The Edge Solution—that supports the vision camera system—is the main asset deployed in the factory environment. In order to provide a comprehensive technical overview of the solution, the Edge Factory Connector, as well as its deployment in the factory, are described below.
3.1. Edge Solution
The Edge Factory Connector enables the monitoring of real-time data in business processes to increase the machine efficiency. By measuring KPIs, a wide range of data and information can be derived from multiple systems, revealing opportunities for productivity and efficiency improvements.
As can be seen in Figure 2, the Industreweb 4.0™ Edge Factory Connector is mainly oriented to the collection of raw data from real-world applications, its conversion into clean and usable data, and finally, its presentation and dissemination. The collected data can be processed by other tools focused on areas such as analytics and machine learning, risk evaluation, or visualization and reporting.
The Factory Connector is a small industrial computer that runs the Industreweb 4.0™ IIOT Platform. This comprises two primary components which are described below, which interact with the manufacturing process:
3.1.1. Industreweb Collect™
This is a high-speed runtime logic engine that can communicate with a very diverse range of factory data sources including Programmable Logic Controllers (PLC), Computerized Numerical Control (CNC), and standard protocols such as Ethernet/IP, Message Queuing Telemetry Transport (MQTT) and Open Platform Communications Unified Architecture (OPC UA). The logic engine can then perform actions based on the programmed logic, such as publishing data to the IOT broker, saving to a database, triggering alerts or pushing data to a control system, such as a PLC. The value of this solution is its ability to link together any type of shop floor system and its flexibility to be programmed with rules to suit the production challenge.
3.1.2. Industreweb Global™
This is a Web Admin suite that allows Industreweb Collect™ to be configured, including an inbuilt version control system. It also contains a Dashboard editing framework and a web server, so that real-time data can be visualized in a web user interface (UI). Industreweb Global™ is based upon a Service-based architecture that includes a workflow engine and a Data API, to support data orchestration.
3.2. Deployment of the Vision System Solution
The deployment initially involved the Industreweb 4.0™ Edge Factory Connector, the camera and a PLC. To make it clear to the operator how to proceed with the current piece, the code attached to each piece is scanned with a barcode reader, which is connected to the Industreweb Collect™ Engine; this allows the Factory Connector to query the ERP in order to get the piece details back. These instructions are then displayed in a clear way to the operator on a screen next to the machine.
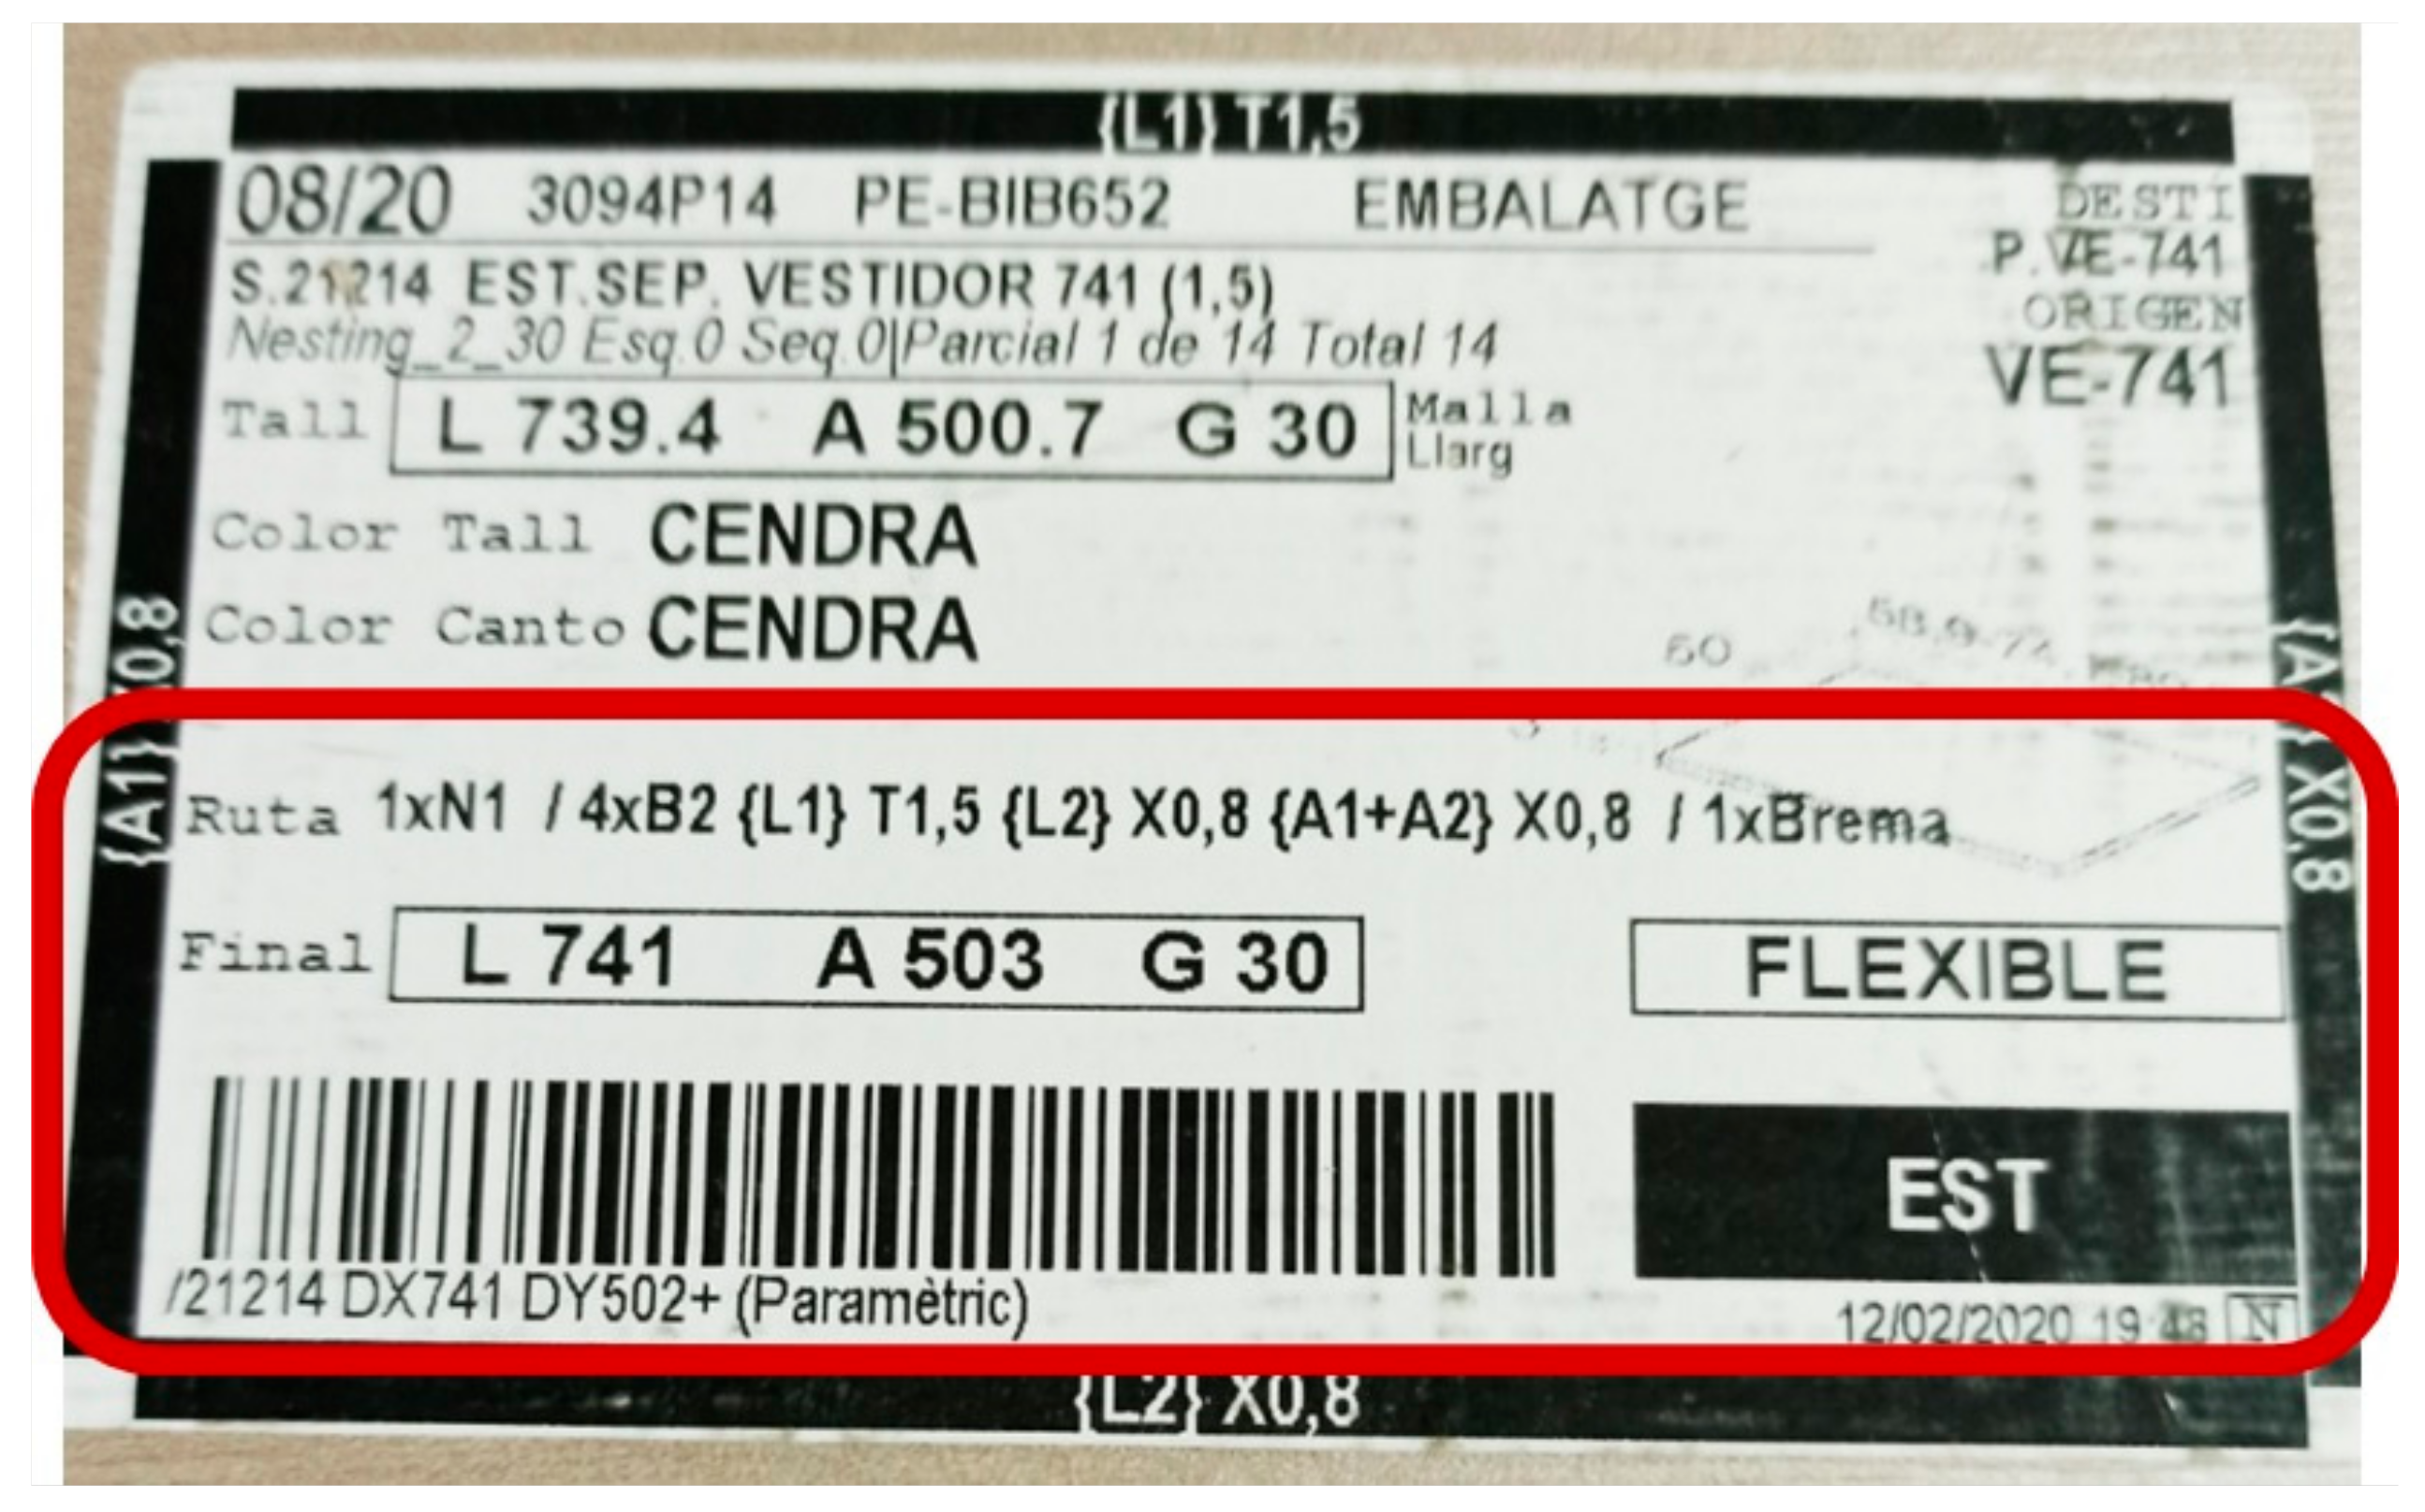
Barcodes are unique for each piece and they are represented in the Code 128 format [13]. Besides this, the text available in the label is also a unique identifier and it is used to get the information for the piece. As an example, the following four relevant parts of the code “CSF25203327P2” depicted in Figure 3 have been selected to provide an overview of how the pieces are identified:
- The prefix CSF in the ERP code represents that the piece above is a flexible standard piece but unique inside the current lot;
- The code 08/20 in the top left corner of the label represents the lot, and means week 8 of year 20;
- The codes 3094 and P14, which are on further to the previous one, represent the first and second part of an identifier used for that piece;
- Finally, the keyword Ruta represents the route that the piece traverses in the factory. For example, 1xN1 means one operation made in machine N1, while 4xB2 represents 4 operations which have been done in the machine B4, all of them performed in the same production line at LAGRAMA.
All the information about the piece can be fetched from the barcode by querying the database through the API of the ERP. Once the rig was configured, this was transferred to the manufacturer premises to connect the sensors placed in the machine, which then enabled a first connectivity testing with the EFPF Data Broker and tools. A bespoke electronic panel and cabinet, to host all the required devices and connections for the collection of sensor data in the industrial environment, were designed and built. The main components included in the cabinet included:
- Industreweb 4.0™ Edge Factory Connector: this is the Edge solution described above which enables the monitoring of real-time data;
- Programmable Logic Controller (PLC): this controller is needed to manage the recognition of the codes through the camera;
- Vision system camera: the autofocus system in charge of scanning the codes in the pieces;
- Network switch: to enable the network connection of the PLC and the Factory Connector;
- Power supply: to power all the devices installed in the electric panel placed inside the cabinet.
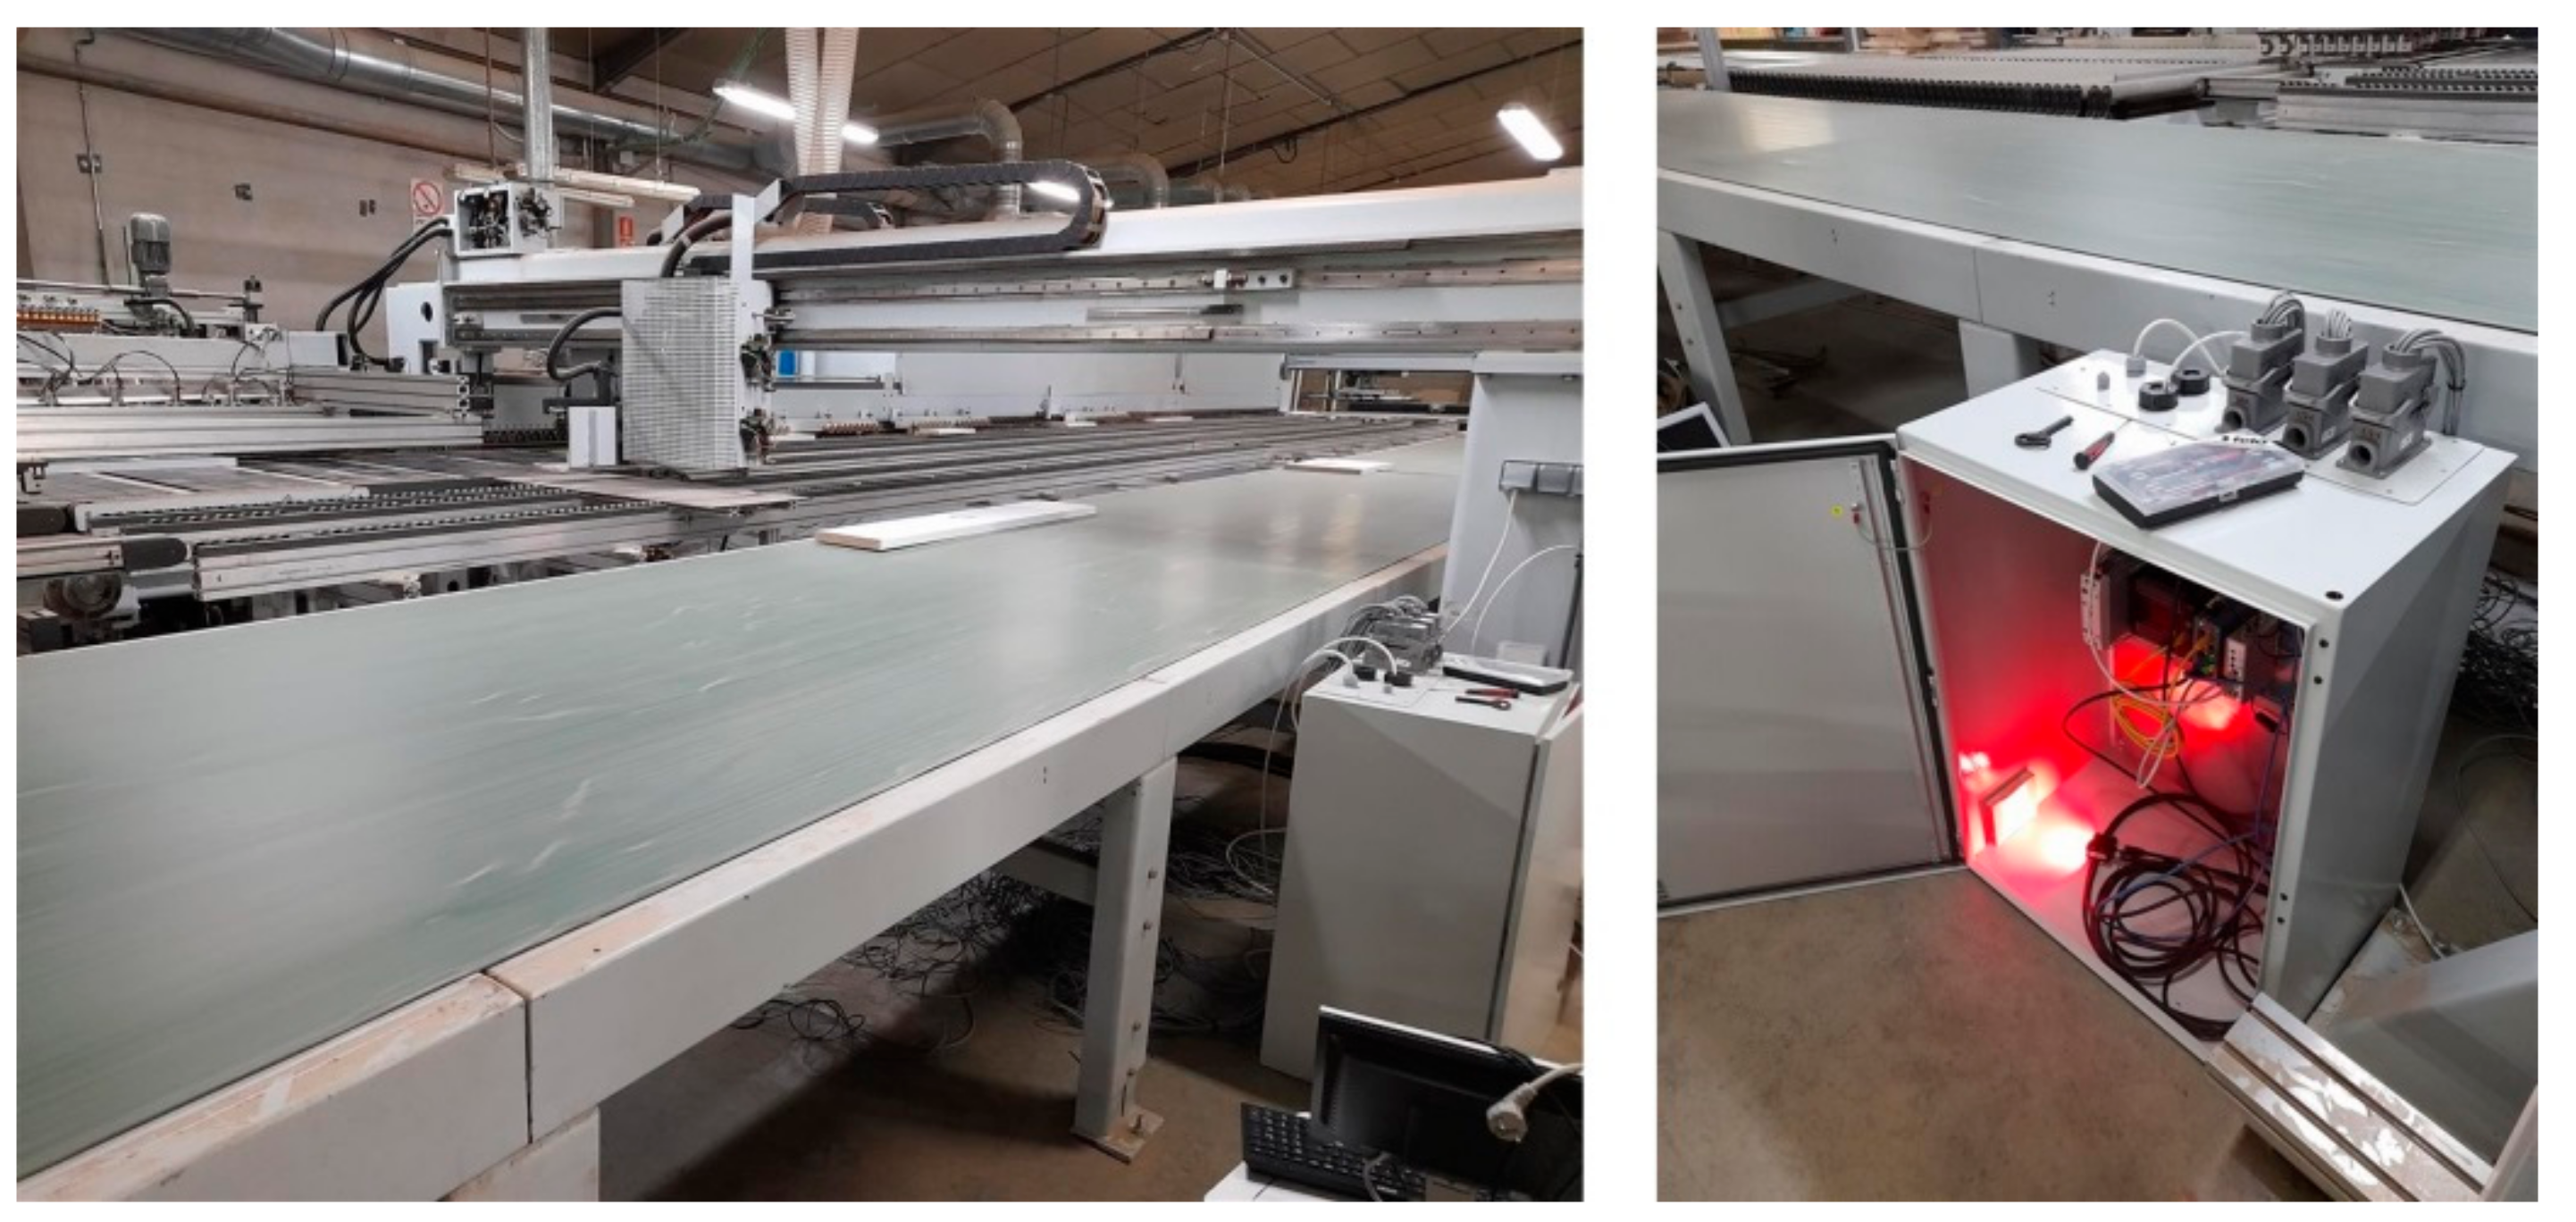
The electrical cabinet is placed halfway along the second part of the conveyor belt, which is considered to be the best location given the layout distribution. The camera is placed in the end of the conveyor just before the classification point, as seen in Figure 4.
The metallic cabinet is used to store the electrical panel with all the connected devices. This is plugged into AC power and connected to the network through an Ethernet cable. This also provides the external connections to the temperature probes, pressure sensors and electrical current sensors to monitor the parameters of the machine. Whilst this machine monitoring is part of the solution, the focus of this paper is the interactive element led by the barcode scanning functionality. A PLC has been included as part of the solution and is the component in charge of supporting the code recognition through the vision system camera. In order to manage the network connection between the different components, a network switch is also included in the electrical panel. Figure 5 shows the final installation of the cabinet containing the hardware next to the machine.
The electrical cabinet and the camera—that make up the vision system—are installed at the selected part of the production line. The camera scanning the codes is connected to the electrical cabinet as shown in Figure 5.
4. Industrial Experimentation
The experimentation is located in LAGRAMA’s production plant. LAGRAMA is a furniture manufacturing company (SME) for youth rooms, lounges, wardrobes, bedrooms and home offices. The company—which is based in Vinaròs (Castellón, Spain)—takes part in ambitious renovation projects for large organizations, such as hotels and public institutions, for commercial and residential clients as part of “project-oriented” ad-hoc decoration projects. The company is introducing the collection and analysis of production data and industrial equipment in order to improve manufacturing and reduce machine downtime. The occasional breakdowns of a machine can mean significant delays in production time and subsequently in the delivery time to the customer.
Finding new customer segments to increase the company turnover pushes the furniture manufacturers to diversify both their production systems and supply chains. Customers in the home furniture sector behave in a very traditional way, browsing different options from catalogues that include the different customization options offered by the manufacturers. These customers coexist with new ones from the contract channel who demand highly-customized integral furnishing and decoration services. These unique products are manufactured in unit-sized lots and customized according to a specific interior decoration project.
The exposed furniture scenario envisions the creation of a ‘Lot Size 1’ Consolidation Centre to control small scale stocking and consolidation points for large manufacturers, managed by LAGRAMA. The Lot Size 1 concept considers the manufacturing of one single item but produces it at the same cost and efficiency as a big batch. This is closely related to the market preferences that are shifting toward a desire for customized products, pushing the manufacturers—whose production process is usually defined by repeatability, productivity and price point—to reinvent their operations accordingly, as they move toward mass customization [14].
For this particular use case, the furnishing and decoration of rooms in a small thematic hotel—each inspired by different decorative concepts—is the main challenge for LAGRAMA. The experiment is supported through the European Connected Factory Platform for Agile Manufacturing (EFPF) tools and services; in this case specifically those related to the improvement of the production process and equipment maintenance at the manufacturing plant. For LAGRAMA, the concept of Lot Size 1 is highly relevant as each element of the customer’s order is based on unique requirements. As such, each process, machine and staff member need to adapt to each piece being produced. The machine setup is affected by each furniture component on the production line, each one needs to be identified to ensure the production schedule is correctly fulfilled and this requires manual intervention along the whole cycle.
The flexibility the company needs to implement the Lot Size 1 manufacturing strategy impacts the current efficiency and productivity of manufacturing resources. In the edge bending area in particular, the operator reads every printed label on every piece in order to know where to send the piece to in another area of the factory, creating a bottleneck in the process. Depending upon the number of different pieces involved in the manufacturing process in the bending machine, the time needed by workers for classification changes: i.e., the more variability of pieces, the more time the workers need for classification.
In the presented scenario, the video system is used to scan the label codes placed on the different items circulating on the belt of the edge banding machine, after being processed by the machine. The items to be classified are mainly rectangular and square wooden pieces with a reduced thickness, while the label containing the code on each piece is manually placed by workers in the first production phase, just after the board cutting.
The heterogeneity of the pieces is represented by the number of different lots. One lot is a collection of pieces which have common features, mainly in terms of thickness and type of material applied to the edges. Although the number of different lots depends on the orders in progress, an average of 3 lots is usually processed by the company in a working day. This is further illustrated in the Base Scenario described in the Results section.
The impact of the deployment of the solution is measured by the OEE manufacturing KPI [15] by using the formulas for OEE, including availability, performance and quality, as previously introduced at the beginning of the Applied Methodology section.
Based on the calculations made by the technicians from AIDIMME and LAGRAMA, in the edge banding machine, the OEE is variable depending on the type of pieces the company produces, with a value between 59% and 74%. Details on the calculation process are provided later in the Results section.
As described above, the focus of the experiment is on the component classification process. Traditionally, workers spent lot of time reading the labels from pieces and classifying them properly for redirection in the plant. An automatic reading of the labels saves working time and avoids mistakes, reducing the associated performance indicator, which is eventually reflected in the OEE approach.
The deployed solution provides a low level of Human-Computer Interaction, presenting a dashboard to the worker at the factory to support them to take an appropriate action, based upon data captured from the component, which is retrieved via API from the ERP system.
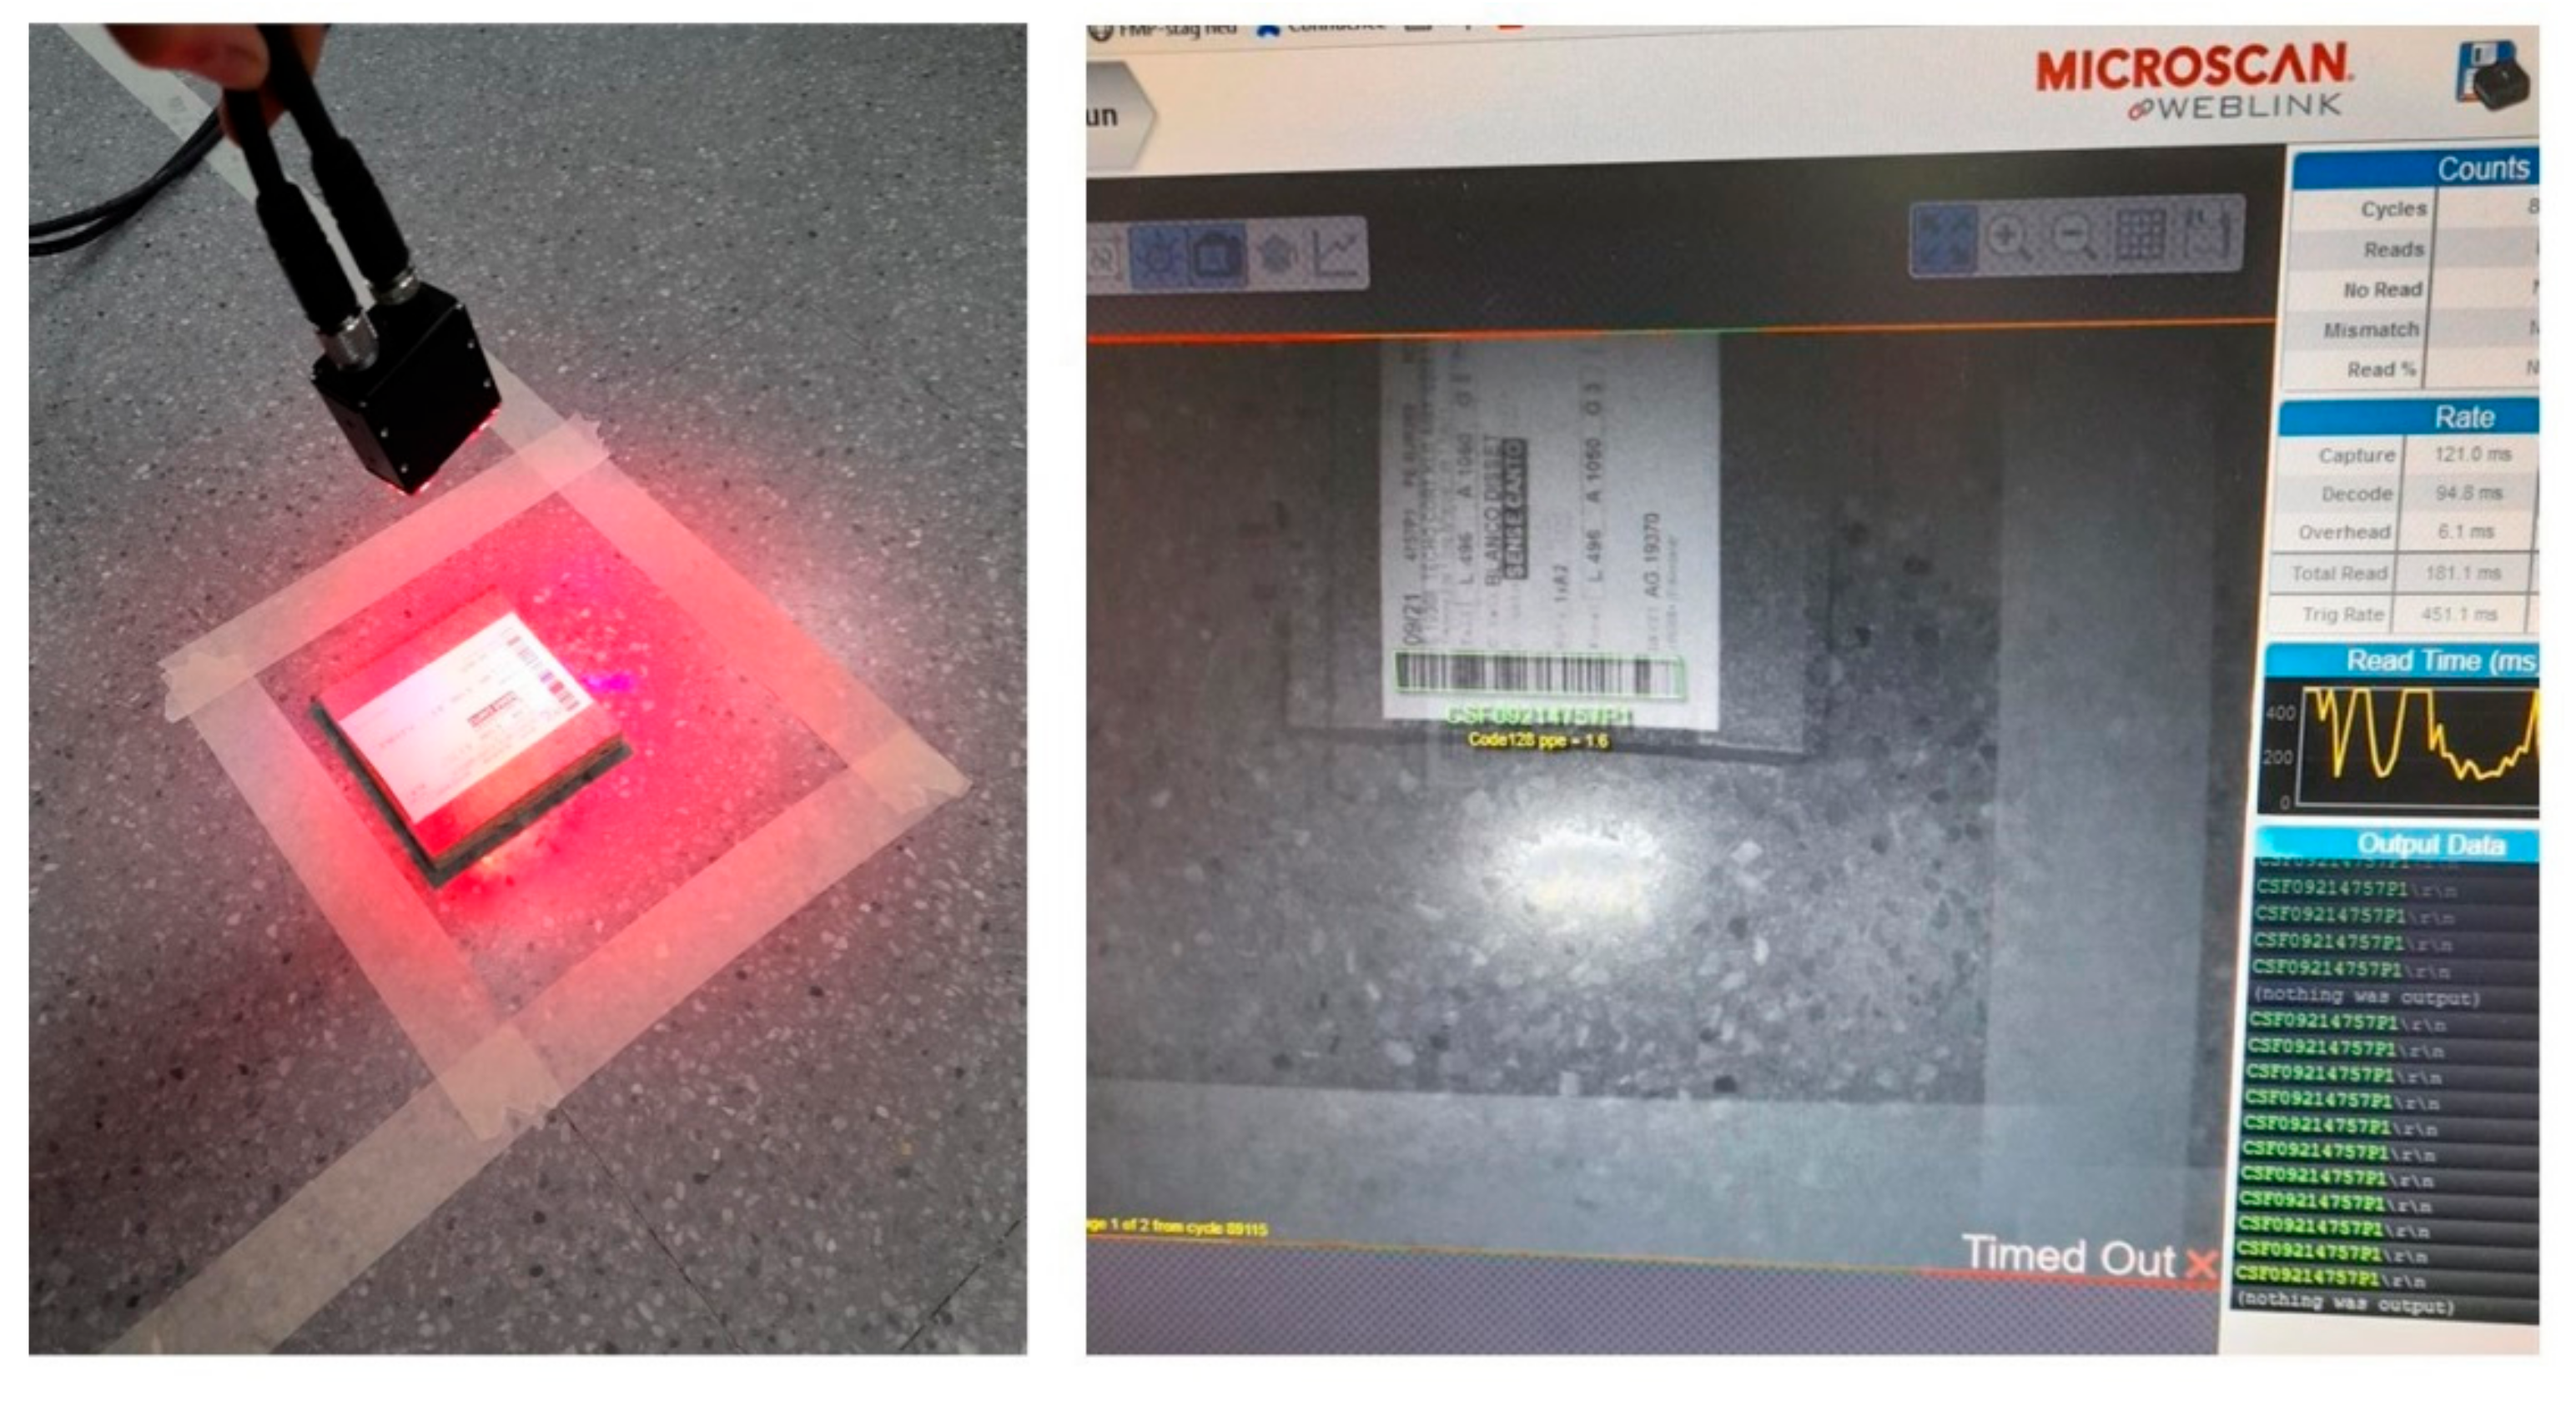
Before installing the electrical cabinet containing the hardware components in LAGRAMA, the solution was first tested in AIDIMME’s facilities to validate the connectivity and the expected functionality. To that end, the PLC was coded to recognize the barcodes on pieces and the ranges that the barcode scanner is able to cover; the label positions were also evaluated. This experimentation is illustrated below in Figure 6, enabling definition of the ideal height at which the scanner should be placed in the target production environment.
Consistent barcode recognition was established and the associated information was successfully retrieved through the camera of the scanner, as can be seen in Figure 6.
The functioning of the hardware was validated and then the cabinet was moved to the production plant of LAGRAMA and placed beside the edge banding machine. The sensors were connected to the recipients prepared in the cabinet, following a specific mapping between each PIN of the 3 analogue cards and each sensor placed in the machine.
The Factory Connectivity solution, once put in place, was immediately adopted by the operators in the production plant. The workers scan the barcode label with the barcode reader to discover what operation should be undertaken with each piece. The Industreweb 4.0™ Factory Connector receives the code and contacts the LAGRAMA ERP via API, in order to retrieve detailed information about the next step and prompt the worker via a visual display. An important issue detected during the experiment process, was the management of pieces by operators after the edge banding machine processing, ensuring at that point they are redirected to another repository in the factory to continue the following corresponding operations. The allocation of pieces has traditionally been a manual process and, in order to improve this task, a system that automatically reads the barcode in the label and displays the next destination of the piece has now been implemented.
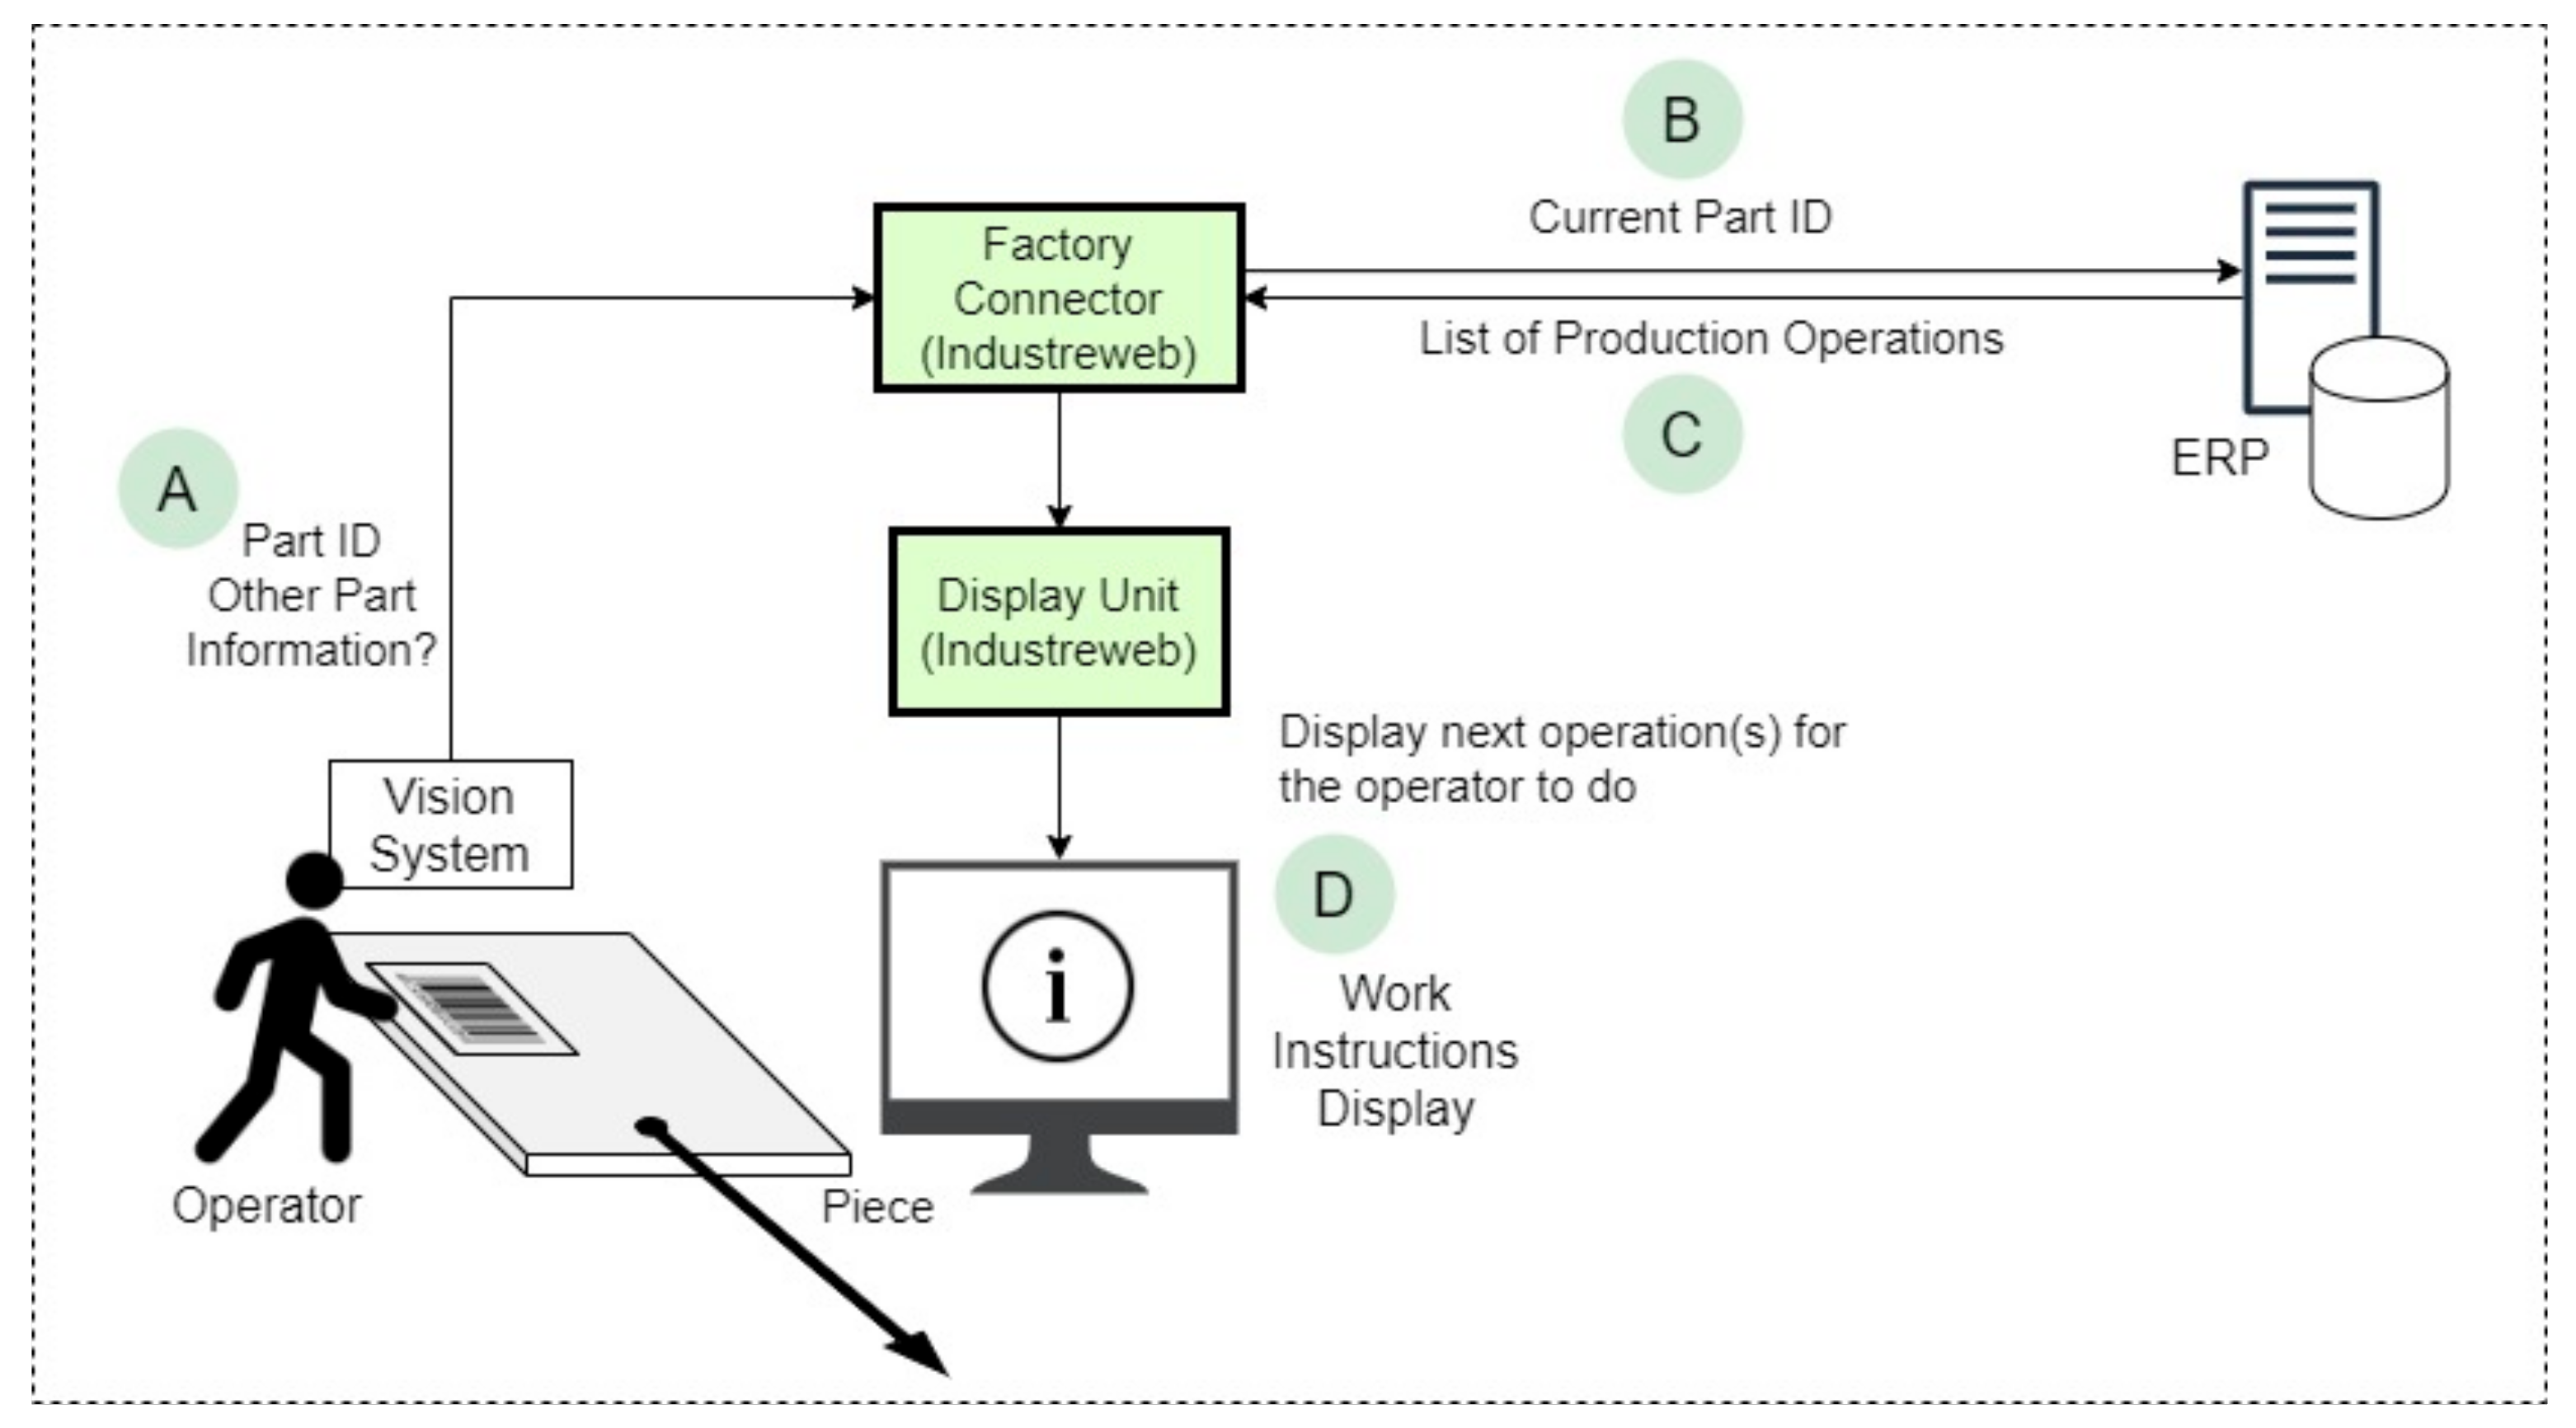
The functional steps are shown in Figure 7 and described below:
- (A)
- The operator loads the component into the machine and the component part is automatically scanned as soon as it is loaded into the edge banding machine. The value is read into an Omron PLC memory and then accessed via Ethernet/IP by the Edge Factory Connector;
- (B)
- The Edge Factory Connector makes a request to the API of the ERP in order to get the information of the piece, which not only includes the current status but also the sequence of operations to be fulfilled by the piece;
- (C)
- The resultant data is received. If the data received is complete, the data will be converted into a format suitable for display;
- (D)
- The data is asynchronously published to a web dashboard that can be viewed by the operator at the machine, but also on any web enabled device on the factory network. Then the worker moves the piece to the proper place for the next operation, following the instructions prompted in the dashboard.
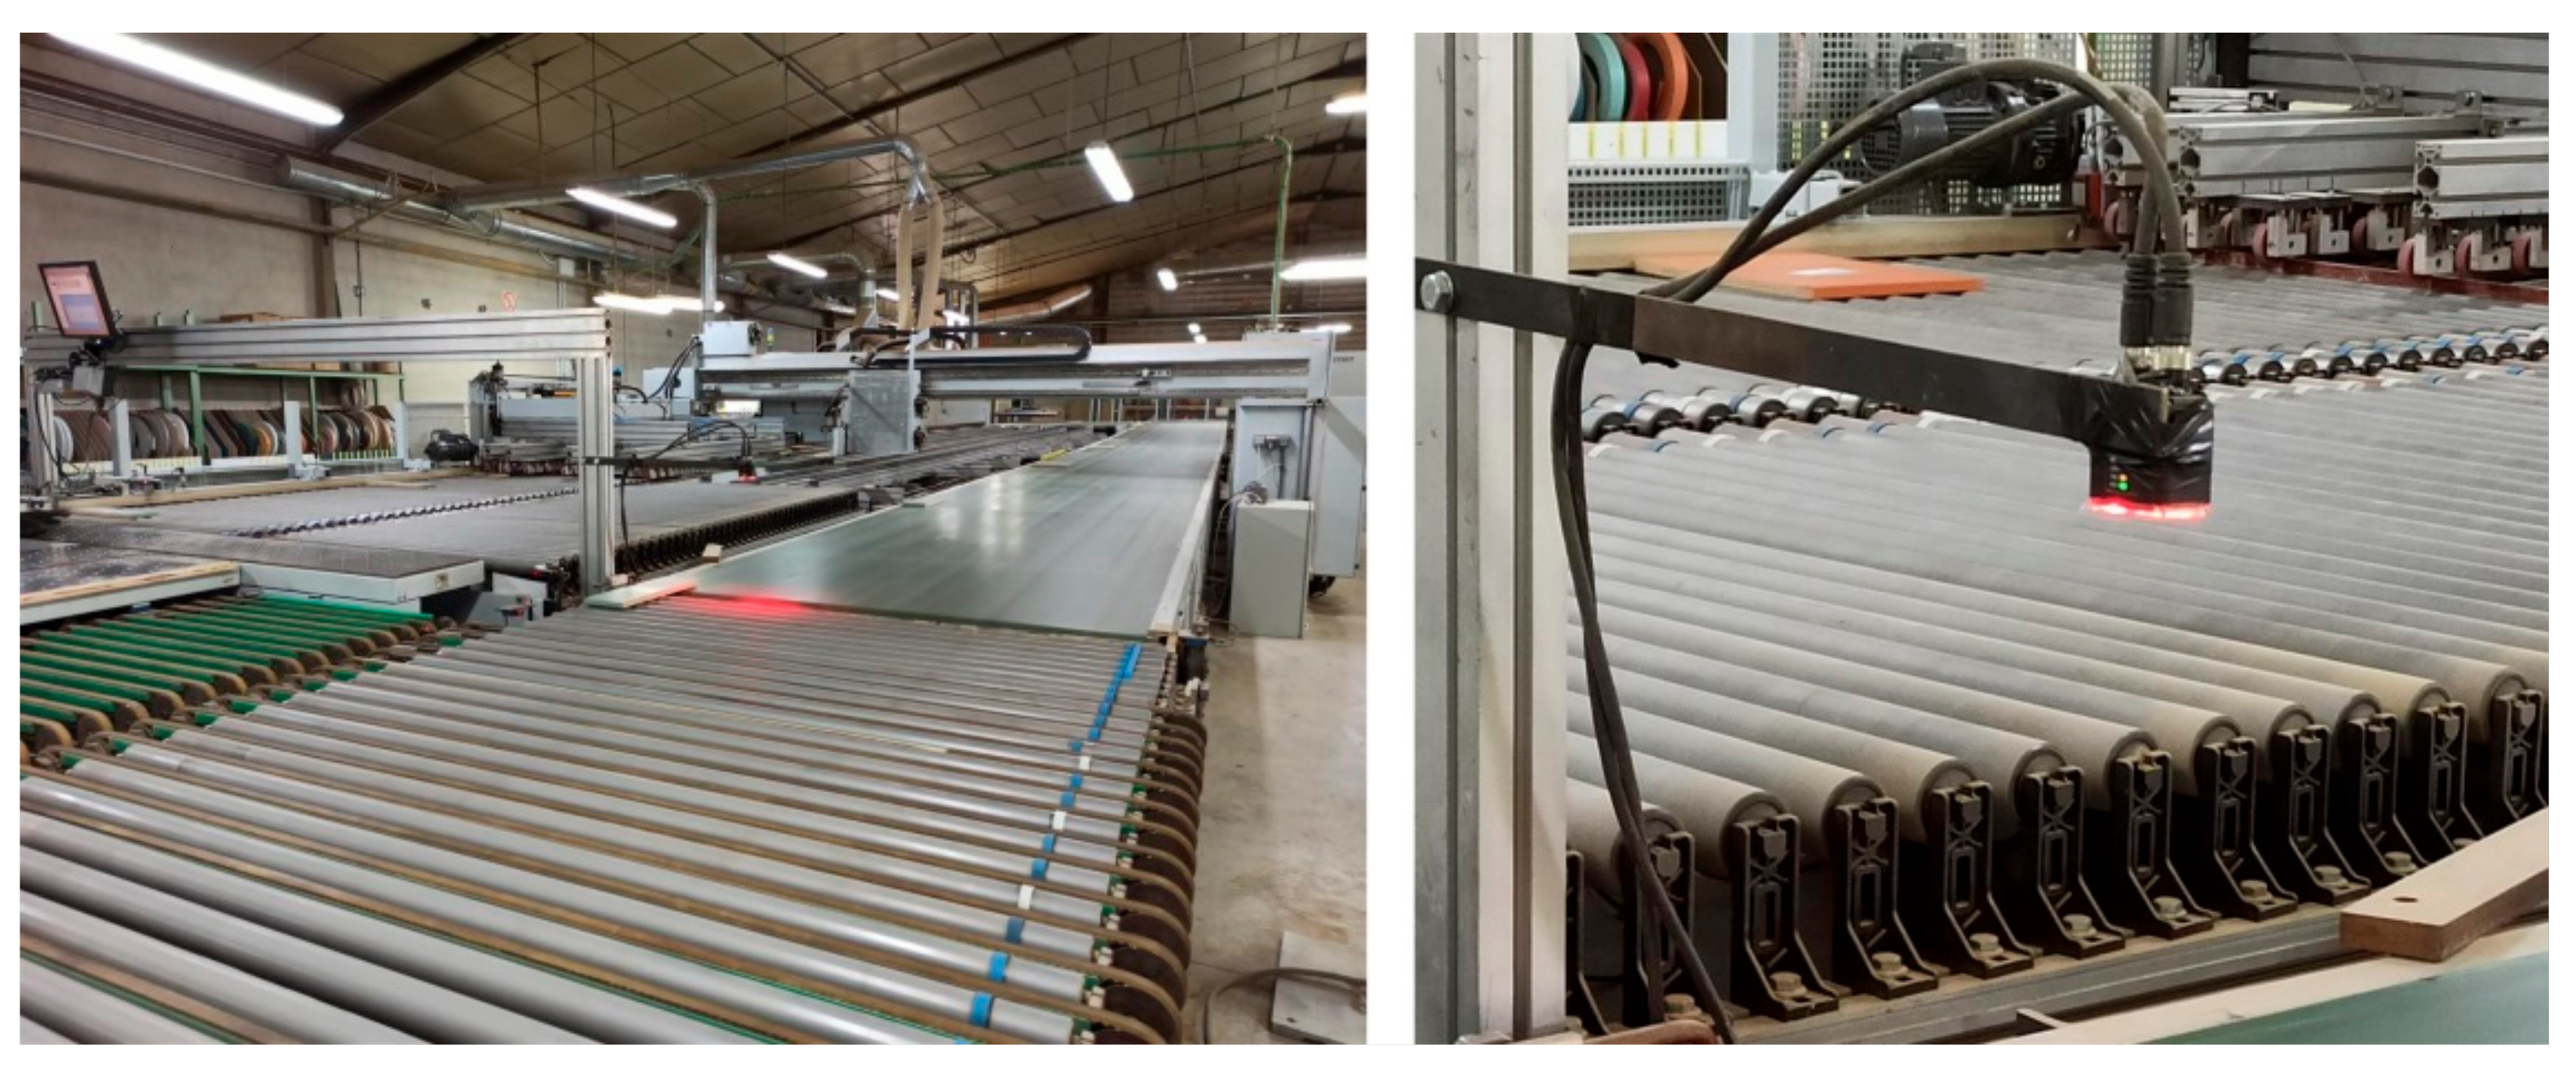
Figure 8 below shows the conveyor belt of the edge banding machine with the camera system deployed and a detail of the scanning camera.
In step B above, the information is retrieved from the ERP system via API and shown in a display to the worker. This not only includes the internal parameters such as the code of the manufacturing order, the code of the piece, a short description, the cutting measures and the color and dimensions of the piece, but also a table indicating the sequence to be followed by the piece and the step of the sequence where the piece is located at that moment.
As shown in Figure 9, the Ruta (route) parameter reveals that the actual piece requires 1 operation in machine N1 and 4 operations in machine B4, while the X0,8 expression indicates the kind of edge to be applied to the piece. The texts in the interface are shown in Valencian language so the parameters are retrieved from the ERP of the company. The table of Seqüencia (Sequence) prompted in the dashboard allows the workers to redirect each piece to the appropriate repository in a more reliable and agile way, providing a full traceability of each piece throughout the plant.
5. Results
As described earlier, the impact of the solution is measured by the OEE indicator, focusing on the use of the selected edge banding machine. This indicator varies depending on the type of piece produced. Therefore, this has been defined through 3 different scenarios (optimistic, base and pessimistic) which cover an open range of situations in the factory.
Before the deployment of the solution, the OEE in the company for the three scenarios has been setup as: 74% in the optimistic scenario, 68% in the base scenario and 59% in the pessimistic scenario.
On the one hand, as can be seen in Table 1, the values in the left column (Optimistic) have been calculated from an ideal working day in which all the pieces processed are homogeneous (one single lot), and the setup time as well as the maintenance and stop time have been the shortest. On the other hand, the values in the far-right column (Pessimistic) represent a hard working day, covering a heterogeneous group of pieces (eight lots) with considerable time spent on setup, maintenance and stops in the machine. From both situations, the middle column (Base) is taken as reference for an ordinary working day.
The classification time is reduced because of the level of automation in the interpretations of the codes for each piece. Three different hypotheses on the reduction of the processing time have been defined in Table 2 below.
Hypothesis 1 (H1) implies 75% of reduction in classification time, while in Hypothesis 2 (H2) the reduction is 50%, and in Hypothesis 3 (H3) the reduction is just 25%. The results are also affected by the size and shape of piece manufactured: in small pieces the time reduction is higher as per H1, but when large pieces are involved, the time reduction is lower as per H3, due to the difficulty in handling these pieces.
According to the initial estimation of OEE (before deploying the solution), and the prototype test carried out to estimate the solution’s impact, a ‘What If’ analysis was conducted to estimate the final impact on the OEE of the edge banding machine. The three initial scenarios with the current OEE were cross-referenced with the three hypotheses of classification time reduction, obtaining the results shown in Table 3 below.
As commented earlier, the values in the far-left column (Optimistic H1), represent an ideal working day, while the values in the far-right column (Pessimistic H3) represent a hard-working day. Therefore, the middle column (Base H2) should be taken as reference for the actual impact in the factory environment.
It should be noted that these values have been measured through ad-hoc monitoring in the real production environment of the number of lots and time dedicated to setup, maintenance, and eventual stops.
As can be seen in Table 4, according to the performed analysis, in the Optimistic scenario, the original OEE (74%) improves until 77%-80%-85% (depending on the type of pieces being processed). In the Base scenario the OEE improves from 68% until 71%-74%-78%. Finally, in the Pessimistic scenario the OEE improves from 59% to 62%-65%-69%.
In relative terms, the improvement in OEE is 2–3% higher in hypothesis 3 (H3), 5–6% higher in hypothesis 2 (H2), and 9–11% higher in hypothesis 1 (H1). This is summarized in Table 5 below.
6. Concluding Remarks
The technical solution deployed in the industrial environment has been described, along with how the classification process is improved by the use of the vision system, and the approach followed to measure the impact on the overall production process.
The impact of the solutions developed in the production line has been measured by OEE: a standard KPI used by the companies to improve manufacturing operations.
Further improvement of this KPI could be achieved through a standardized process with big batches, manufacturing the same piece. Otherwise, the set-up times increase with the number of lots and some activities, such as the classification tasks, increase the dedicated time which also reduces the overall performance. However, the market demands customization, together with an agile and efficient supply chain.
A furniture producer like LAGRAMA wants to face this challenge by adapting its production processes and adopting a Lot Size 1 manufacturing strategy. The solution implemented demonstrates that, in such a complex situation, the OEE can be improved in every adverse scenario (from 2% in the worst situation, to 11% in the optimistic). This OEE improvement increases the capacity of the factory, suggesting an increase of 303 more pieces in a single shift, according to the ‘What-If’ analysis performed in this research. This achievement, in the specific scenario of this study, affects one of the bottlenecks of the factory; therefore, the capacity of the whole factory could increase in the same range. It should be noted that two relevant parameters which are the Mean Time to Repair (MTTR) and the Mean Time Between Failures (MTBF) have not been explicitly introduced in the analysis, so the presented scenarios have been defined through specific values measured on premise. Furthermore, the maintenance time has been globally considered and the vision system implemented does not directly affect the availability of the machine, but rather the speed of the production line.
In the scope of a manufacturing process, where the flexibility is quite high and one machine can be used to produce a huge variety of different pieces, the measurement of the impact of new solutions becomes difficult because of the variables in the process. Several scenarios have been presented and, therefore, the alternative potential impacts achieved with different situations regarding the use of the edge banding machine in the company have been evaluated.
Difficulties found during the deployment of the system in the factory should not be overlooked. The introduction of new hardware and software components at a specific point in a real production line often becomes complicated. The connectivity of the elements in the electrical cabinet as well as the Ethernet connection—which is required to connect the software—usually requires additional effort. Despite this, the system was deployed in a reasonable time with support from both the solution providers and the factory management.
As a main conclusion, the factory connectivity solution implemented demonstrates an improvement in the overall production performance. The solution also offers the potential ability to change the production strategy based on requirements that the manufacturing industry may need to face, providing traceability throughout the process, which facilitates the reconfiguration of the production line to meet specific needs. The solution reported in this paper also demonstrates the benefits of Human–Computer Interaction through Edge Computing and connectivity to legacy and multivendor systems. The vision system provides time saving and a reduction in errors, which leads to obvious benefits in reducing production costs and maintaining high quality. From the worker’s perspective, the system alleviates the human tasks in the edge banding area of the production line, making the operators feel more confident during the handling of the parts. The solution provides reliable instructions and complete traceability of the manufactured pieces. The activities carried out during the experimentation have also confirmed that the measurement of the impact of a solution in the factory environment using the OEE approach becomes very valuable, enabling the quantification of the advantages which can be achieved through the adoption of specific systems, oriented to the production improvement.
Future research studies are required to compare other factory connectivity solutions applied in other type of processes, in order to find out how the local impact differs, and how single machines affects the global efficiency of a complete factory by following the Theory of Constrains –TOC [16], considering the effect of the different bottlenecks during the manufacturing in the factory.
Author Contributions
G.B., S.O., M.J.N.A., J.D.A.N. and F.G.V. have contributed to all chapters in writing or edition. All authors have read and agreed to the published version of the manuscript.
Funding
This research was funded by the European Commission within the H2020 project EFPF (European Connected Factory Platform for Agile Manufacturing), No. 825075, for the period between January 2019–December 2022.
Institutional Review Board Statement
Not applicable.
Informed Consent Statement
Not applicable.
Data Availability Statement
Not applicable.
Acknowledgments
Gratitude to company LAGRAMA for the provision of its industrial facilities, the support in the deployment of tools and the feedback retrieved during the experimentation.
Conflicts of Interest
The authors declare no conflict of interest.
References
- Zafar, I.; Zakir, U.; Edirisinghe Eran, A. Real-time multi-barcode reader for industrial applications. In Proceedings of the Real-Time Image and Video Processing, Brussels, Belgium, 12–16 April 2010; Volume 7724. [Google Scholar]
- Fröschle, H.-K.; Gonzales-Barron, U.; McDonnell, K.; Ward, S. Investigation of the potential use of e-tracking and tracing of poultry using linear and 2D barcodes. Comput. Electron. Agric. 2009, 66, 126–132. [Google Scholar] [CrossRef]
- Muniz, R.; Junco, L.; Otero, A. A robust software barcode reader using the Hough transform. In Proceedings of the 1999 International Conference on Information Intelligence and Systems (Cat. No.PR00446), Bethesda, MD, USA, 31 October–3 November 1999. [Google Scholar]
- Ping Du, W.; Li, L.; Zhao, W. 2D Barcode Identification Technology Application in Tool Management System for Workshop. Mater. Sci. Forum 2016, 836–837, 283–289. [Google Scholar]
- Tiago, M.; Paula Fraga-Lamas, P. A Review on Human-Centered IoT-Connected Smart Labels for the Industry 4.0. Fernández-Caramés. IEEE Access 2018, 6, 25939–25957. [Google Scholar]
- Chetouanem, F. An Overview on RFID Technology Instruction and Application. IFAC Pap. 2015, 48, 382–387. [Google Scholar] [CrossRef]
- De Cos, M.E.; Las-Heras, F. Troubleshooting RFID Tags Problems with Metallic Objects Using Metamaterials. In Current Trends and Challenges in RFID; Turcu, C., Ed.; IntechOpen: London, UK, 2011. [Google Scholar] [CrossRef] [Green Version]
- Chowdhury, S.; Haque, K.A.; Sumon, M. Implementation of Lean Strategies in a Furniture Manufacturing Factory. IOSR J. Mech. Civ. Eng. 2015, 12, 45–50. [Google Scholar]
- Martins, Q.; Pedro, A. Maintenance Management of a Production Line—A Case Study in a Furniture Industry; Faculdade de Engenharia da Universidade do Porto: Porto, Portugal, 2019. [Google Scholar]
- Rajput, H.S.; Jayaswal, P. A total productive maintenance (TPM) approach to improve overall equipment efficiency. Int. J. Mod. Eng. Res. 2012, 2, 4383–4386. [Google Scholar]
- De Ron, J.; Rooda, J.E. OEE and equipment effectiveness E: An evaluation. Int. J. Prod. Res. 2006, 44, 4987–5003. [Google Scholar] [CrossRef] [Green Version]
- Hedman, R.; Subramaniyan, M.; Almström, P. Analysis of critical factors for automatic measurement of OEE. Procedia Cirp 2016, 57, 128–133. [Google Scholar] [CrossRef]
- Code 128. Available online: https://en.wikipedia.org/wiki/Code_128 (accessed on 12 February 2021).
- Brown, P. Lot Size 1. Available online: https://www.tradeandindustrydev.com/industry/manufacturing/lot-size-1-14715 (accessed on 30 June 2021).
- What Is Overall Equipment Effectiveness? Available online: https://www.oee.com (accessed on 8 March 2021).
- Cox, J.F., III; Cfpim, C.; Schleier, J.G., Jr. Theory of Constraints Handbook; McGraw-Hill Education: New York, NY, USA, 2010. [Google Scholar]
Figure 1.
Steps involved in the methodology for experimentation and evaluation.

Figure 2.
Industreweb™ 4.0 Edge Factory Connector architecture.

Figure 3.
Detail of label attached to piece.

Figure 4.
Preliminary placement of the devices around the edge banding machine.

Figure 5.
Edge banding machine and detail of the electrical cabinet in the production line.

Figure 6.
Experimentation of scale and variation and training of the camera system.

Figure 7.
Data flow within Vision System solution.

Figure 8.
Camera scanning pieces in the conveyor of the edge banding machine.

Figure 9.
Asynchronous Web Dashboard to provide Work Instructions.


Table 1.
Initial scenarios for calculation of current OEE in the edge banding machine.
| Scenario | Optimistic | Base | Pessimistic | |
|---|---|---|---|---|
| OEE | 74.0% | 67.8% | 59.2% | |
| A (Availability) | 95.3% | 92.0% | 84.0% | |
| TT (Total Time) | 480 | 480 | 480 | min./day |
| PPT (Planned Production Time) | 450 | 450 | 450 | min./day |
| RT (Run Time) | 429 | 414 | 378 | min./day |
| ST1 (Stop Time) | 21 | 36 | 72 | min. |
| Maintenance | 20 | 30 | 40 | min./day |
| Number. Lots | 1 | 3 | 8 | lots |
| Setup Time | 1 | 2 | 4 | min./lot |
| P (Performance) | 80.0% | 77.6% | 75.8% | |
| ICT (Ideal Cycle Time) | 0.43 | 0.63 | 0.83 | min./piece |
| TC (Total Count) | 792.0 | 506.9 | 343.6 | pieces |
| RT (Run Time) | 429 | 414 | 378 | min./day |
| CT (Classification Time) | 0.10 | 0.17 | 0.23 | min./piece |
| MST (Micro-stops Time) | 0.008 | 0.017 | 0.033 | min./piece |
| Q (Quality) | 97.0% | 95.0% | 93.0% | |
| GC (Good Count) | 768.2 | 481.6 | 319.6 | pieces |
| TC (Total Count) | 792.0 | 506.9 | 343.6 | pieces |
Table 2.
Reference of classification time reduction because of factory connectivity implementation.
| EFPF Project Hypothesis | H1 | H2 | H3 | |
|---|---|---|---|---|
| CT (Classification Time) | −75% | −50% | −25% | min./piece |
Table 3.
Calculation of OEE in pilot machine because of factory connectivity implementation.
| Scenario | Optim. | H1 | H2 | H3 | Base | H1 | H2 | H3 | Pessim. | H1 | H2 | H3 | |
|---|---|---|---|---|---|---|---|---|---|---|---|---|---|
| OEE | 74.0% | 84.6% | 80.3% | 76.8% | 67.8% | 78.4% | 74.0% | 70.5% | 59.2% | 68.6% | 64.6% | 61.6% | |
| A (Availability) | 95.3% | 95.3% | 95.3% | 95.3% | 92.0% | 92.0% | 92.0% | 92.0% | 84.0% | 84.0% | 84.0% | 84.0% | |
| TT (Total Time) | 480 | 480 | 480 | 480 | 480 | 480 | 480 | 480 | 480 | 480 | 480 | 480 | min./day |
| PPT (Plan. Prod. Time) | 450 | 450 | 450 | 450 | 450 | 450 | 450 | 450 | 450 | 450 | 450 | 450 | min./day |
| RT (Run Time) | 429 | 429 | 429 | 429 | 414 | 414 | 414 | 414 | 378 | 378 | 378 | 378 | min./day |
| ST1 (Stop Time) | 21 | 21 | 21 | 21 | 36 | 36 | 36 | 36 | 72 | 72 | 72 | 72 | min. |
| Maintenance | 20 | 20 | 20 | 20 | 30 | 30 | 30 | 30 | 40 | 40 | 40 | 40 | min./day |
| Number. Lots | 1 | 1 | 1 | 1 | 3 | 3 | 3 | 3 | 8 | 8 | 8 | 8 | lots |
| Setup Time | 1 | 1 | 1 | 1 | 2 | 2 | 2 | 2 | 4 | 4 | 4 | 4 | min./lot |
| P (Performance) | 80.0% | 91.5% | 86.8% | 83.1% | 77.6% | 89.7% | 84.6% | 80.7% | 75.8% | 87.8% | 82.7% | 78.8% | |
| ICT (Ideal Cycle Time) | 0.43 | 0.36 | 0.38 | 0.41 | 0.63 | 0.51 | 0.55 | 0.59 | 0.83 | 0.66 | 0.72 | 0.78 | min./piece |
| TC (Total Count) | 792.0 | 1095.3 | 971.3 | 872.5 | 506.9 | 730.6 | 636.9 | 564.5 | 343.6 | 504.0 | 436.2 | 384.4 | pieces |
| RT (Run Time) | 429 | 429 | 429 | 429 | 414 | 414 | 414 | 414 | 378 | 378 | 378 | 378 | min./day |
| CT (Class. Time) | 0.10 | 0.03 | 0.05 | 0.08 | 0.17 | 0.04 | 0.08 | 0.13 | 0.23 | 0.06 | 0.12 | 0.18 | min./piece |
| MST (Mic. stops Time) | 0.008 | 0.008 | 0.008 | 0.008 | 0.017 | 0.017 | 0.017 | 0.017 | 0.033 | 0.03 | 0.03 | 0.03 | min./piece |
| Q (Quality) | 97.0% | 97.0% | 97.0% | 97.0% | 95.0% | 95.0% | 95.0% | 95.0% | 93.0% | 93.0% | 93.0% | 93.0% | |
| GC (Good Count) | 768.2 | 1062.5 | 942.2 | 846.4 | 481.6 | 694.1 | 605.1 | 536.3 | 319.6 | 468.7 | 405.6 | 357.5 | pieces |
| TC (Total Count) | 792.0 | 1095.3 | 971.3 | 872.5 | 506.9 | 730.6 | 636.9 | 564.5 | 343.6 | 504.0 | 436.2 | 384.4 | pieces |
Table 4.
Final OEE values obtained according from the different scenarios and hypothesis.
| Absolute OEE | Optimistic | Base | Pessimistic |
|---|---|---|---|
| Initial situation | 74% | 68% | 59% |
| H1 | 85% | 78% | 69% |
| H2 | 80% | 74% | 65% |
| H3 | 77% | 71% | 62% |
Table 5.
Improvement in OEE according different scenarios and hypothesis.
| OEE improvement | Optimistic | Base | Pessimistic |
|---|---|---|---|
| Initial situation | 74% | 68% | 59% |
| H1 | 11% | 11% | 9% |
| H2 | 6% | 6% | 5% |
| H3 | 3% | 3% | 2% |
Publisher’s Note: MDPI stays neutral with regard to jurisdictional claims in published maps and institutional affiliations. |
© 2021 by the authors. Licensee MDPI, Basel, Switzerland. This article is an open access article distributed under the terms and conditions of the Creative Commons Attribution (CC BY) license (https://creativecommons.org/licenses/by/4.0/).
Share and Cite
MDPI and ACS Style
Bhullar, G.; Osborne, S.; Núñez Ariño, M.J.; Del Agua Navarro, J.; Gigante Valencia, F. Vision System Experimentation in Furniture Industrial Environment. Future Internet 2021, 13, 189. https://0-doi-org.brum.beds.ac.uk/10.3390/fi13080189
AMA Style
Bhullar G, Osborne S, Núñez Ariño MJ, Del Agua Navarro J, Gigante Valencia F. Vision System Experimentation in Furniture Industrial Environment. Future Internet. 2021; 13(8):189. https://0-doi-org.brum.beds.ac.uk/10.3390/fi13080189
Chicago/Turabian StyleBhullar, Gurbaksh, Simon Osborne, María José Núñez Ariño, Juan Del Agua Navarro, and Fernando Gigante Valencia. 2021. "Vision System Experimentation in Furniture Industrial Environment" Future Internet 13, no. 8: 189. https://0-doi-org.brum.beds.ac.uk/10.3390/fi13080189
Note that from the first issue of 2016, this journal uses article numbers instead of page numbers. See further details here.