1. Introduction
Participatory GeoInformation technologies have evolved exponentially and profoundly in the past decade. In the wake of Geoweb 2.0, Volunteered Geographic Information (VGI) (e.g., OpenStreetMap and WikiMapia) and crowdsourced geodata are increasingly being produced by the public, while attracting more and more professionals. Some VGI tools and systems like GeoDeliberator or ArgooMap target professional purposes where a multidisciplinary team (professionals from different domains) must work collaboratively. This is particularly the case of Geodesign, a very dynamic emerging field [
1]. Since its emergence in 2008, and in GeoDesign summits that have taken place in Redlands every year, many definitions have been given to this new term by a group of thought leaders from academia and a variety of professions. However, to date, no consensus has been reached. We can simply state that GeoDesign describes the integration of GIS and spatial design [
1]. In this study, we define GeoDesign as “art by the creativity of design, and science by the rationale of GIS to improve multidisciplinary group analysis, solution building and decision making with controlled public participation”.
Essentially, technological innovations such as CommunityViz [
2] and CityEngine [
3] have been designed primarily to support GeoDesign practices and, in particular, to allow groups of people from different professions, places and time frames to work together on the same project and produce plans and designs. However, these technologies are expensive and require expertise to work with. For this reason, we propose the concept of WikiGIS as an alternative and complementary solution to support the collaborative, iterative and creative dimensions of GeoDesign [
4,
5]. The main strength of WikiGIS is its ability to dynamically manage the traceability of contributions so users can navigate the history.
In fact, WikiGIS is a geocollaborative platform based on Web 2.0 technologies and principles [
4]. The conceptual framework of WikiGIS combines the strengths of wiki to ensure the tracking editing process, the power of GIS to provide users with basic geoprocessing capabilities, and the main drawing tools for sketch-mapping. WikiGIS provides a collaborative environment where participants can exchange opinions, and discuss and collaborate through a dynamic user interface where all contributions are displayed to everyone. WikiGIS ensures the traceability of changes to spatial-temporal geographic components (geometric location and shape, graphics: iconography and descriptive), while providing dynamic access to the previous versions of geographic objects, as well as documentation on data quality [
5].
This paper is a follow-up to the paper published in 2012 [
5]. More precisely, it aims at formalizing the innovative WikiGIS concept from the analysis and testing of the first draft-prototype developed in 2012 [
5]. In the next section, we describe the main features of WikiGIS. The third section is dedicated to the temporal dimension, since time is a crucial component of WikiGIS. In the fourth section, traceability issues and the conceptual solution adopted are presented.
Section 5 deals with data quality issues and, more specifically, the validation and communication of contributions (likelihood level of a contribution). In
Section 6, we propose the “deltification” function as a new means for WikiGIS to allow comparisons between two scenarios.
Section 7 is dedicated to the formalization of the WikiGIS concept using UML diagrams. Before concluding and discussing new perspectives, we propose a brief overview of the cartographic interface to demonstrate how the WikiGIS proposal works.
2. What Is the WikiGIS Concept?
The authors in [
4] defined WikiGIS as “a collaborative platform 2.0, supported by a wiki that insures traceability of geographical contributions of participants while insuring the quality of produced data in a dynamic visualization and analysis. The WikiGIS has powerful features in editing and design for sketch-mapping and in georpocessing. It thus offers a simple and quick access to the process of GeoDesign”.
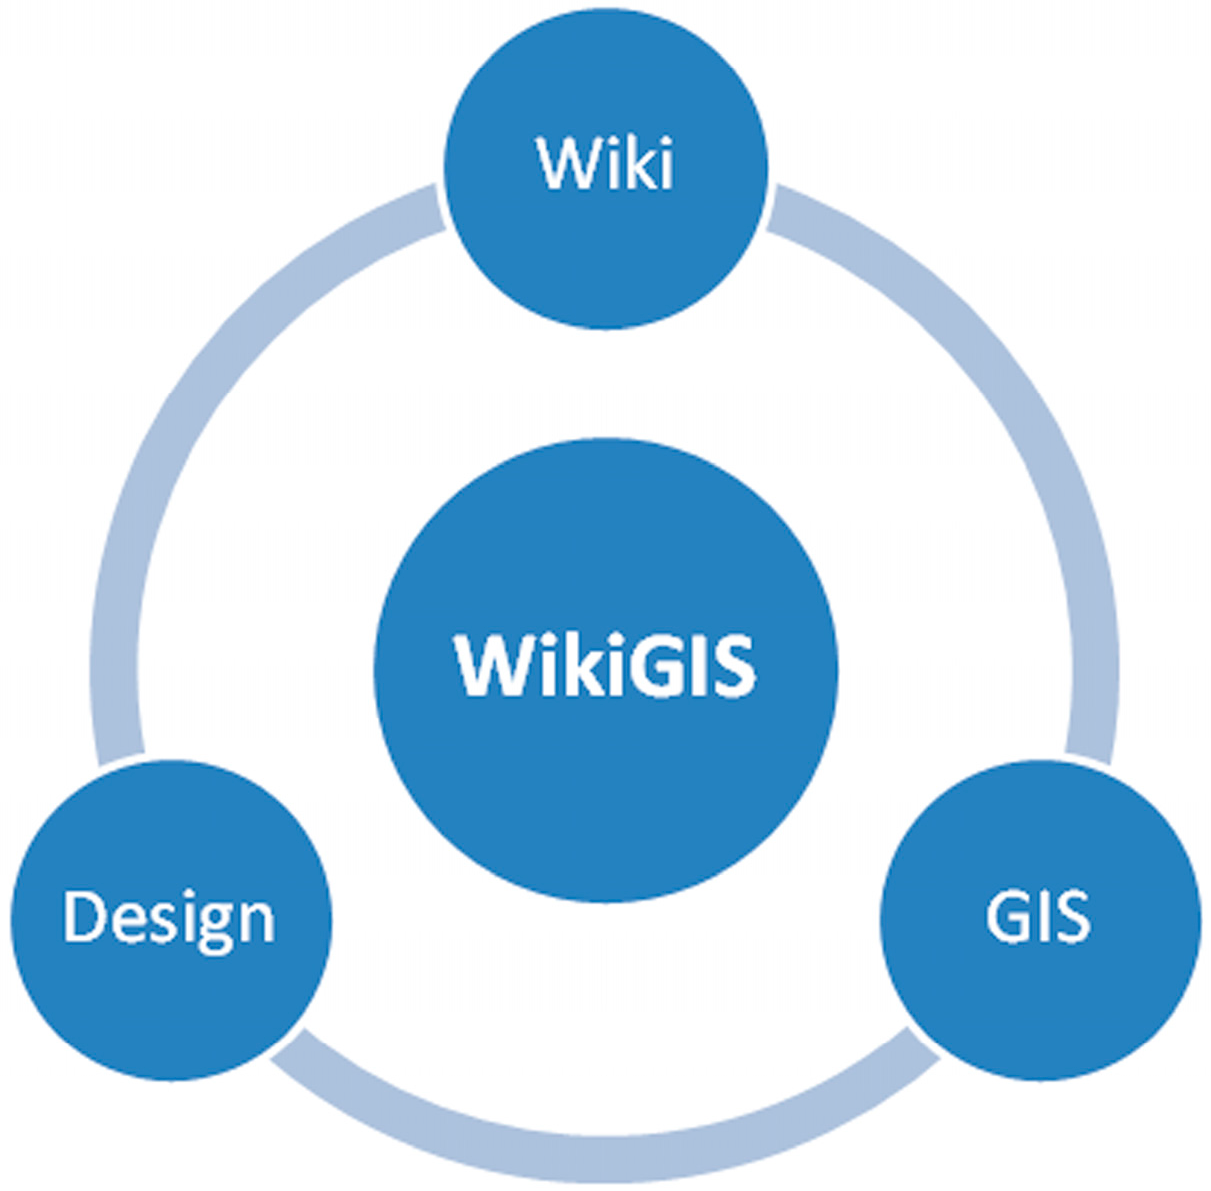
From this definition, WikiGIS is grounded in a combination of wiki, GIS and design (
Figure 1). The strength of the WikiGIS concept is derived from the integration of these three sub-components.
The basic concepts of WikiGIS are [
4]:
A web 2.0 application based on wiki track editing; dynamic management and consulting contributions. The data may be modified, enhanced, updated or even deleted. All user contributions are archived and can be viewed dynamically with the historical content;
A documented traceability of users’ contributions to ensure not only the argued documentation of the design process, but also access to this process;
The wikiGIS ensures not only the traceability of geometric, graphical and descriptive components of a feature, but also the relationships between different geometric features (topology, intersection, inclusion, etc.) over time. For example, a user can draw a line directly next to an existing line drawn by another user. These two lines could be aggregated in the future because of their common attribute, much like the extension of a road;
An ergonomic and simple mapping interface (Geoweb 2.0) for easy viewing and navigation in space-time versions of contributions;
Any contribution is considered as an opinion;
These arguments are the main components to qualify external contributions;
All previous versions of an opinion are considered as an integral component of the object (not as a different object).
Figure 1.
WikiGIS = Wiki + GIS + Design.
Figure 1.
WikiGIS = Wiki + GIS + Design.
In
Table 1, we detail the features of each sub-component mentioned above.
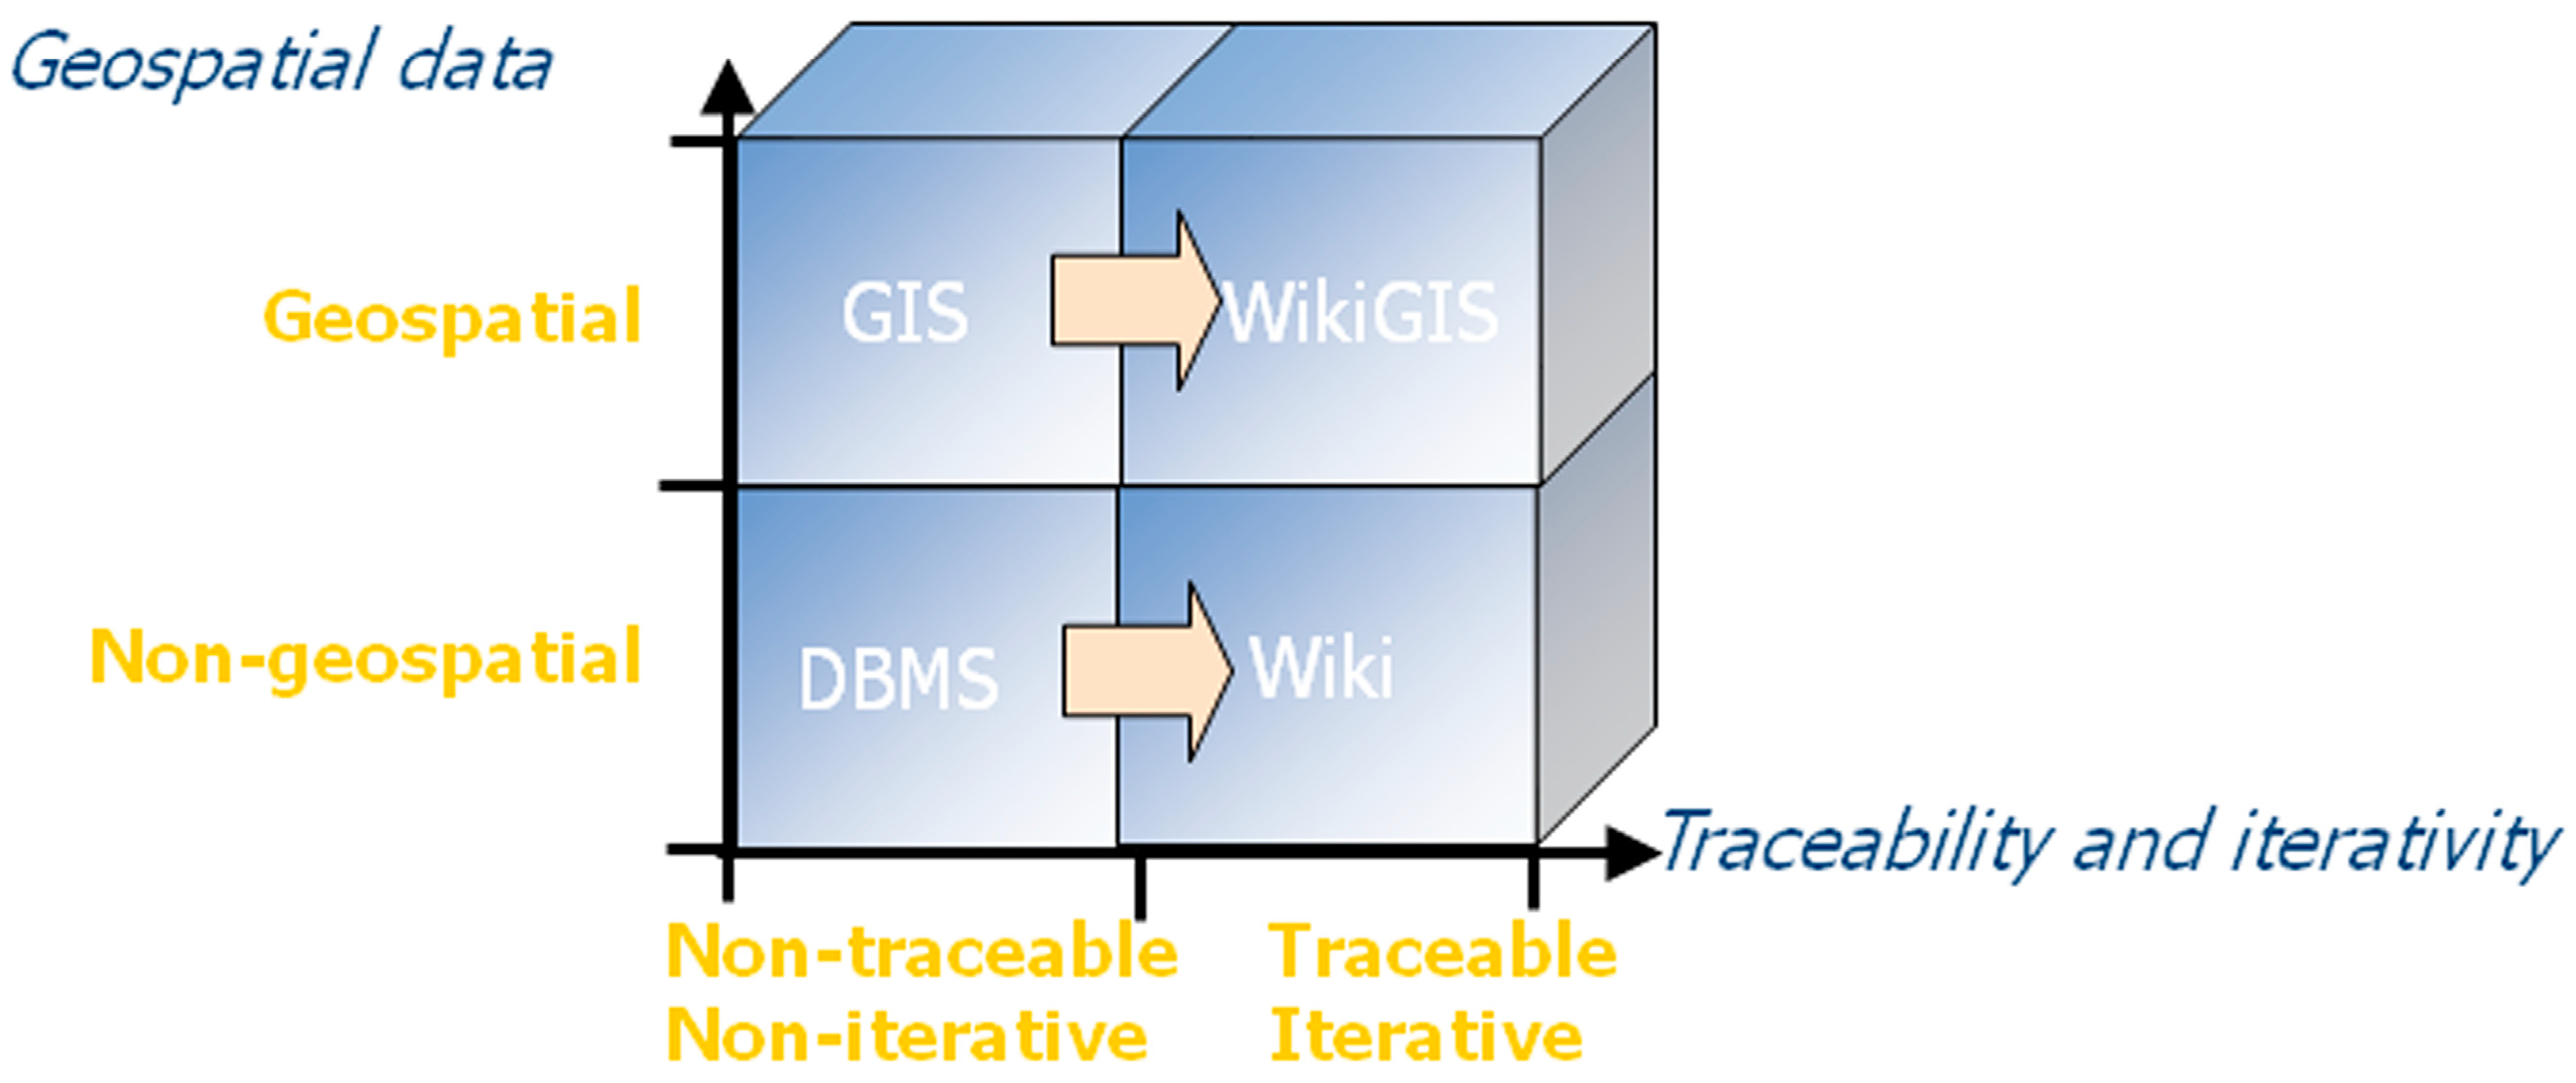
The WikiGIS is designed primarily to support the creative, iterative and collaborative dimensions of the GeoDesign process.
Figure 2 shows the positioning of WikiGIS among GIS products in order to highlight why it is needed in this present research.
Table 1.
Main features of WikiGIS.
Table 1.
Main features of WikiGIS.
| Component | Feature | Details |
|---|
| Wiki [6] and [7] | Editing | “What You See Is What You Get”—WYSIWYG kind of editing. |
| Links | Each article can be linked to other articles and form a new network structure. Links can be created in most wikis using a WikiWord. |
| History | It is basically used to save all previous versions or modifications of wiki pages. Here, it is possible to accurately track the editing process of an article, since all changes are documented. “History” allows a previous version to be opened and saved again, in order to restore the original content (rollback). This concept is based on Cunningham’s editing history. |
| Diff | It is a typical wiki feature very useful for displaying detailed alterations between two versions. |
| Recent change | It is a capability for providing a current overview of recent specific changes to wiki pages or even all changes within a predefined period of time. It is produced automatically and cannot be changed by users. |
| Search functions | They are available in wikis even if they are not specific to wiki functions, so articles in a wiki can be accessed quickly. |
| Geoprocess | Measure | Main tools to measure distance, perimeter and area. |
| Buffer | It creates buffer polygons around input features to a specified distance. |
| Clip | It extracts input features that overlay the clip features. |
| Intersect | It computes a geometric intersection of the input features. Features or portions of features that overlap in all layers and/or feature classes will be written to the output feature class. |
| Merge | It combines multiple input datasets of the same data type into a single, new output dataset. This tool can combine point, line, or polygon feature classes or tables. |
| Union | It computes a geometric intersection of the Input Features. All features will be written to the Output Feature Class with the attributes from the Input Features that it overlaps. |
| Dissolve | It aggregates features based on specified attributes. |
| Sketching | Draw | Point, line, polygon, ellipse, circle, smooth curve, freehand drawing, etc. |
| Modify | Move, copy, cut, paste, rotate, stretch, bring to front or behind, erase, edit hatch, join, reverse, etc. |
| Format | Color, thickness, transparency, shadow, etc. |
| Layer management | It display the layer’s properties, turn on/ turn off one or many layer(s), lock/ unlock a layer, copy an object from one layer to another, copy a layer, transparency, opacity, etc. |
Figure 2.
Utility of WikiGIS.
Figure 2.
Utility of WikiGIS.
3. Time in WikiGIS
The WikiGIS database is a spatio-temporal database. The temporal dimension is crucial to WikiGIS because geometric components exist and change over time and the changes must be tracked, stored and available for analysis. A spatio-temporal database is defined as a database that manages both space and time information and captures the spatial and temporal aspects of data by treating geometrical changes in accordance with time [
8].
3.1. Basic Temporal Concepts
3.1.1. Concept of Time
Several concepts of time must be considered in a temporal database. First, a distinction must be established between “Valid-time” and “Transaction-time” [
9,
10]. Valid-time deals with the period of time during which a record is valid and independent of its storage in the database. Valid-time corresponds to both a real and a true fact in the future. Transaction-time is actually the fact-time in the database recorded as data. Secondly, “Real-time” must also be differentiated from “Measured time” and “Time of database”. Real-time is the time of the event in reality, for example a house fire that occurred on 5 May 2011. Measured time is the time of observation by means of special measuring, for example aerial photography taken on 15 May 2011. Time of database is the time of when data is entered into the system (e.g., 30 May 2011).
WikiGIS is bi-temporal because it supports two types of time: “Valid-time” when the act will be true in the future and “Transaction-time” corresponding to the time of data entry into the database equal to the time of data observation. Another time that may be added is “Decision-time”. In this case, WikiGIS becomes multi-temporal.
3.1.2. Existence vs. Evolution of an Entity
The concept of “Existence” is applied to a class of objects (or associative) and is delimited by a “birth” and a “death”. There are several reasons to explain why an object might “die” [
11]. An object can “die” when all its descriptive attributes and geometric data lose their value. An object can also “die” due to changes in value of some of its attributes or geometry. The death of an object might be due to a decision-making process: a decision taken by the person who created it or by a group of users (if this group has the requisite authorization to do so).
The “Evolution” of an object is linked to changes in the object’s state while it exists. There are two types of evolution: descriptive evolution and spatial evolution. Descriptive evolution is related to the attributes of objects: this sort of evolution is the result of changes in value of these attributes. Spatial evolution applies when someone wants to manage some changes in the position and form of the objects. Indeed, the spatial evolution of a modeled element occurs as a result of changes in the value of its geometric attributes. These geometric attributes are used to describe the position, form, size and orientation of an object. The geometrical evolution of the element may have periods of stability (enduring value of the attribute) and periods of continuous change (punctual values of attributes) [
11].
3.2. Models of Time Management
The different models for the spatio-temporal management of data are classified into two main categories: static models and differential models [
12]. Static models allow explicit saving of some states of a space at a time “T”. These states correspond to all new maps or measurements done to represent all or part of this space. Therefore, the final result is stored in the database. Differential models record the initial state of the space mapped at time “T0” and then manage observed changes only. These changes may correspond to differences between the current state and the initial state “T0” or between the current state and any other intermediate registered state. These changes may be explained for a single object or a set of objects in the space. Therefore, the built differential may contain either an updated and complete description of the changed object or only the nature of change (addition, deletion, modification).
When updating a spatio-temporal database, users are usually interested in time management (moment and frequency of updates), as well as in the nature of the changes to the object (addition, deletion, and modification) at the two following levels: initial conceptual level and associated implantation [
13].
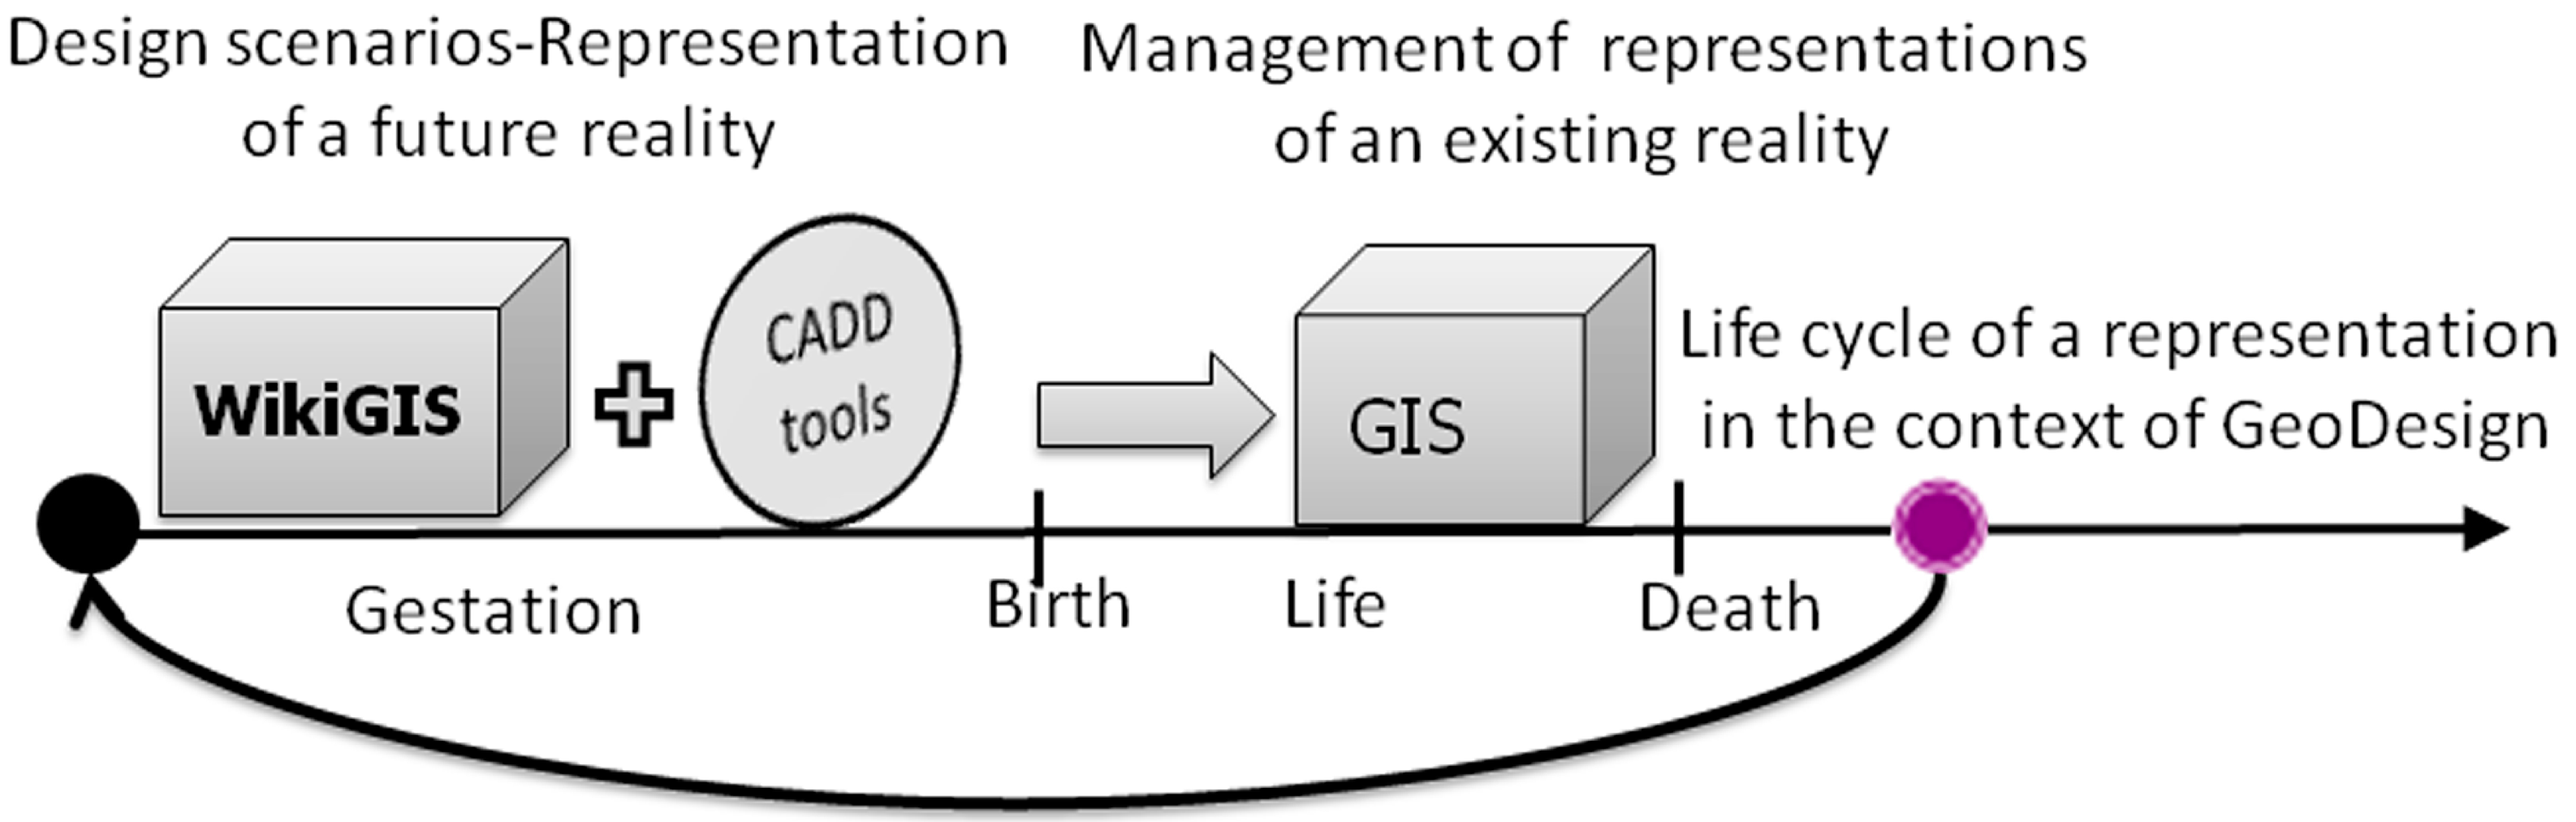
A spatio-temporal database is able to explicitly manage several states of space (past, present and potential future) and make these states directly accessible regardless of their validity period, without using any archiving system. As a solution for managing future realities that serve to feed more traditional GIS databases, the WikiGIS database must keep future states of space (
Figure 3) [
4].
Figure 3.
WikiGIS positioning with GIS (Geographic Information System) and CADD (Computer Aided Design and Drafting) [
4].
Figure 3.
WikiGIS positioning with GIS (Geographic Information System) and CADD (Computer Aided Design and Drafting) [
4].
3.3. Updating a Temporal Database
The integration of the temporal reference increases the complexity of the updating process. This is why versioning techniques were developed [
14,
15,
16]. Temporality can be assigned to different components of a database. It might be assigned to entire tables (table versioning), to each record of a table (tuple versioning) or to each value taken by descriptive attributes (attribute versioning and even geometric attributes in some systems).
Each technique has advantages and disadvantages.
- -
Table versioning (by object classes) is very useful if all occurrences change simultaneously. The full table is then copied when changes in content are detected at a given time. This kind of versioning requires more disk space, but has the advantage of being very simple to perform;
- -
Versioning by occurrence (tuple versioning) is the most common versioning technique: it is used when a record (an occurrence) is copied fully in the same table; then this copy is used to store the update and the old record remains valid in the DB. This is an interesting technique when several attributes of a given occurrence change at the same time. It is simple to implement and query, but it introduces redundancy; unchanged attributes are copied also;
- -
Attribute versioning (versioning by field) method operates with fields. When a field’s value is changed, only the value of this field is updated. This method saves disk space but requires the use of records with variable length and results in a rather complex structure. Often, it requires building new tables to manage the history of attribute value changes.
Choosing one of these techniques is often based on data redundancy and query optimization concerns. In our case, and in the WikiGIS concept context, “versioning by occurrence” appears to be the most relevant choice because it is the simplest. In fact, every proposition to change a scenario or to propose a new one can be considered a different and unique action (rather than the evolution of a previous action). The relationship with previous actions can be dealt with proper relations built into the database. The page is reloaded instantly and current versions are displayed in a “thread of versioning”. By versioning by occurrence, the disaggregation is manageable. For example, user A decides to disaggregate one polygon into two so that later on, user B can edit only one of the two polygons. Indeed, the different changes are considered as unique action and they are handled in a new record.
The WikiGIS database is built as mentioned in
Table 2.
Each version is considered as an occurrence. The fields of ID_current primitive and ID_previous primitive help in making the request in both directions: up and down. They indirectly help draw the evolution of the entity. The ID machine of the entity and ID_previous primitive are reordered automatically, but the ID_current primitive must be indexed. Creating an index supports the temporal structure [
16]. The index offers quick access to values in a column. By adding a new record to a table, the index is reordered automatically.
Table 2.
Structure of WikiGIS’s Database.
Table 2.
Structure of WikiGIS’s Database.
| Field | Detail |
|---|
| ID_user | Created by users |
| Full entity | The object under discussion |
| Global geometry | It could be a point, line, polygon, circle, etc. |
| Geometry | The form that defines the entity |
| d_d | The time of recording the entity in the DB= the date of observation |
| d_f | The time of death of the entity when the user or a group of users decides to do it = the time of decision making |
| Title | Each contribution must be titled by user |
| Description | The user should give a brief description of his contribution |
| Argument | The user must explain why he edits, with what intention and on what basis. The argument is the strongest standard for validating an input |
| Current primitive | The current form that takes a part and/or the whole global geometry |
| Previous primitive | This is an earlier form that takes a part and/or the whole global geometry |
Table 3 provides an illustration of how to manage time in the WikiGIS database through a simple use case. In the following example, a user group discusses the geometry of a large nursery for children under construction. Users express their opinions that, in fact, refer to different versions of a single geometric entity (a polygon in this case). The project starts: the first actor proposes a simple square form and provides an AutoCAD plan as argument. The second contributor proposes to divide the polygon into two departments and supports his proposal with a video. The first actor likes the idea of two departments but proposes two floors. The third actor only proposes to change downstairs for esthetic reasons. The fourth actor proposes a garden between the two departments. The fifth actor does not agree with the last proposal. The sixth actor agrees with the third proposal and adds a garden at the front of building. The project continues and the actors give their opinions until they arrive at a consensus or a stakeholder makes a decision to end the project.
4. Traceability Issues
How to navigate the history of contributions has been the subject of many recent studies [
17,
18,
19,
20]. Several studies have answered this issue by establishing a linear “timeline”, as in the first WikiGIS prototype [
21] and [
5], in OSM by “heat map” [
20], in GeoDeliberator [
22] and in WikiBio [
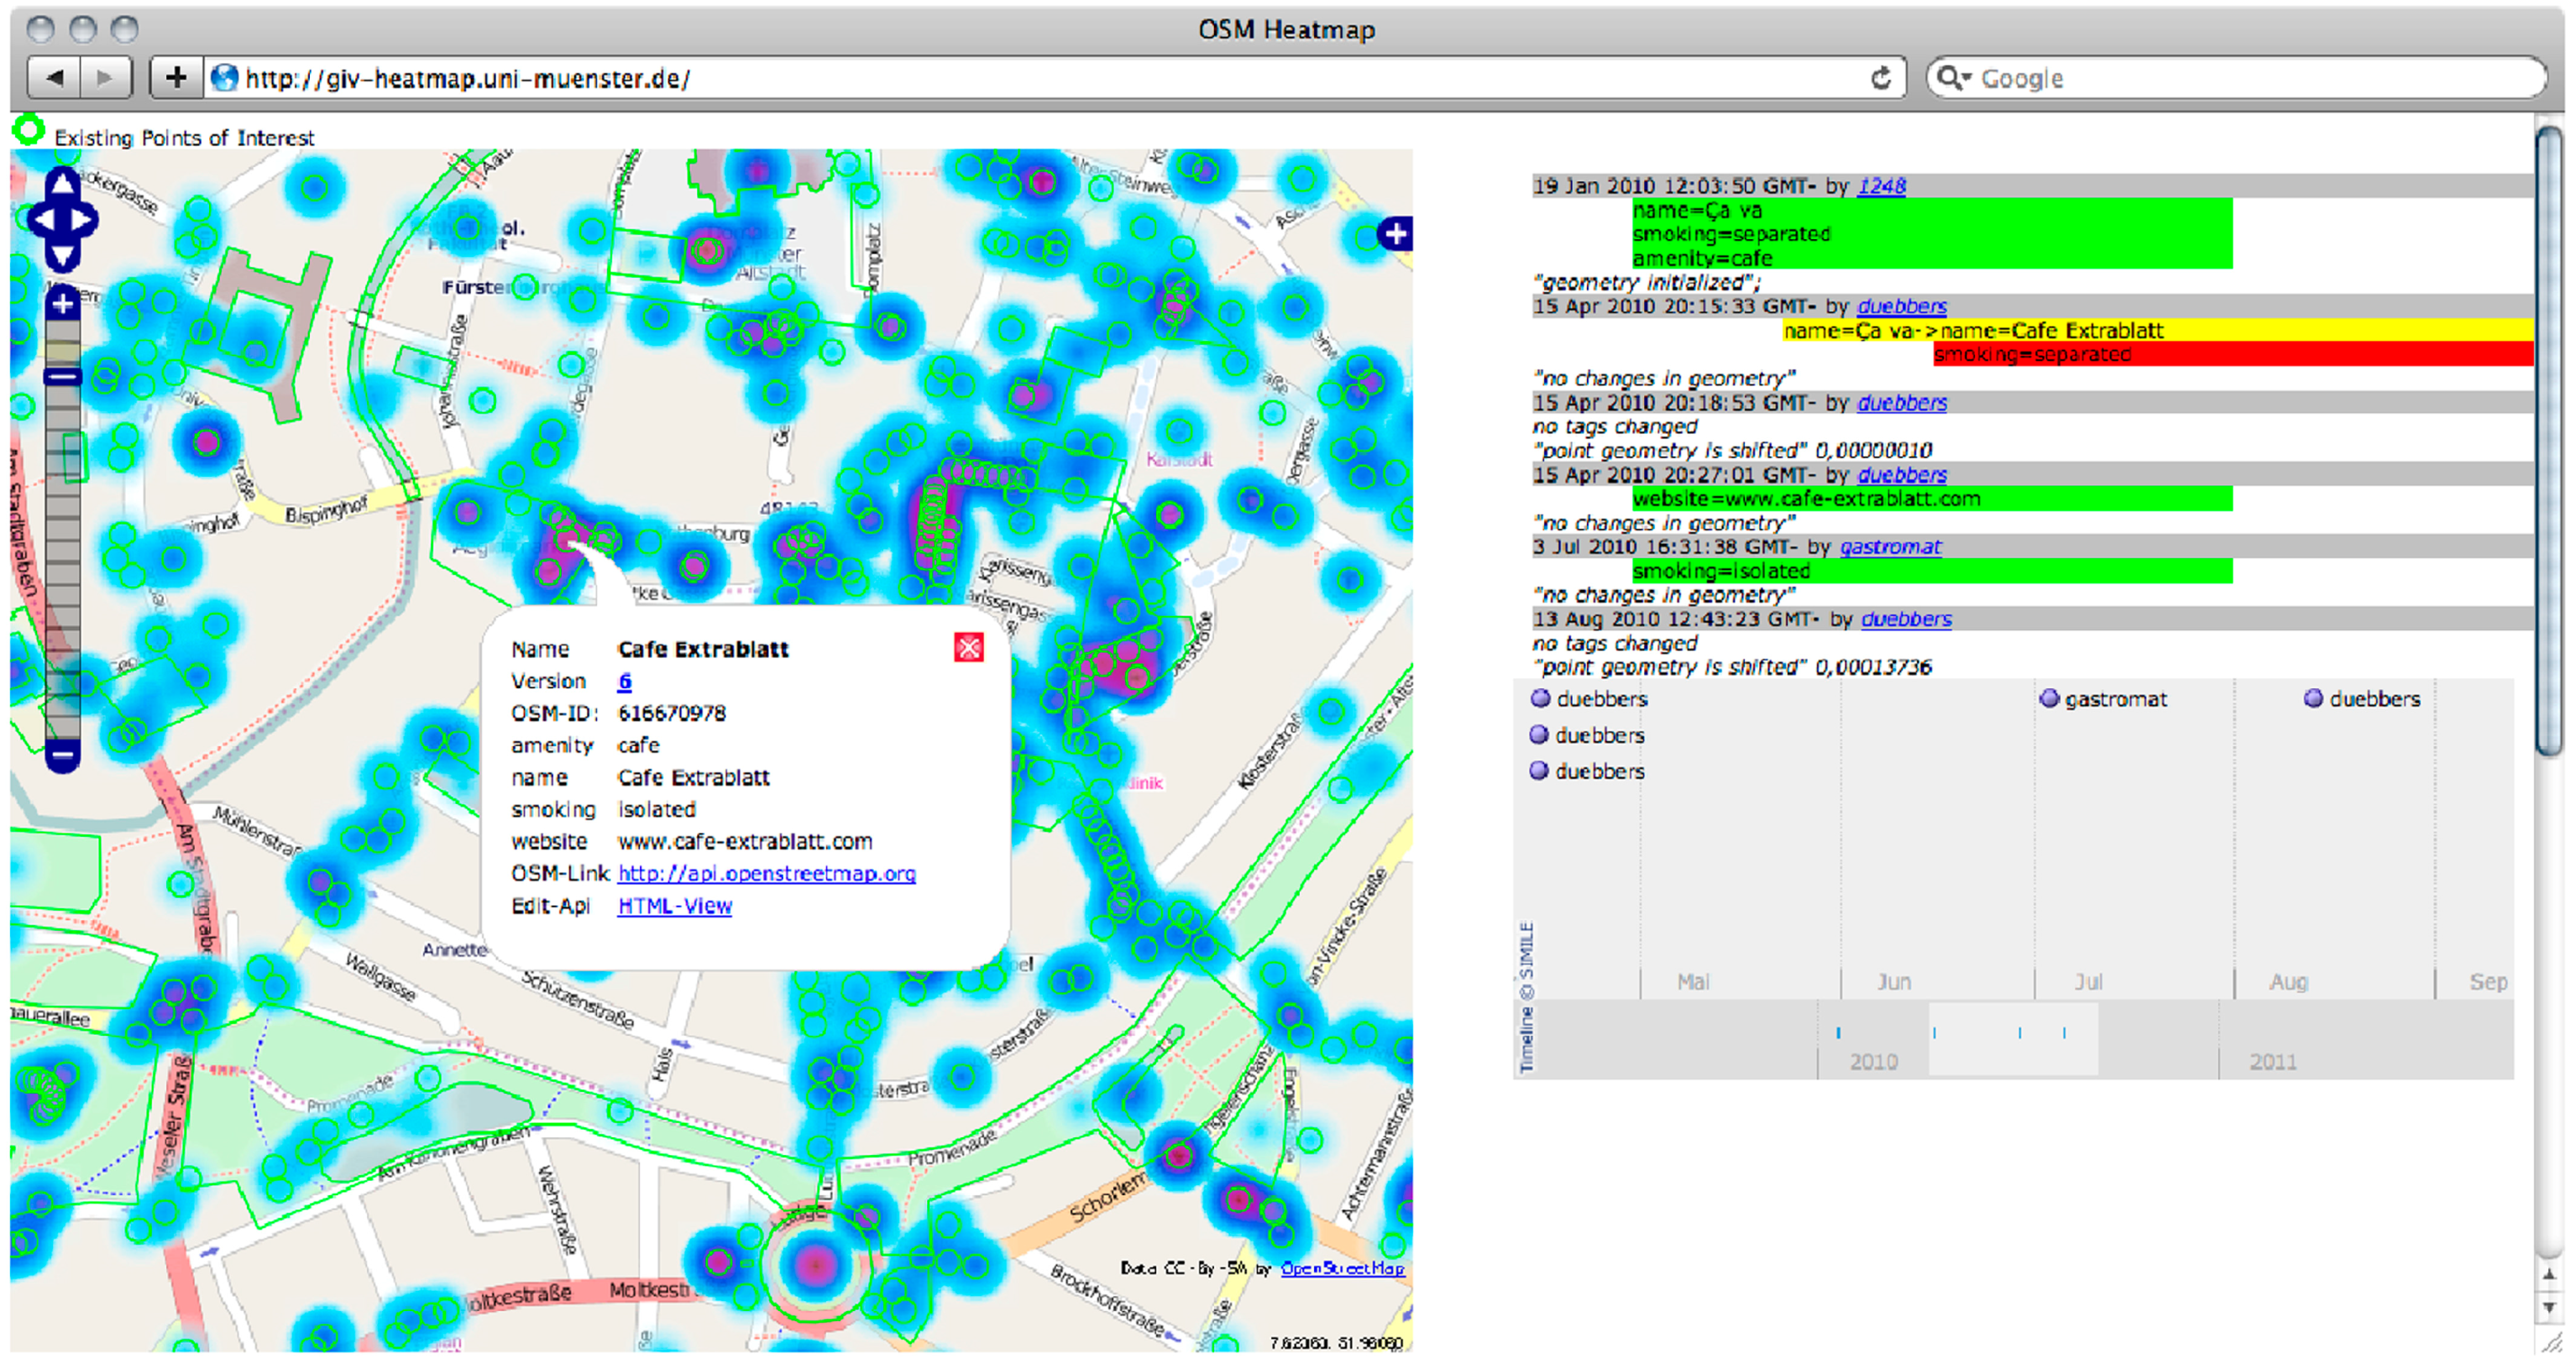
23].
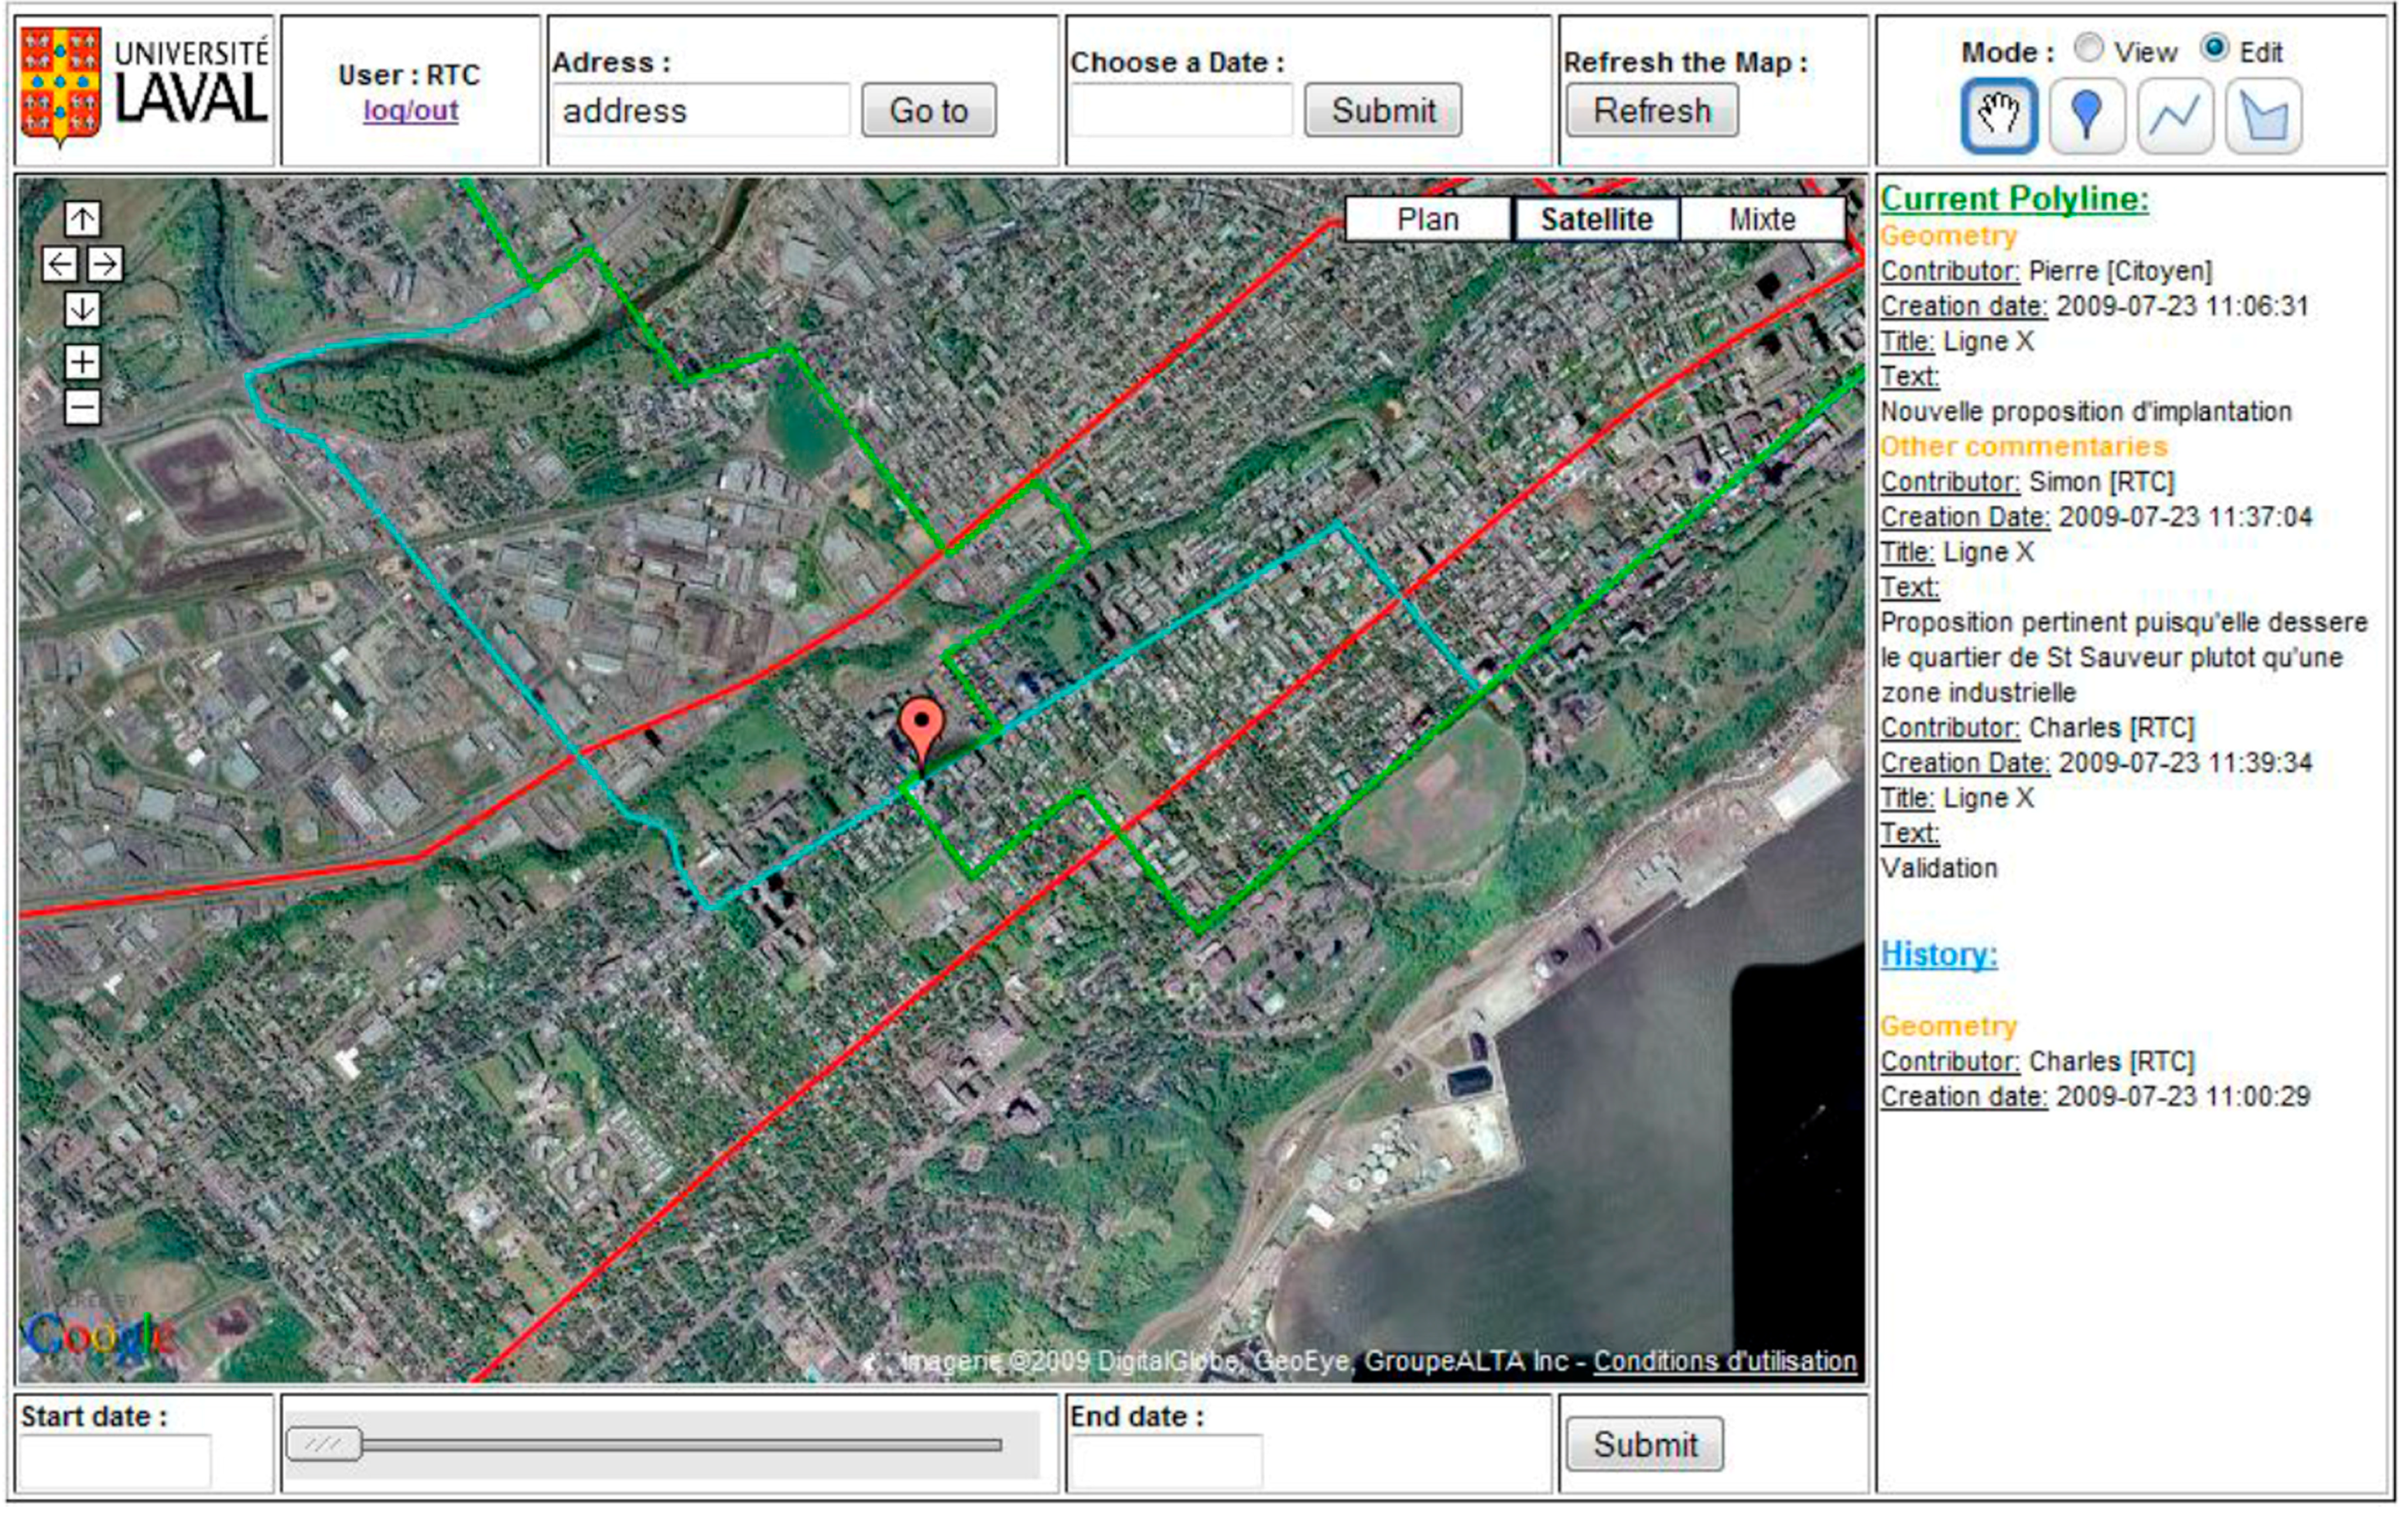
The WikiGIS prototype developed by [
21] supports “navigation into the process” using a linear temporal slider between a start date and an end date and showing the evolution of objects (down of map in
Figure 4). The “heat map” (
Figure 5) is a vector layer overlaid to OSM. Through this layer, the user can find information about the selected point of heat location. By clicking on the point, the complete history appears next to the map: additions are displayed in green, modifications in yellow and deletions in red. The timeline at the bottom right of
Figure 4 provides a temporal overview of the track editing of that object [
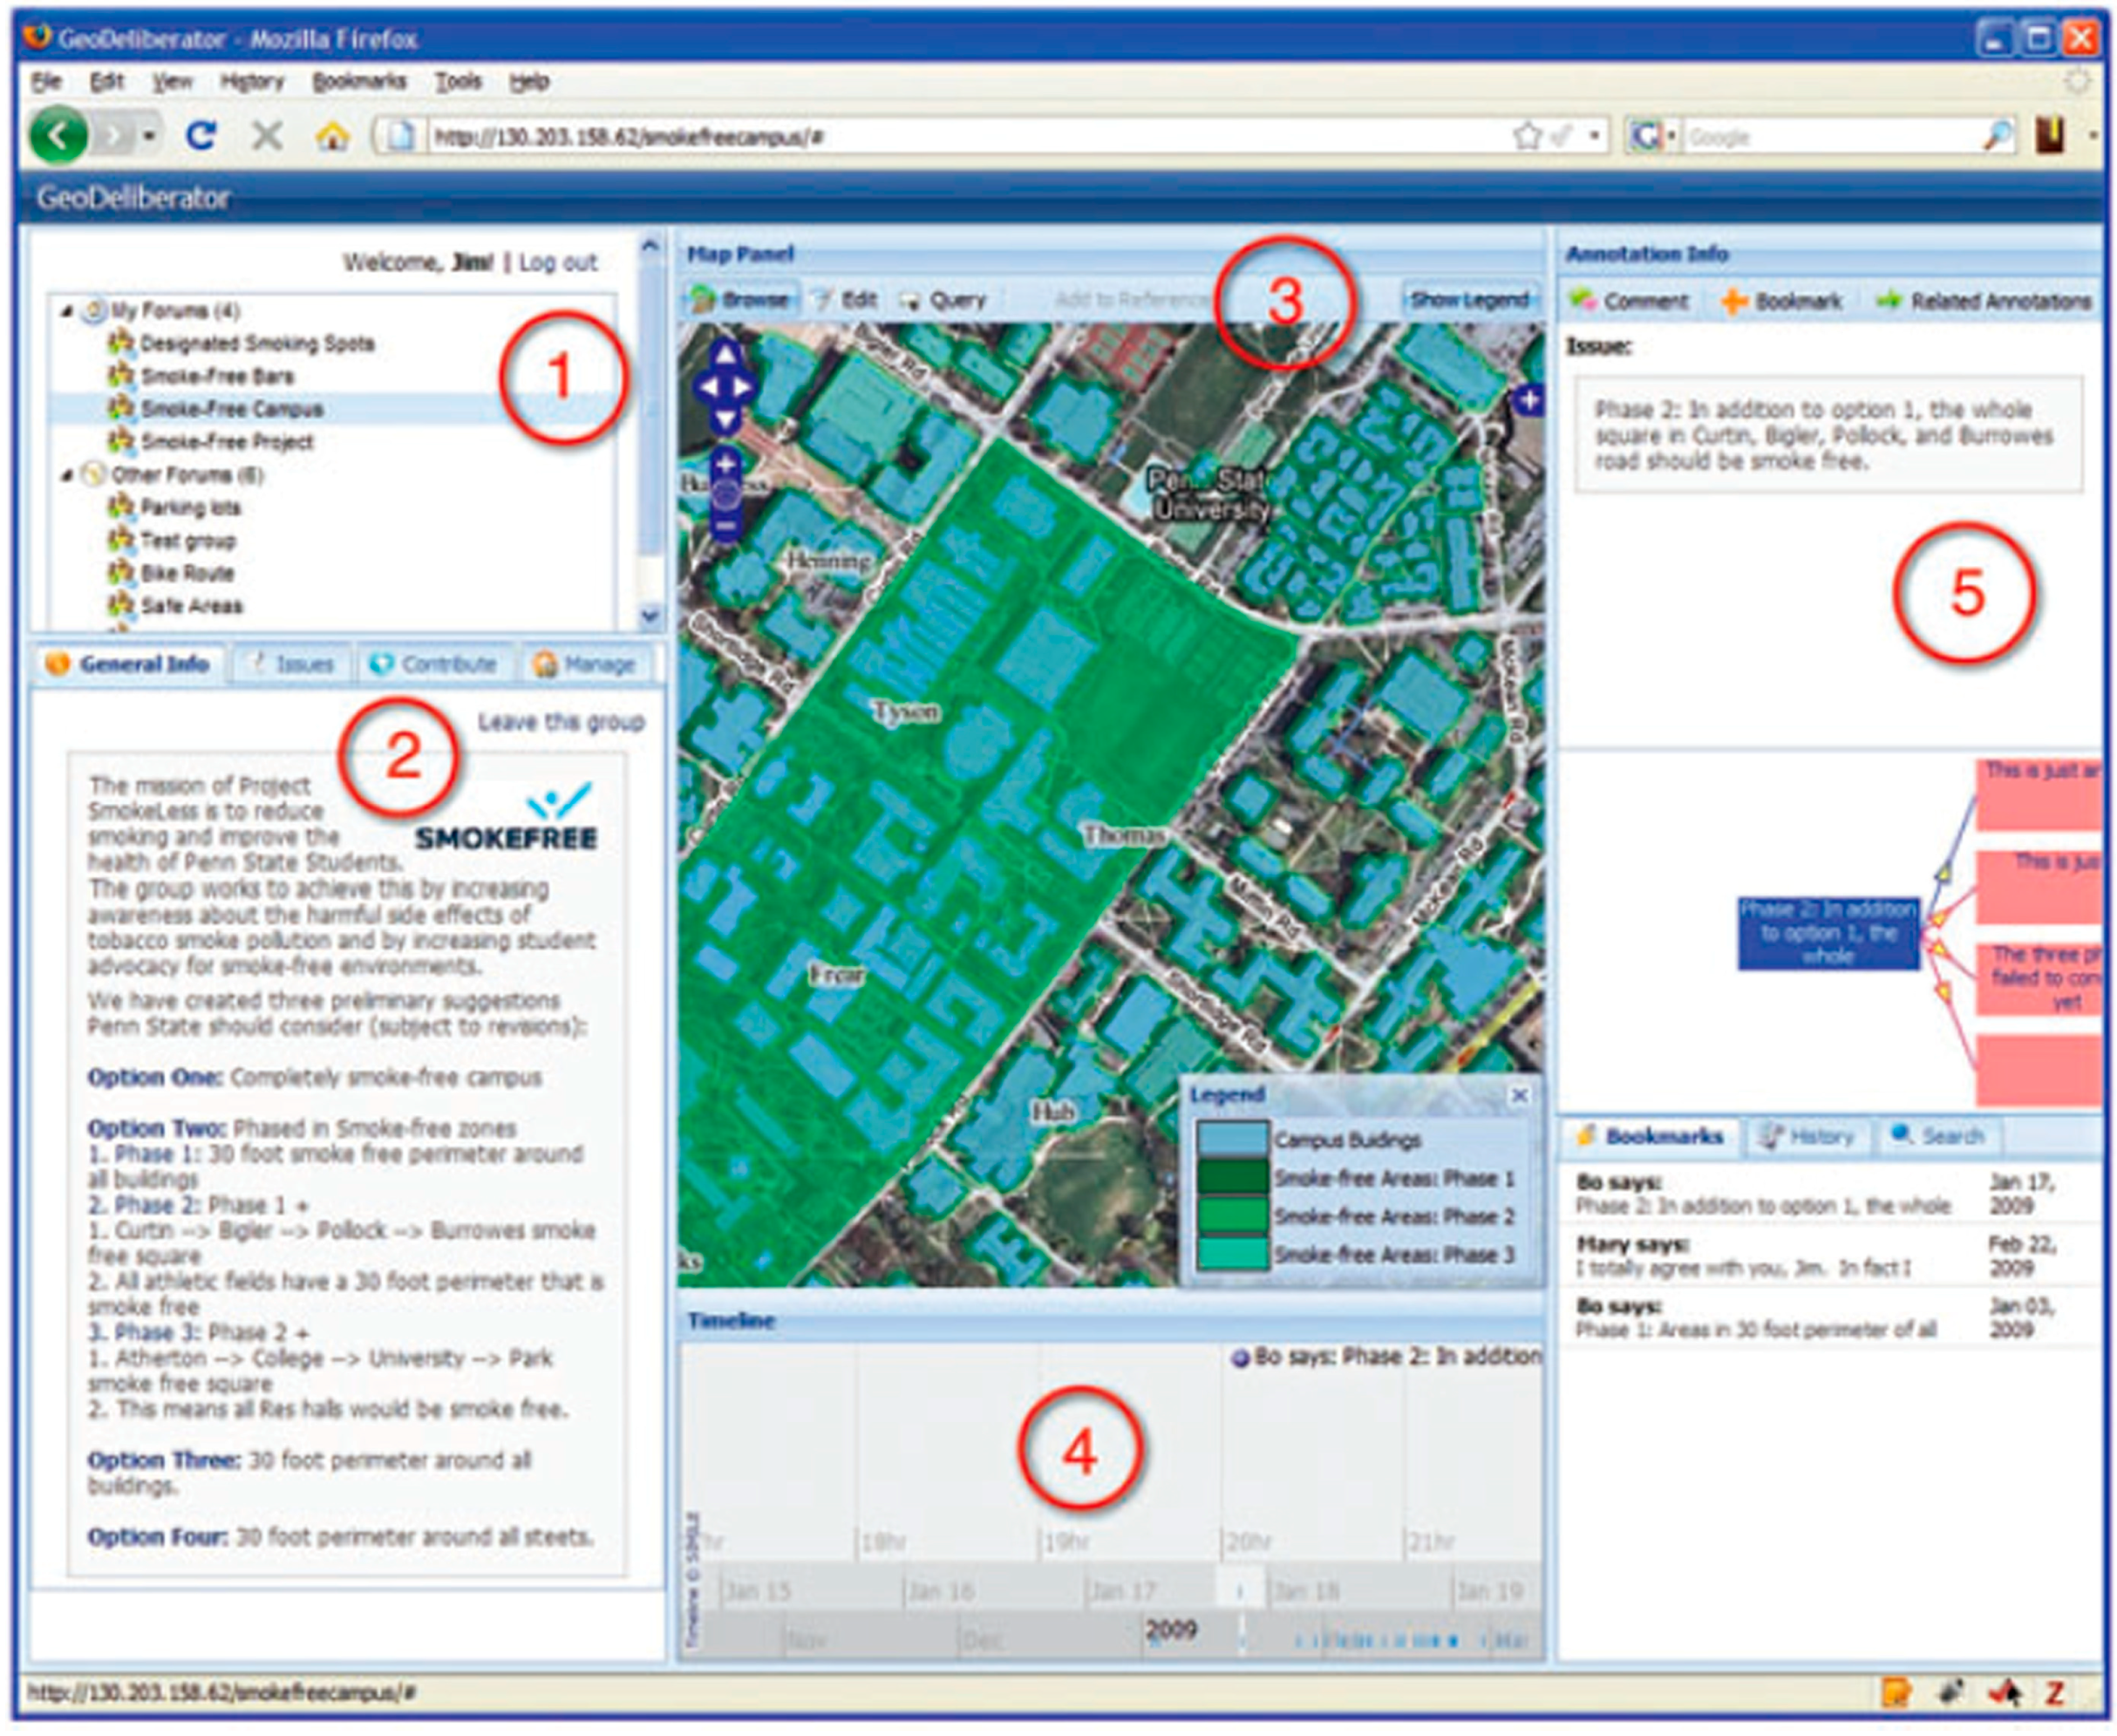
20]. The timeline developed by [
22] for GeoDeliberator corresponds to the timestamp of the annotation’s creation. This prototype is built on the roots of “Annotation GeoDeliberative Technology (GeoDAT)”. This is a system designed to capture, manage and visualize spatial annotations in order to support public deliberation (
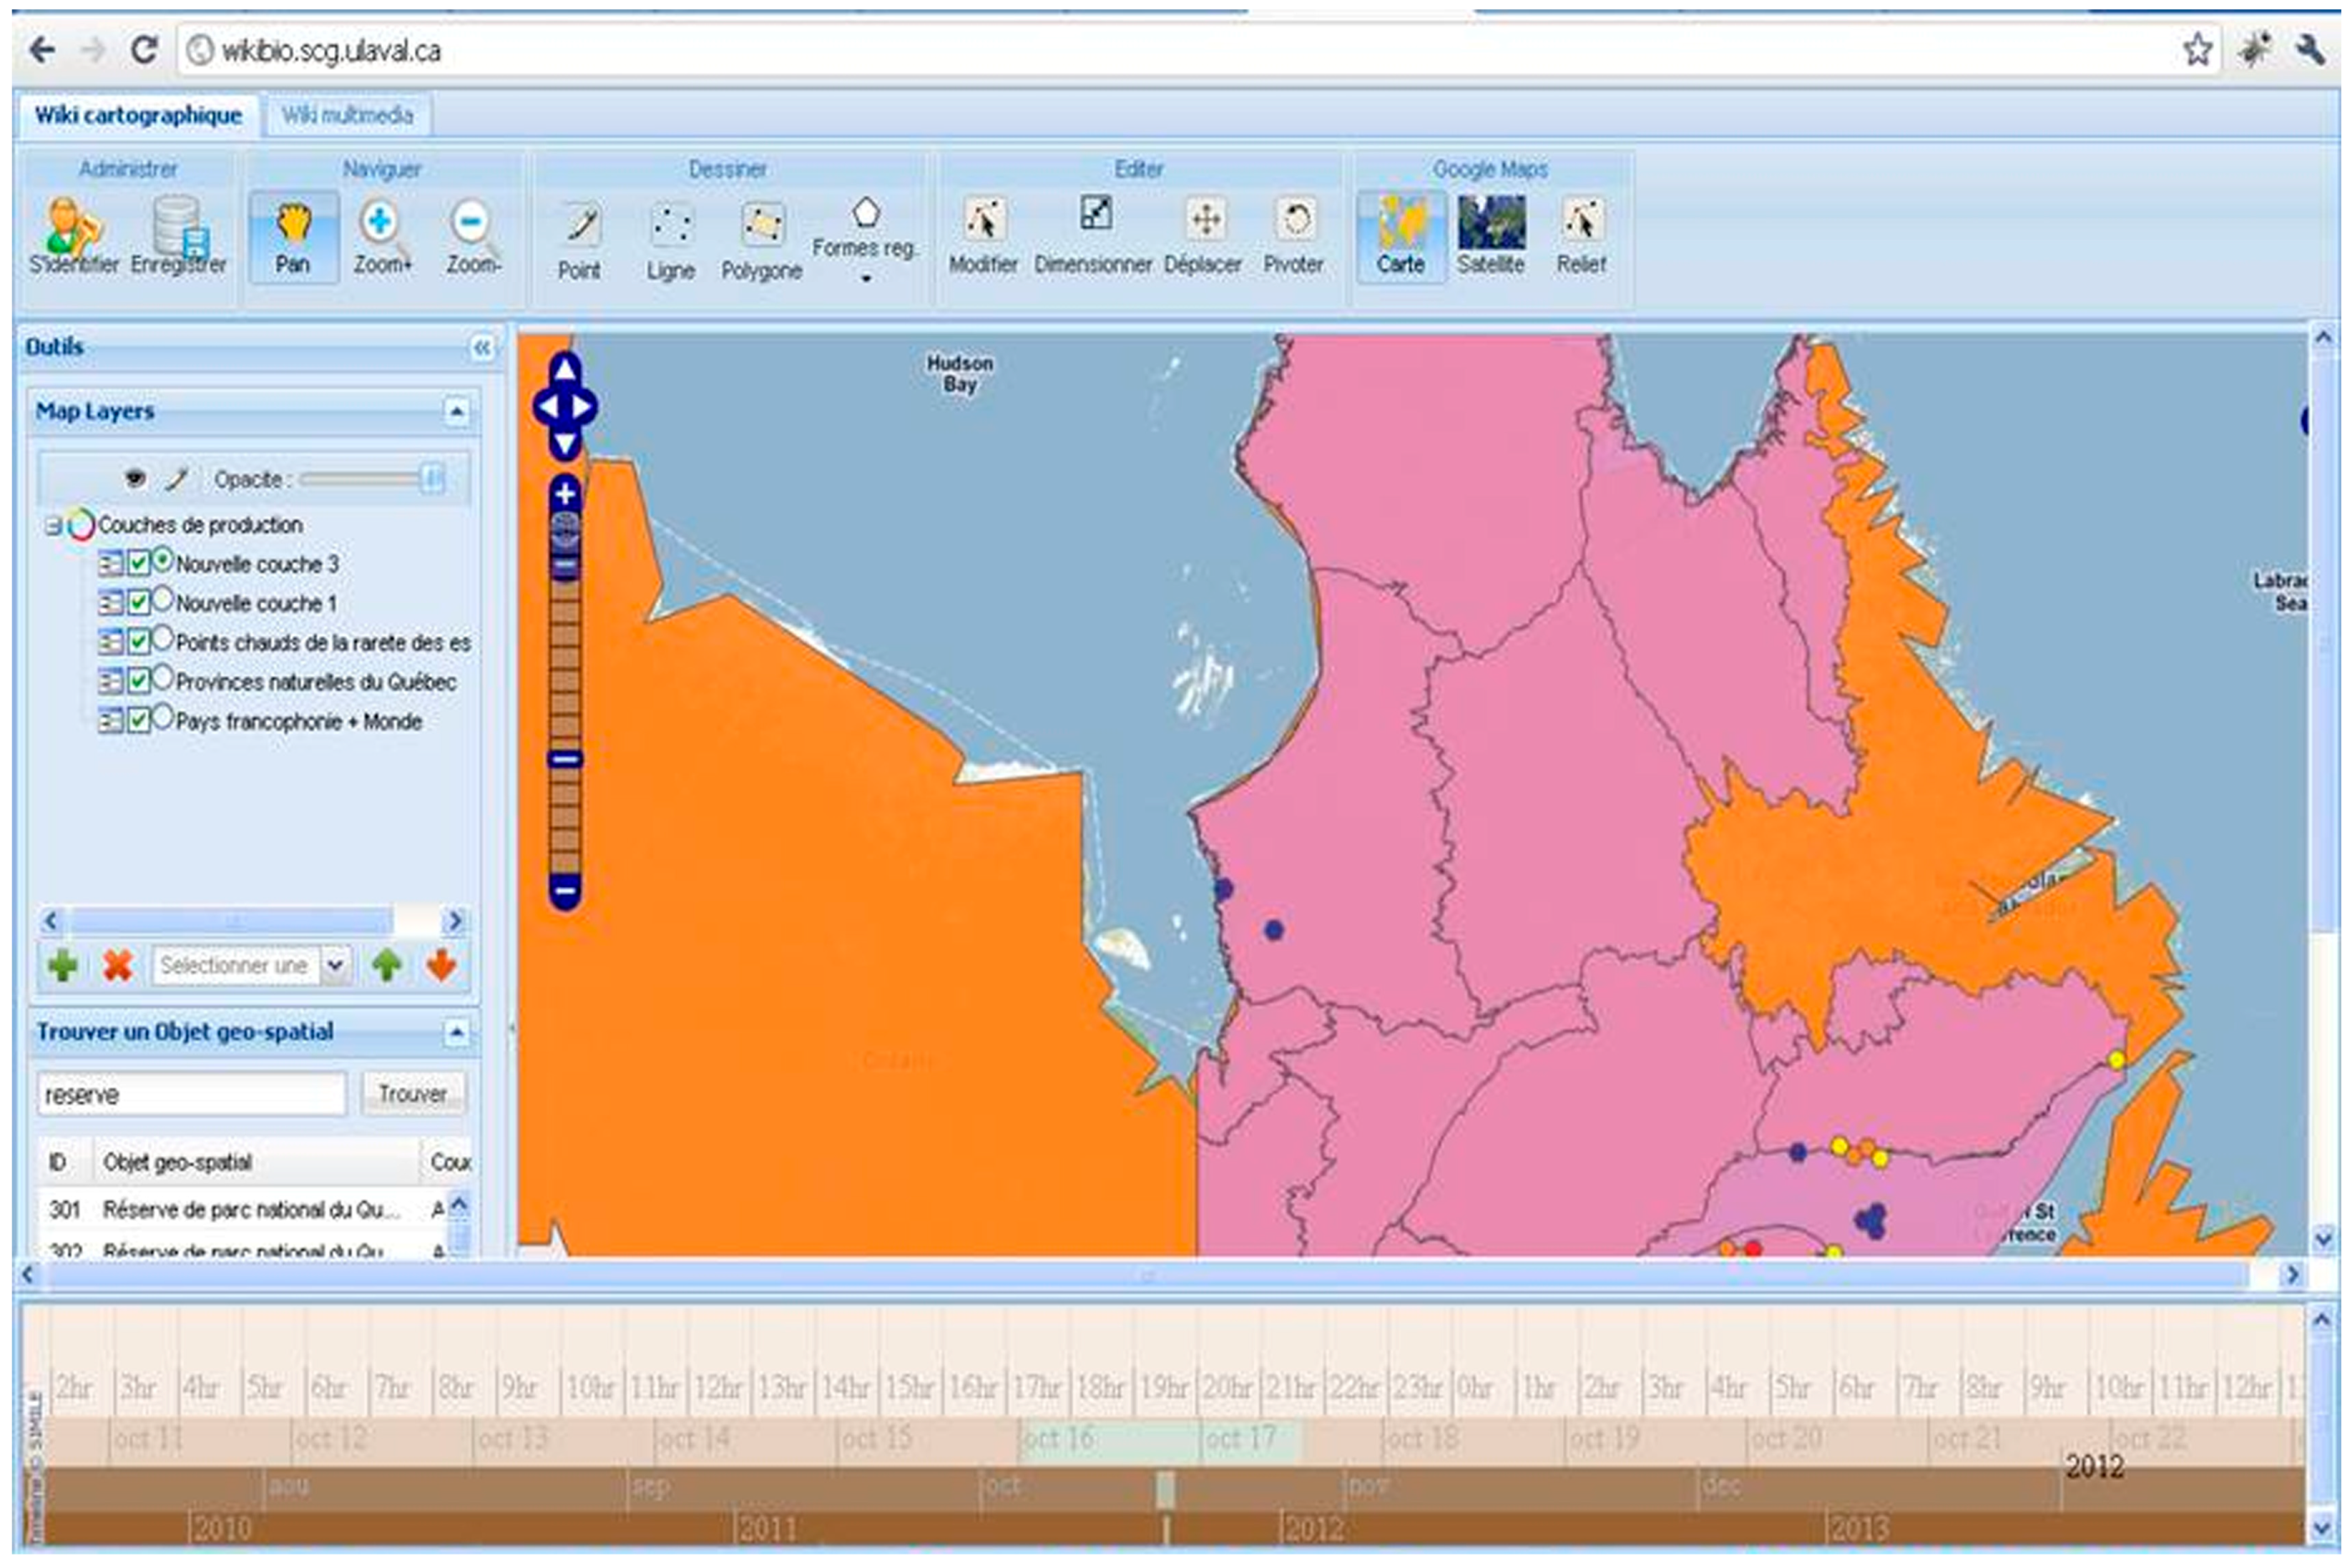
Figure 6). WikiBio [
23] is a prototype of dynamic and cartographic wiki dealing with biodiversity in francophone countries (
Figure 7). The timeline implemented here is based on work done previously at MIT (Massachusetts Institute of Technology). The open source code has been modified to make its integration with an online GIS more workable. The temporal exploration of event data is carried out by scrolling with the mouse wheel on one of the four temporal bands (Year, Month, Day, Hour) or by double-clicking on it. Moving the temporal window to the target date automatically updates the map by displaying objects that have fixed dates, and hiding those that do not.
The versioning method applied in the above applications is based on a hierarchical organization, such that subsequent versions are derived from previous versions according to a linear timeline. In wiki, the temporal navigation is not linear, but follows the form of a tree. WikiWikiWeb server technology enables the creation of associative hypertexts with non-linear navigation structures. Typically, each page contains a series of cross-links to other pages [
6]. This approach is used later as a fundamental concept of WikiGIS.
Table 3.
WikiGIS database.
Figure 4.
Cartographic interface of the first WikiGIS prototype.
Figure 4.
Cartographic interface of the first WikiGIS prototype.
Figure 5.
OSM editing heat map, with editing history and timeline of the selected feature on the right.
Figure 5.
OSM editing heat map, with editing history and timeline of the selected feature on the right.
Figure 6.
GeoDeliberator’s User Interface: (1) User and Group Panel; (2) Project Panel; (3) Map Panel; (4) Timeline view; (5) Annotation info.
Figure 6.
GeoDeliberator’s User Interface: (1) User and Group Panel; (2) Project Panel; (3) Map Panel; (4) Timeline view; (5) Annotation info.
Figure 7.
Cartographic interface of WikiBio.
Figure 7.
Cartographic interface of WikiBio.
5. Contribution Qualification Issues
Since the emergence of Web 2.0 after the O’Reilly conference in 2004, collaborative sites have increased and shown their usefulness in maintaining public knowledge bases. However, one of the most common concerns regarding these types of information sources is their quality and credibility, particularly because almost anyone can change the content [
17] and [
18]. The W7 model proposed by [
17] is based on the ontology of Bunge. This model is built on the concept of traceability of the object’s changes during its lifecycle. It refers to data origin data using seven essential questions: What, When, Where, How, Who, Which and Why. The definition of each question is given by Ram and Liu in [
17] in
Table 4.
Table 4.
Definition of the seven Ws (Source: [
17]).
Table 4.
Definition of the seven Ws (Source: [17]).
| Provenance element | Construct in Bunge’s ontology | Definition |
|---|
| What | Event | An event (i.e., change of state) that happens to data during its life |
| How | Action | An action leading to the events. An event may occur, when it is acted upon by another thing, which is often a human or a software agent |
| When | Time | Time or more accurately the duration of an event |
| Where | Space | Locations associated with an event |
| Who | Agent | Agents, including persons or organizations involved in an event |
| Which | Agent | Instruments or software programs used in the event |
| Why | - | Reasons that explain why an event occurred |
Not only can the study of data sources provide useful information such as the source and ownership of data, but it can also identify the credibility of created data or measure the expertise of users by analyzing their contributions and personalizing the metric measures of credibility for user profiles. Providing online meta-data can offer a transparent space and increase opportunities for exchange.
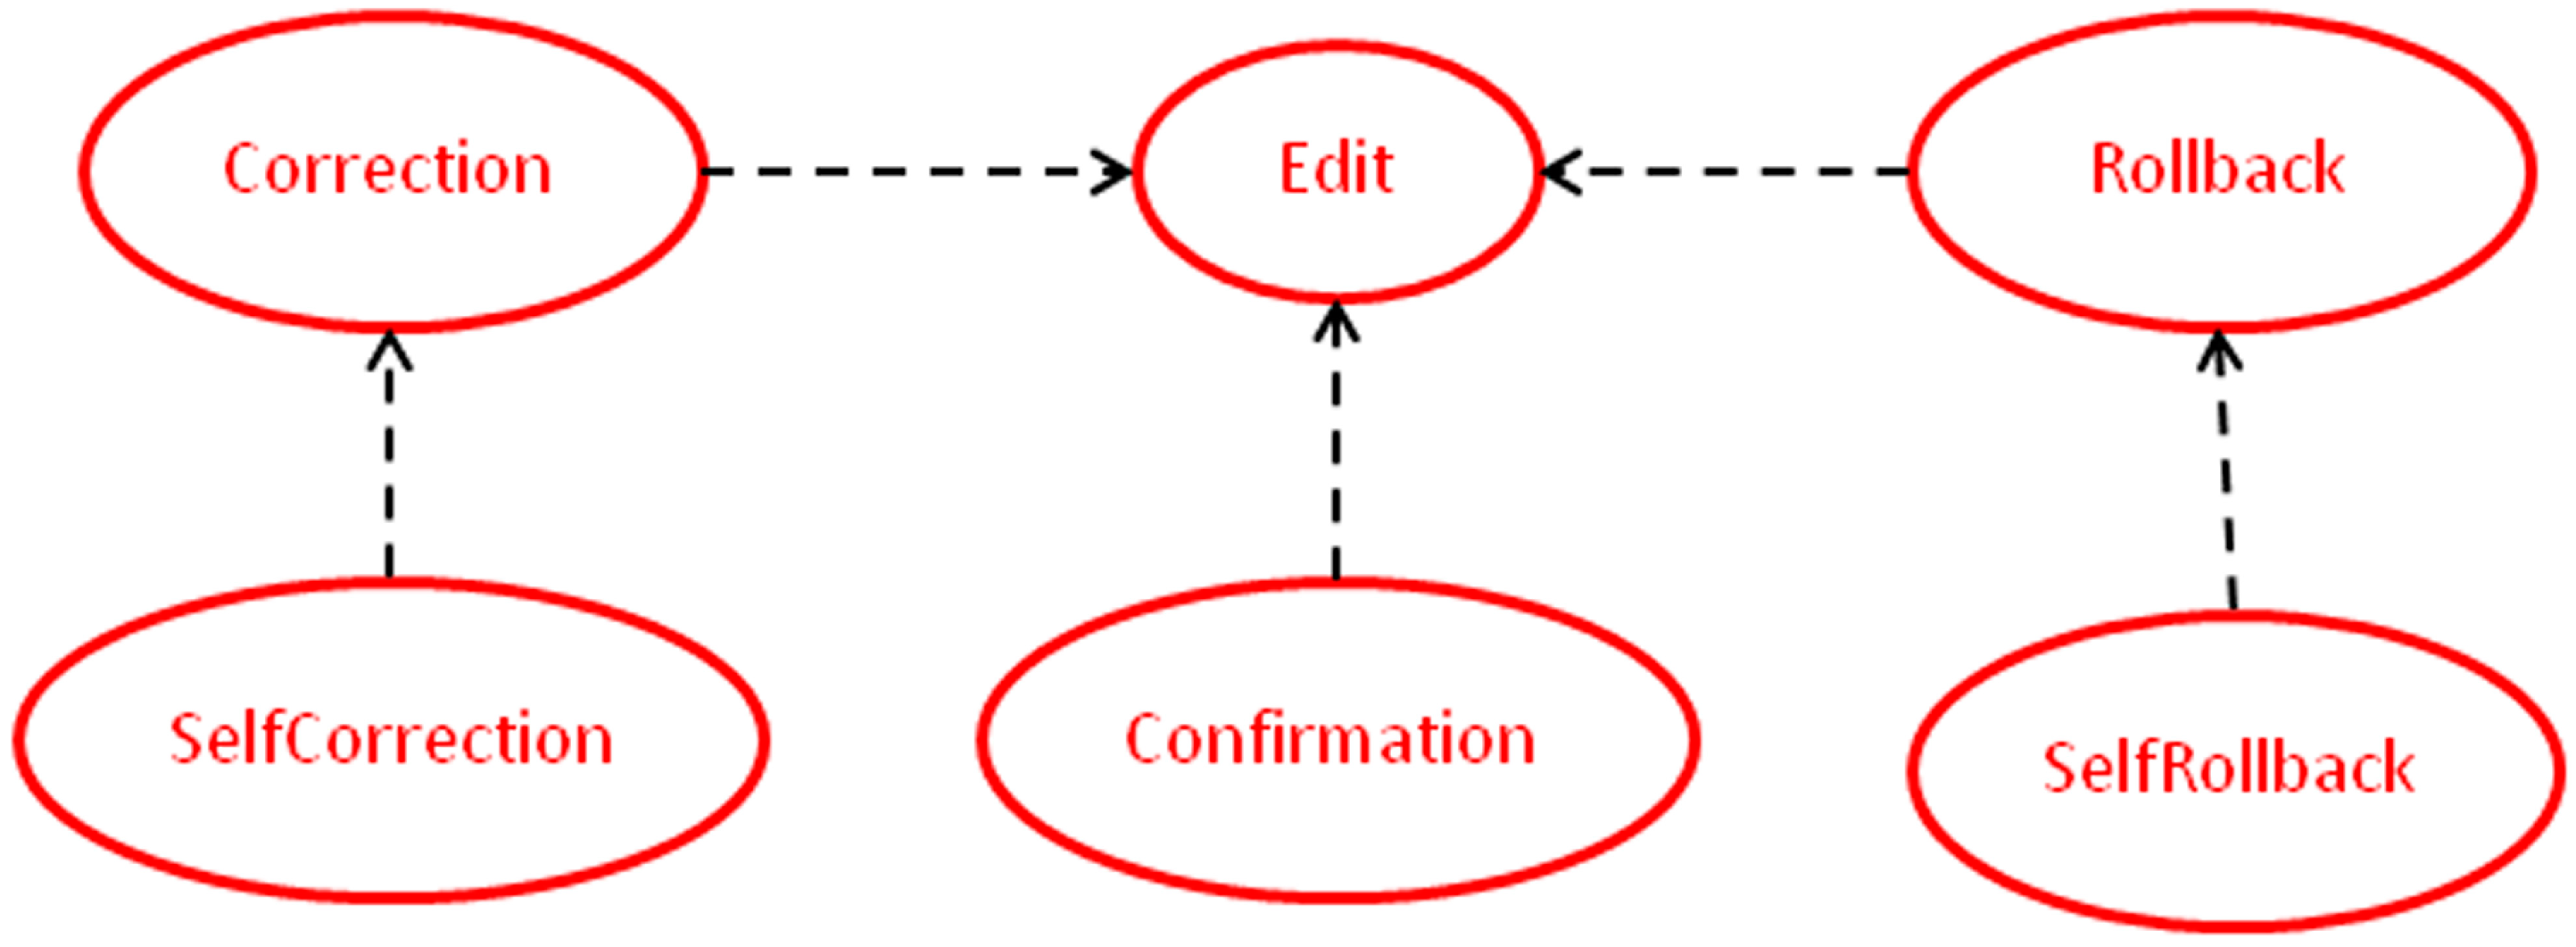
Use of the trustworthiness of objects in Open Street Map to ensure data quality is an interesting method. The main idea consists of analyzing each editing design (
Figure 8) and discussing its effects on the credibility of the object and reputation of the contributor [
17] and [
18].
Table 5 provides a brief overview of the different edit classes [
18] and [
19].
For each page, the script identifies the top contributors (identified as the ones who made the best edits). To achieve this, the following statistics are computed. Script gives an idea of the reputation of the user and the reliability and credibility of his contribution.
- -
Total number of edits;
- -
Number of geometries added;
- -
Number of edits removed;
- -
Number of modified edits;
- -
Number of confirmations;
- -
Number of corrections;
- -
Number of rollbacks;
- -
Number of self-rollbacks.
Figure 8.
Patterns as subclasses of the Edit class (Source: [
18]).
Figure 8.
Patterns as subclasses of the Edit class (Source: [
18]).
Table 5.
Patterns as subclasses of the Edit class (Source: [
18]).
Table 5.
Patterns as subclasses of the Edit class (Source: [18]).
| Pattern | Action | Trustworthiness | User’s reputation |
|---|
| Confirmation | The absence of negative feedback is considered as a confirmation of the feature data correctness | A passive confirmation that only affects a feature's trustworthiness | An active participation increases a user’s reputation |
| Correction | If wrong or low-quality information added is corrected by another user | | A user’s reputation decreases when the edition is corrected subsequently |
| Rollbacks | A rollback is defined by three subsequent versions of a feature, where the first and last of the three subsequent versions of a feature are identical | It decreases because of the loss of persistence | Corrections should intuitively decrease a user’s reputation if they revert a feature to an earlier state |
| Self-rollbacks | Special cases of rollbacks where the user makes corrections to his own updates | Evaluations are needed to verify the credibility and reputation |
6. Deltification Function
In a wiki environment, different versions of a same article are fully recorded with a specific version number. The editing potential of hundreds of different versions of the same article justifies the interest of being able to quickly and easily compare two versions and only display (cartographically in the case of WikiGIS) their differences. We regroup the computing, storing and transferring the differences between versions under the term “deltification”.
The deltification function, dedicated to texts (words), is based on different algorithms used to compare two files and display their differences. Some of those algorithms are paid: Araxis Merge, Beyond Compare, code compare, compare + +, Duplicate Annihilator,
etc. Other algorithms are free: diff, diff3, Ediff, Tkdiff, WinMerge, Kompare, UCC,
etc. Some are web-enabled: Web Diff, Diff Cheker or Pretty Diff [
24].
Table 6 provides an overview of the analysis that we conducted to compare some of these free algorithms in order to choose the most suitable for implementation in the WikiGIS.
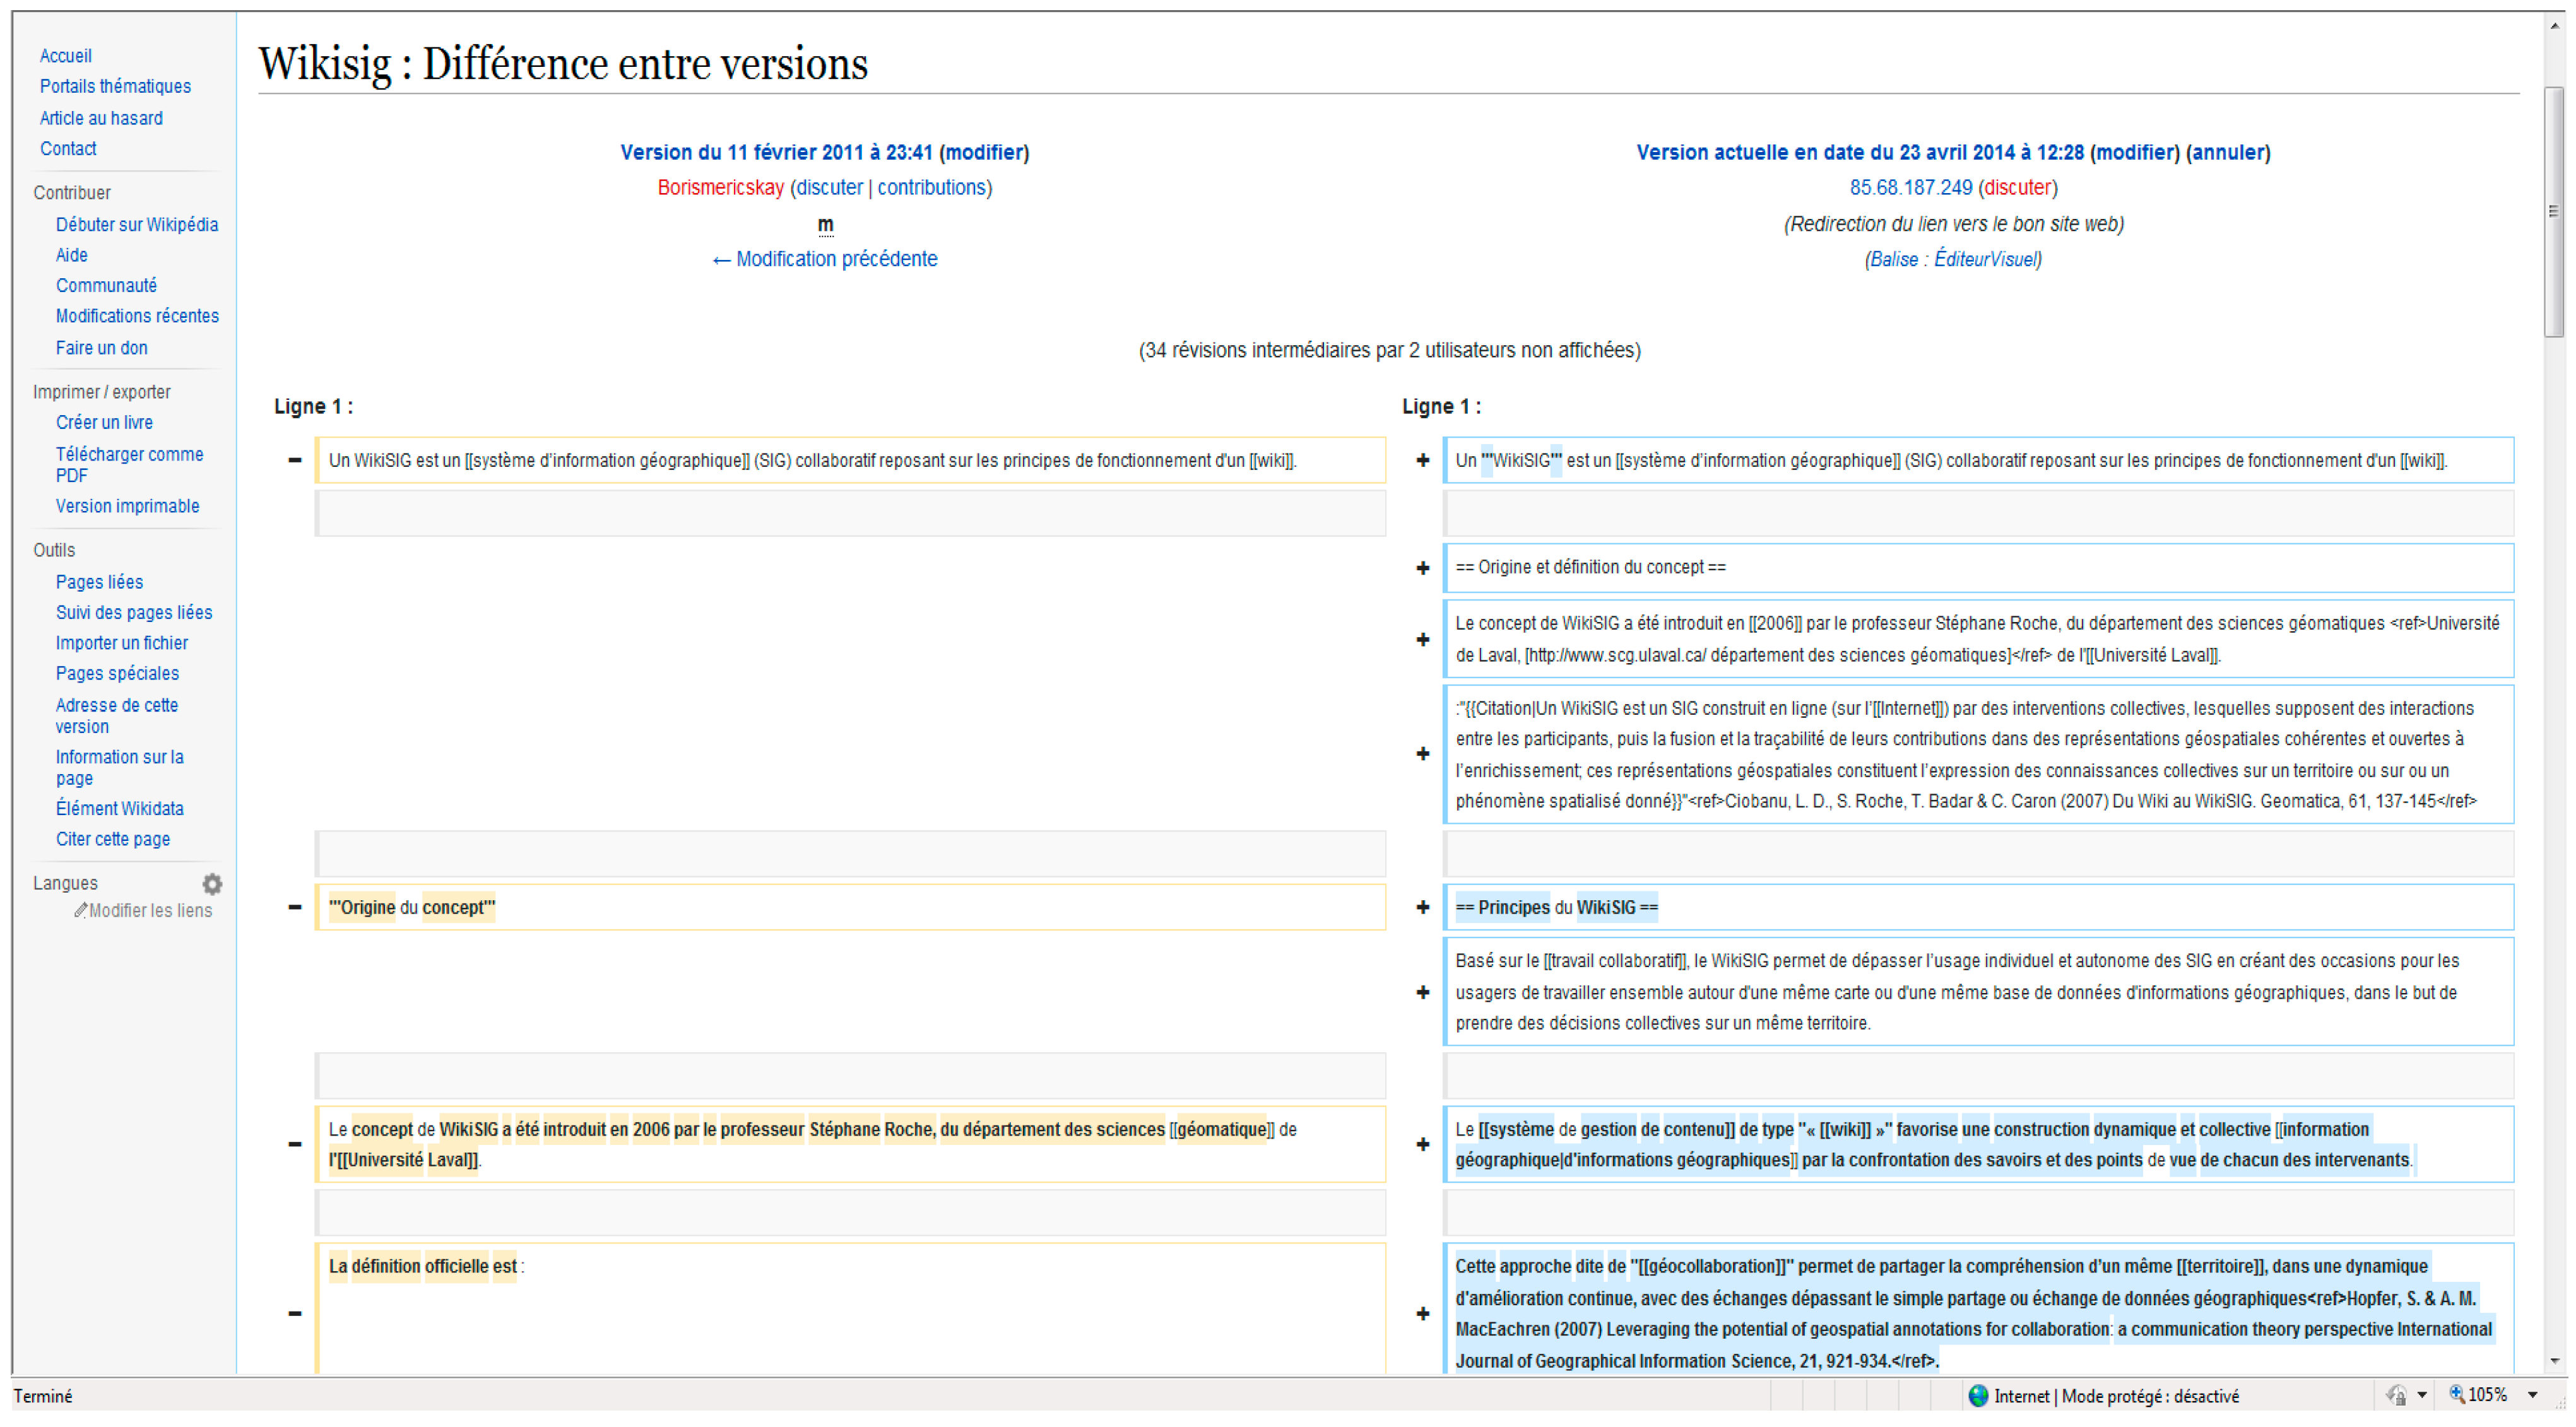
The diff function allows comparison between two texts. The diff algorithm is popular because it compares two files and displays their differences, and it works with the three major operating systems (
Figure 9). For this reason, we adopted this technique in WikiGIS.
Table 6.
Comparative table of free diff algorithms [
24].
Table 6.
Comparative table of free diff algorithms [24].
| Algorithm | Creator | Principe | Strengths | Weaknesses |
|---|
| Diff | AT & T | It displays changes made per line for text files and supports binary files | It works with Windows, Macintosh (OSX) and Linux; it compares directories | −2GB ≤ Max supported-file size ≥ 64 bits; compares only 2 files; no merge |
| Ediff | M. Kifer | Its shows in line changes | It works with Windows, Macintosh and Linux | |
| diff3 | AT & T | It compares 3 files and shows any differences among them | It compares 3 files; able to merge files | 2GB ≤ Max supported-file size ≥ 64 bits |
| Kompare | Otto Bruggeman | It compares 2 different text files or 2 directories | | It works only with Mac OSX and Linux; compares 2 files only |
| Tkdiff | | A graphical diff viewer based on the tk framework | | It works only with windows 95 and up; no merge |
| WinMerge | | It compares and merges text-like files | It merges files | WinMerge runs with Microsoft Windows |
Figure 9.
Diff function applied for comparing two texts in Wikipedia [
25].
Figure 9.
Diff function applied for comparing two texts in Wikipedia [
25].
For the geometric component, we propose a method of comparison (spatial deltification) based on the “base state with amendments” method proposed by [
26] and updated by [
27]. The principle of this method is quite simple: a complete record of the study area at t0, termed the base state, is created. Changes that have occurred since the previous update are recorded, at appropriate intervals, in new database layers known as amendments. The intervals used to create the amendments do not have to be regular. To determine the situation at a certain date ti, all the amendments recorded between the date ti and t0 are overlaid onto the base state.
The method proposed for WikiGIS follows the same logic of “base state with amendments” except that the comparison is made by overlaying any layers recorded between t0 and ti. The user is then able to edit and view the changes on a new layer. According to Langran [
26], the temporal structure is evident with this model; errors can be trapped and redundancy is minimal. However, complex changes would require a large number of layers. Reproducing the pattern at a certain date would require a large number of time-consuming overlay operations to be performed. Indeed, the overlay operations increase while the number of layers of update increases [
28].
7. Conceptualization of WikiGIS by Using UML Diagrams
UML (Unified Modelling Language) is a graphical modeling language [
29]. It supports an additive and iterative process that reaches the level of granularity determined by the analyst. It defines 12 types of standard diagrams chosen by the developers according to the type of application: use case, activities diagram, classes diagram, sequence diagram, collaboration diagram, components diagram, deployment diagram, state-transition diagram and objects diagram. To conceptualize WikiGIS, we chose four diagrams: class diagram, activities diagram, and sequence diagram and use case.
7.1. Class Diagram
The first step was to design a spatio-temporal conceptual model independent of any type of implantation. The CIM level (Computation Independent Model) of MDA (MDA: Model-Driven Architecture) is indeed the highest level of abstraction in modeling. The use of intuitive pictograms independent of any ontology or standard (independent of any specific natural language) facilitates the translation of database models. The use of formal ISO 19110 labels [
30] also facilitates communication. At this point, no artifacts of technology and no element of standardization must occur unless they are useful and intuitive. When the CIM is well defined, it can be translated and enriched to produce models with lower and semi-automatic levels. The model is represented by classes, packages and associations.
In this design phase, we explicitly present the different components of the WikiGIS database. The model includes two packages: territory and entity. The territory includes the geographic area of study that varies with the scale of the project (country, town, district,
etc.). The territory is represented by a generalization. The user must choose his country from a box containing all the countries of the world and can further specify the territory, province, city, region and district
etc. A user is geographically limited by legal constraints, for example, a political actor of District A cannot intervene (create objects) in District B even if he can see the data of B. In the second package, the entity may be a point (defined by its coordinates x and y), a poly-line (defined by two summits) or a polygon (defined by four summits). All types of objects are generalized in the super-class “geographical entity”. The geometry of the object changes over time and this is why it is associated with a temporal pictogram. We can add other forms such as an ellipse, circle, triangle,
etc. To better differentiate between these entities, we offer a variety of colors for lines and backgrounds, different line thicknesses, transparency, symbols,
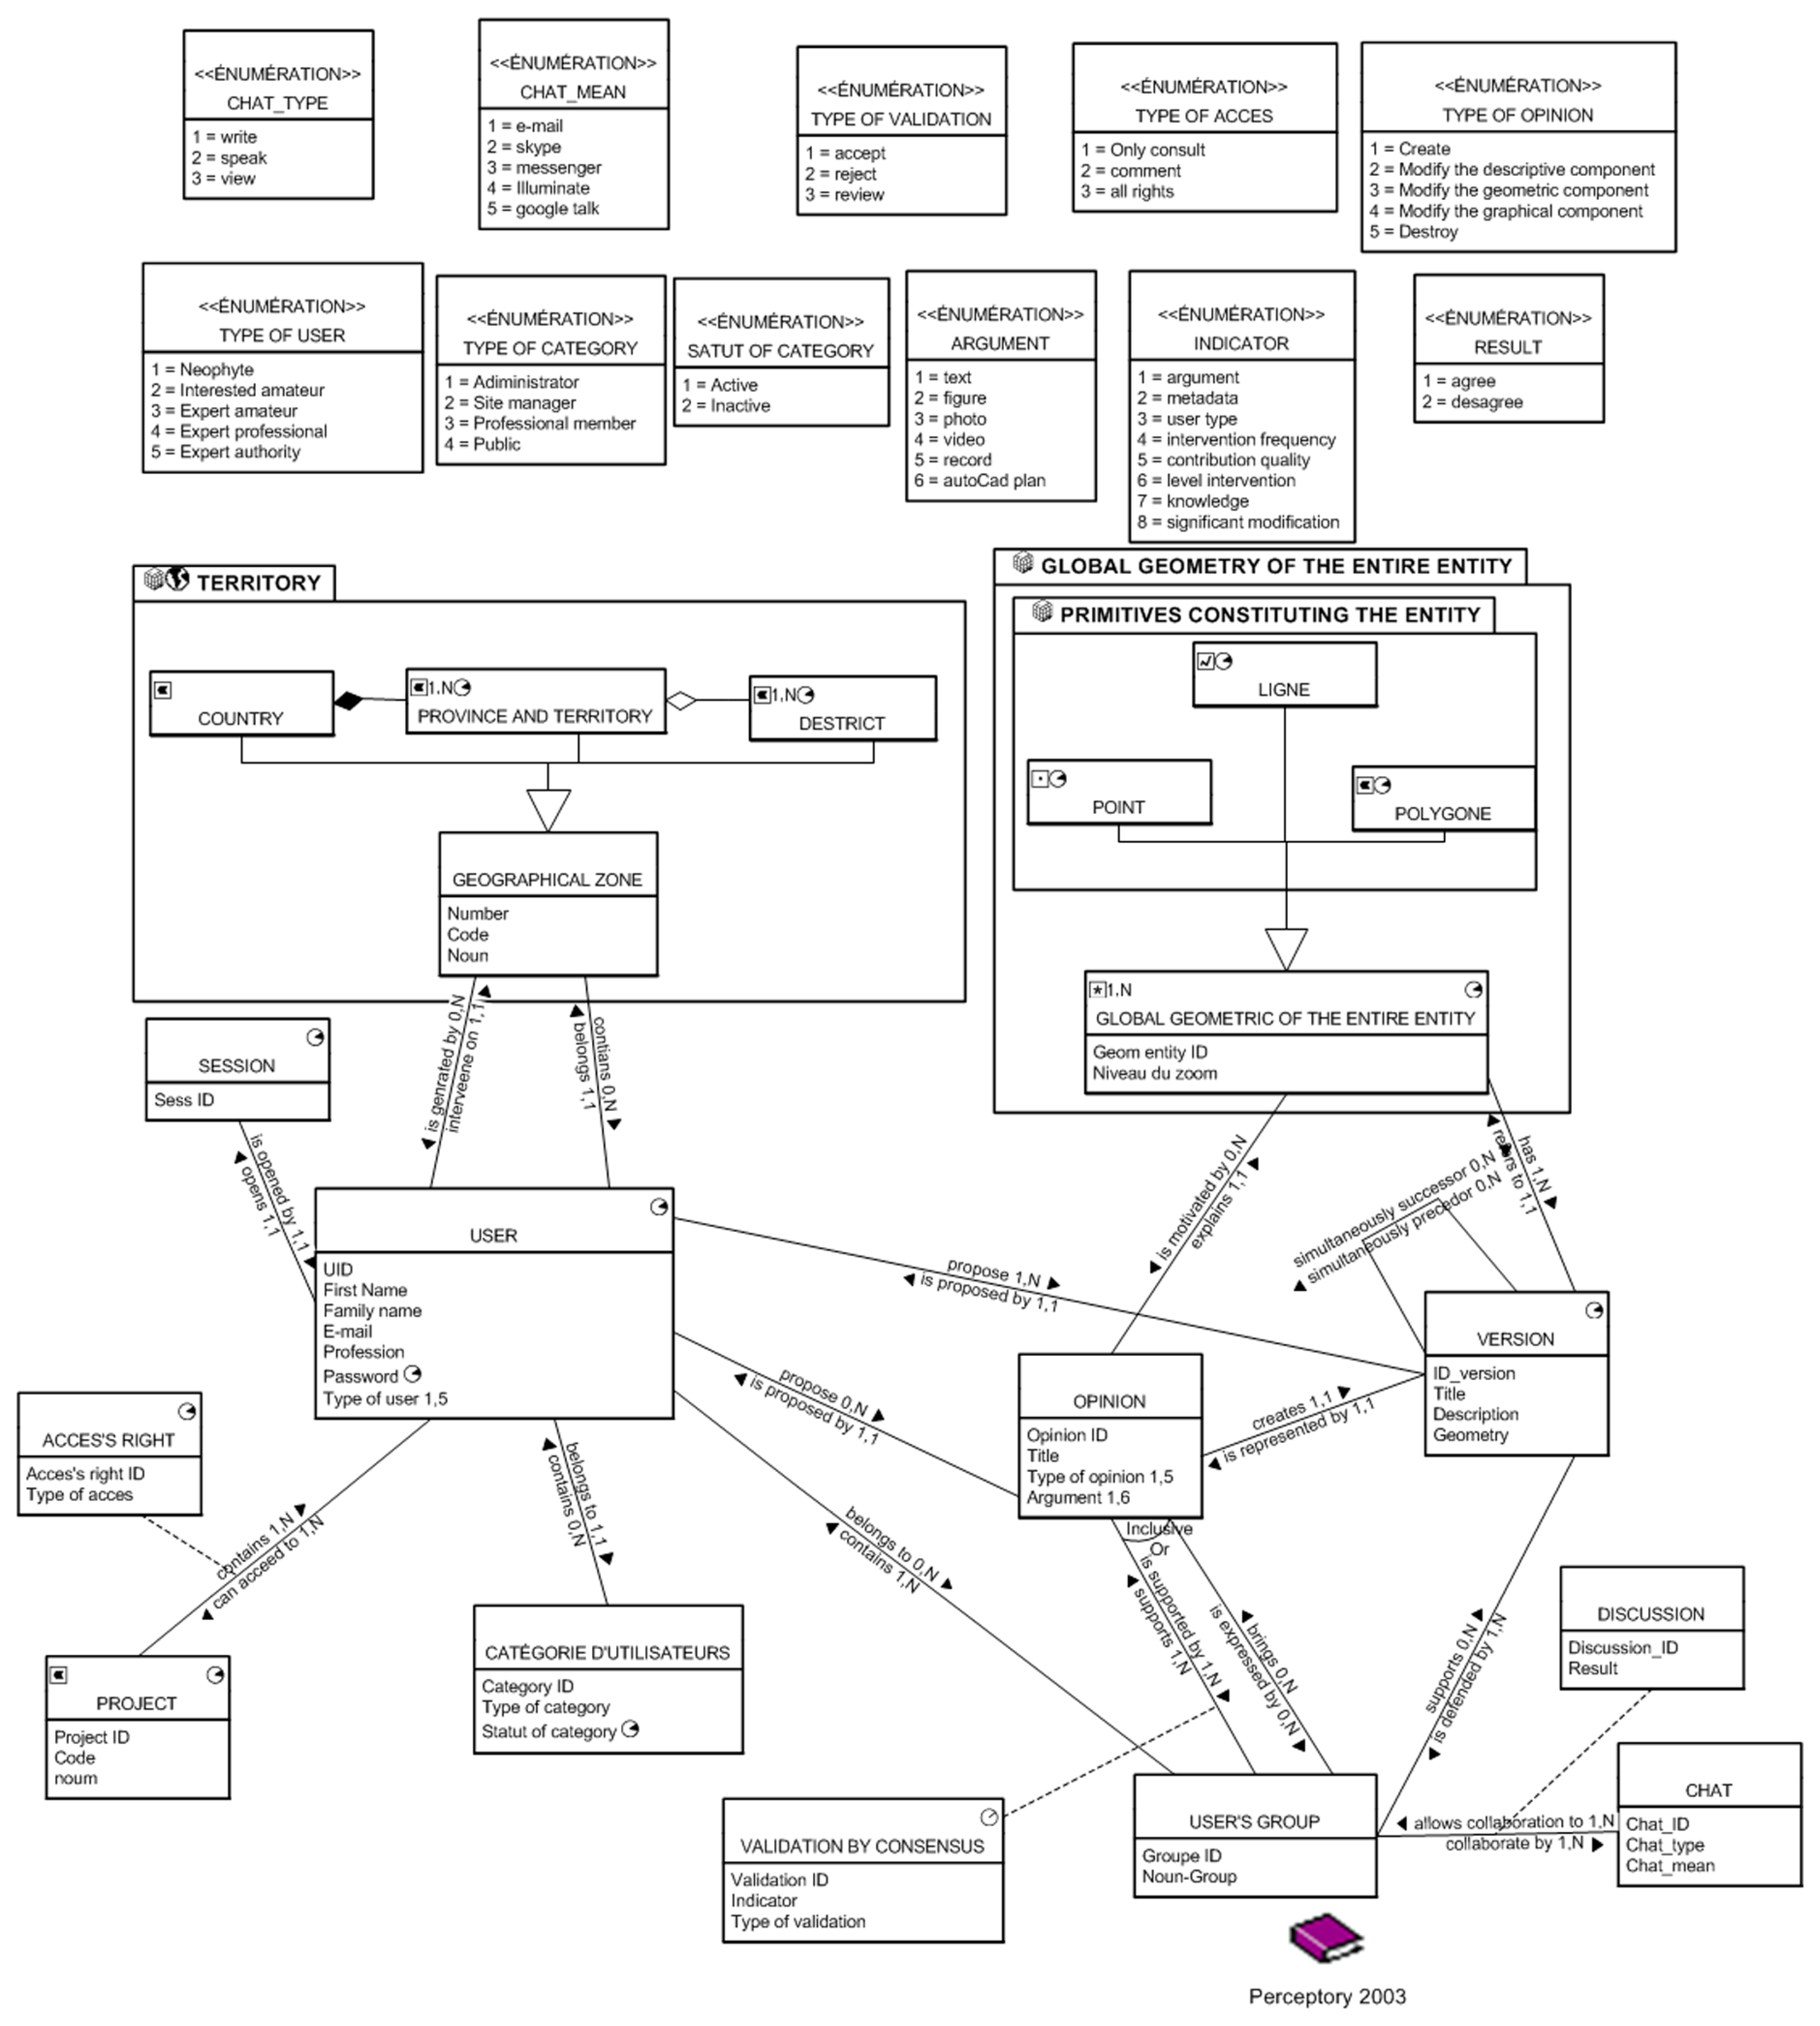
etc. In order to maintain the geographic coordinates of the vertices of the entity, changes must be made in the same scale. The conceptual model of the data (
Figure 10) shows how data are organized and structured in the WikiGIS database. WikiGIS classes are summarized in
Table 7.
Figure 10.
The CIM level of WikiGIS.
Figure 10.
The CIM level of WikiGIS.
Table 7.
Classes of the WikiGIS database.
Table 7.
Classes of the WikiGIS database.
| Name of the class | Description | Attributes | Pictogram |
|---|
| User | Personal user information. | ID, name, e-mail address, occupation, password, user type (beginner, interested amateur, expert amateur, professional expert or authoritarian expert). | Password is associated with a temporal pictogram because it can change during the project (if you forget it, for example). |
| Session | User must log in to edit. This class allows control of access and verifies user rights. | ID | This class is associated with a temporal pictogram since the session has a beginning (log in) and an end (log off). |
| Project | User is involved in a project that has a definite lifespan.
Each project is carried out in a single focus or on different non-contiguous spaces, including spaces belonging to different administrative limits. | Project ID, Code, noun | A temporal pictogram is associated with the class and a spatial pictogram associated with cardinality 1, N. |
| Access right | User intervenes according to the granted right (read only, comment only or write). The right of access evolves during the project. For example, user A can have all the rights at the beginning of the project, but later he has only the right to comment or read. | Access right ID, Type of access | Temporal pictogram is associated with the class. |
| Category of user | User belongs to a determined category (administrator, site manager, professional or public). The involvement of actors is limited temporally, for example a consultant under contract for 2011 could not intervene in 2010. | Category ID, type of category, status of category | Attribute, status of category changes over time: active or inactive. |
| Opinion * | User expresses an opinion | Opinion ID, Title, type of opinion (create, modify, destroy, etc.), argument (text, video, figure, record) | |
| Version ** | A version represents an opinion expressed by a user. A geometric entity may have 1 to N versions. | ID-Version, Title, Description, Geometry | |
| User group *** | At the beginning of the project, each user expresses his opinion. Following the project and discussions, participants either agree with an opinion or choose another according to arbitration. The group can support an opinion already expressed or express a new opinion. | Group ID, name of group | |
| Validation by consensus | Associative class between the opinion and the user group after an N to N association. | Validation-ID, Indicator, type of validation **** | |
| Chat | Project members collaborate through various forms of multimedia such as Skype, Messenger, email, Google talk, etc. | Chat_ID, Chat_type (write, read, speak), Chat_mean (e-mail, Skype, Messenger, etc.) | |
| Discussion | Associative class between the user group and chat after an N to N association. | Discussion ID, Result (after discussion, the members either agree with an opinion or disagree) | |
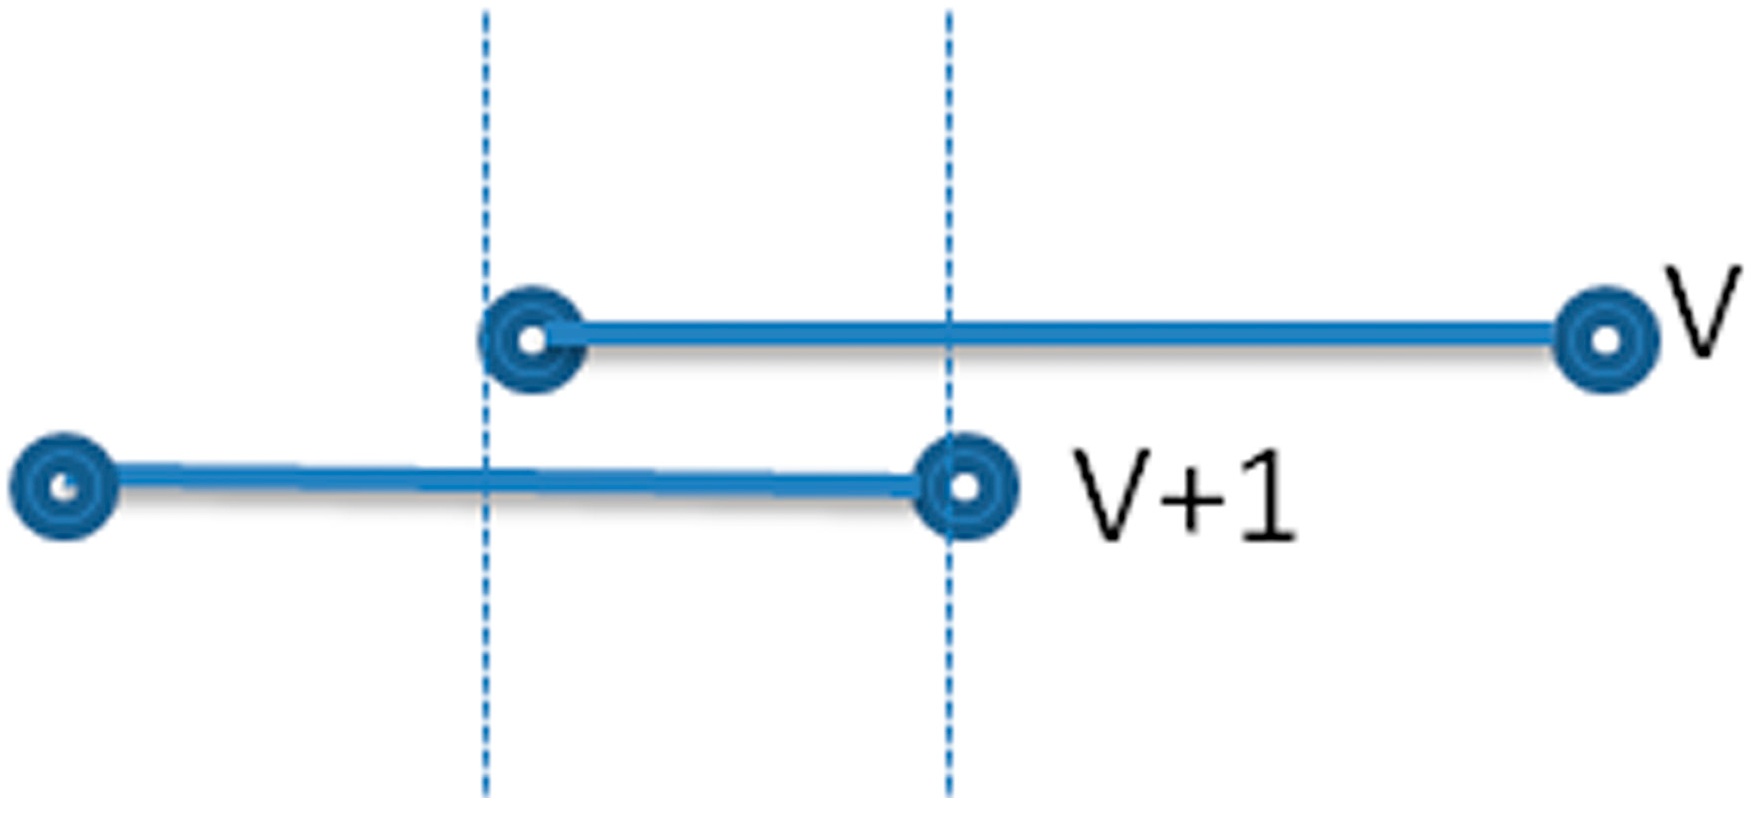
Figure 11.
Temporal typology of intersection between two versions.
Figure 11.
Temporal typology of intersection between two versions.
7.2. Use Case
A use case is a list of steps typically defining interactions between an “actor” and a system to achieve a goal. It describes the behavior of the system under various conditions when the system responds to a request from one of the users later referred to as the principal user. The principal user initiates an interaction with the system in order to achieve a particular target. The system responds and protects the interests of all users [
31] and [
32].
WikiGIS adopts the wiki approach in functionalities and history management, but the governance paradigm could be bottom-up as it exists in Wikipedia in some cases and top-down in other cases. The governance mechanism depends on the nature and context of the project, and the nature of involved users.
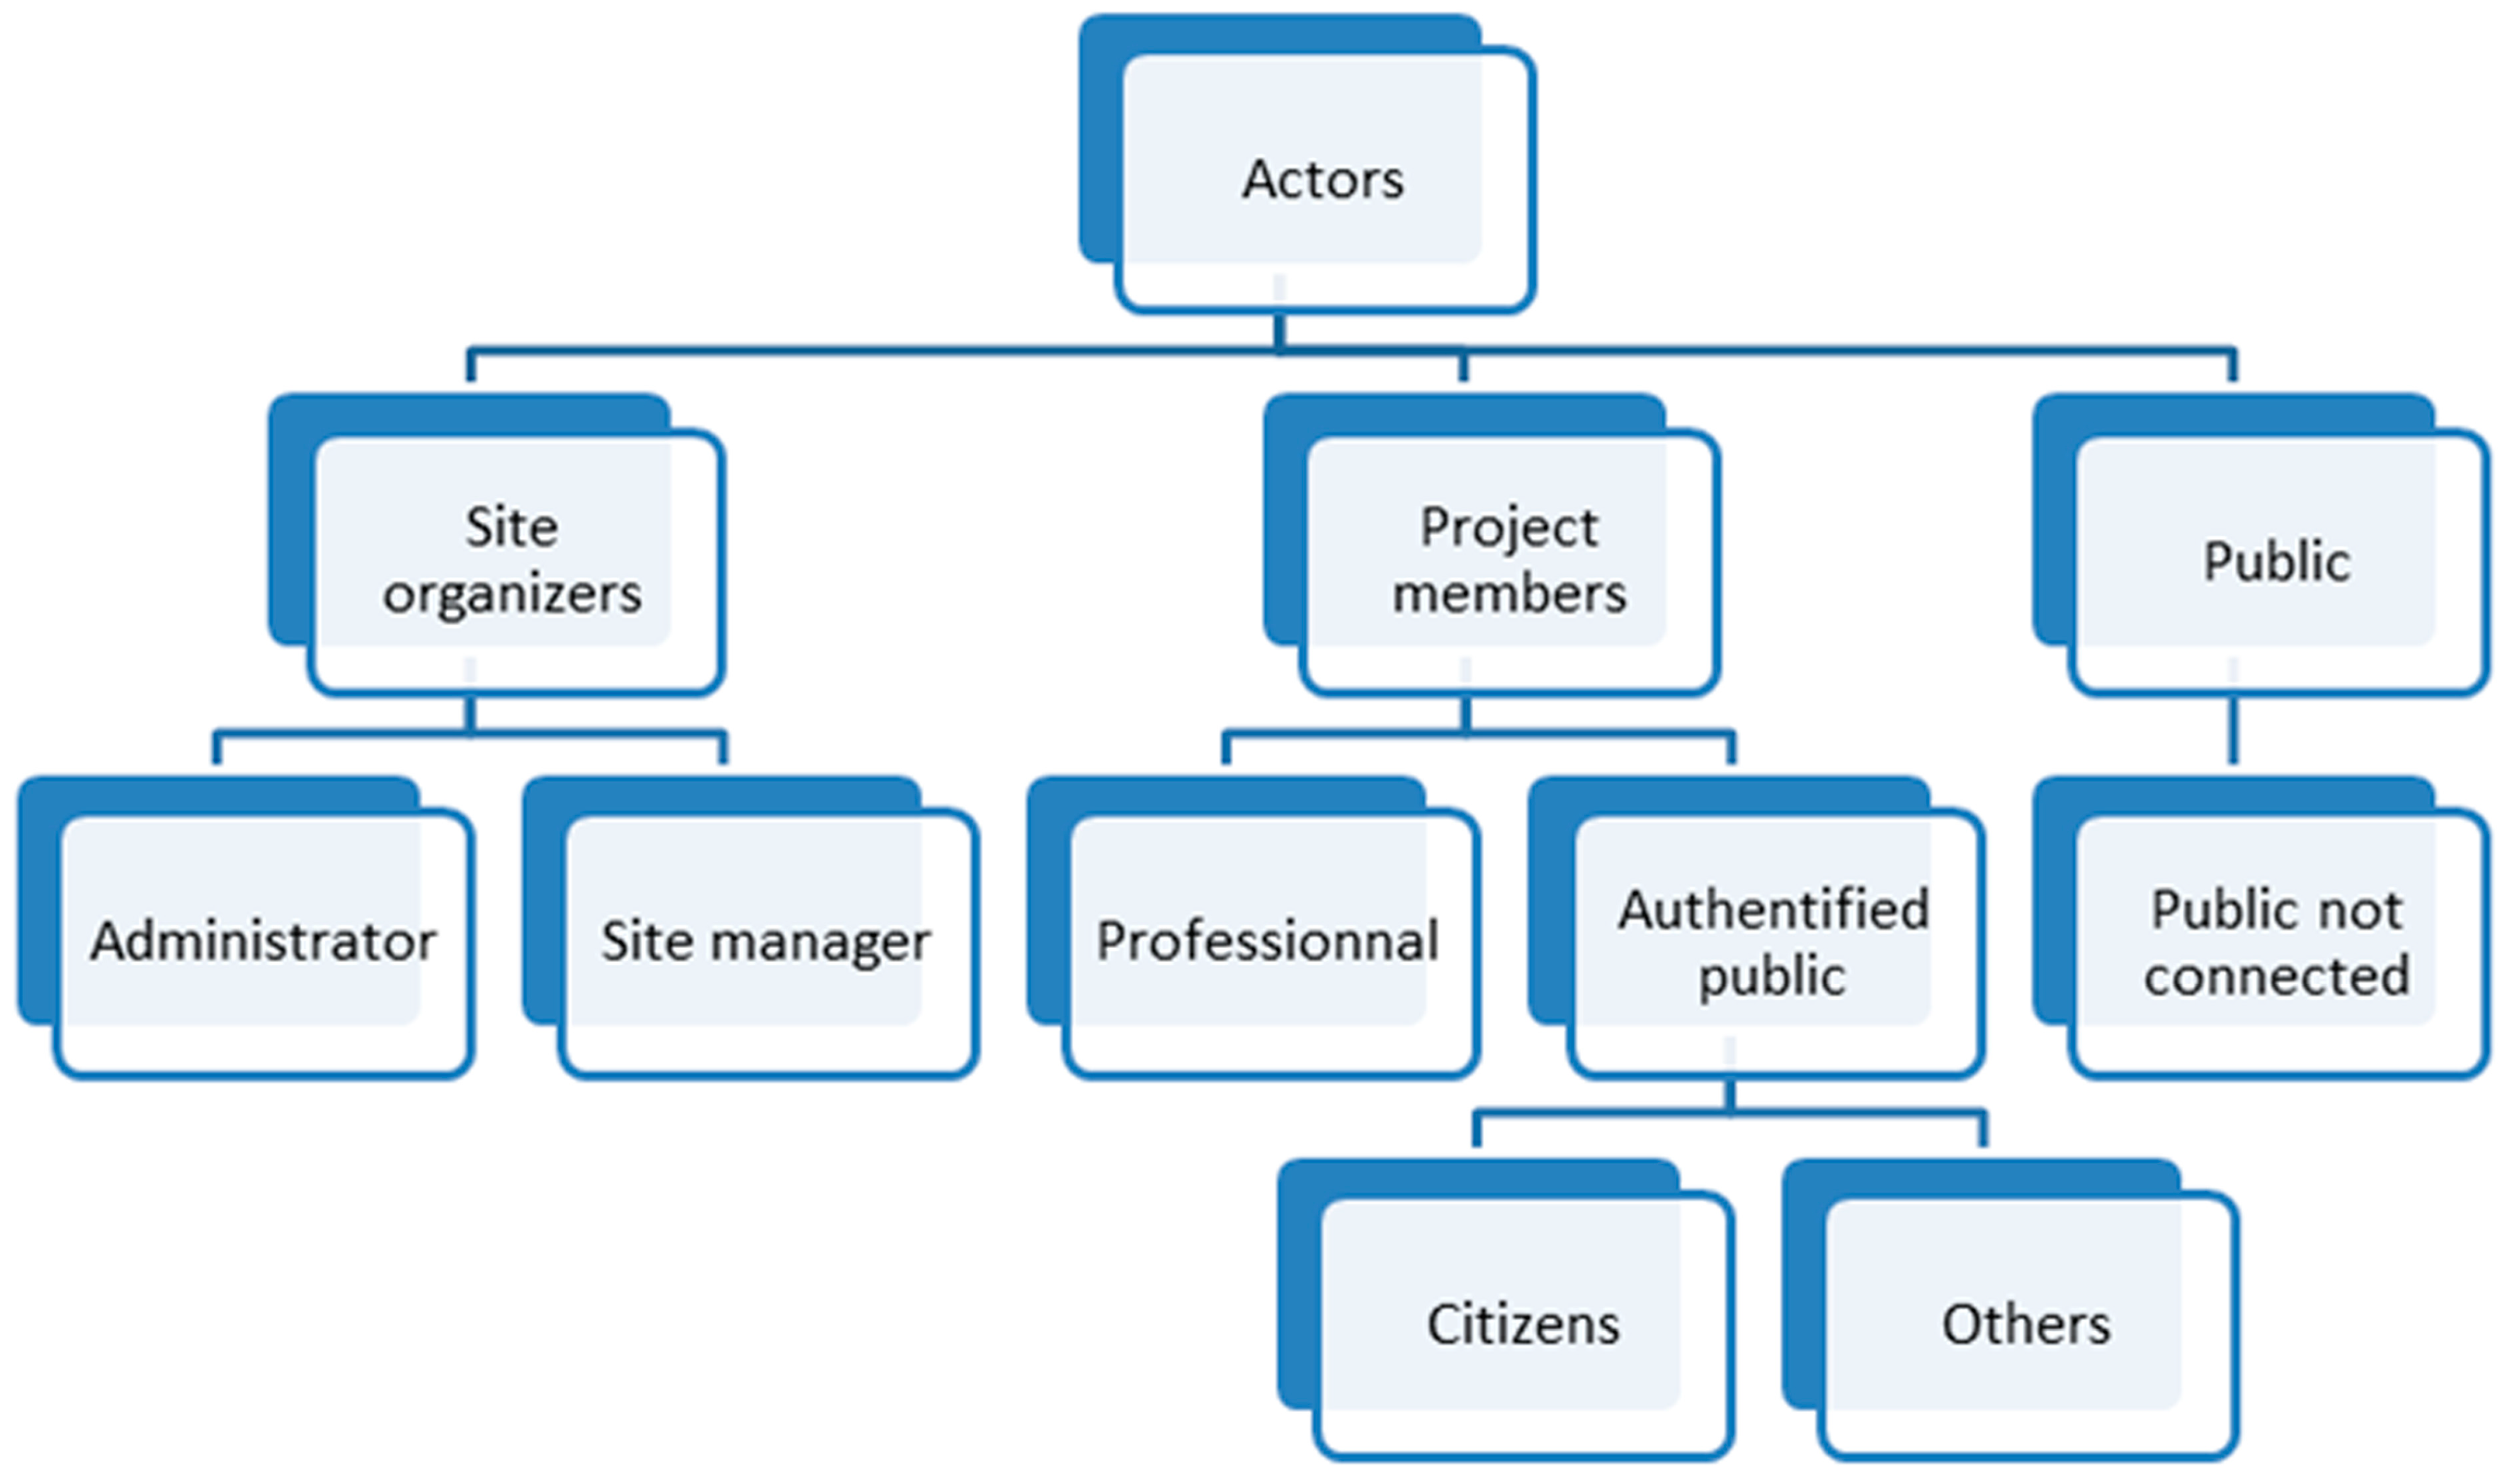
In the case of WikiGIS, we distinguish between three categories of users: site organizers, project members and not connected public. The users are prioritized as shown in
Figure 12.
Figure 12.
Users involved in the WikiGIS.
Figure 12.
Users involved in the WikiGIS.
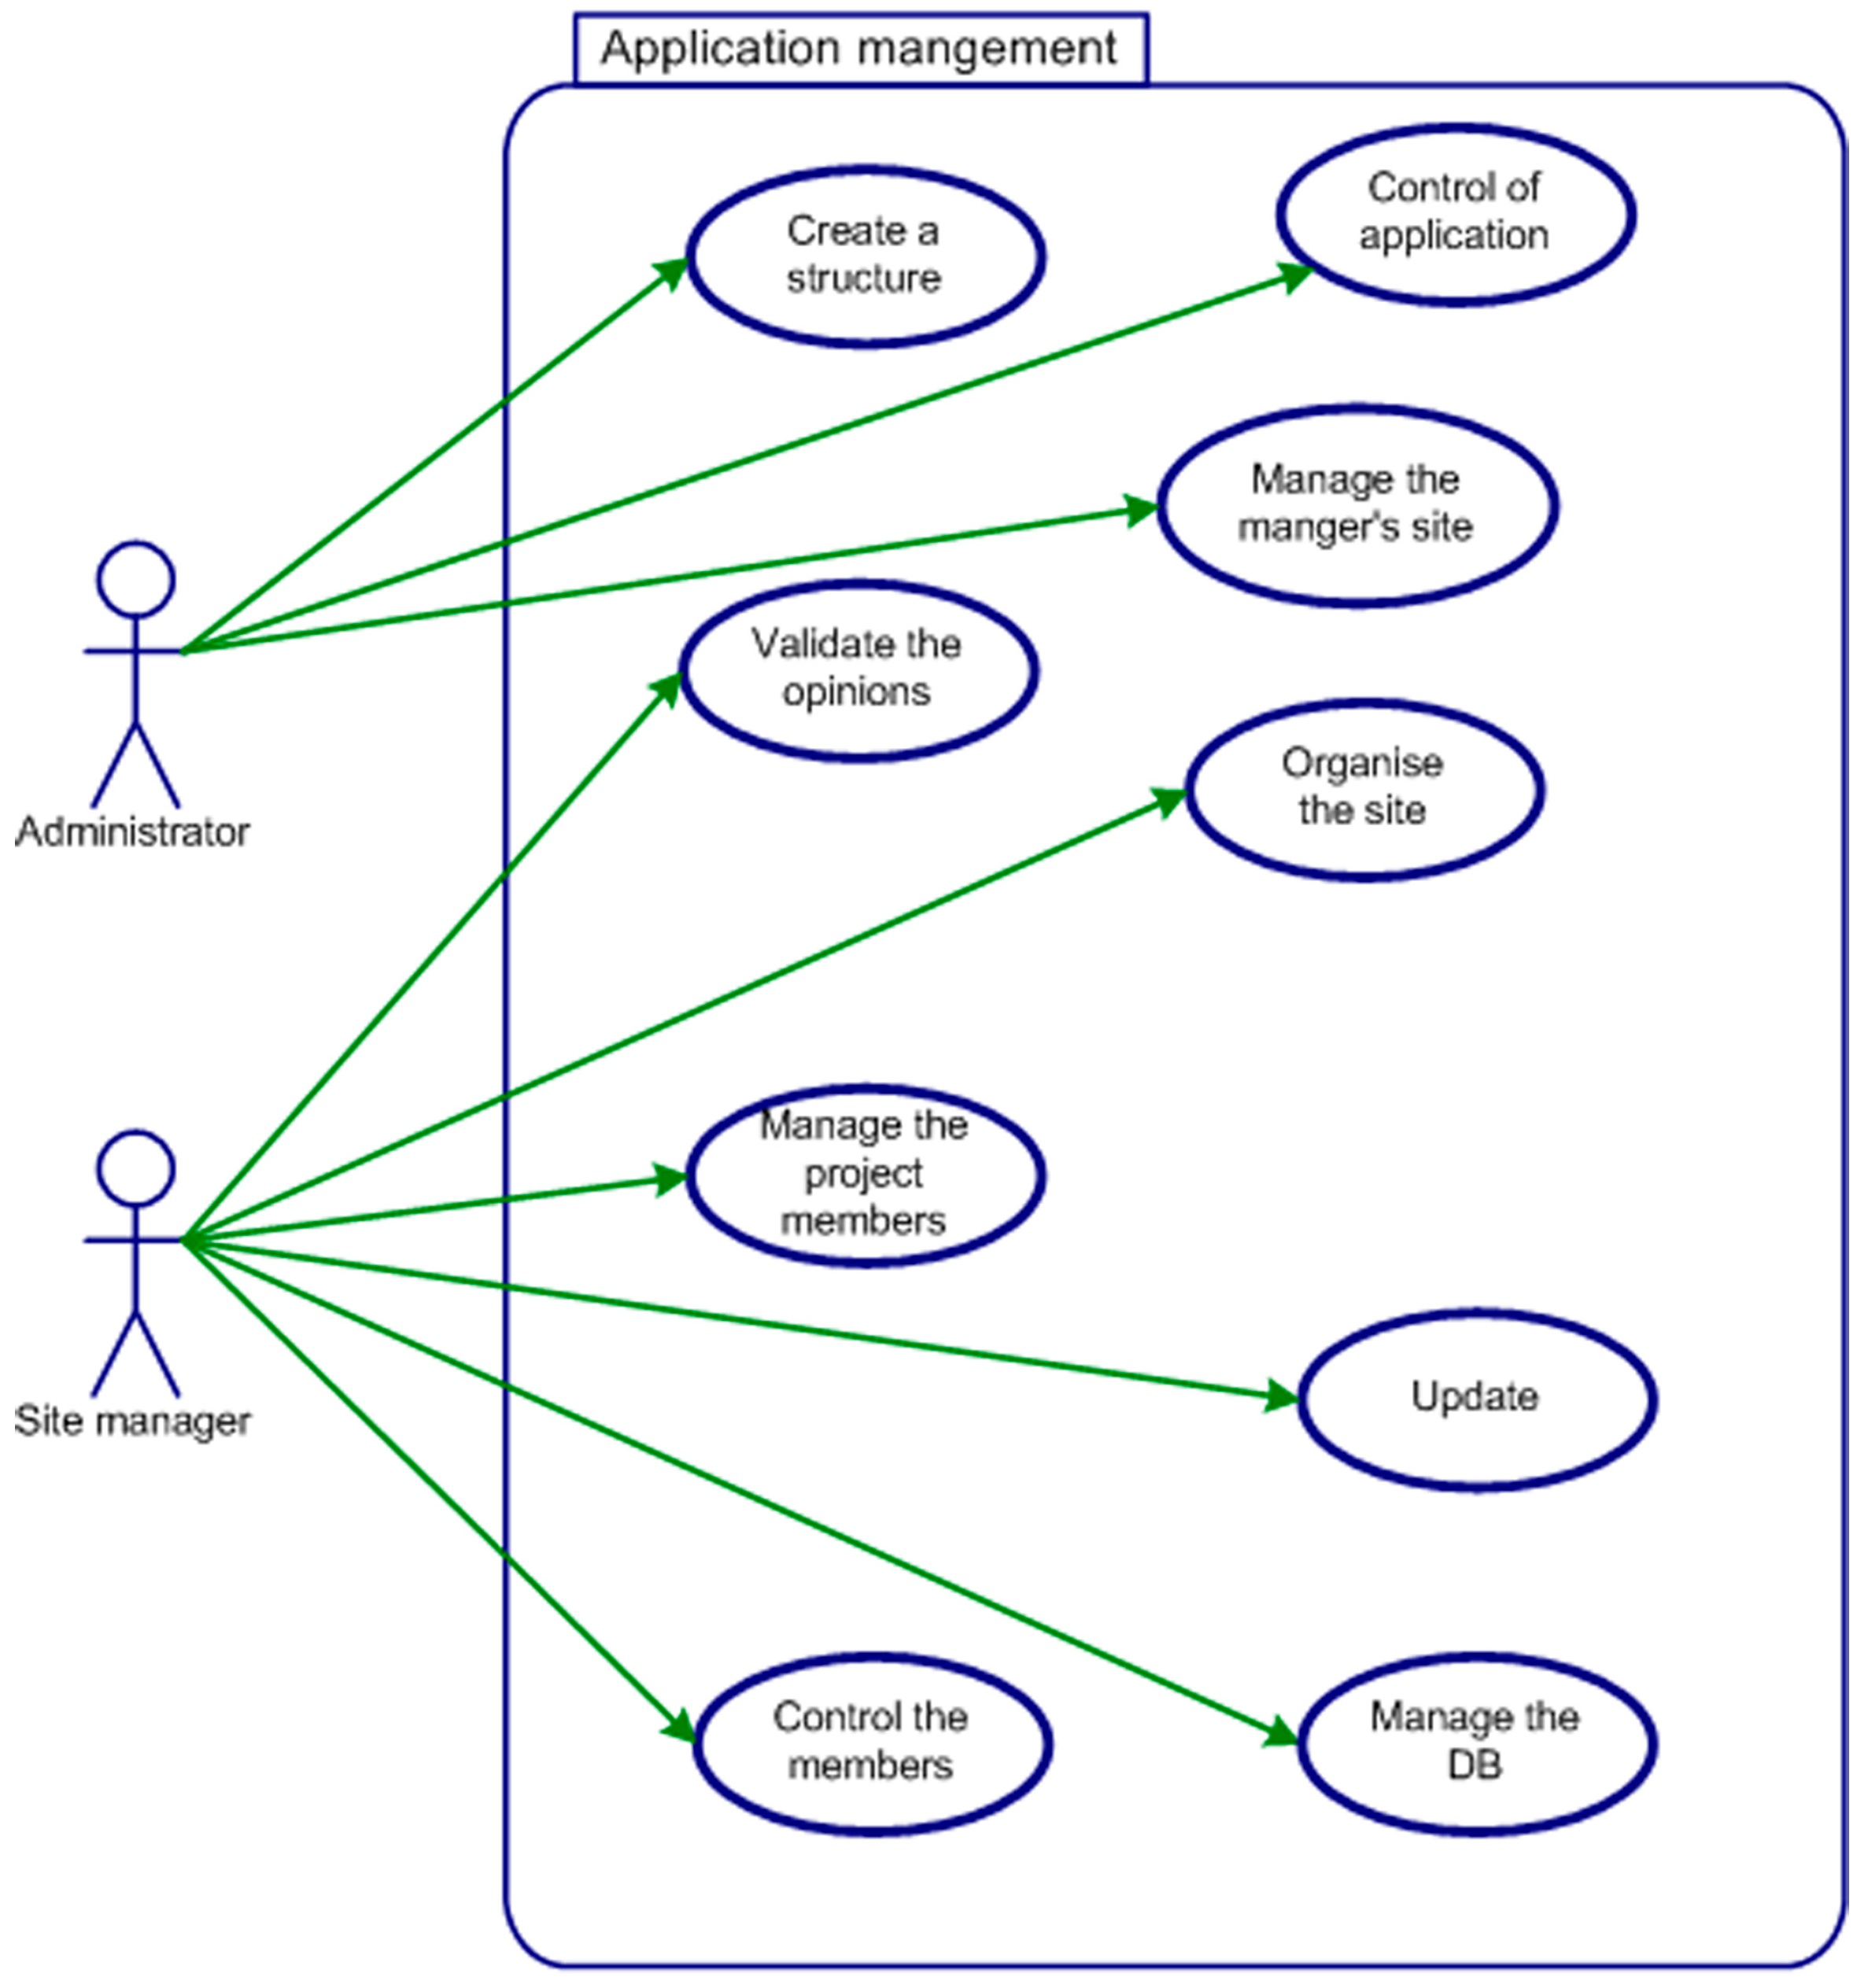
- -
Site organizers (
Figure 13): the super-users. They have all rights over the application. This category contains two sub-classes: the administrator and the site manager;
- -
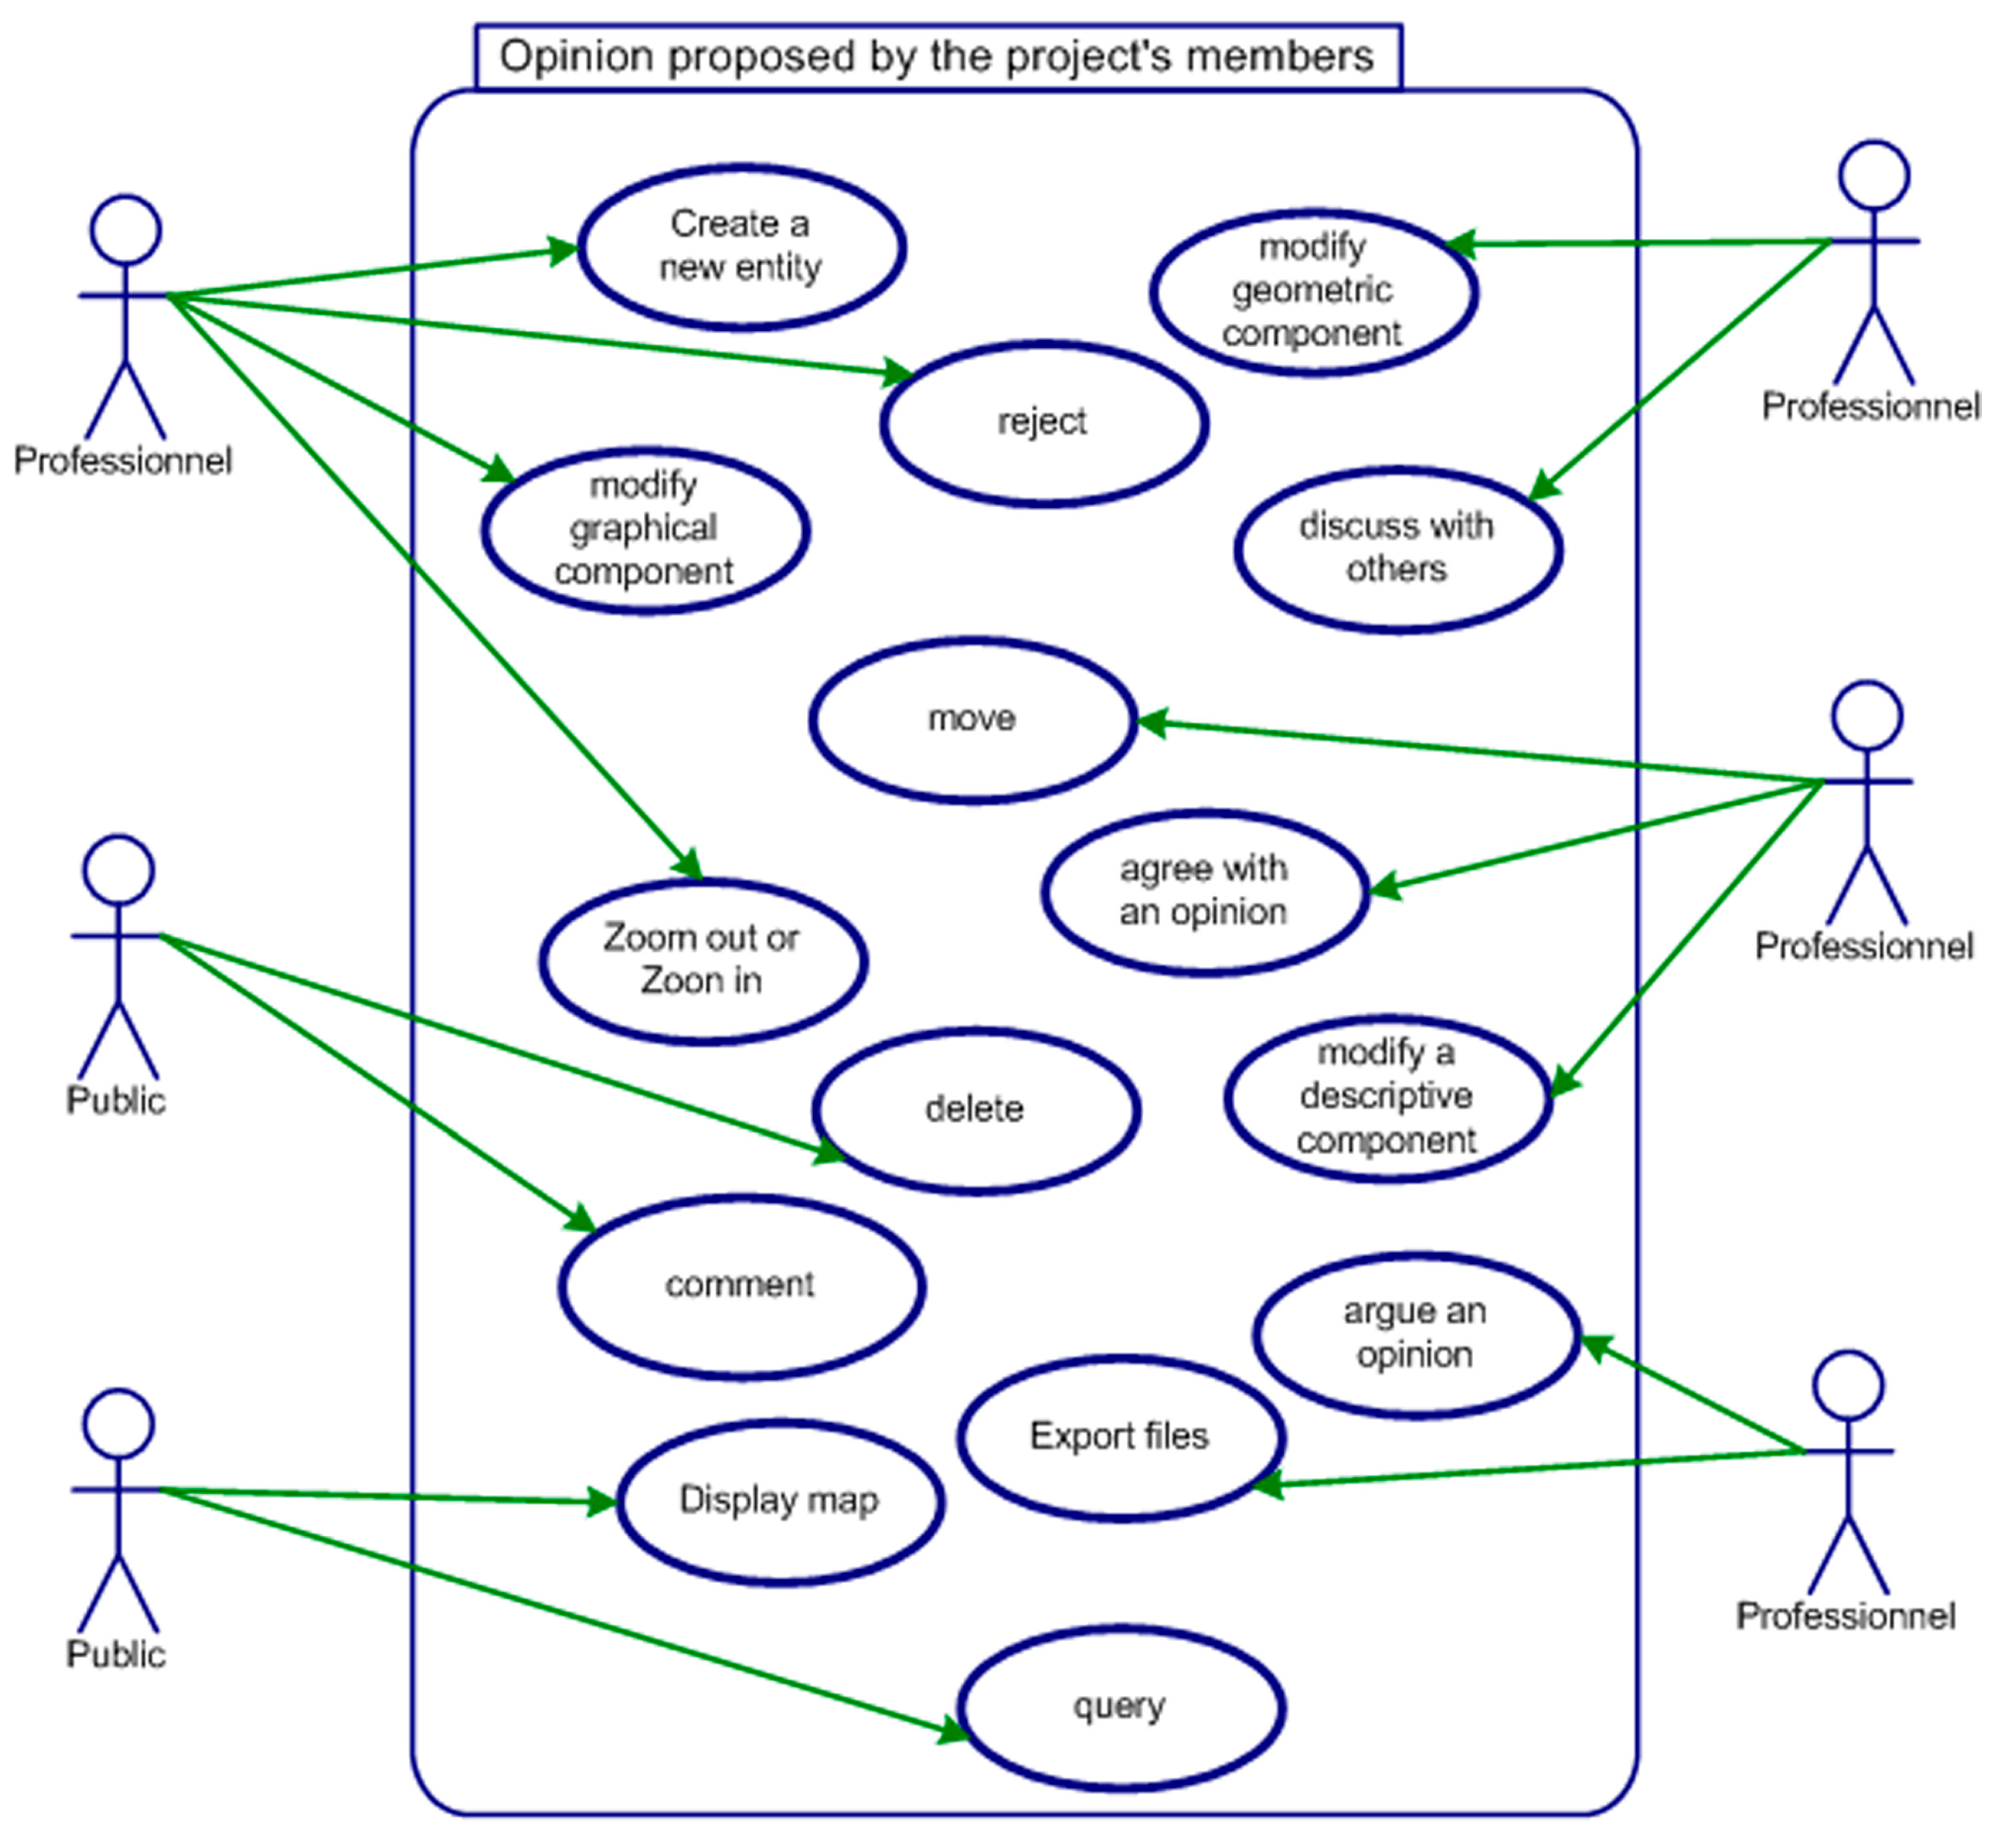
Project members (
Figure 14): a group of users who have specified rights established by the administrator. They provide opinions and work together collaboratively. This category is subdivided into two sub-categories:
- (1)
Professionals: Wikipedia defines the professional as “someone who specializes in an industry and exercises a profession or an occupation. Professionalism characterizes the quality of work of someone with experience”. In our case, a professional is someone who has professional knowledge and skills in one of the following areas: geomatics, design, development, planning, etc.;
- (2)
Authenticated public: citizens involved in the project and proposed by the administrator. Their contributions are used to create a participatory space suitable to integrate their knowledge. They may be residents of the area, for instance;
- -
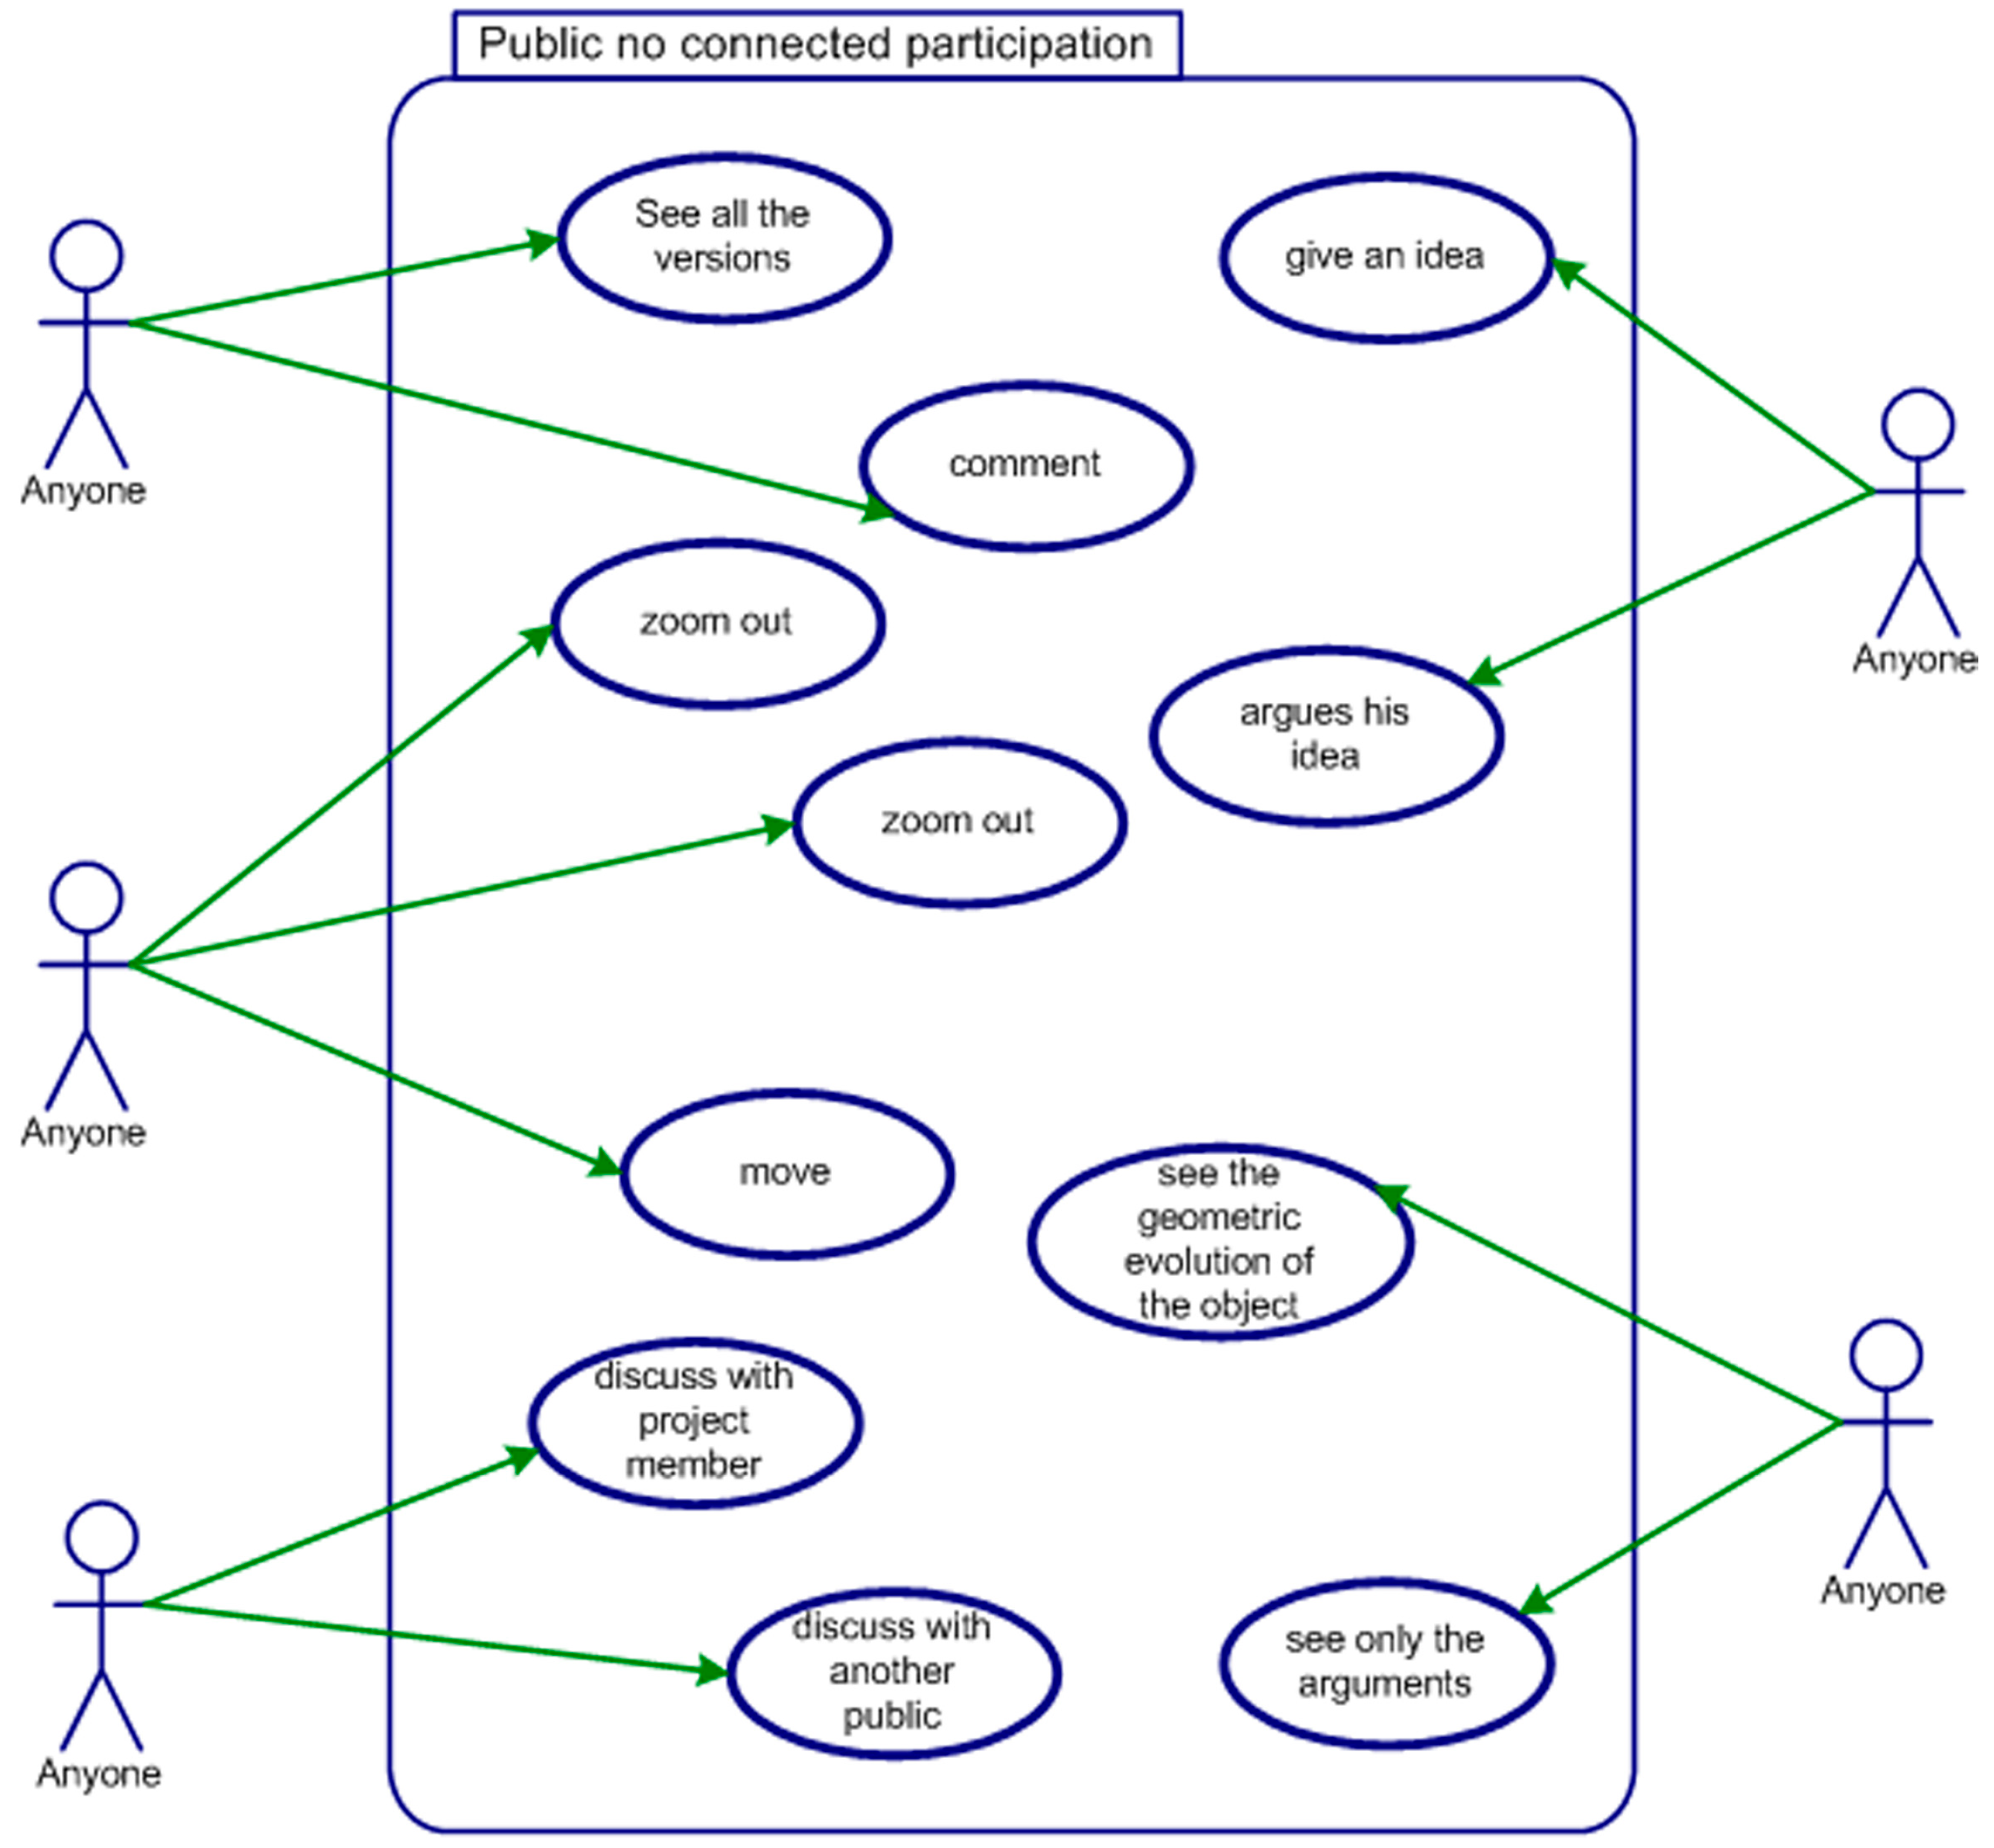
Not connected public (
Figure 15): Any user can visit the site, but without any editing capability. They are allowed to express their opinions when needed.
Figure 13.
The behavior of site organizers within the system.
Figure 13.
The behavior of site organizers within the system.
The administrator has the right to create structure, control the application and manage site managers. He supervises the contributors by validating their opinions and updating the site.
Figure 14.
The behavior of authorized members with the system.
Figure 14.
The behavior of authorized members with the system.
Authorized members have all rights to edit the entity: add, delete, comment, modify, etc. They can explore the project: move, zoom in, zoom out, and visualize the opinions, etc.
Figure 15.
The behavior of not connected public members within the system.
Figure 15.
The behavior of not connected public members within the system.
7.3. Activity Diagram
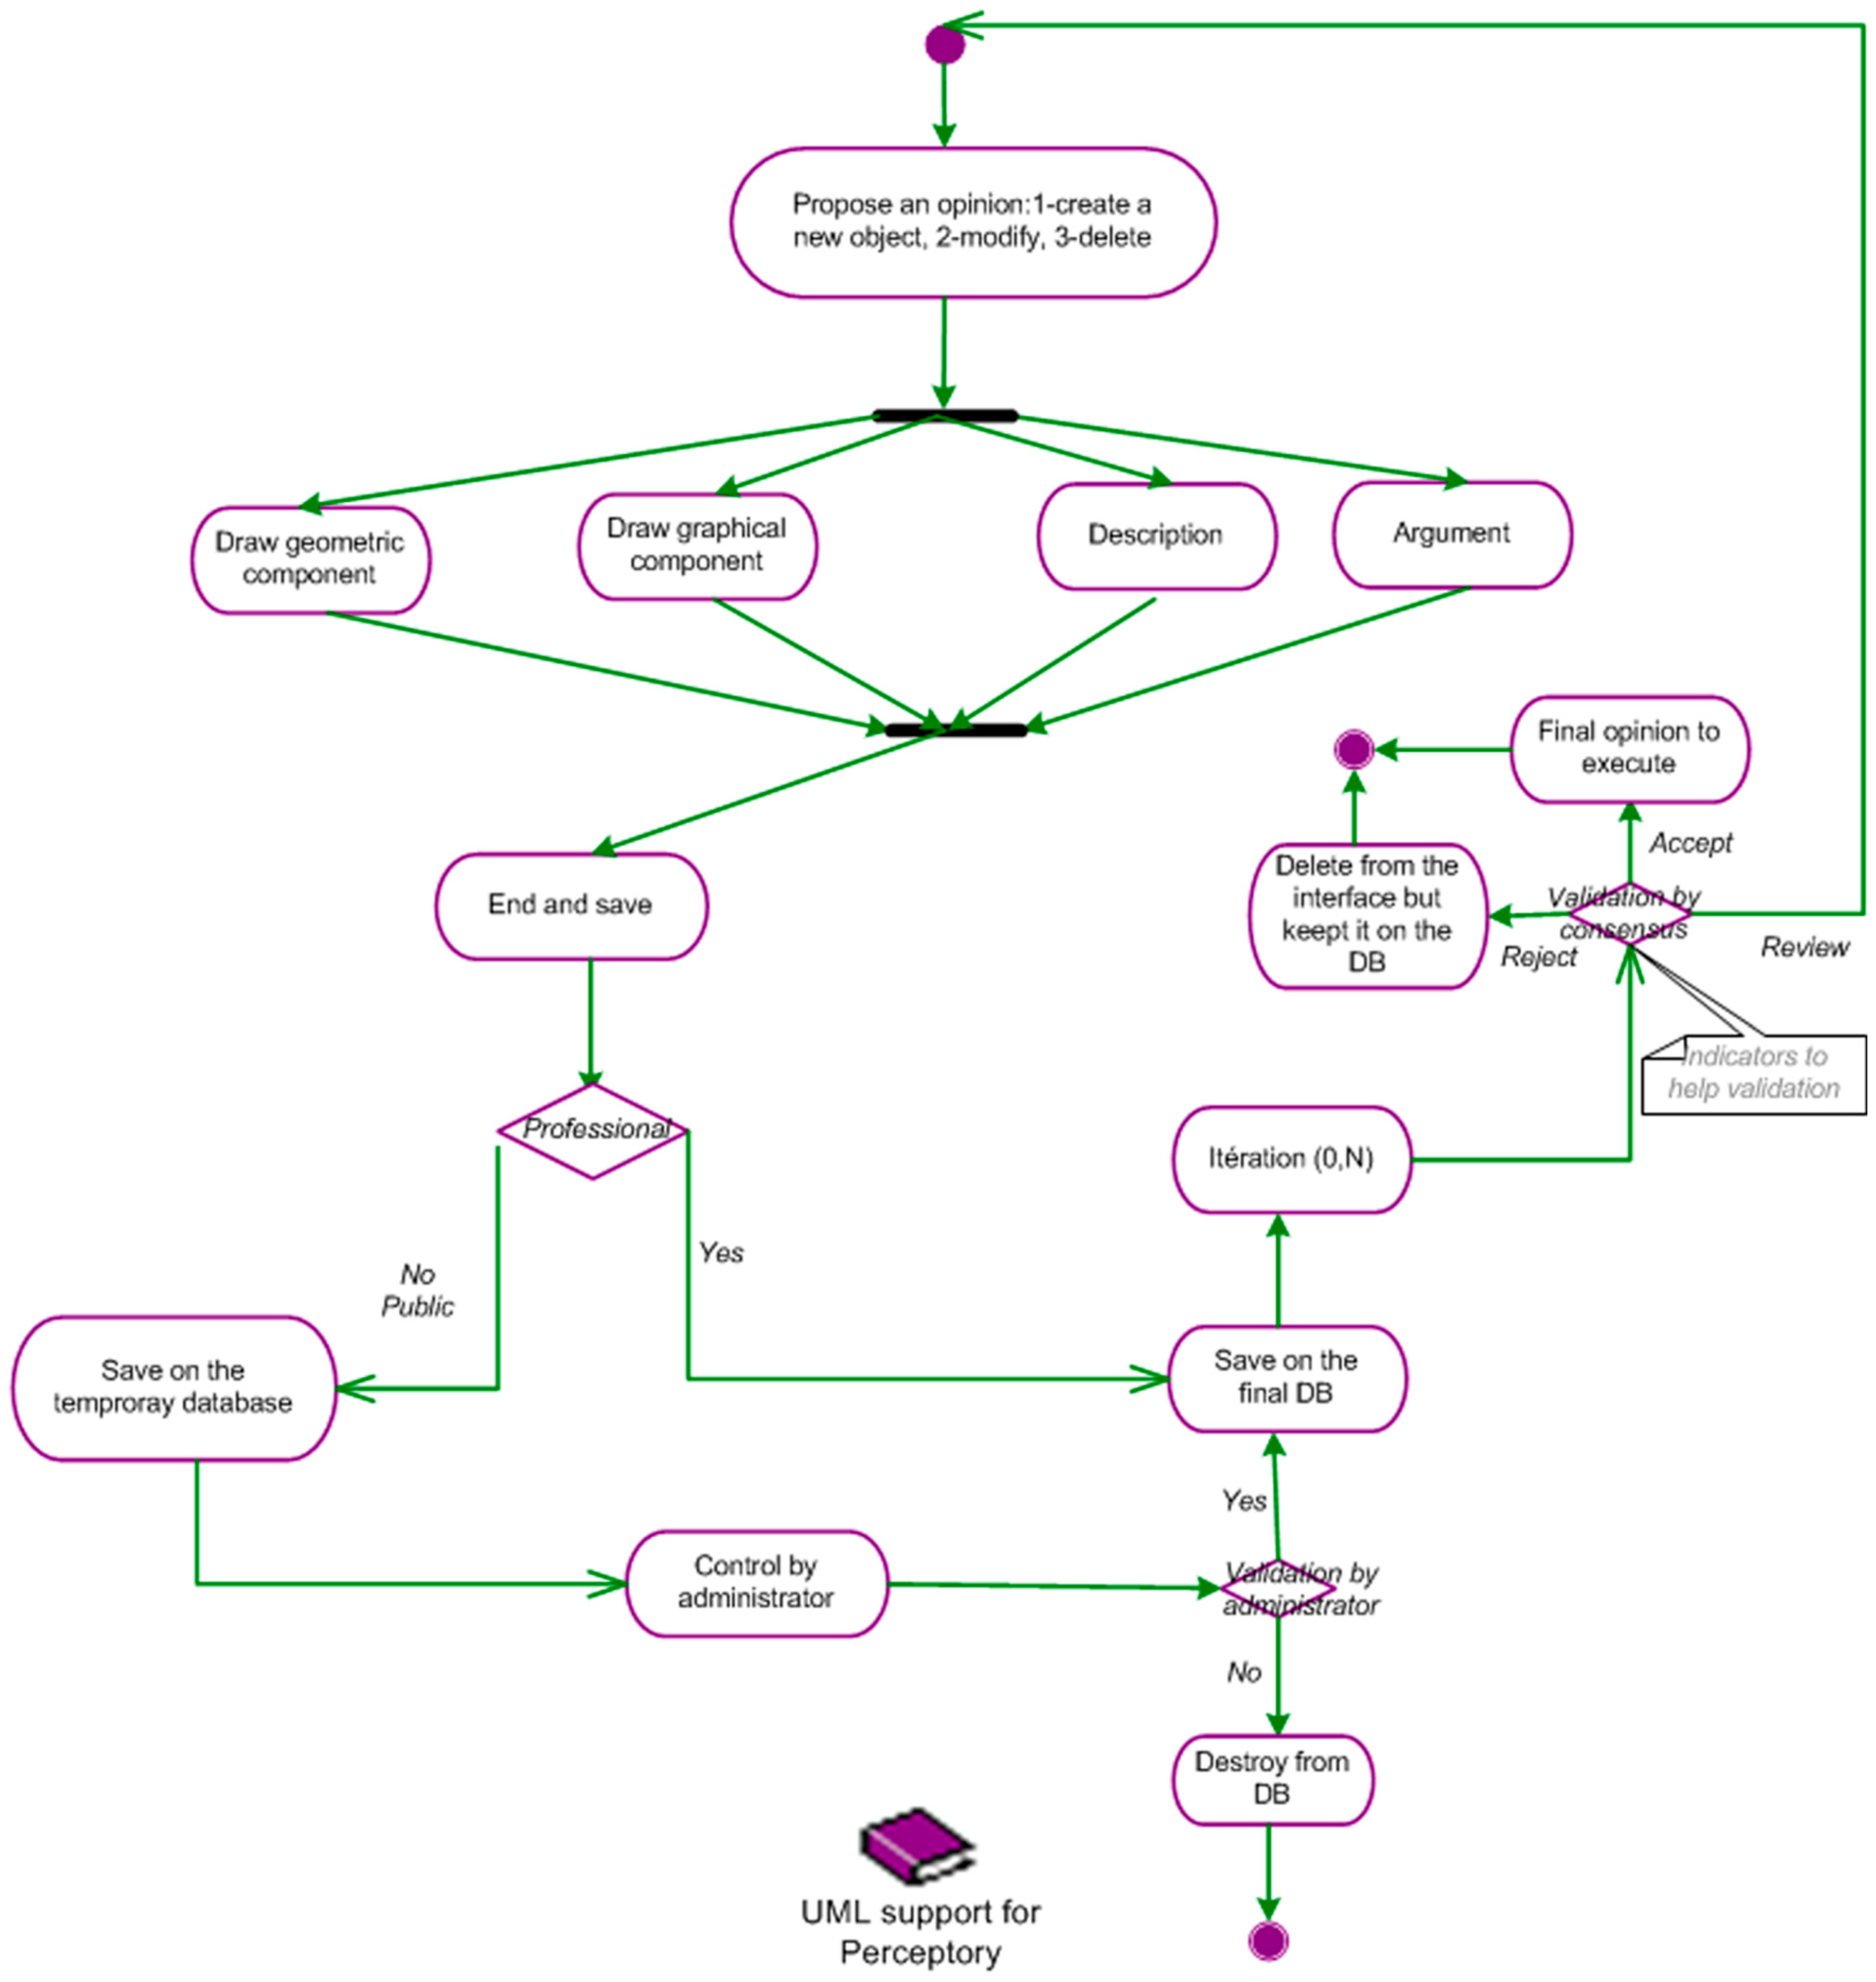
The activity diagram is generally used to explore and describe a workflow (Eriksson and Penker, 2000). In our case, it represents the life processes of an opinion expressed by contributors (
Figure 16).
Figure 16.
Activity diagram: Life process of opinion.
Figure 16.
Activity diagram: Life process of opinion.
When an opinion is expressed by a user, we say that its life process starts. The user can create a new geographical entity, change an existing one or delete it. The user acts on the geometric component and/or graphic component and/or descriptive component, but in all cases, he must justify his contribution. Once he finishes his contribution and saves it, two outcomes are possible: if the user is a professional, his contribution is recorded directly in the final database; if the user is a member of the public, his contribution is filtered by the administrator. Here, two outcomes are possible: if the contribution makes sense and if it is credible, it is recorded in the final database. Otherwise, it is rejected. The validated contributions are visible to all users and are the subject of discussion and collaboration. Users exchange opinions, ideas via chat. The credibility of an opinion is built primarily on the arguments developed.
Previous versions of an object are considered here as components of the object and remain accessible at all times for viewing and analysis. When a user makes changes to an entity (geometric and/or semantic), the wiki automatically records the version. If another user modifies this version and saves his changes, this version becomes the latest and previous versions remain available. Any new version is linked to the previous version which is not necessarily its previous direct version.
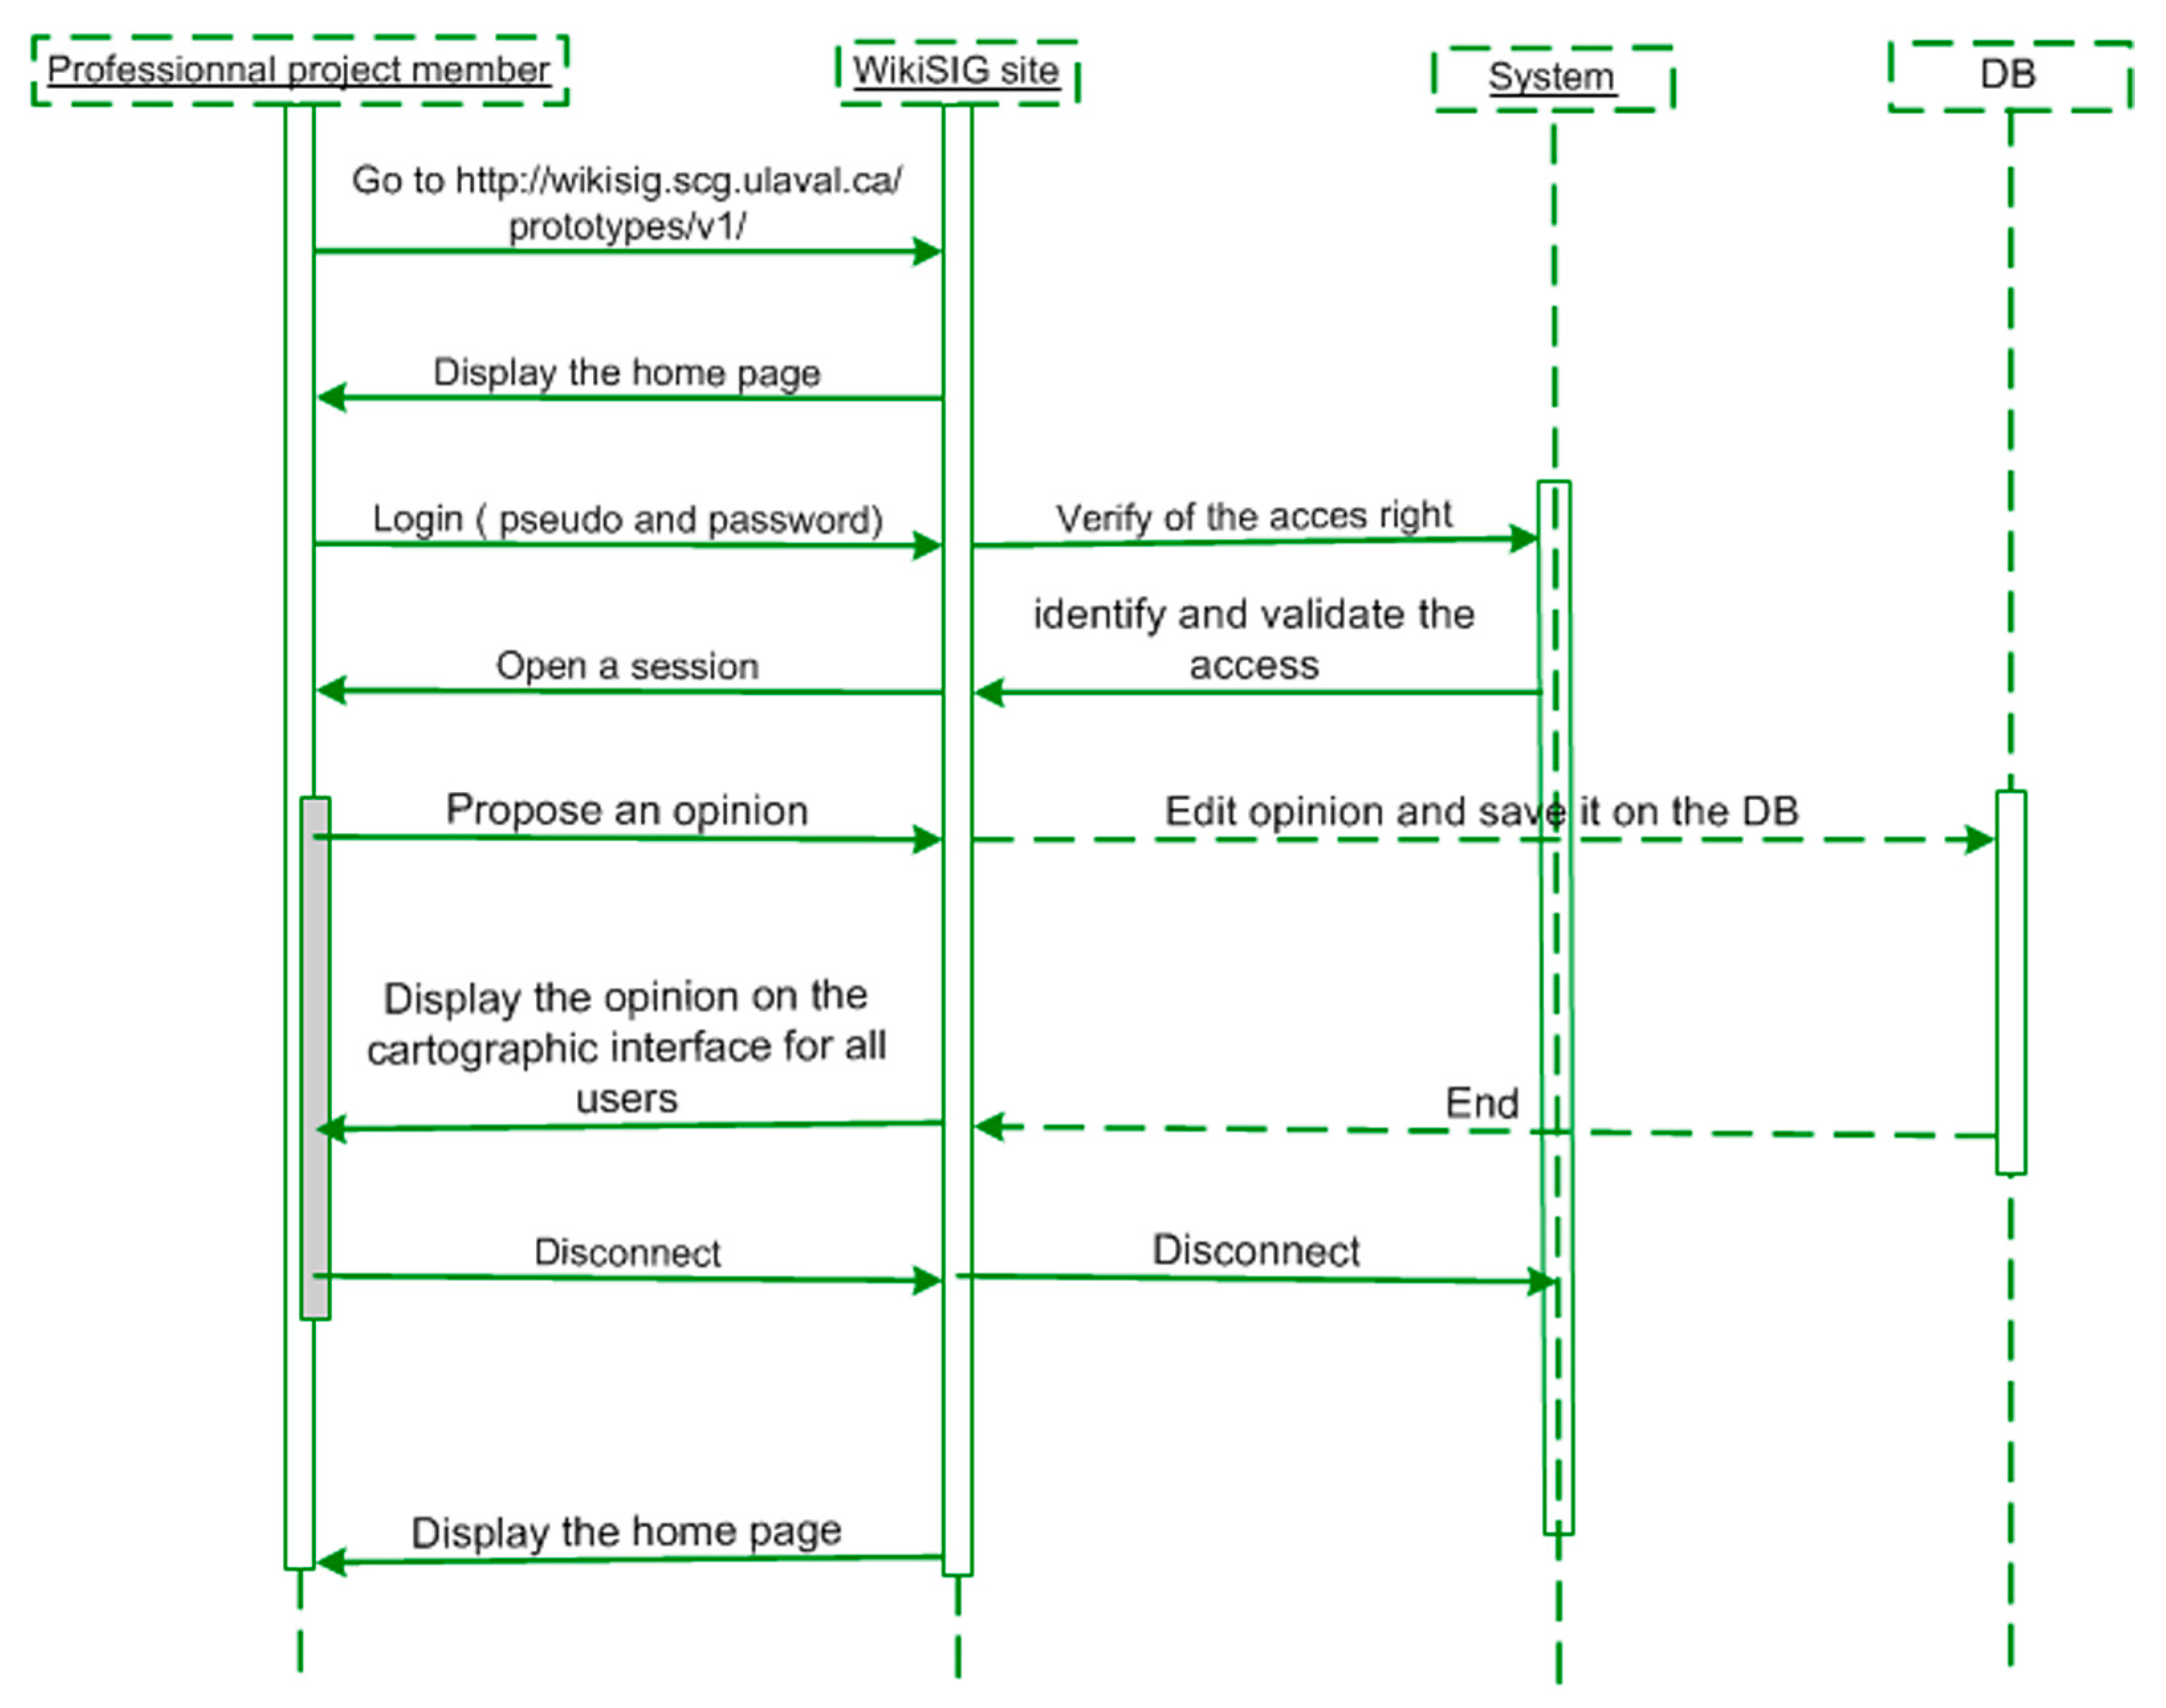
7.4. Sequence Diagram
This sort of UML diagram is based on a series of messages organized in a temporal sequence representing a behavior derived from a use case. It represents the involved users with their roles and their messages. In this section, we present a sequence diagram for each type of user presented in the previous section.
Professionals involved in a project propose their views and record their opinions directly into the final database. Once registered, the version is directly accessible to other users and can be discussed, thereby triggering the process of life (
Figure 17).
Figure 17.
Sequence diagram of professionals.
Figure 17.
Sequence diagram of professionals.
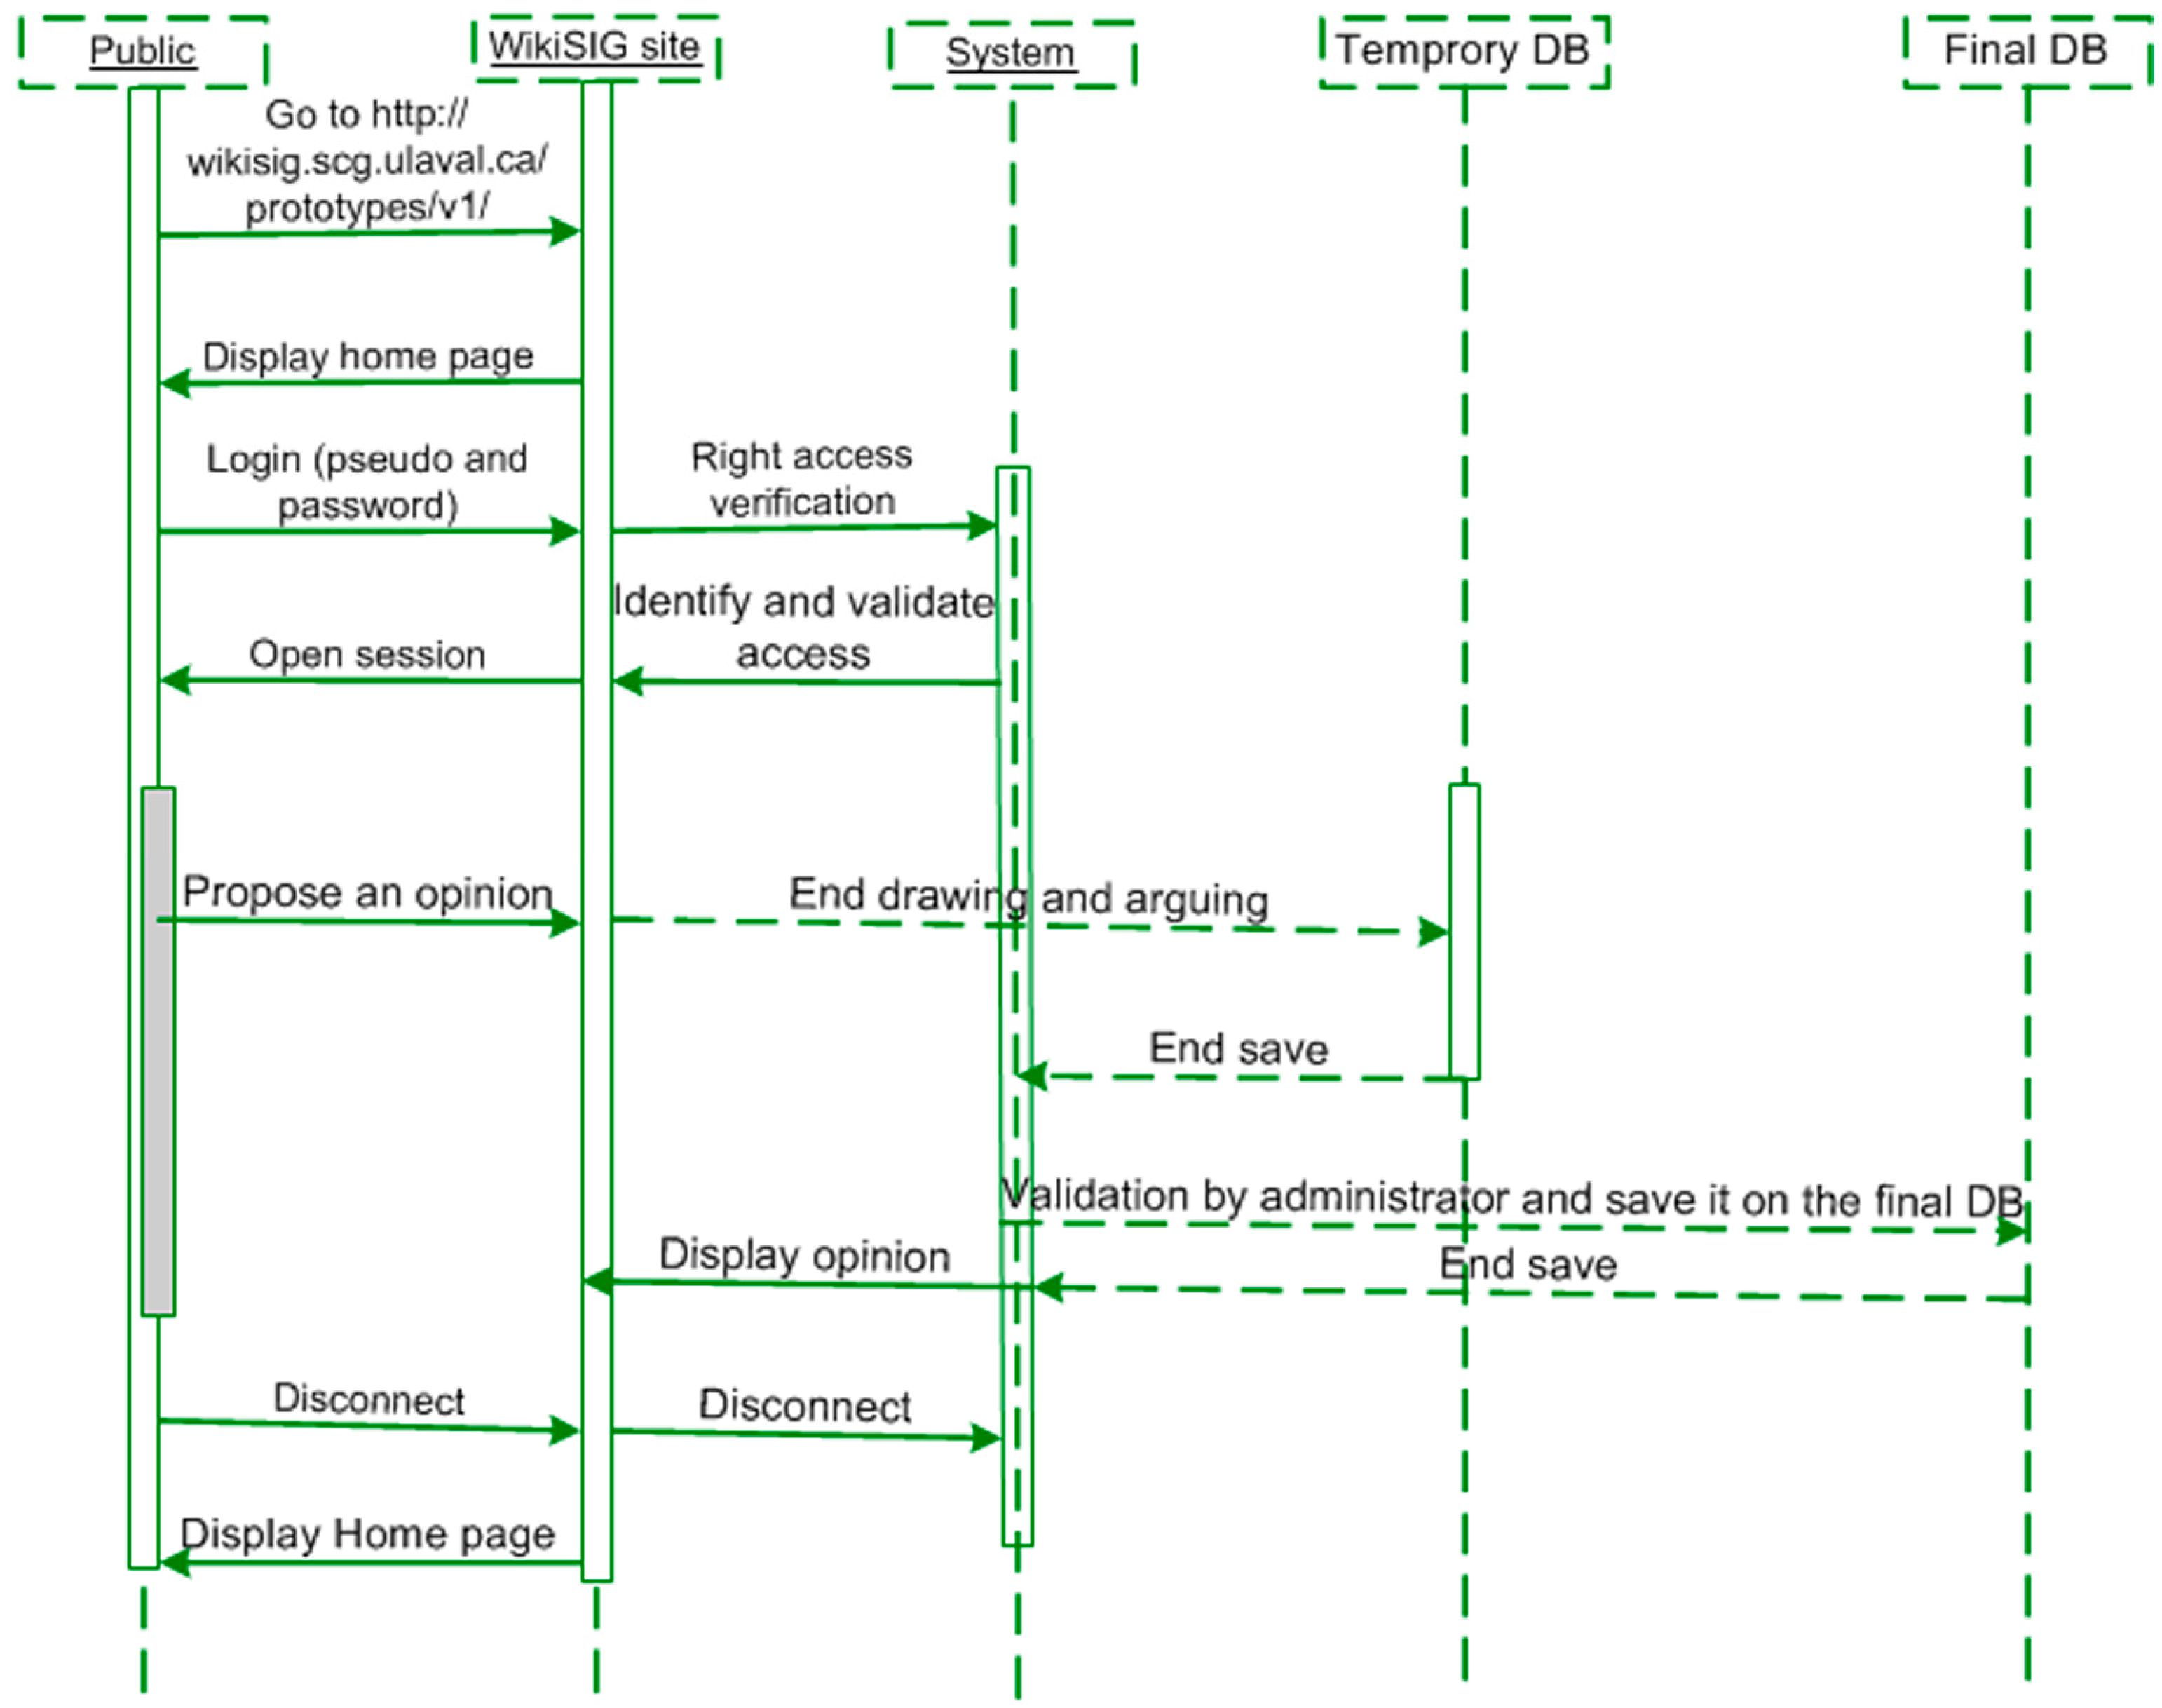
We distinguish two cases regarding the authenticated public who participate in the project with peers: Case 1 where the proposed opinion is accepted by the administrator (
Figure 18) and Case 2 where the proposed opinion is rejected by the administrator (
Figure 19).
Figure 18.
Sequence diagram of connected public when their opinion is accepted. Case 1: the proposed opinion is accepted by the administrator.
Figure 18.
Sequence diagram of connected public when their opinion is accepted. Case 1: the proposed opinion is accepted by the administrator.
Figure 19.
Sequence diagram of connected public where the opinion is rejected. Case 2: the proposed opinion is rejected by the administrator.
Figure 19.
Sequence diagram of connected public where the opinion is rejected. Case 2: the proposed opinion is rejected by the administrator.
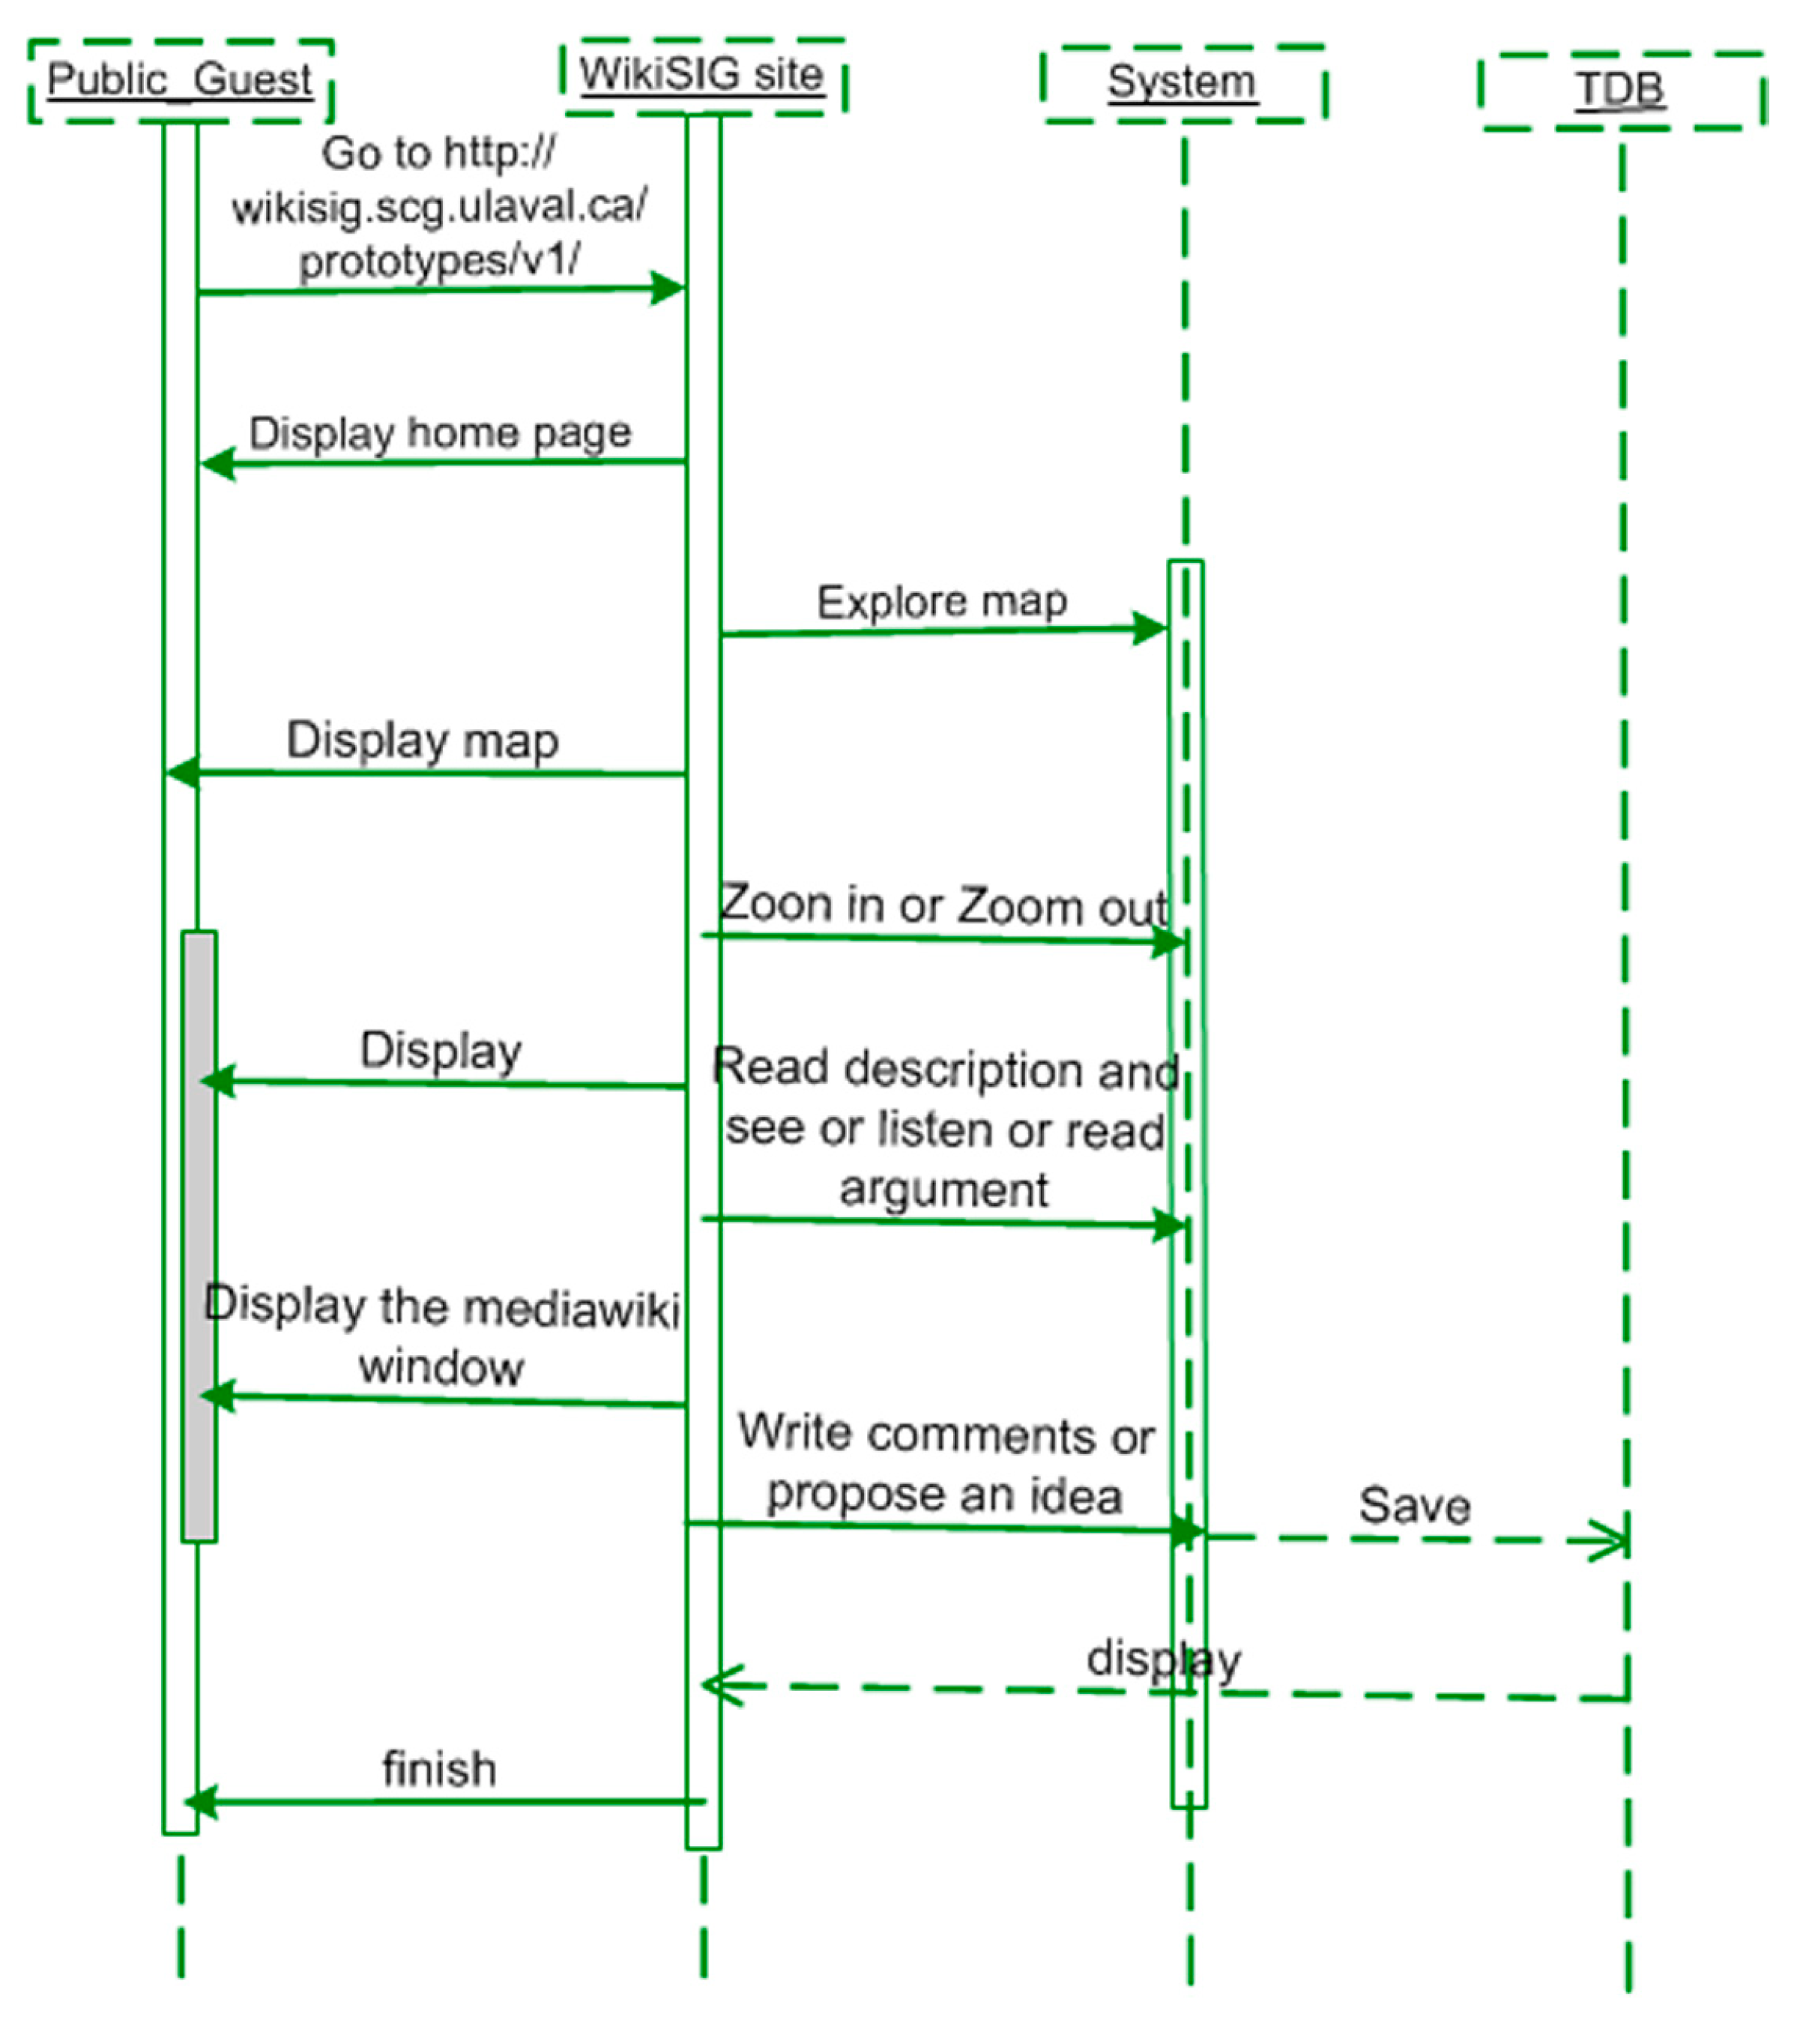
Not connected public members have no right to edit. They just visit the site without being formally connected (
Figure 20).
Figure 20.
Sequence diagram of the not connected public.
Figure 20.
Sequence diagram of the not connected public.
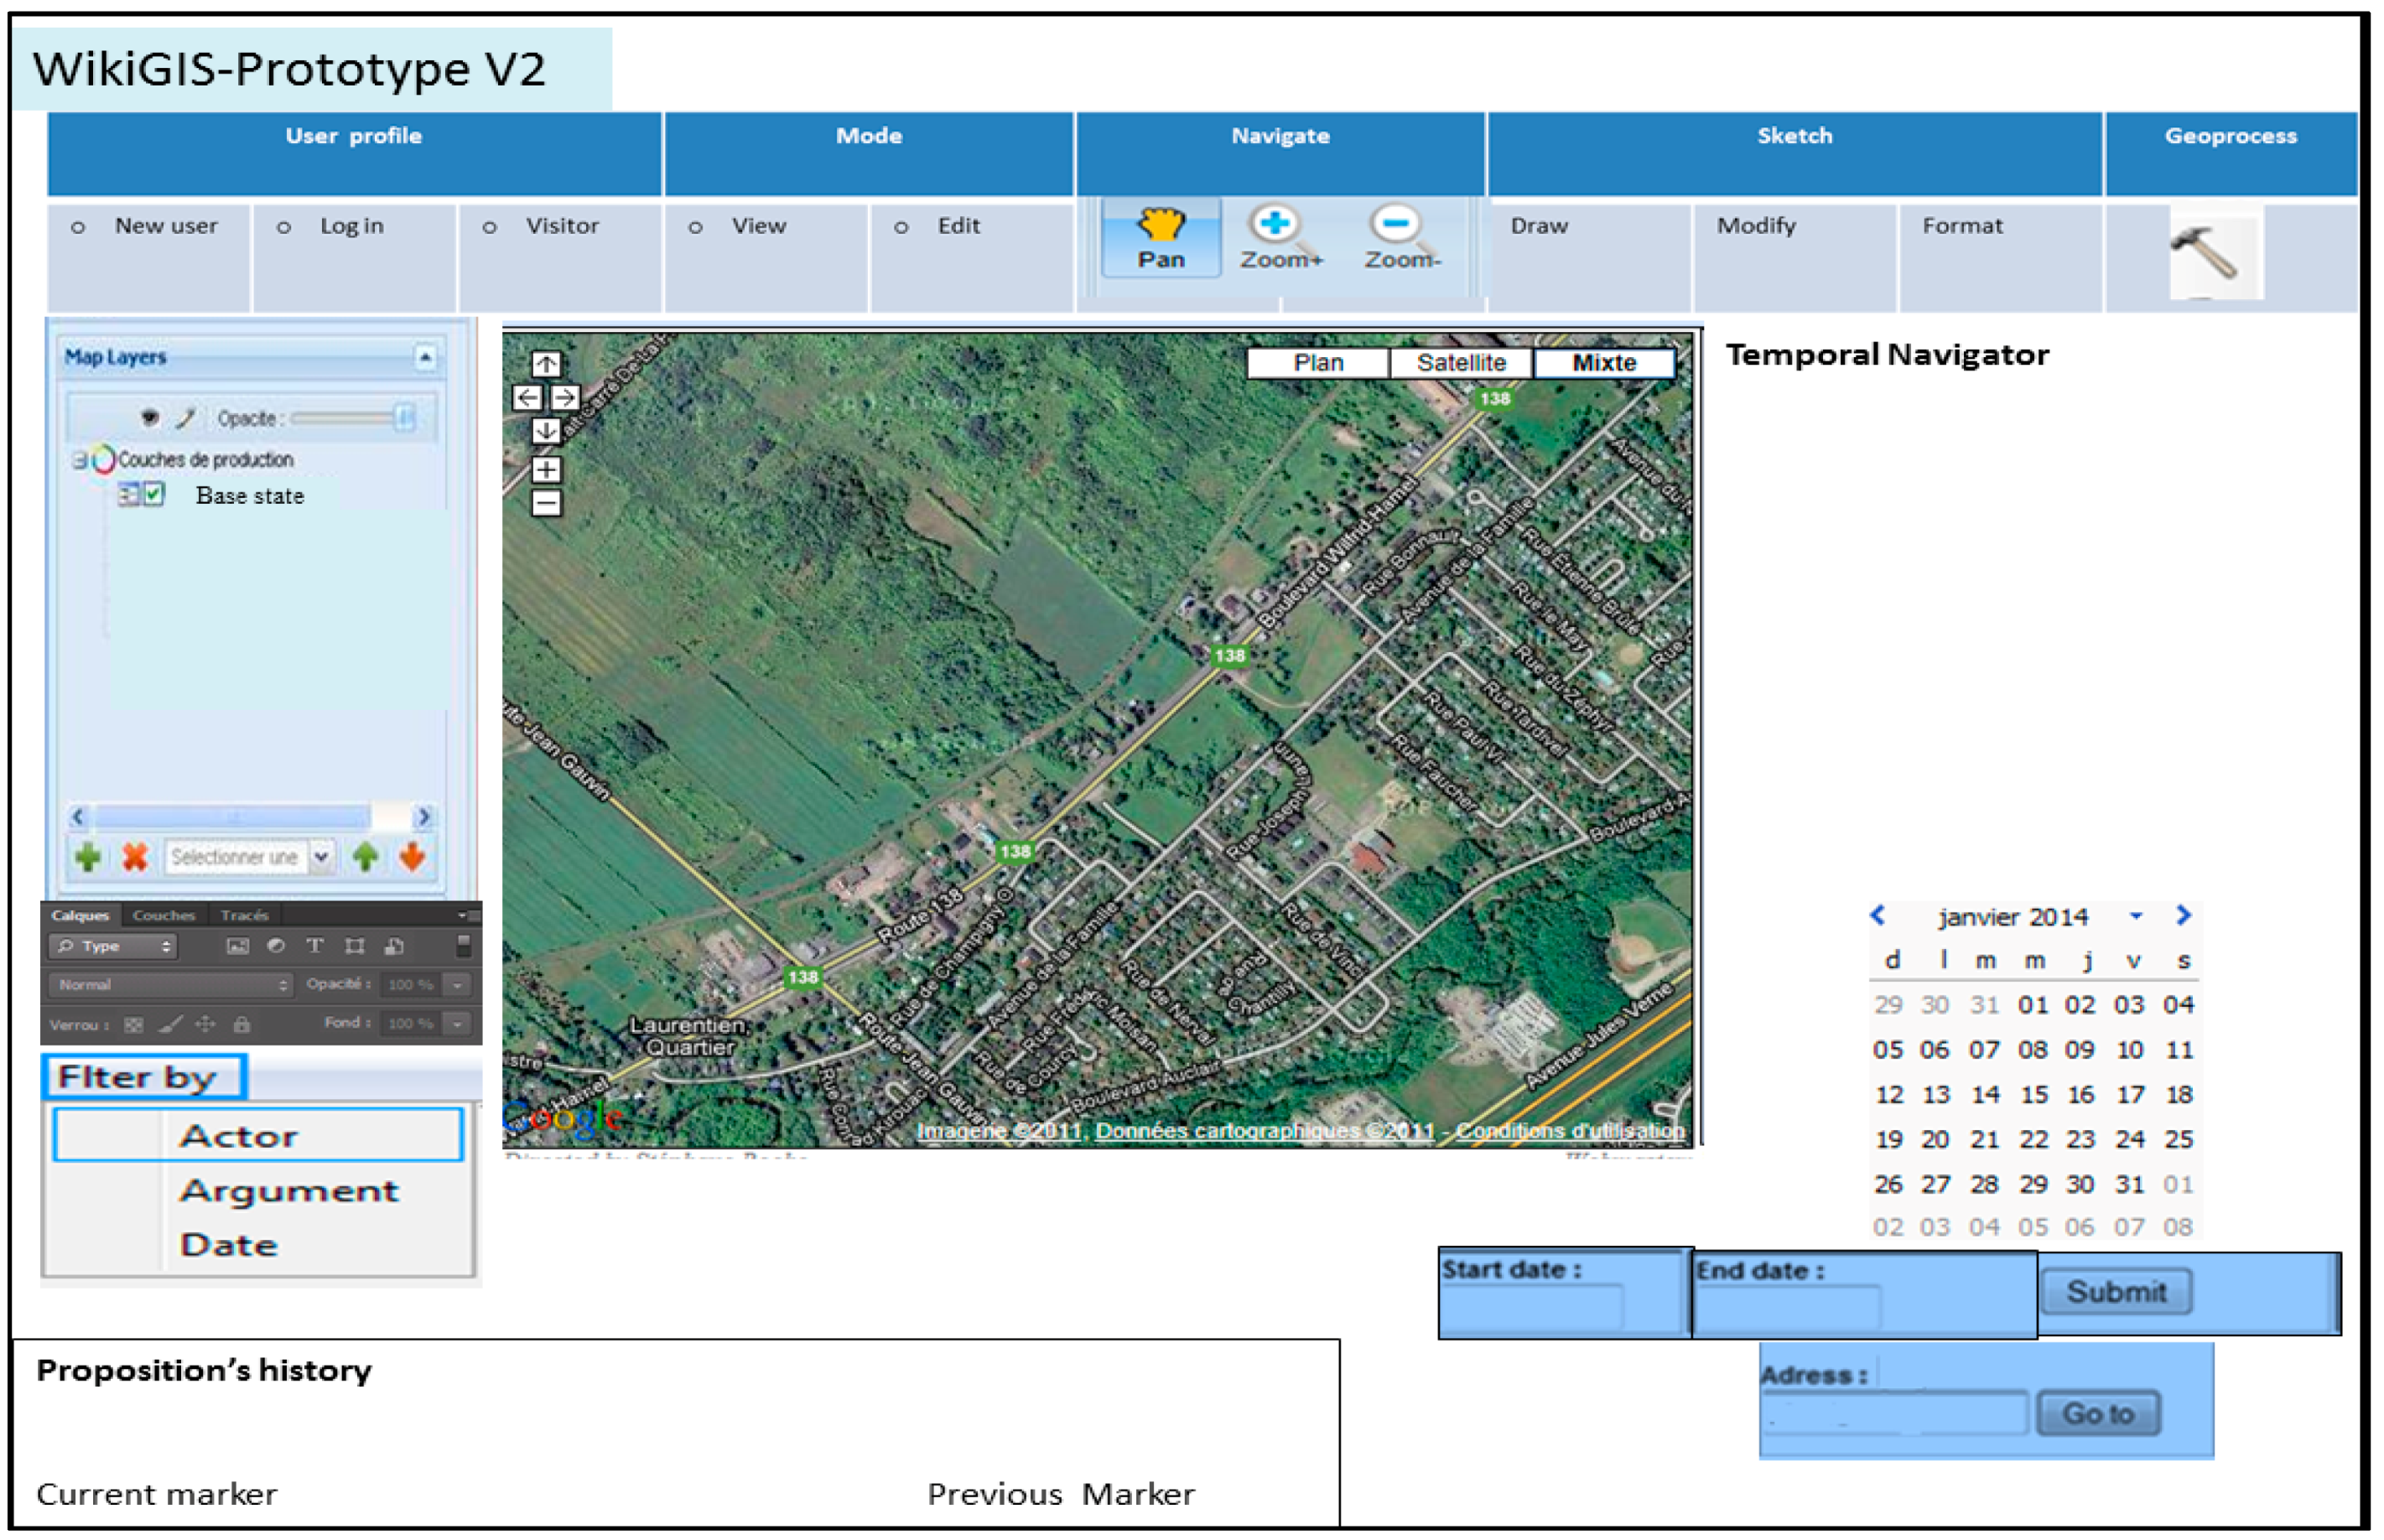
8. WikiGIS Cartographic Interface
In this section, we propose the new cartographic user interface of WikiGIS. This interface represents a visual proposal in support of the conceptual framework schematized by UML diagrams in the previous sections. The idea here is to make this conceptual framework more readable. The new WikiGIS prototype has a temporal browser displayed in cascade. Thus, any new contribution is linked to the previous contribution (and not necessarily the contribution directly before in time). The following categories are represented by different colors to facilitate browsing:
- -
Creating/adding a new object will be marked in green;
- -
Modifying an existing object will be marked in blue;
- -
Removal will be represented by a red cross.
We refer to the example of the nursery construction in
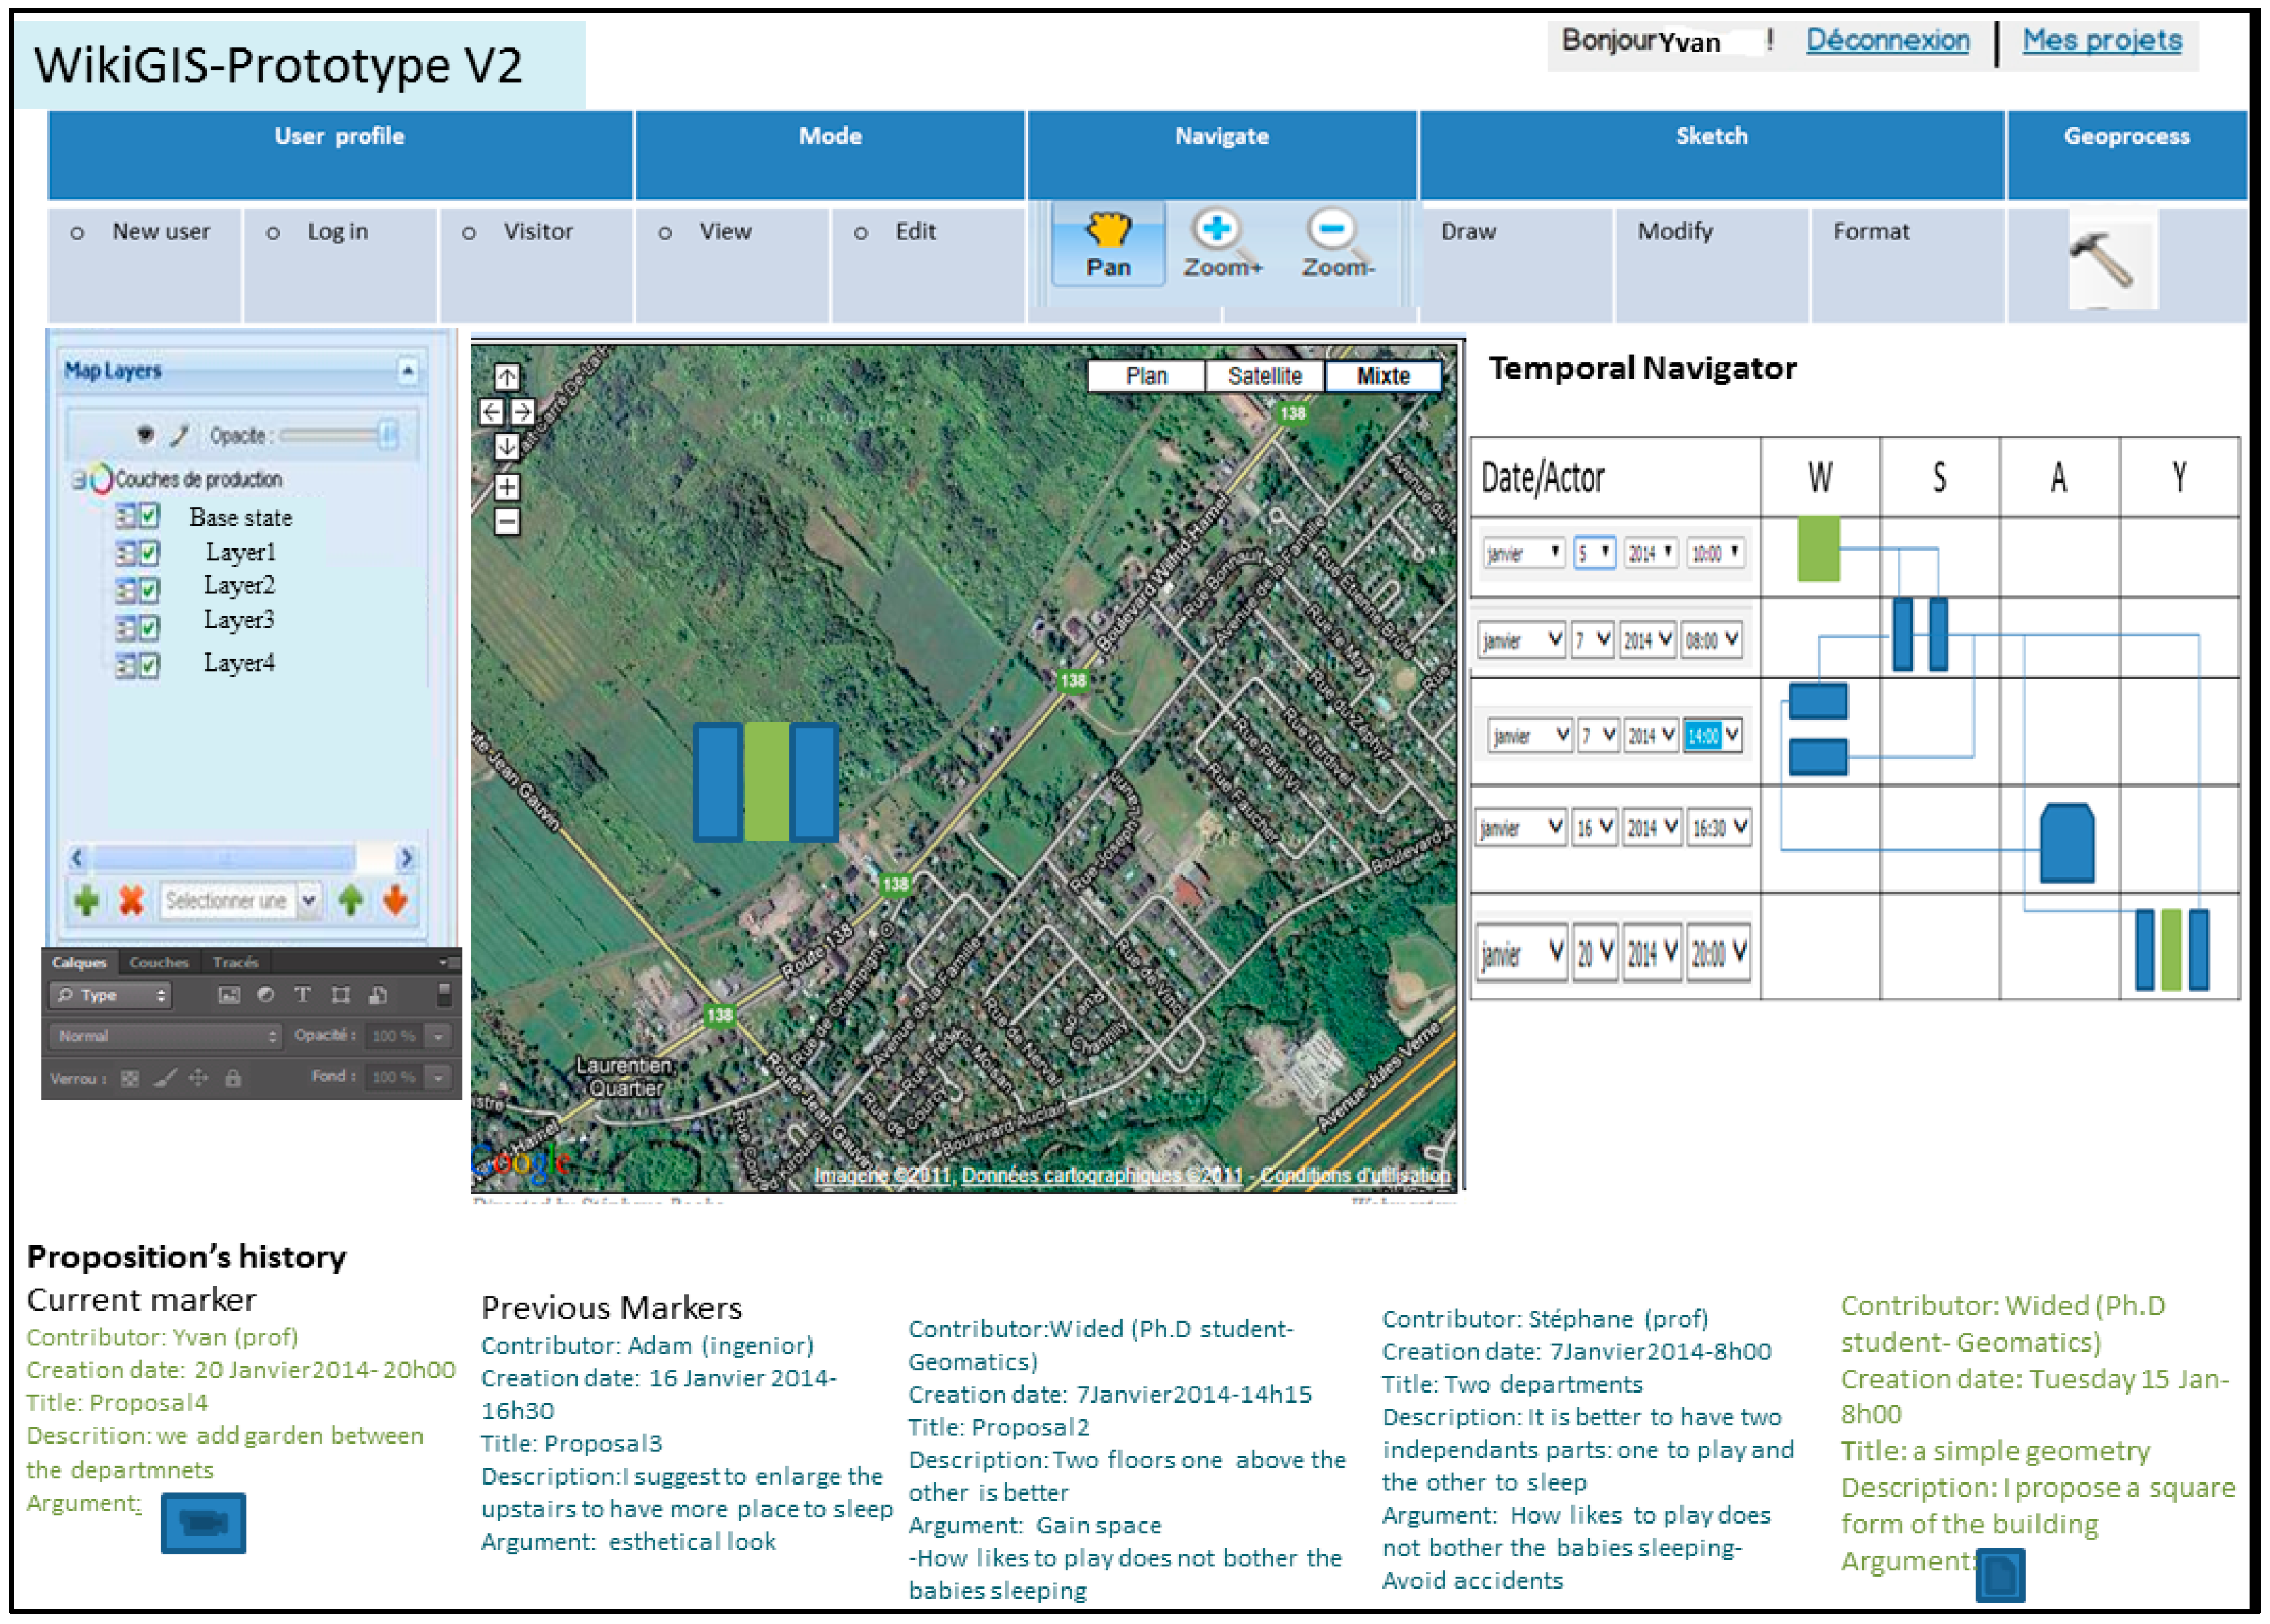
Section 3 to better understand how the WikiGIS proposal works through design mock-ups. The cartographic interface with temporal navigation (to the right of the map) and the text traceability window (at the bottom of map) of the new WikiGIS prototype will look as shown in the following simulation.
In
Figure 21, we present all the windows of the user interface of WikiGIS. Some windows could be masked later during the project to visualize better the process.
Figure 21.
Cartographic iterface of WikiGIS.
Figure 21.
Cartographic iterface of WikiGIS.
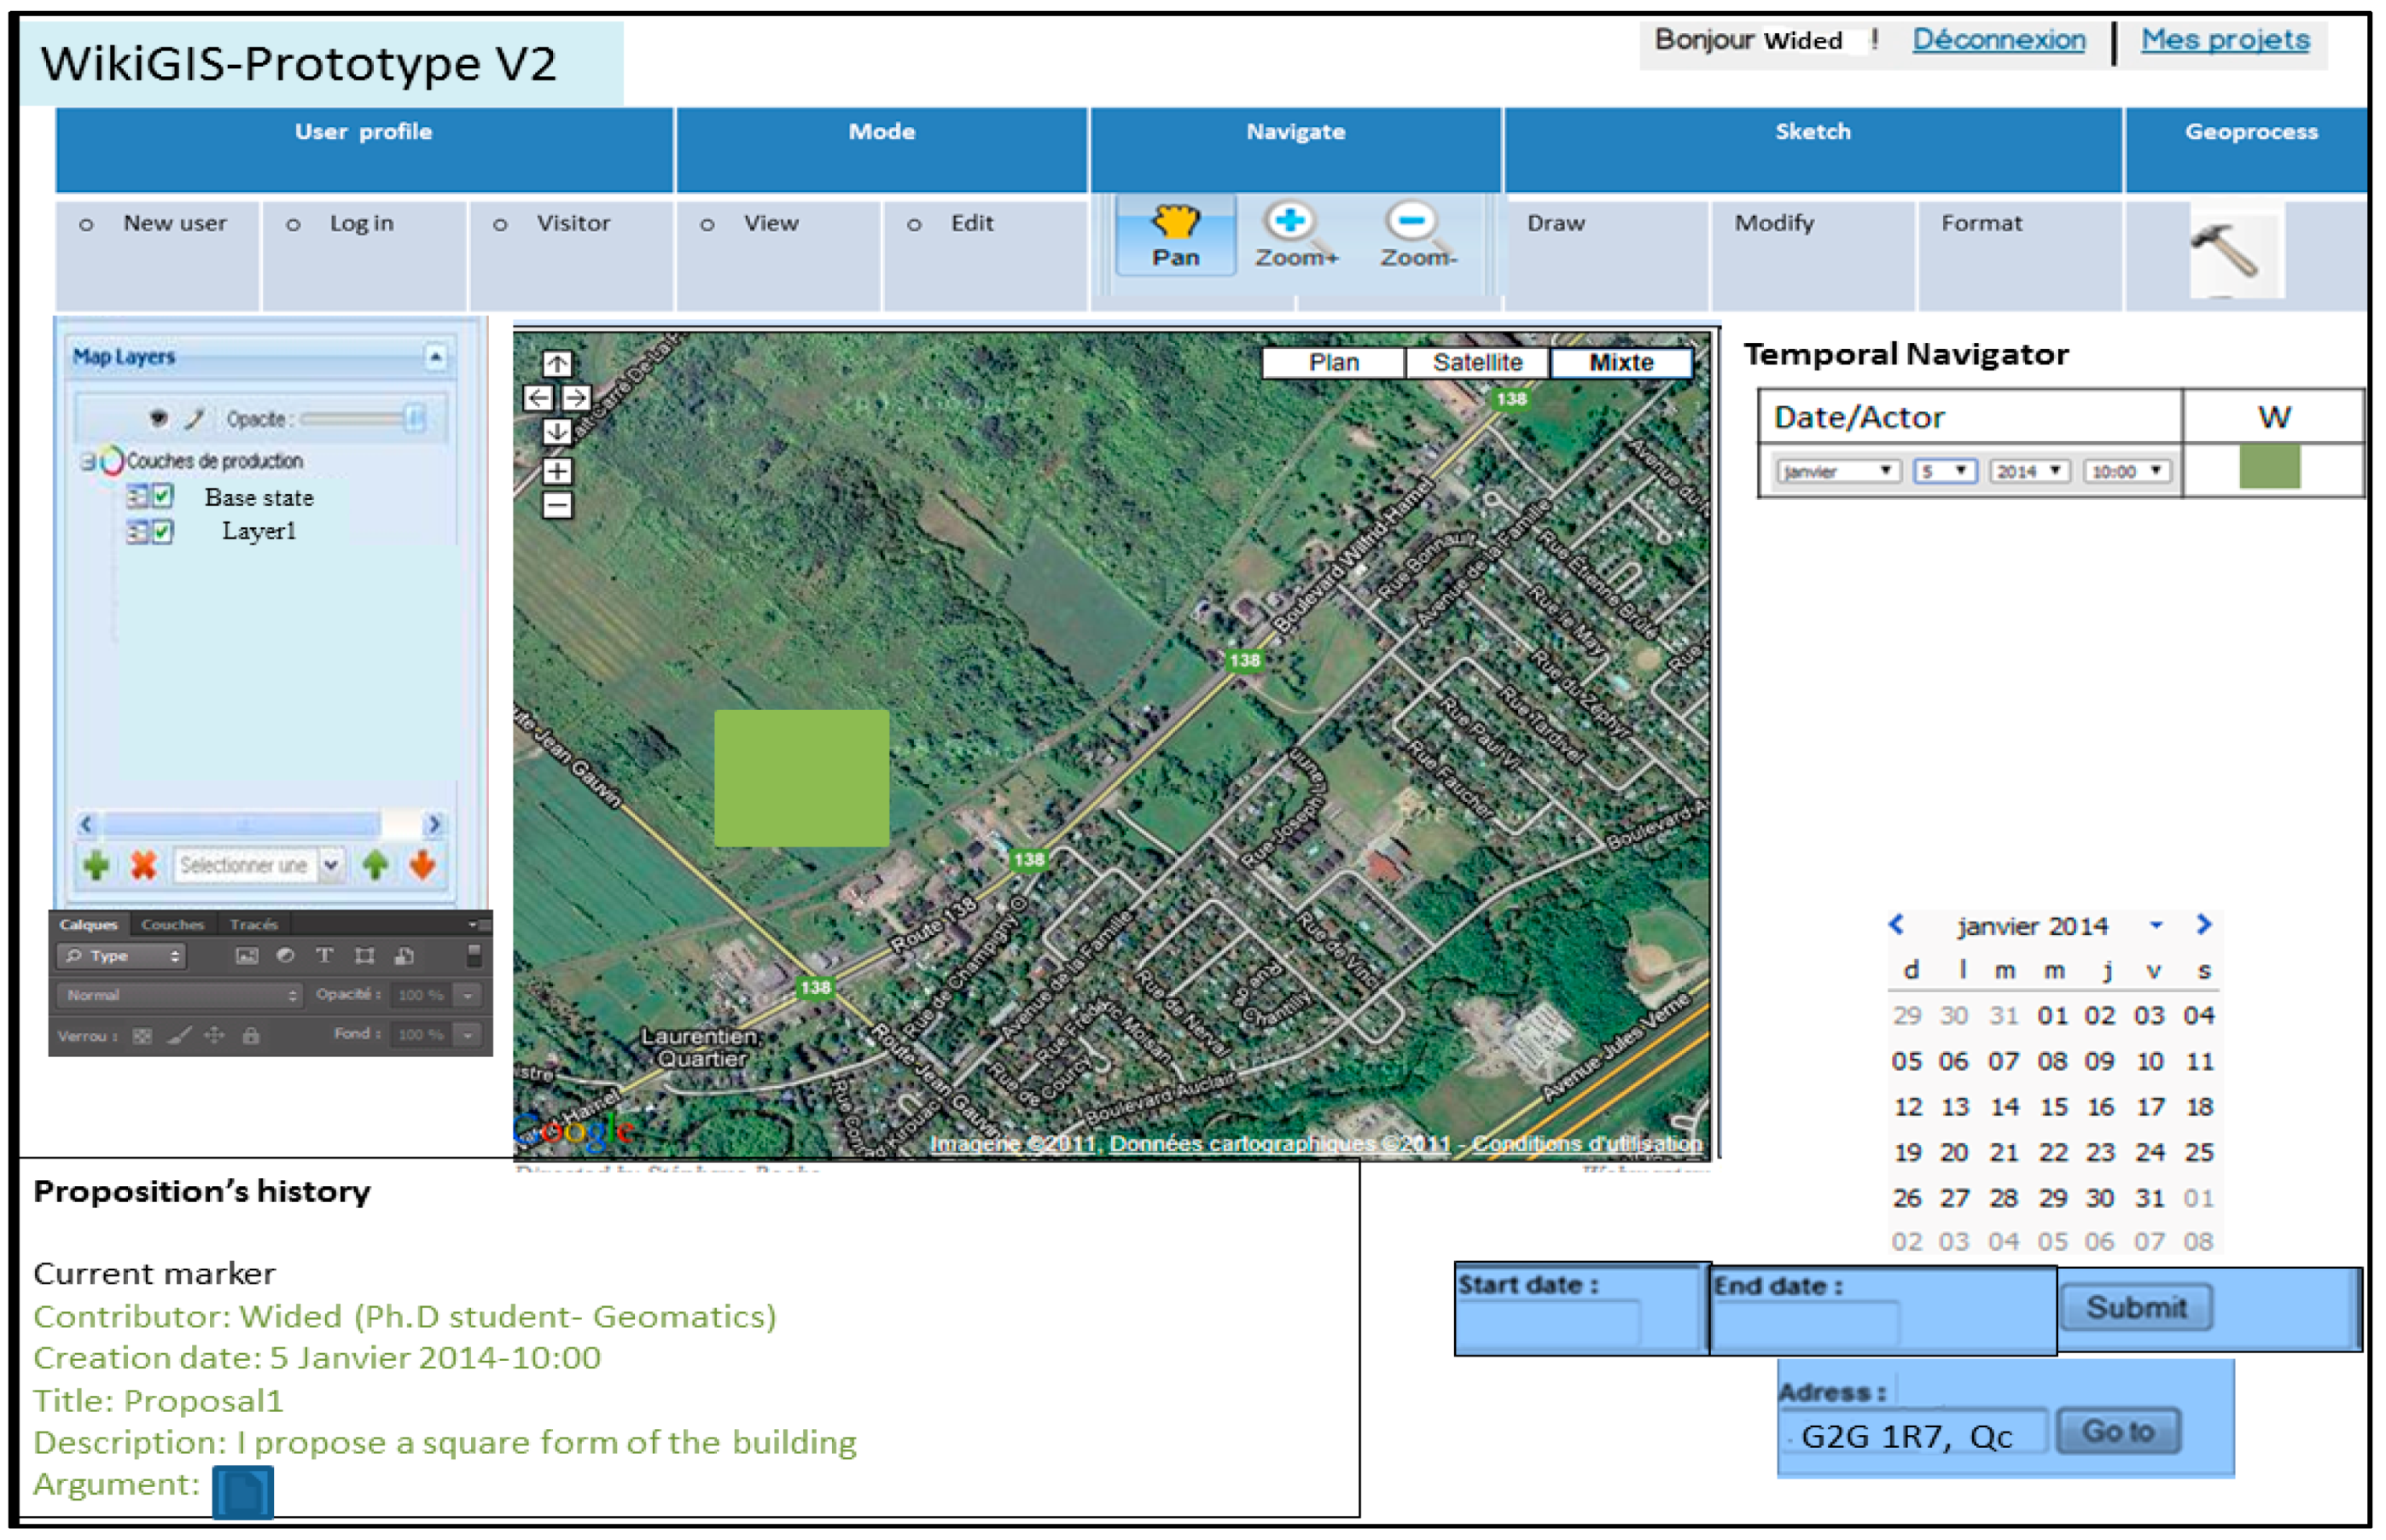
The project starts: the first user proposes a simple square form and provides an AutoCAD plan as argument (
Figure 22).
Figure 22.
First proposal in the project.
Figure 22.
First proposal in the project.
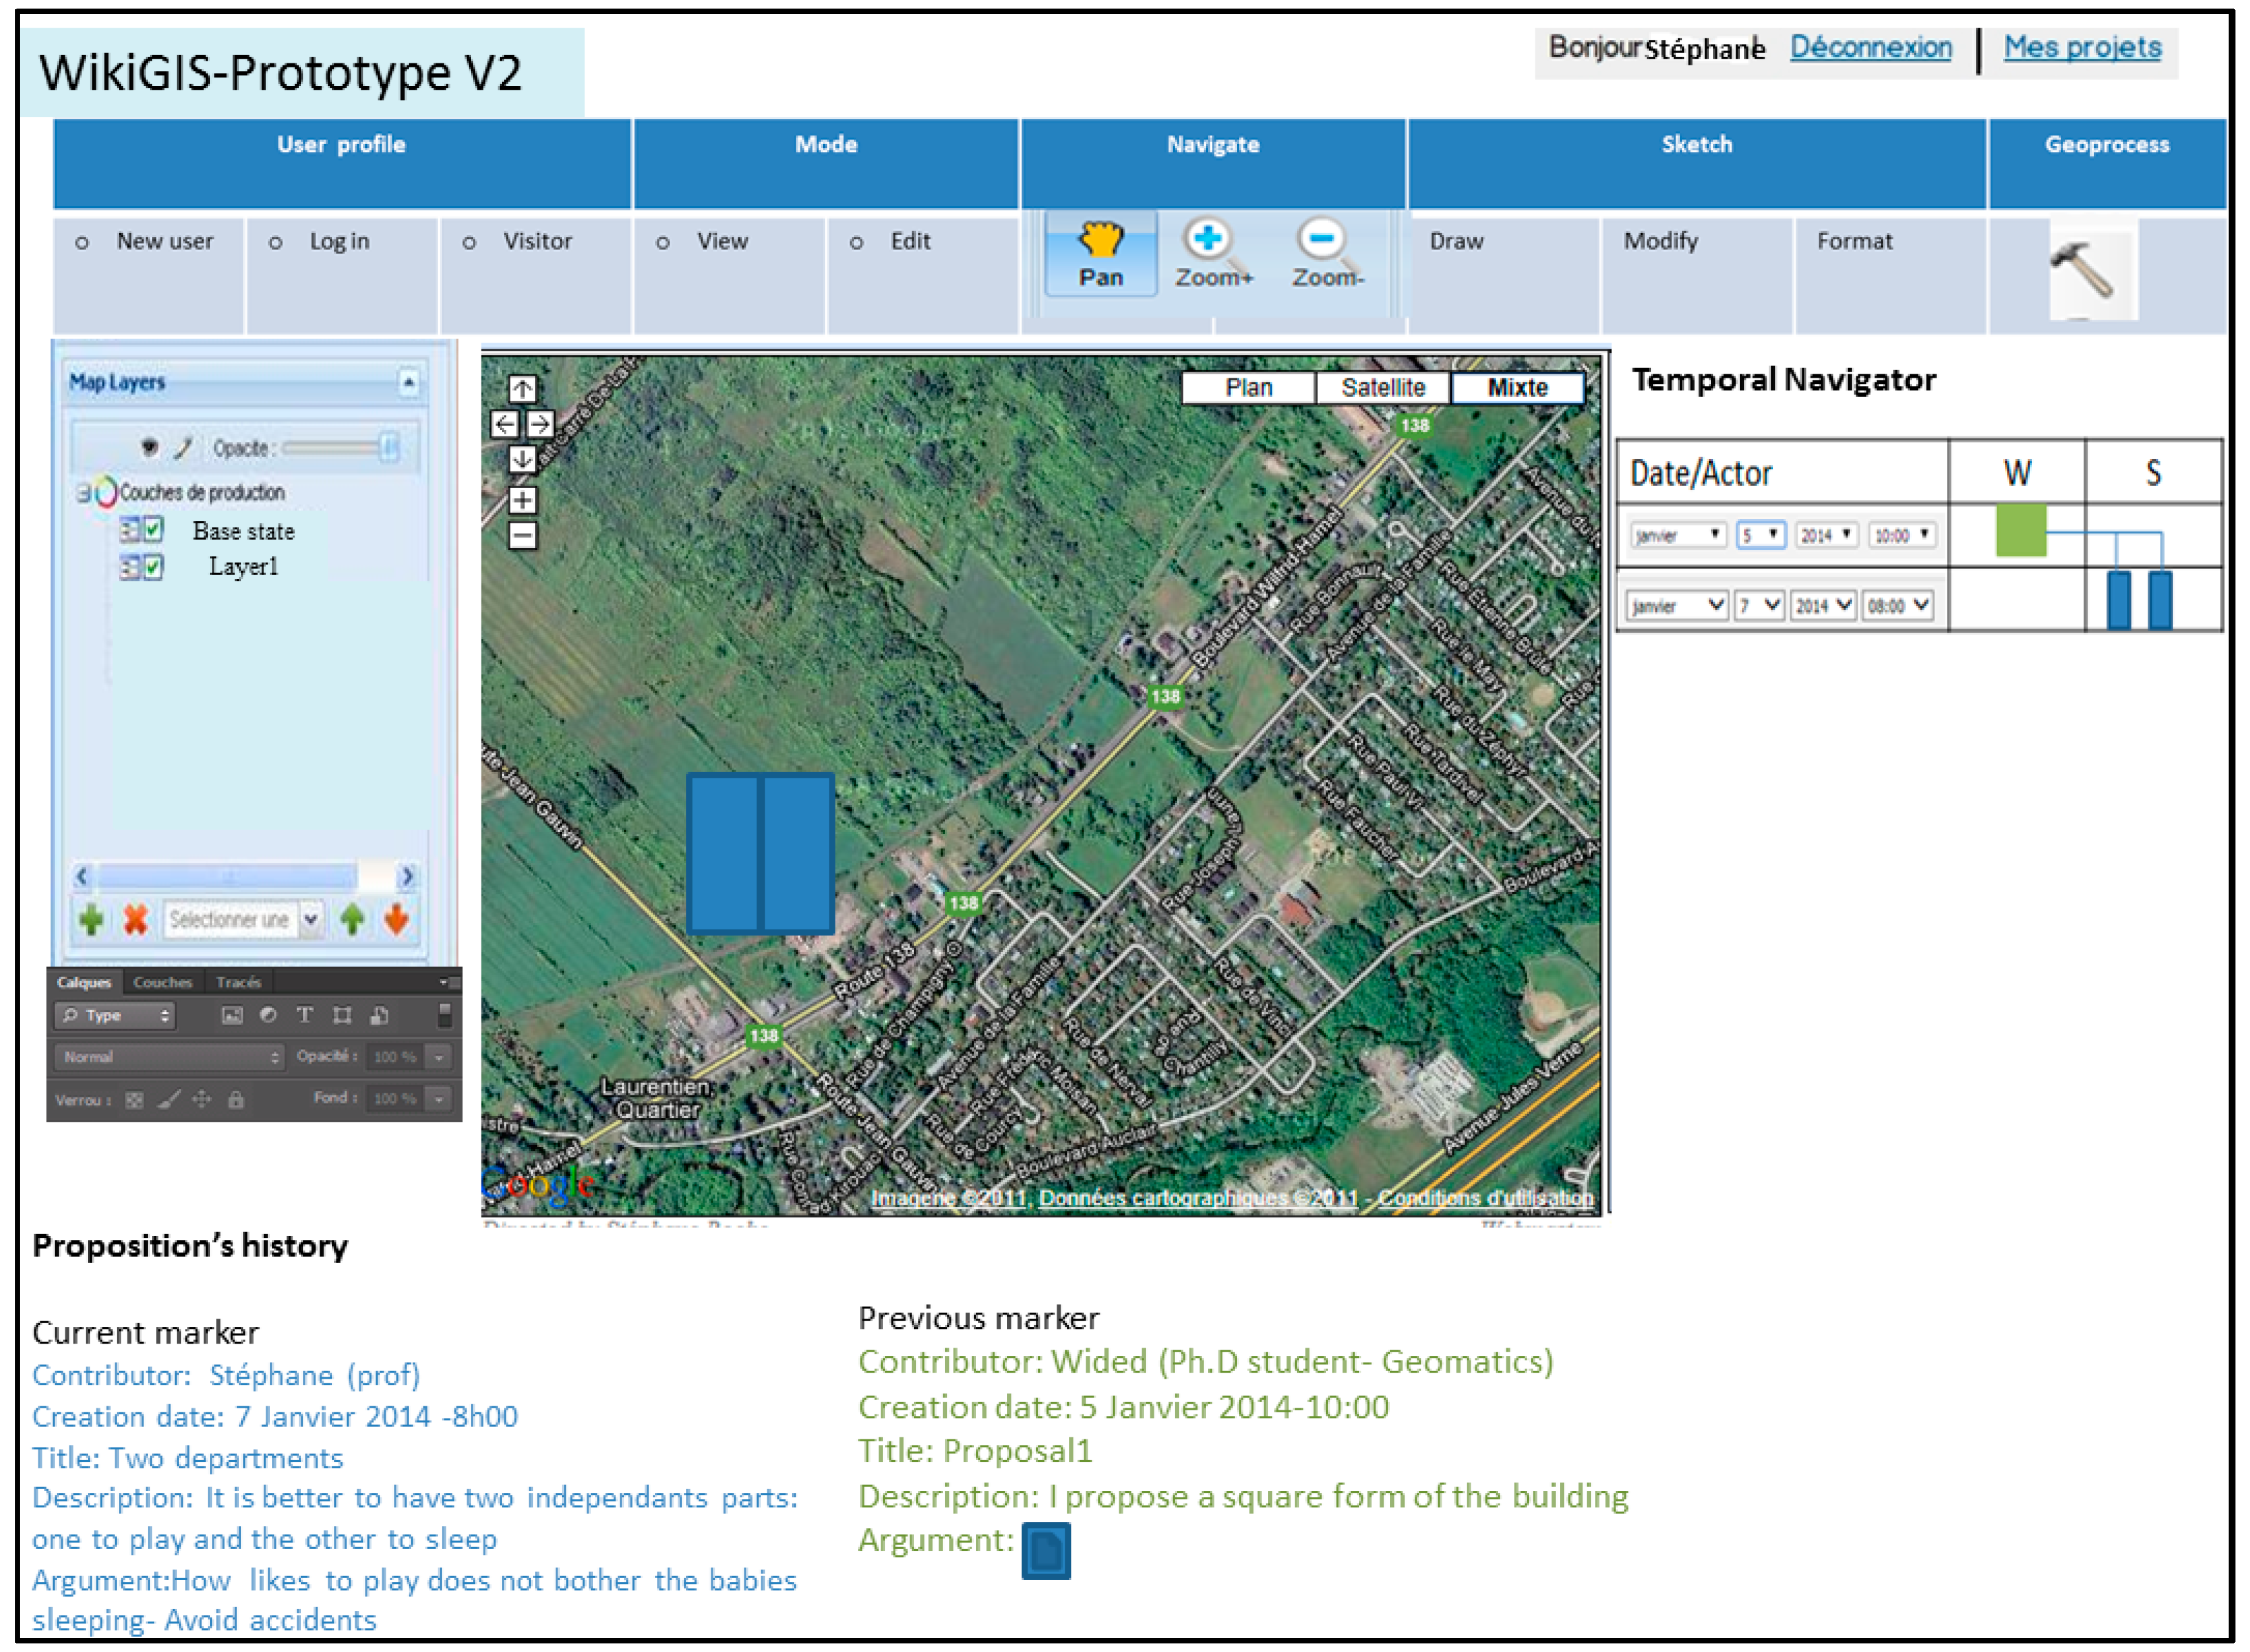
The second contributor proposes dividing the polygon into two departments and supports his proposal with a text (
Figure 23).
Figure 23.
Second proposal in the project.
Figure 23.
Second proposal in the project.
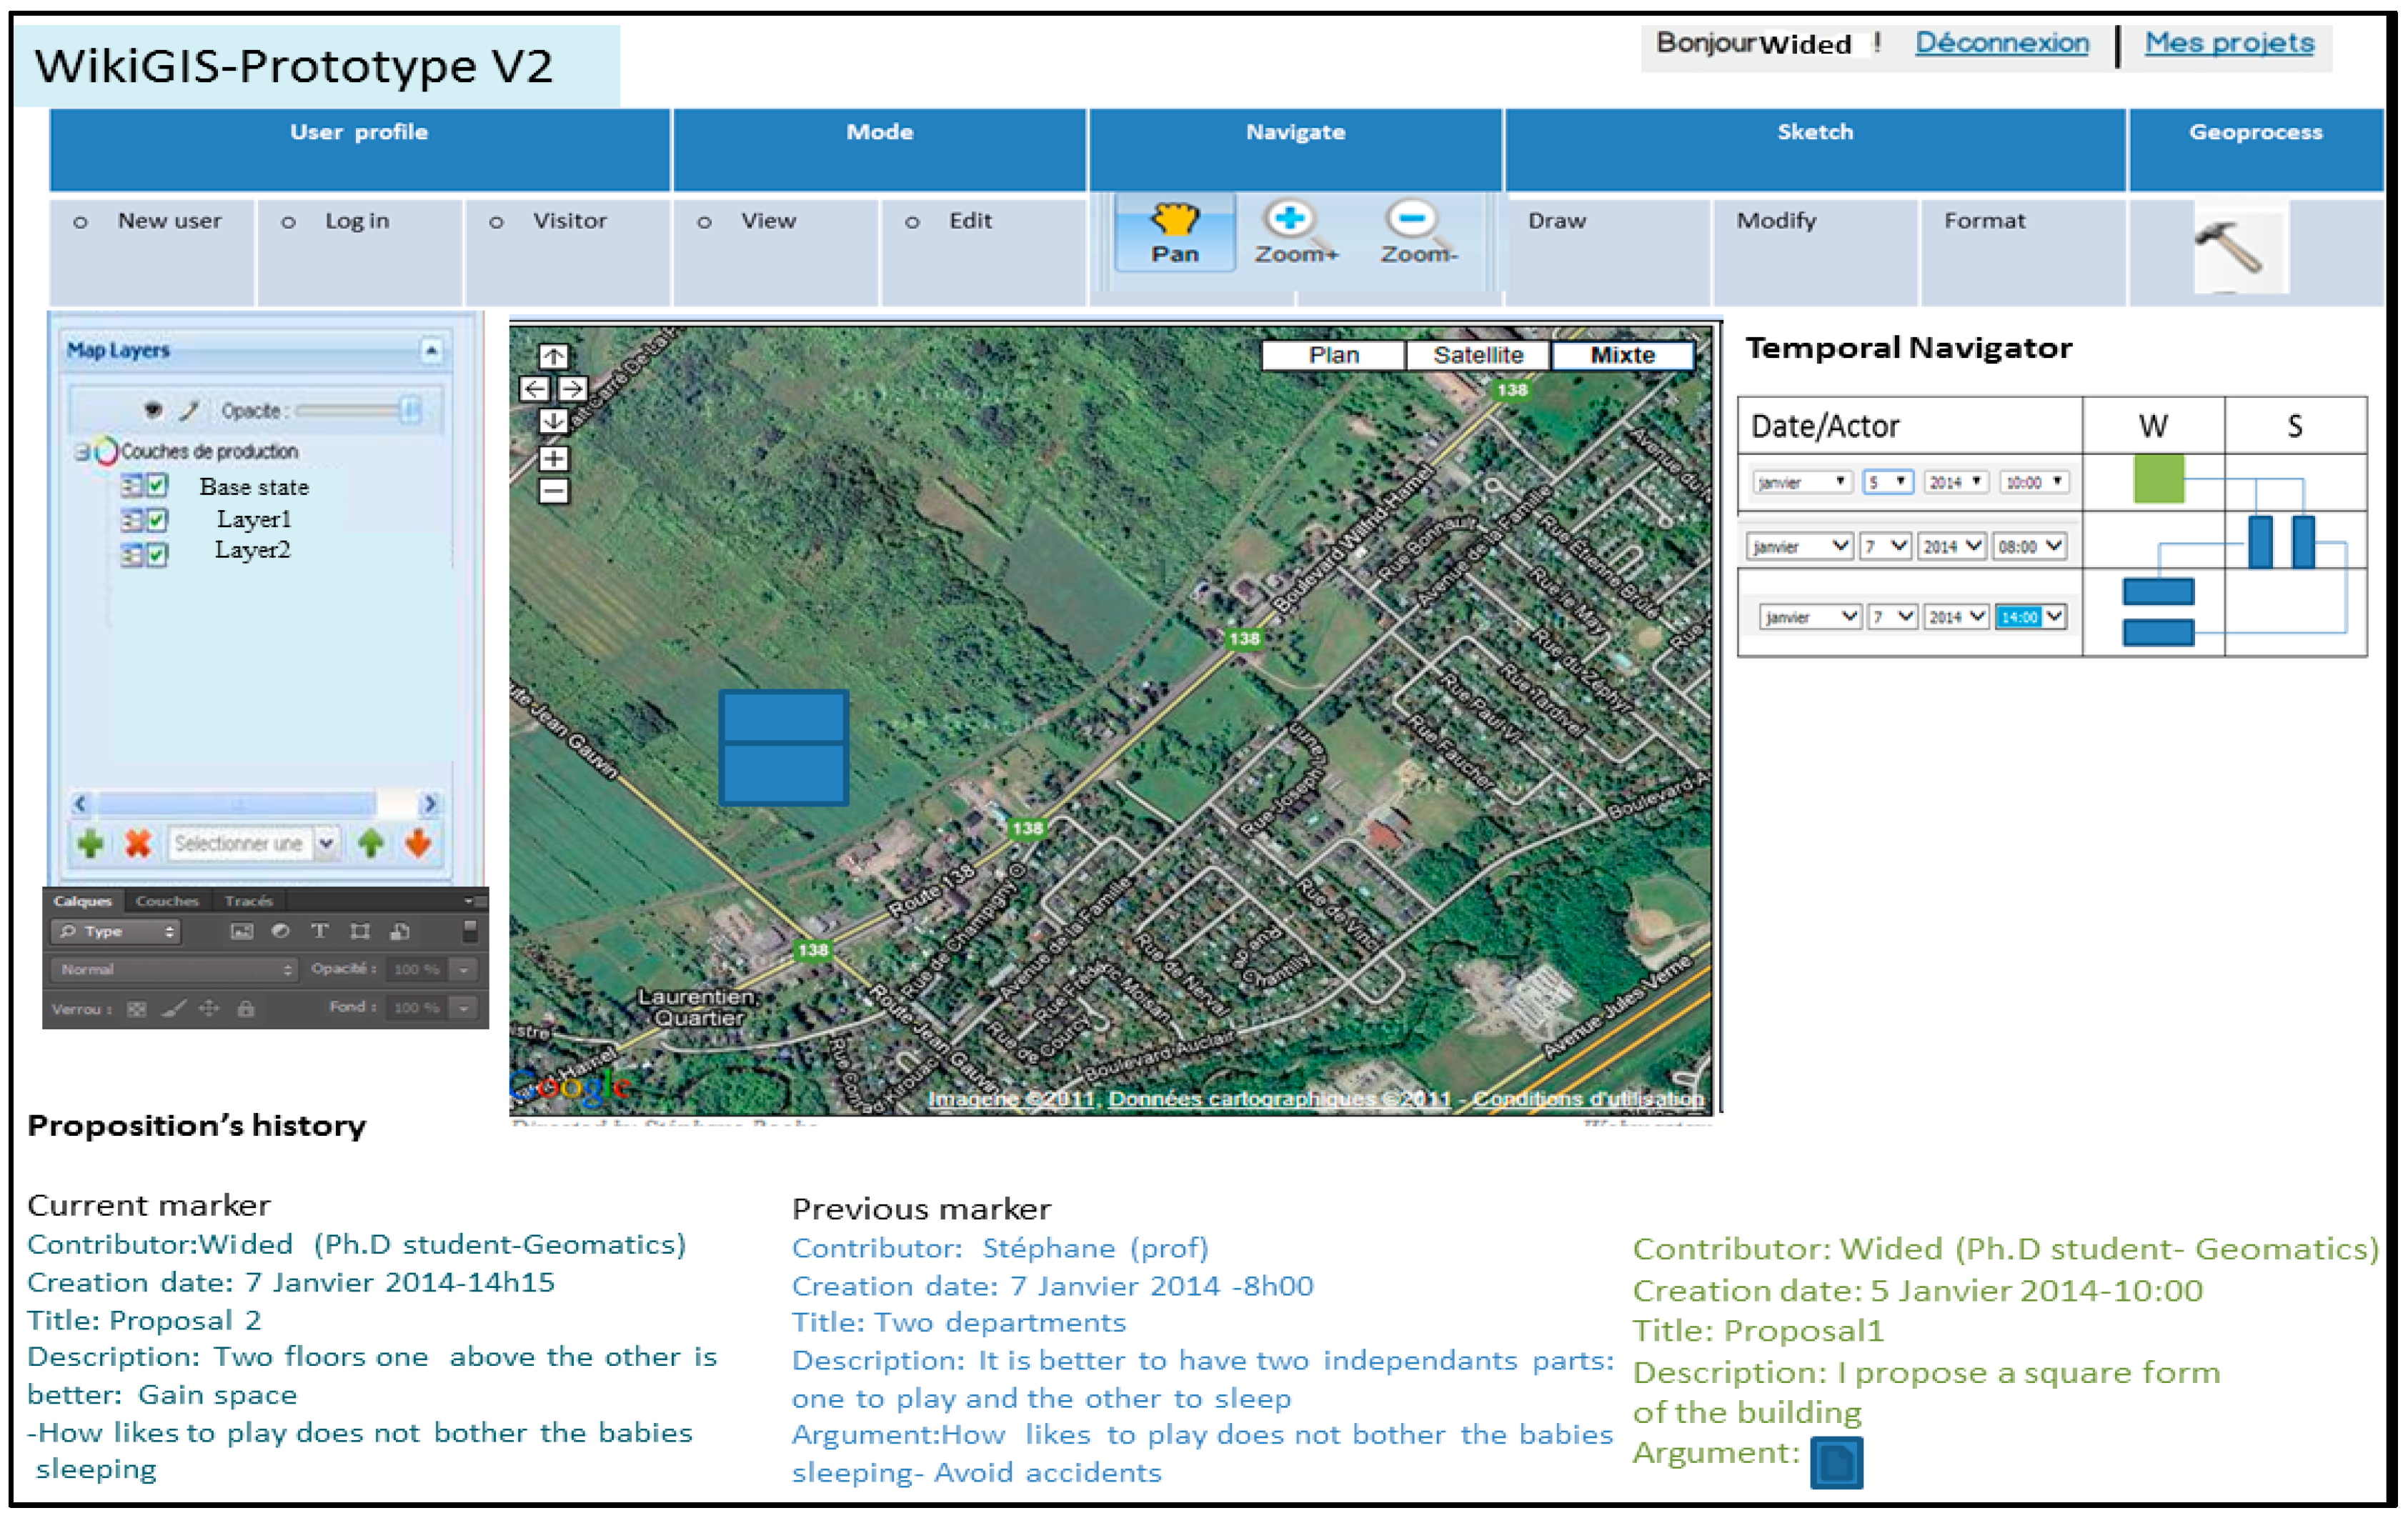
The first user likes the idea of two departments but proposes two floors. The calendar was masked to visualize the textual box (
Figure 24).
Figure 24.
Third proposal in the project.
Figure 24.
Third proposal in the project.
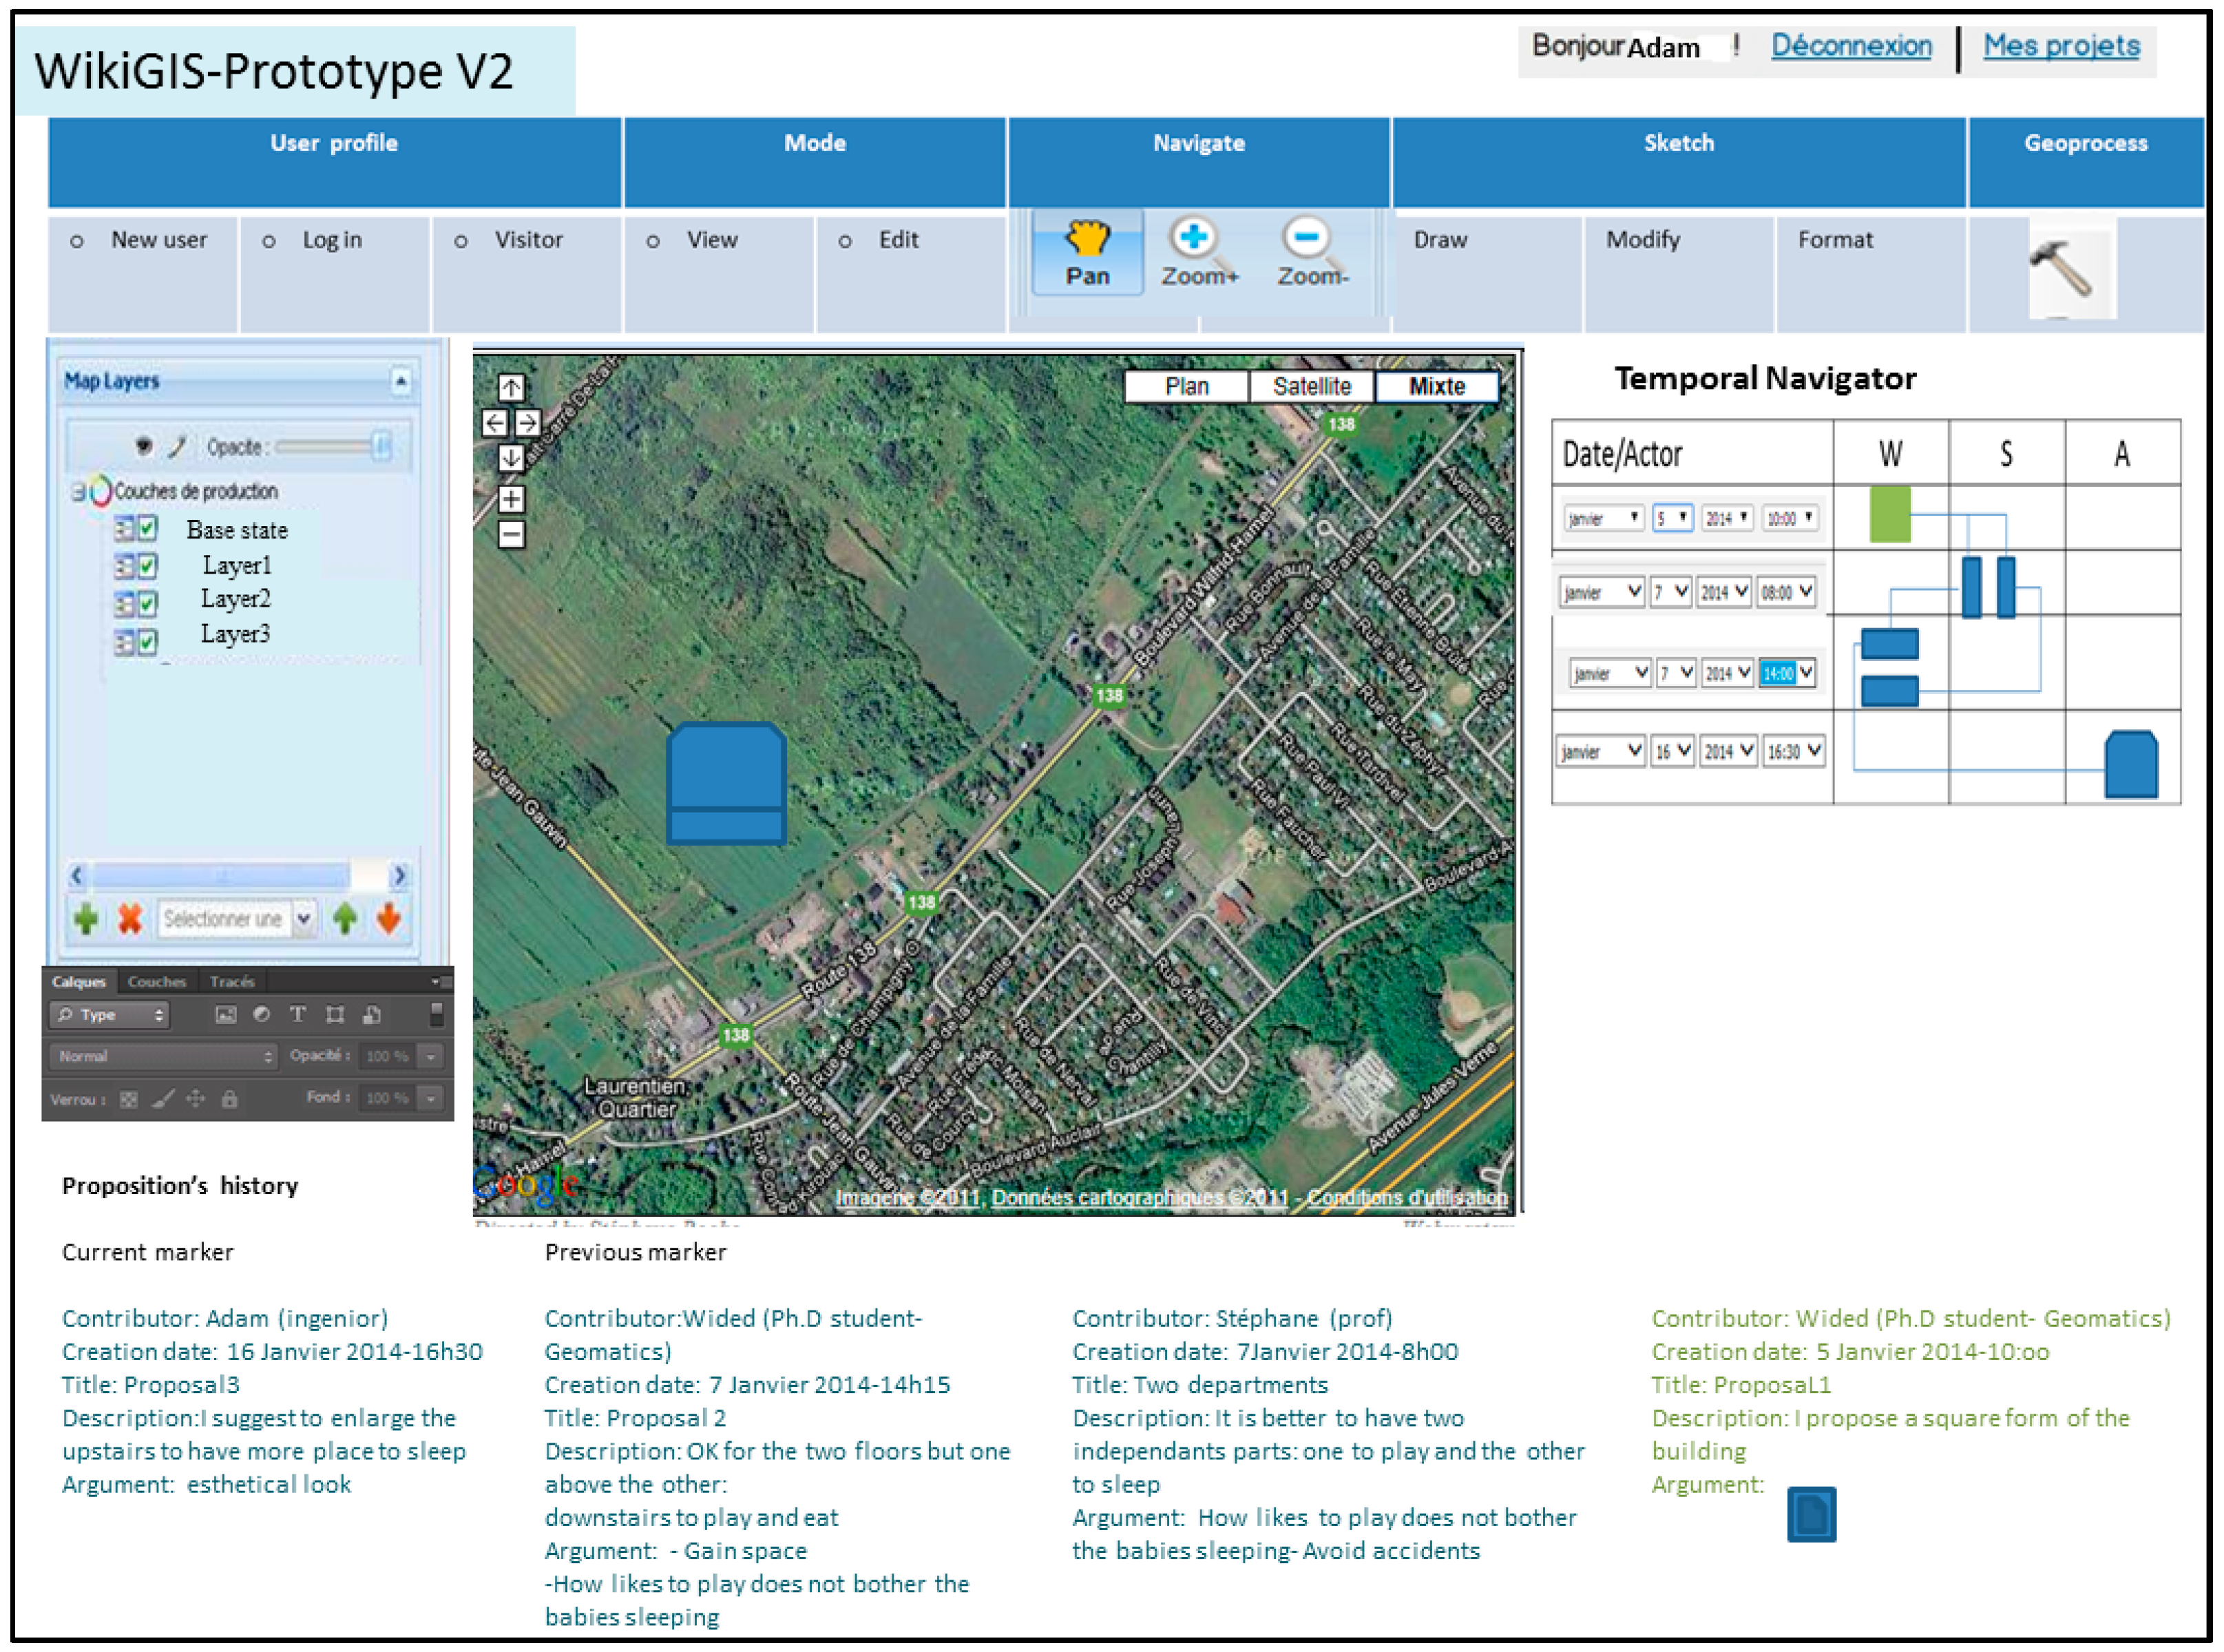
The third user proposes to change only the form of upstairs for aesthetic reasons (
Figure 25).
Figure 25.
Fourth proposal in the project.
Figure 25.
Fourth proposal in the project.
The fourth user proposes to add a garden between the departments and he argues his proposition by a video (
Figure 26).
Figure 26.
Fifth proposal in the project.
Figure 26.
Fifth proposal in the project.
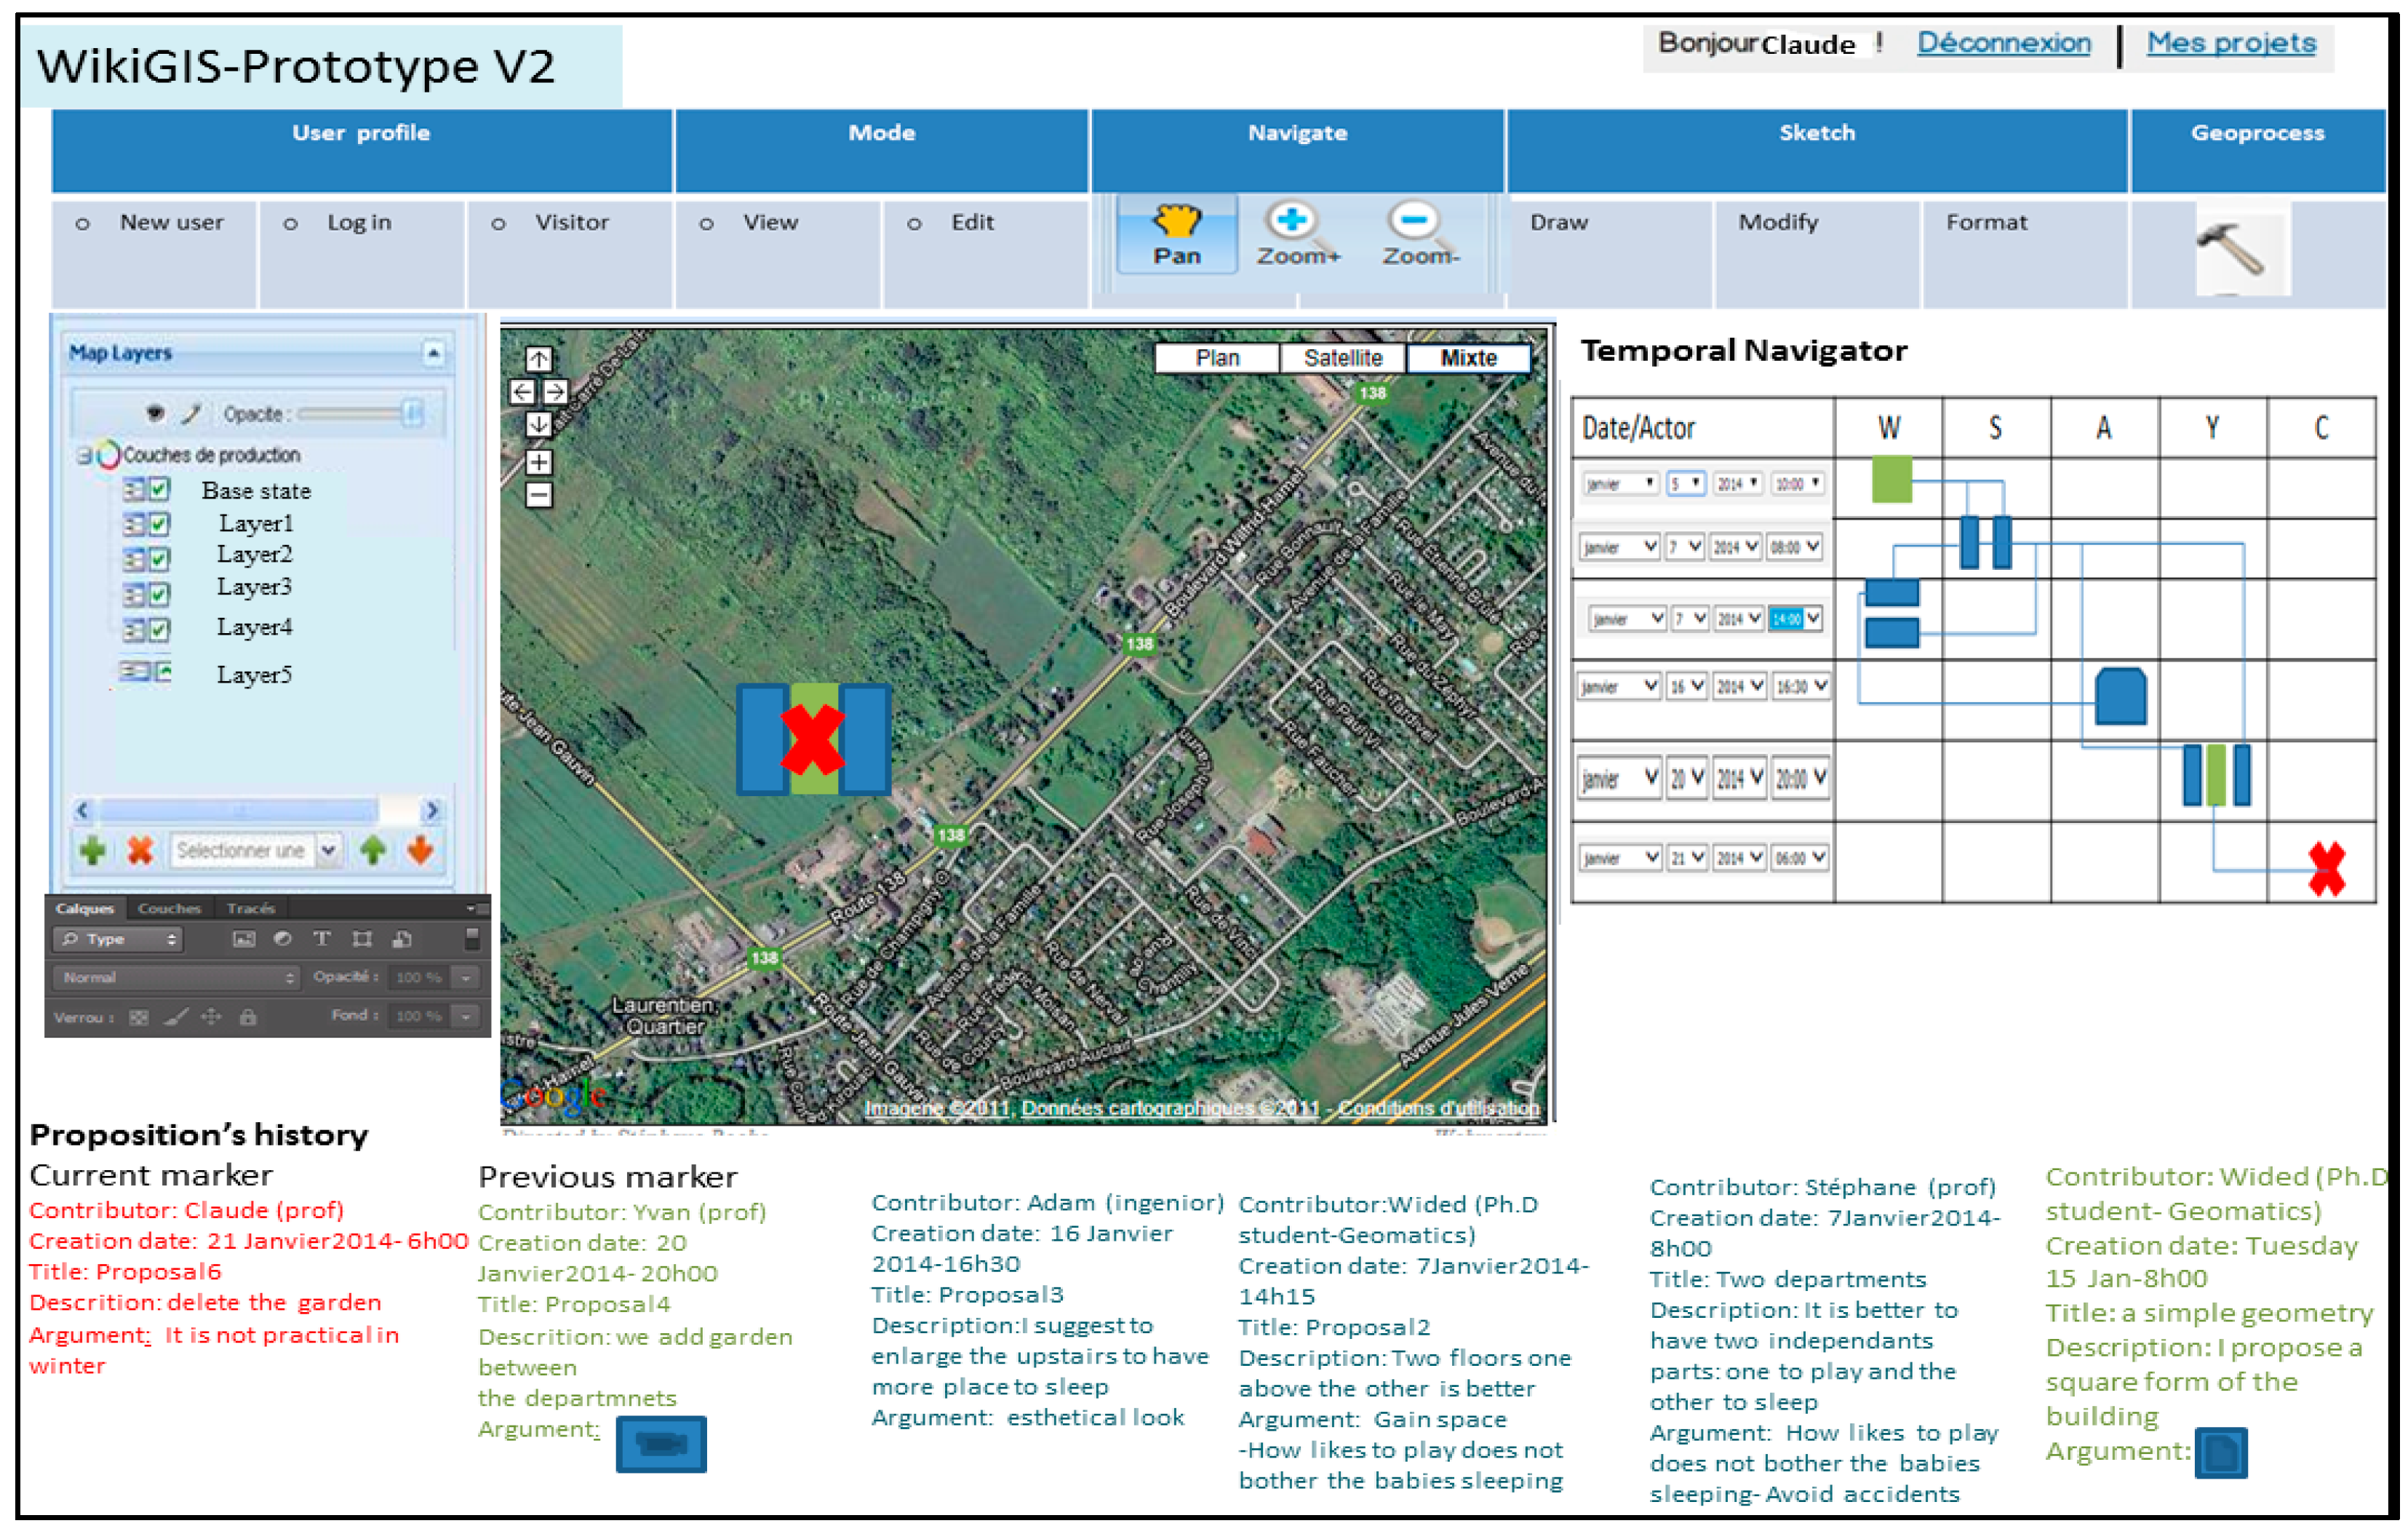
This actor does not agree with the previous contributions and he proposes to delete this garden (
Figure 27).
Figure 27.
Sixth proposal in the project.
Figure 27.
Sixth proposal in the project.
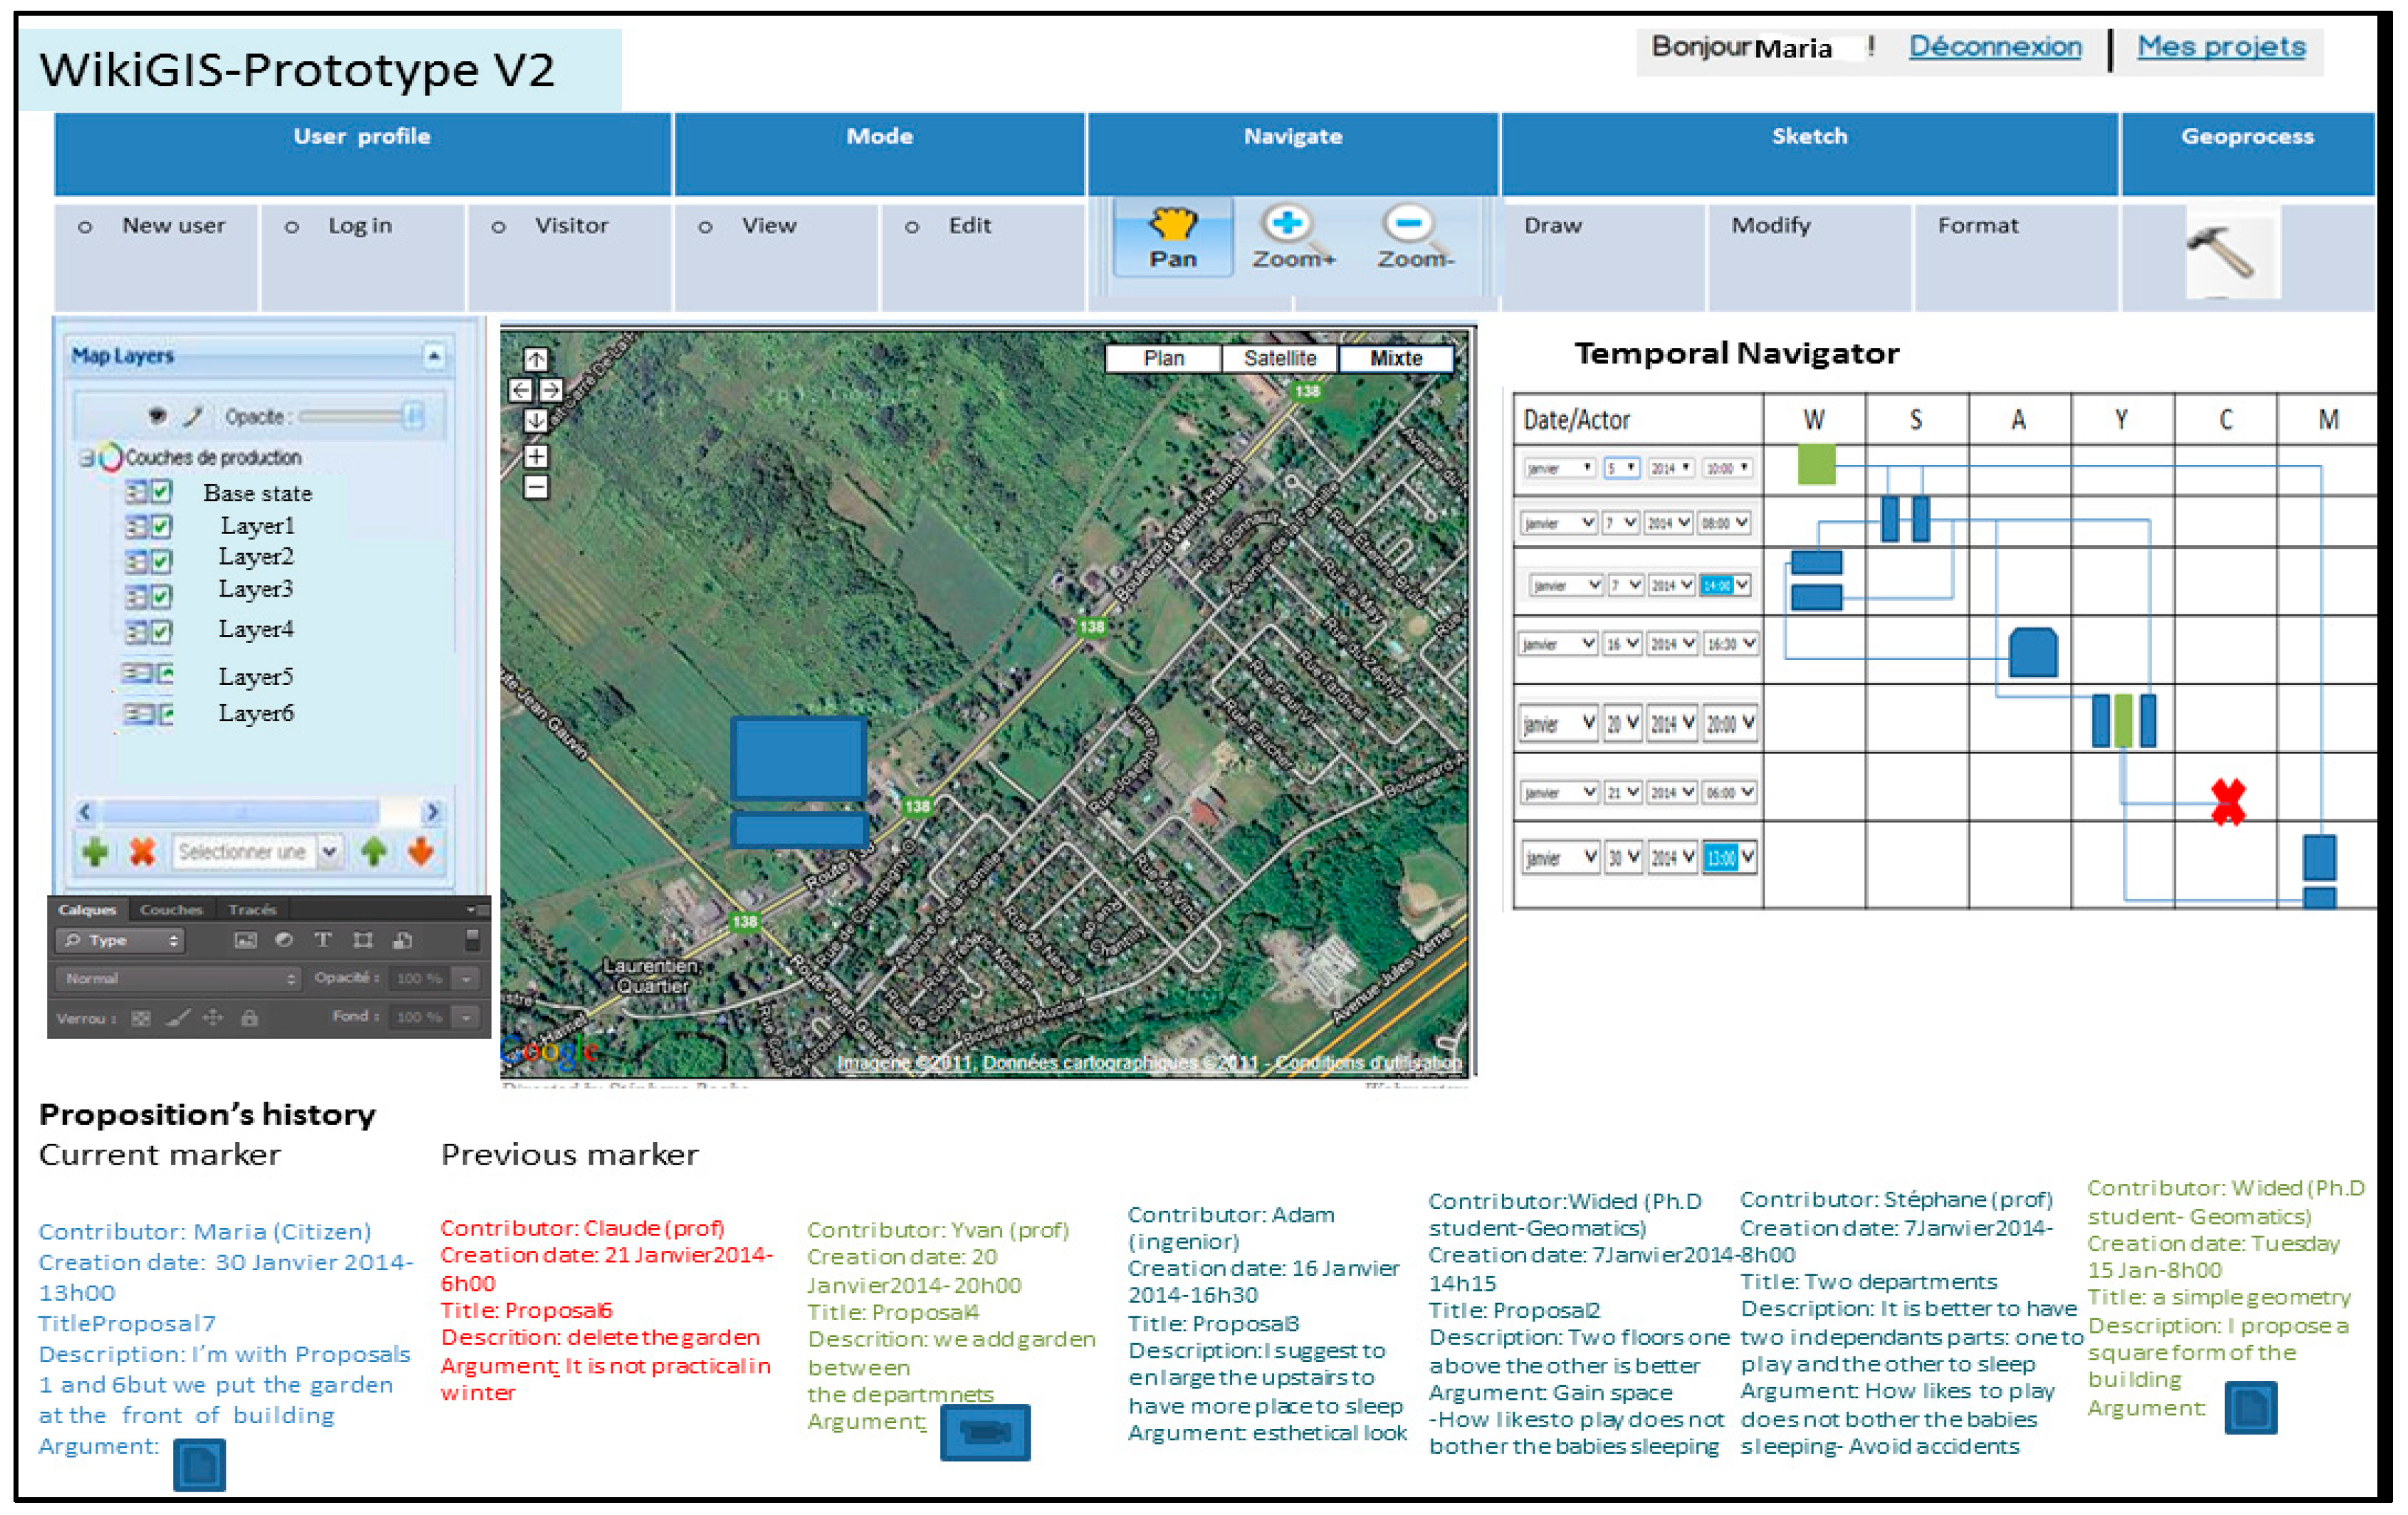
The user agrees with the first and fifth proposals but with some changes (
Figure 28).
Figure 28.
Seventh proposal in the project.
Figure 28.
Seventh proposal in the project.
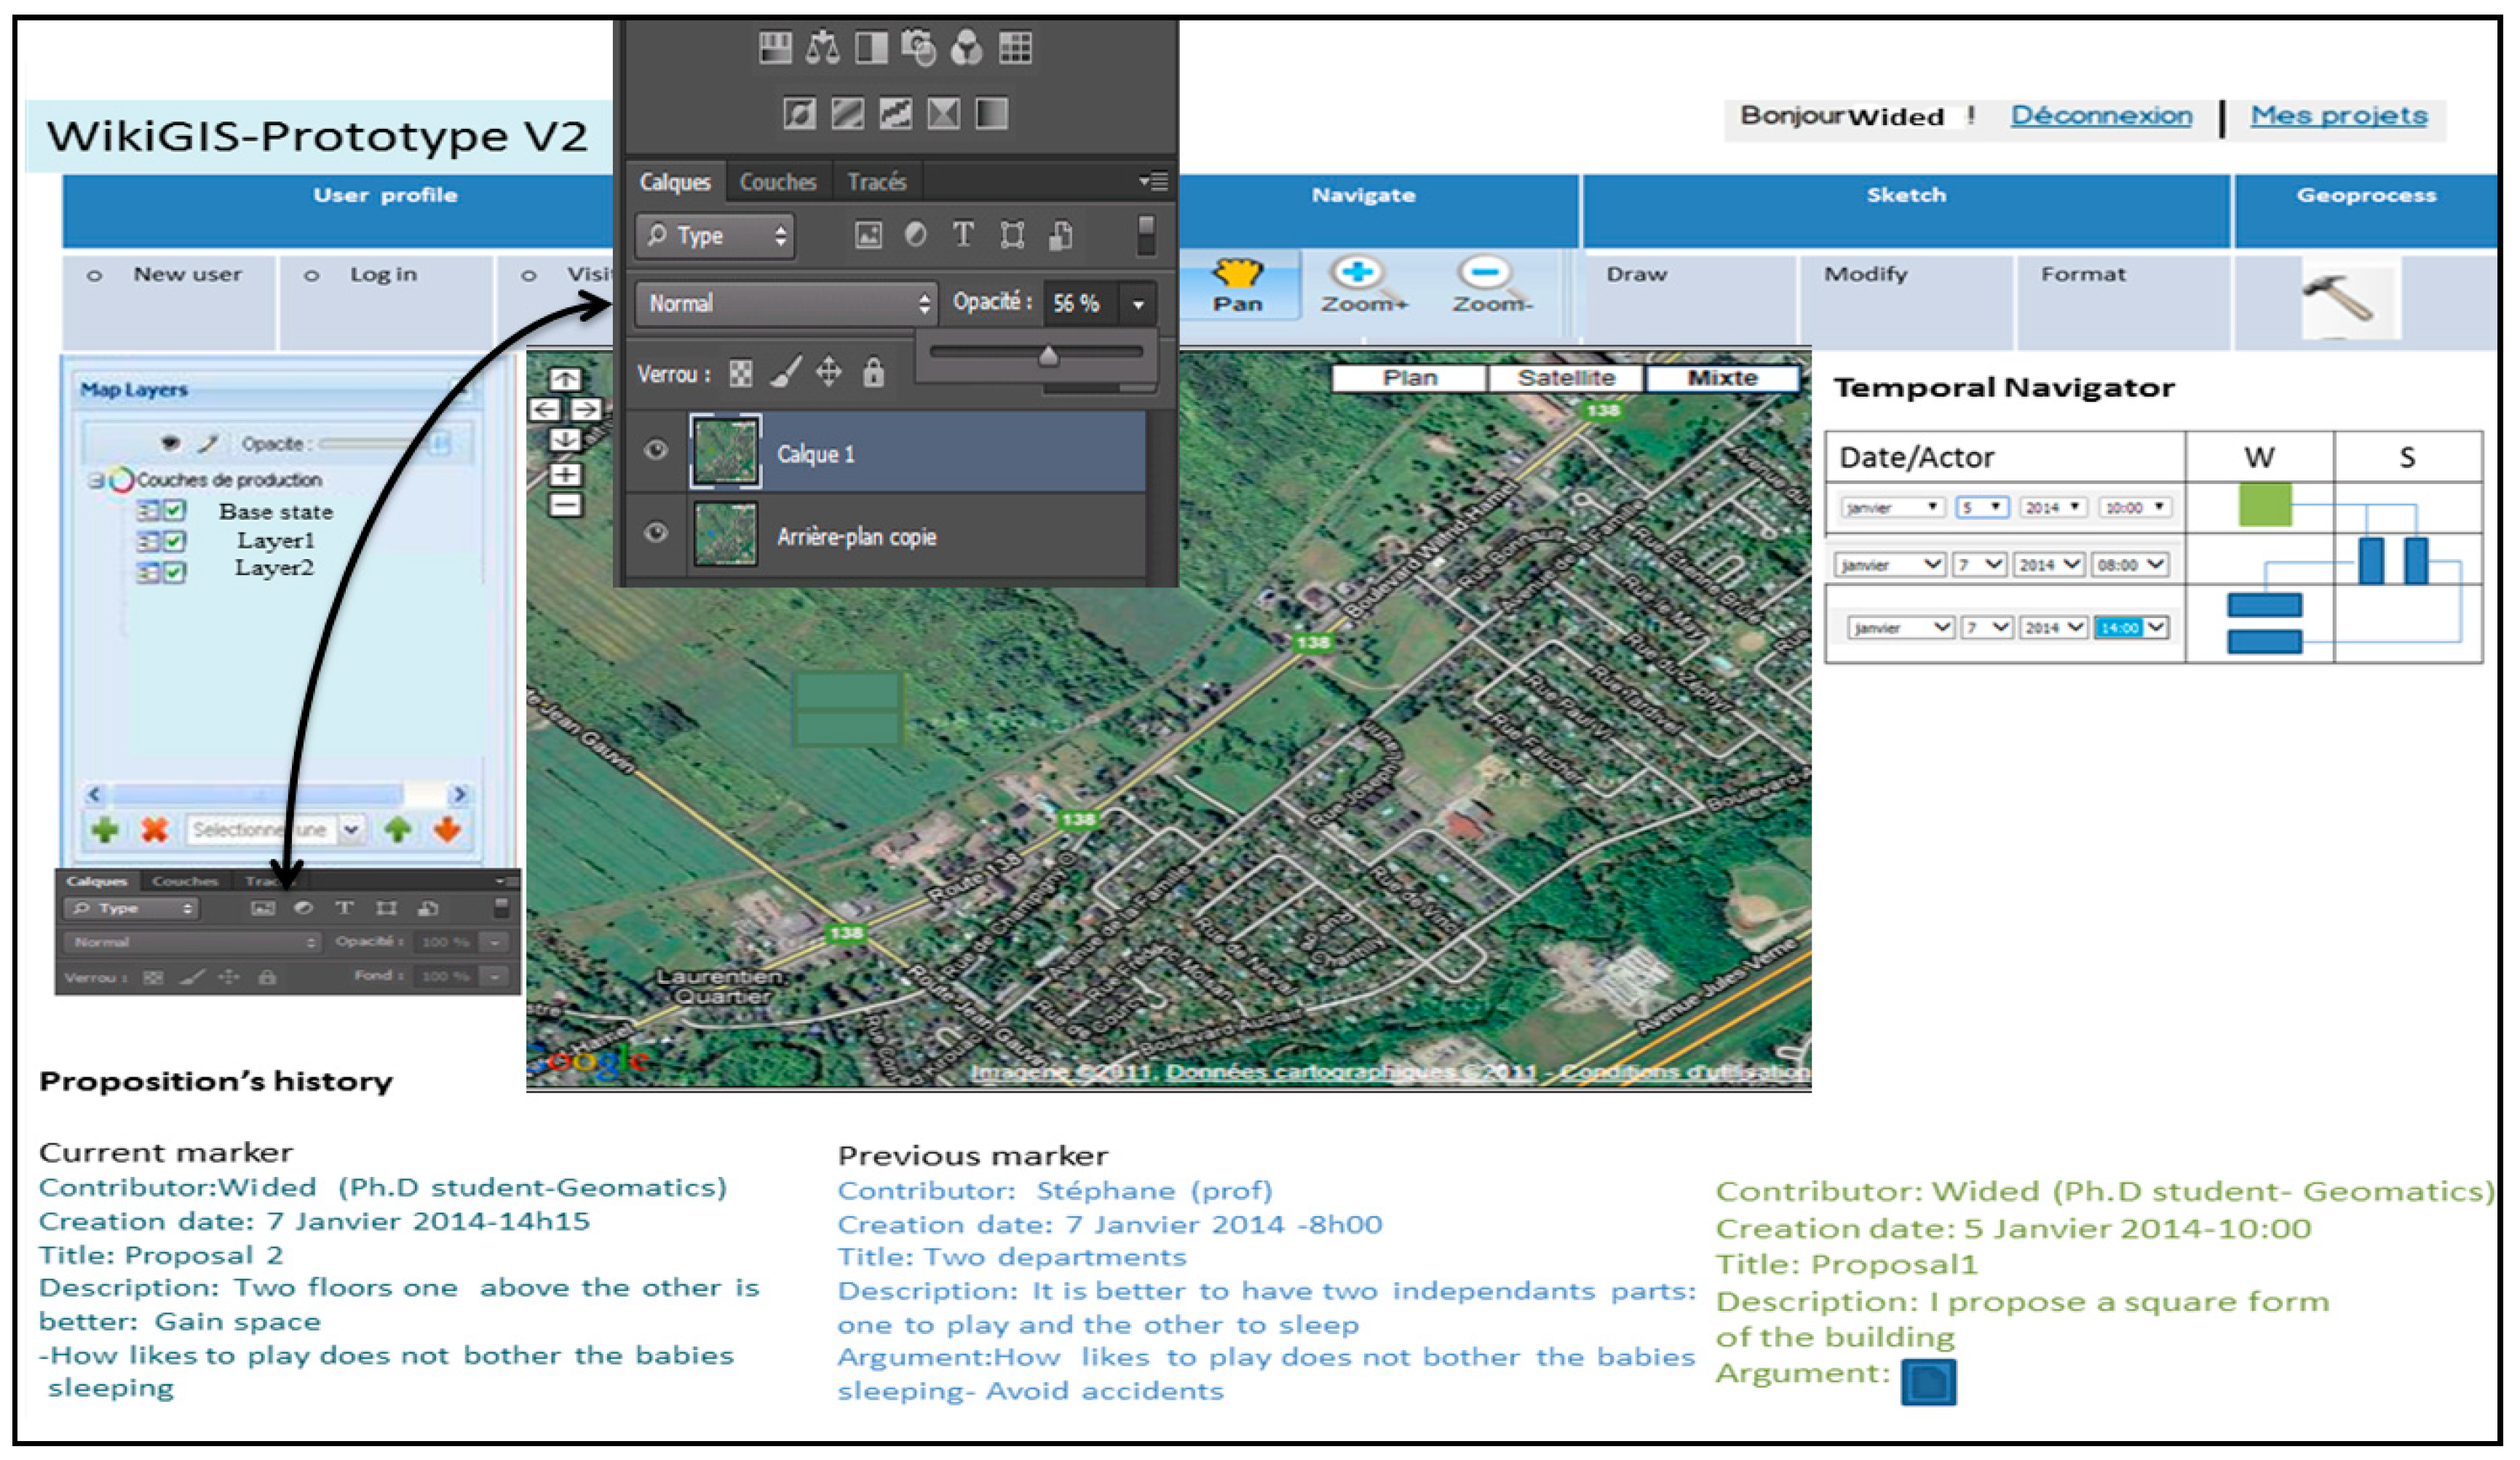
To show the geometric differences between two versions, we overlay the two requested layers and we play on the opacity.
Figure 29 shows the differences between version 1 and 3 with 56% opacity.
Figure 29.
Spatial diff between version 1 and 3.
Figure 29.
Spatial diff between version 1 and 3.
The WikiGIS mapping interface is composed of three windows:
- -
The temporal window (top right) can navigate the history of contributions;
- -
The textual window entitled “History of proposals” displays the details of all proposals (which proposal, when, what, why) and supporting documentation;
- -
The cartographic window is the map: when the user clicks on the desired object, all of its parallel versions appear at the same time.
The temporal navigation in the history of contributions is represented by a tree structure to account for the non-linearity of the contribution process. Indeed, the temporal browser is represented by a matrix in which the time is placed on record and the contributor in a column. Each new version of a contribution is thus linked to the previous version by connectors. In the case of disintegration of the object, the connector is a bifurcation (for example, when a user decides to divide a polygon in two). In the case of an aggregation, the two connectors are combined (if a user decides to combine two adjacent polygons).
Users can filter changes per date (a calendar helps them choose the date), user or argument. When a user clicks on the object, the history of that object is displayed synchronously in the temporal navigator, on the map and in the textual window. Users can mask the window or windows that they do not need.
9. Conclusions
The WikiGIS is the result of the integration of the wiki, Geographic Information System (GIS) and design. It takes advantage of (1) the wiki to manage traceability and history; (2) GIS through spatial analysis functions; and (3) design for sketching and drawing. It provides a controlled and evolutionary access, both spatially and temporally, to members of a project (professionals or the authenticated public), while providing an open access for wider participation.
WikiGIS reverses the cumulative logic of information to an iterative logic by means of versioning. Whenever a user edits an object, a new version appears. All versions are easily and instantly viewable and searchable. An authenticated user has the right to put forward an opinion. Argumentation is a necessary and sufficient condition to justify an opinion. Argumentation is managed by a multimedia wiki through which the contributor may justify his contribution with a text, photo, video, figure, etc. The argument is considered as a strong indicator of the credibility of a contribution.
In practice, WikiGIS is based on three types of wiki: a classic textual wiki to manage the descriptive component, a multimedia wiki to manage argumentation and a cartographic wiki to manage the geometric component. The first version of the WikiGIS prototype provides users with navigation features in versions of objects and analysis using a temporal slider (linear shape). In this conceptual framework, we consider the non-linearity and suggest a temporal navigator that looks like a tree.
The quality of data (opinions) produced is a crucial issue. For the new WikiGIS, we propose a set of qualification measures that should ensure the quality of contributions and better inform users. In particular, the following measures are envisaged:
- -
Restricting spatiotemporal contributions;
- -
Control of contributions;
- -
Filtering, by the administrator, of contributions made by the public;
- -
Monitoring the W7 model;
- -
Statistics testing the user's reputation and credibility of his contribution.
We formalized the concept of WikiGIS by producing UML diagrams. In order to compare two scenarios, the Diff-function is used to compare two descriptive components, while layering is used to compare two geometric and graphic components. Therefore, deltification functions are located at the core of the WikiGIS operating mode. Indeed, process analysis and updates of changes between two stages of the process are based mainly on these functions.
This design of the conceptual framework for WikiGIS raises several questions and challenges. Does this technology fit some GeoDesign requirements? Can it be used in other domains? Does it need more adjustments for other types of professional use? Could other approaches and avenues be envisioned to develop such a tool? In the next steps of our research, we will develop a prototype based on the concepts developed in this paper.
Acknowledgments
The authors thank the Natural Sciences and Engineering Research Council of Canada (NSERC), the Discovery Grants Program and Hydro-Quebec Institute for the Environment at Laval University for financial support for this project.
Author Contributions
This paper is a part of Batita’s Ph.D thesis. She is the main authors, first writer. Roche, Caron and Bédard are respectively Batita’s supervisor, cosupervisor and external referee. They have been indirectly involved in the writing, have revised the first draft and supervised the correction of the second version.
Conflicts of Interest
The authors declare no conflict of interest.
References
- GeoDesign summit Home. Available online: http://www.geodesignsummit.com/ (accessed on 8 January 2014).
- City Engine. Available online: http://en.wikipedia.org/wiki/CityEngine (accessed on 31 January 2014).
- Placeways LLC. CommunityViz. Available online: http://placeways.com/communityviz/ (accessed on 15 December 2013).
- Batita, W.; Roche, S.; Bédard, Y.; Caron, C. WikiSIG et GeoDesign collaboratif: Proposition d’un cadre logique. Rev. Int. Géomat. 2012, 22, 255–285. [Google Scholar]
- Roche, S.; Mericskay, B.; Batita, W.; Bach, M.; Rondeau, M. WikiGIS basic concepts: Web 2.0 for geospatial collaboration. Future Internet 2012, 4, 265–284. [Google Scholar] [CrossRef]
- Leuf, B.; Cunnigham, W. What’s a wiki. In The Wiki Way: Quick Collaboration on the Web; Addison-Wesley: Boston, MA, USA, 2001; p. 435. [Google Scholar]
- Ebersbach, A.; Glaser, M.; Heigl, R.; Warta, A.; Adelung, A.; Dueck, G. Characteristic wiki functions. In Wiki: Web Collaboration, 2nd ed.; Springer-Verlag: Berlin, Heidelberg, Germany, 2008; pp. 18–20. [Google Scholar]
- Zhang, J.; Ecole Polytechnique Fédérale de Lausanne (EPFL), Écublens, Switzerland. Spatio-temporal Database, a Handout on Doctoral course: Conceptual Modeling, 2005; 18.
- Zaniolo, C.; Ceri, S.; Faloutsos, C.; Snoograss, R.T.; Subrahmanian, V.S.; Zicari, R. Advanced Database Systems; Morgan Kaufmann: Burlington, MA, USA, 1997; p. 572. [Google Scholar]
- Wikipédia: Temporal database. Available online: http://fr.wikipedia.org/wiki/Base_de_donn%C3%A9es_temporelle (accessed on 1 February 2012).
- Gagnon, P. Concepts Fondamentaux de la Gestion du Temps dans les SIG. Mémoire de maitrise, Université Laval, Québec, Canada, 1993. [Google Scholar]
- Pouliot, J.; Bédard, Y.; Caron, C.; Larrivée, S.; Nadeau, M.; Levasseur, C.; Métivier, R.; Monahan, D. M@JIC: Expérimentation d'une approche incrémentielle de gestion et d'échange de mises à jour de données géospatiales. Geomatica 2004, 58, 119–132. (In French) [Google Scholar]
- Szarmes, M.C. Modeling the Evolution of Spatio-Temporal Databases Structures for GIS Applications. Ph.D. Thesis, University of Calgary, Calgary, AB, Canada, 1997. [Google Scholar]
- Ott, T.; Swiaczny, F. Time-Integrative Geographic Information Systems: Management and Analysis of Spatio-Temporal Data; Springer-Verlag: Berlin, Heidelberg, Germany, 2001; pp. 77–231. [Google Scholar]
- Declercq, C. Conception et développement d’un service web de mise à jour incrémentielle pour les cubes de données spatiales. Master’s Thesis, Université Laval, Québec, Canada, 2008. [Google Scholar]
- Claramunt, C.; Thériault, M. Managing time in GIS an event-oriented approach. In Recent Advances in Temporal Databases; Springer: London, UK, 1995; pp. 23–33. [Google Scholar]
- Orlandi, F.; Passant, A. Modelling provenance of DBpedia resources using Wikipedia contributions. Web Semant. Sci. Serv. Agents World Wide Web 2011, 9, 149–164. [Google Scholar] [CrossRef]
- Keßler, C.; Trame, J.; Kauppinen, T. Provenance and trust in Volunteered Geographic Information: The case of OpenStreetMap. In Proceedings of the First International Conference on Computer Science and Information Technology (COSIT 2011), Bangalore, India, 2–4 January 2011; p. 3.
- Keßler, C.; Trame, J.; Kauppinen, T. Tracking editing processes in Volunteered Geographic Information: The case of OpenStreetMap. In Proceedings of the First International Conference on Computer Science and Information Technology (COSIT 2011), Bangalore, India, 2–4 January 2011; p. 7.
- Trame, J.; Keßler, C. Exploring the lineage of volunteered geographic information with heat maps. In Proceedings of GeoViz: Linking Geovisualization with Spatial Analysis and Modeling, Hamburg, Germany, 10–12 March 2011; p. 2.
- Genest, L. Conception, développement, et test d’un prototype de type WikiSIG. Available online: http://www2.insa-strasbourg.fr/topographie/jt2009/PFE/16_R4P_LGEN_MK_corr.pdf (accessed on 25 July 2014).
- Cai, G.; Yu, B. Spatial annotation technology for public deliberation. Trans. GIS 2009, 13, 123–146. [Google Scholar] [CrossRef]
- WikiBio: Application web couplant un wiki cartographique et un wiki multimédia. Available online: http://wikibio.scg.ulaval.ca/ (accessed on 17 November 2011).
- Wikipedia: Comparison of file comparison tools. Available online: http://en.wikipedia.org/wiki/Comparison_of_file_comparison_tools (accessed on 22 May 2012).
- Wikipedia. Available online: http://fr.wikipedia.org/w/index.php?title=Wikisig&diff=62286349&oldid=62286295 (accessed on 11 June 2014).
- Langran, G. Comparison of access methods. In Time in Geographic Information Systems; Taylor and Francis, Ltd.: London, UK, 1992; pp. 121–157. [Google Scholar]
- Gregory, I.N. Time-variant GIS databases of changing historical administrative boundaries: A European comparison. Trans. GIS 2002, 6, 161–178. [Google Scholar] [CrossRef]
- Paque, D. Gestion de l’historicité et méthodes de mise à jour dans les SIG. Cybergeo Eur. J. Geogr. 2004. [Google Scholar] [CrossRef]
- Eriksson, H.-E.; Penker, M. Business Modeling with UML: Business Patterns at Work; John Wiley & Sons, Inc.: Hoboken, NJ, USA, 2000; pp. 1–459. [Google Scholar]
- Wikipedia—ISO 19110. Available online: http://fr.wikipedia.org/wiki/ISO_19110 (accessed on 1 June 2014).
- Cockburn, A. Rédiger des cas d’utilisation efficaces; Éditions Eyrolles: Paris, France, 2009; pp. 1–290. [Google Scholar]
- Wikipedia—Use case. Available online: http://en.wikipedia.org/wiki/Use_case (accessed on 1 June 2010).
© 2014 by the authors; licensee MDPI, Basel, Switzerland. This article is an open access article distributed under the terms and conditions of the Creative Commons Attribution license (http://creativecommons.org/licenses/by/4.0/).


