Article

Energy Management System Design for Good Delivery Electric Trike Equipped with Different Powertrain Configurations

by
Iman K. Reksowardojo
1,2,*,
Rafi R. Arya
1,
Bentang A. Budiman
1,2,*,
Metha Islameka
2,
Sigit P. Santosa
1,2,
Poetro L. Sambegoro
1,2,
Abdul R. A. Aziz
3,4 and
Ezrann Z. Z. Abidin
3,4
1
Faculty of Mechanical and Aerospace Engineering, Institut Teknologi Bandung, Bandung 40132, Indonesia
2
National Center for Sustainable Transportation Technology, Bandung 40132, Indonesia
3
Centre for Automotive Research and Electric Mobility, Research and Innovation, Universiti Teknologi Petronas, Perak 32610, Malaysia
4
Department of Mechanical Engineering, Faculty of Engineering, Universiti Teknologi Petronas, Perak 32610, Malaysia
*
Authors to whom correspondence should be addressed.
World Electr. Veh. J. 2020, 11(4), 76; https://0-doi-org.brum.beds.ac.uk/10.3390/wevj11040076
Submission received: 18 October 2020 / Revised: 10 November 2020 / Accepted: 30 November 2020 / Published: 2 December 2020

Abstract

:
This paper demonstrates the design of an electric trike’s energy management system for a goods delivery service via various possible component configurations. A model of the energy management system was first developed based on general engineering vehicles’ equations using Matlab software. Various component configurations, such as the usage of two battery types (lithium iron phosphate (LFP) and lithium nickel cobalt aluminum oxide (NCA)), implementation of three braking strategies (full mechanical, parallel, and series strategies), the presence of a range extender (RE), and various masses of range extenders were simulated by using the model. The driving cycle of the e-trike as input data in the simulation was obtained by driving the vehicle around Bandung City. Speed, distance, and elevation were obtained by using GPS-based software. The simulation results showed that the most efficient and effective component configuration was to use the serial regenerative braking strategy with no RE equipped. This configuration achieved an efficiency of 18.07 km/kWh. However, for a longer route, the usage of a 20-kg RE was required to prevent the state of charge drop below 30%. The NCA with serial regenerative braking and 20-kg RE had an efficiency of 17.47 km/kWh for the complete route.

1. Introduction

An internal combustion engine (ICE) vehicle is the most common vehicle type that we see today. Despite its relatively low efficiency and high emission numbers, its advantages are too desirable and practical for daily use. However, as time goes on, the emissions caused by vehicles cannot be ignored anymore. A typical passenger car emits about 4.6 metric tons of carbon dioxide per year [1].
One of the alternatives for substituting the ICE vehicles is electric vehicles. The advantages of electric vehicles over ICE vehicles are their high efficiency due to minimal power conversion, high electric component efficiency, and zero emissions during their operation [2,3]. Although the advantages look promising, electric vehicles still have one main problem: the low specific energy of batteries compared to gasoline or diesel [4]. Currently, a typical lithium-ion battery’s specific energy is 80–130 Wh/kg [5], while the specific energy of gasoline is about 13,200 Wh/kg [6], a thousand times more than the battery. The low specific energy of batteries results in many batteries used in vehicles due to high energy needs [7]. The higher number of batteries, the higher the cost. Moreover, the heavier the vehicle, the higher the energy consumption. The result is that the range of electric vehicles is usually not as far as ICE vehicles, causing range anxiety for the driver. Range anxiety is defined as the fear of fully depleting a BEV’s battery in the middle of a trip, leaving the driver stranded [8].
Therefore, there are now more research projects on electric vehicles [9,10]. Fabianski and Wicher present a concept, development, and comparison of selected control algorithms used in the distributed control system of a three-wheeled vehicle [11]. The research was conducted to obtain an electric vehicle with better performance to reduce the emission and range anxiety of the driver. However, it does not specifically address braking strategies and the addition of a RE. Adding RE is one way to modify an electric vehicle to have more on-board energy storage, better known as EREV (extended-range electric vehicle) [12]. It is an electric vehicle with a small auxiliary power unit that functions as a generator that charges the electric vehicle’s battery when the state of charge (SoC) of the battery is low. The small auxiliary power unit is usually a small ICE. EREV offers low emission and high efficiency of a battery electric vehicle and has an ICE vehicle’s range capability if needed [13]. Its auxiliary power unit will eliminate the range anxiety of the driver.
Many studies have been conducted regarding the use of range extenders for electric vehicles. Kerviel et al. show that the use of the range extender is truly promising [14]. It was confirmed by Brito et al. when they developed and assessed an engine to be used as a range extender for electric vehicles [15]. The engine in both studies is used as the main range enhancer for the electric vehicle. Furthermore, Waseem et al. present modeling of a three-wheeled electric vehicle and focus on the analysis of the gradient effect on the vehicle’s dynamic performance [16]. Targosz et al. also modeled an electric vehicle, which focuses on electric racing cars [17].
To obtain the best component configuration of electric vehicles, modeling of the energy management system is required. For example, Hmidi et al. were modeling the system and implementing the New European Driving Cycle (NEDC), which aims to minimize fuel consumption in hybrid vehicles [18]. Another study was performed by Islameka et al. in which they compare the full mechanical, serial, and parallel braking strategies simulated on the WLTC Class 2 driving cycle [19]. The result indicates that the use of serial braking systems produces the greatest efficiency compared to parallel and full mechanics braking systems. The resulting efficiency is 19.5km/kWh with the remaining battery SoC of 87.9%. Furthermore, Rahman et al. present the design and performance details of an extended-range electric city car propulsion system [20], which focuses on using two engines, one for motors and one for generators. From these explanations, many research reports are still focused on one type of drivetrain only. Limited studies have compared various powertrain configurations, especially for different battery types, braking strategies, and range extender appearance. Selecting the configuration is an essential step in designing electric vehicles for obtaining the best energy efficiency.
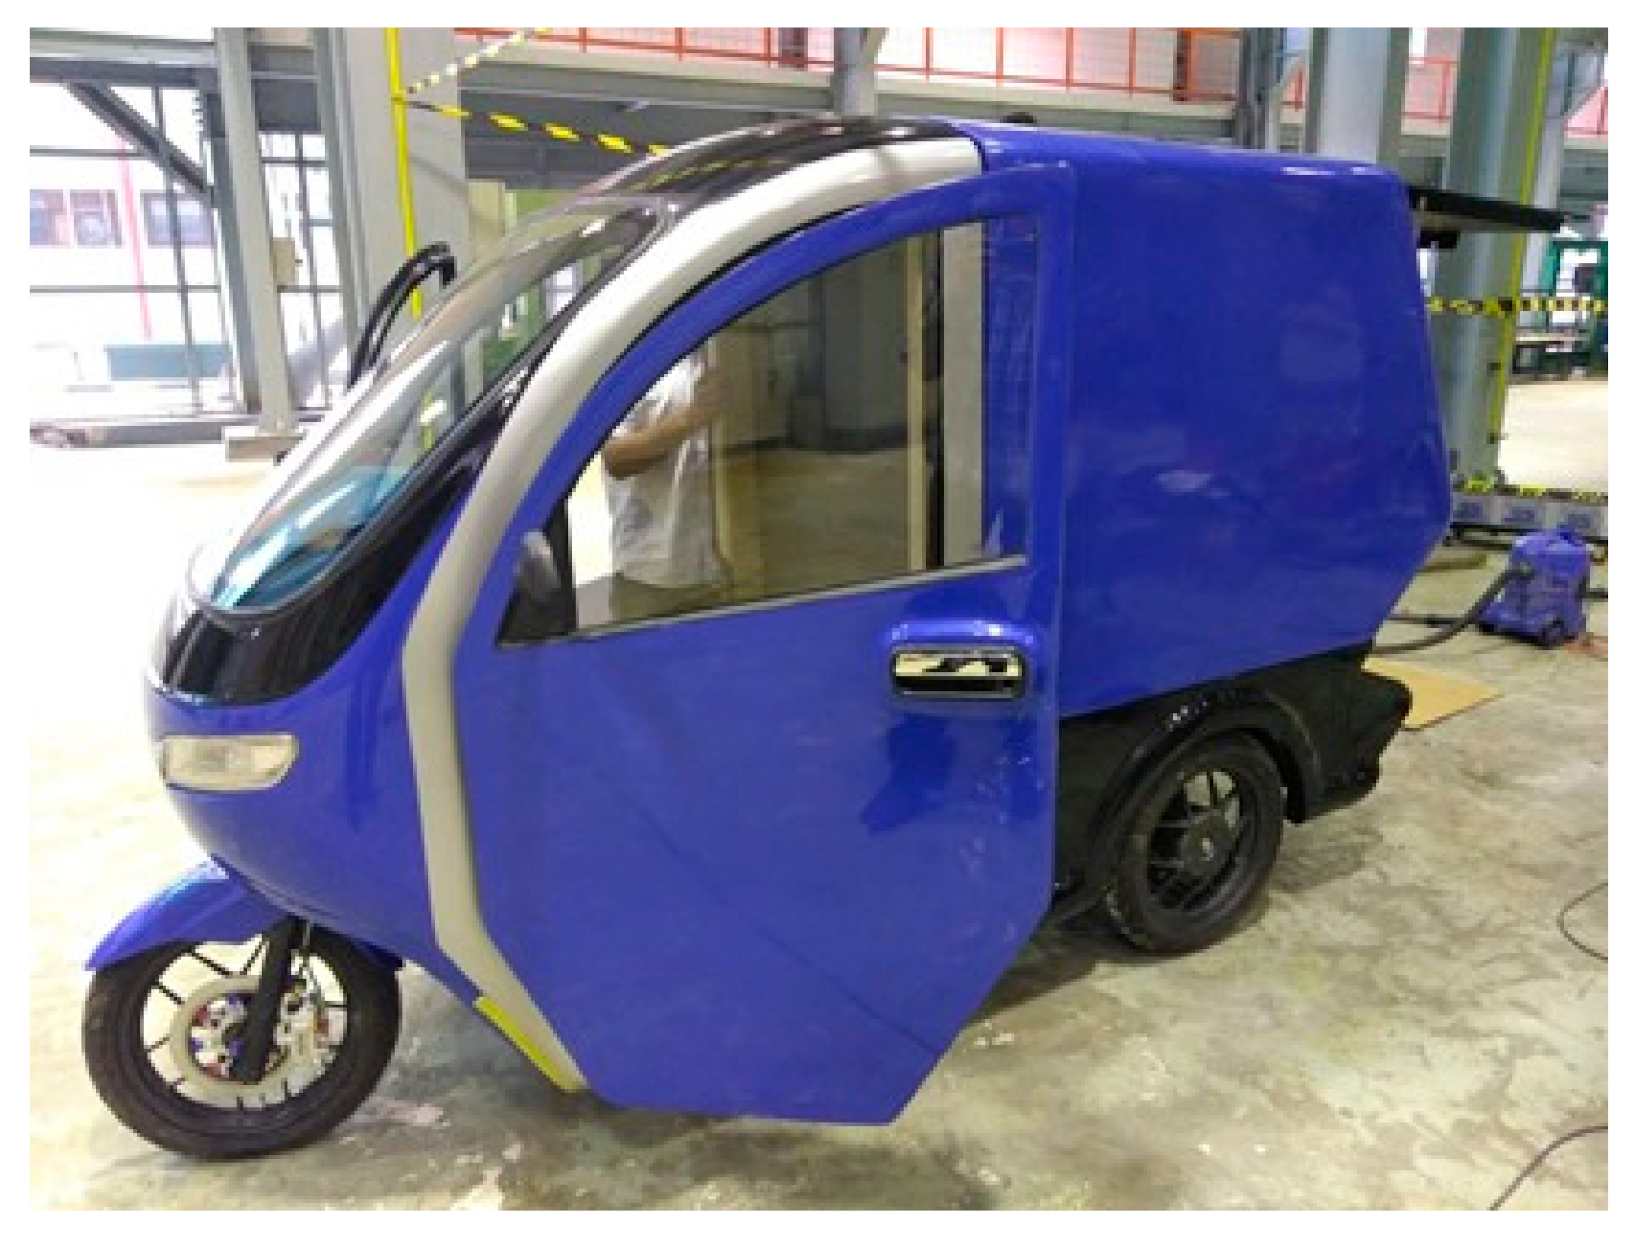
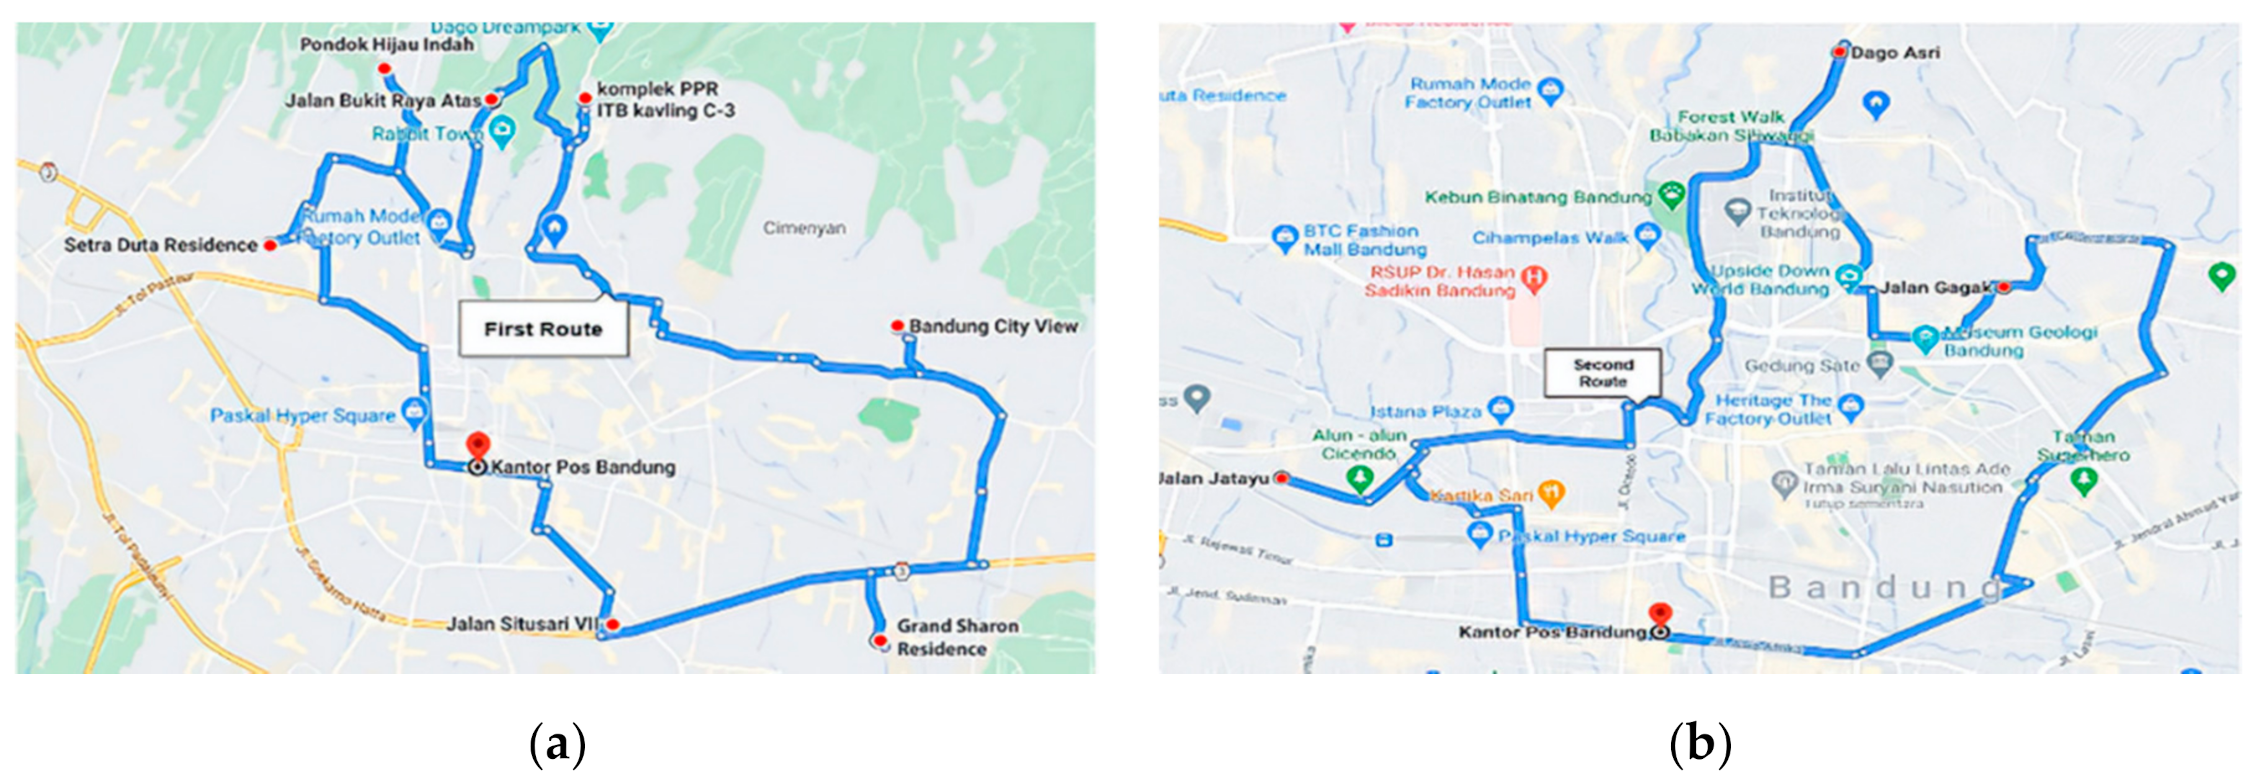
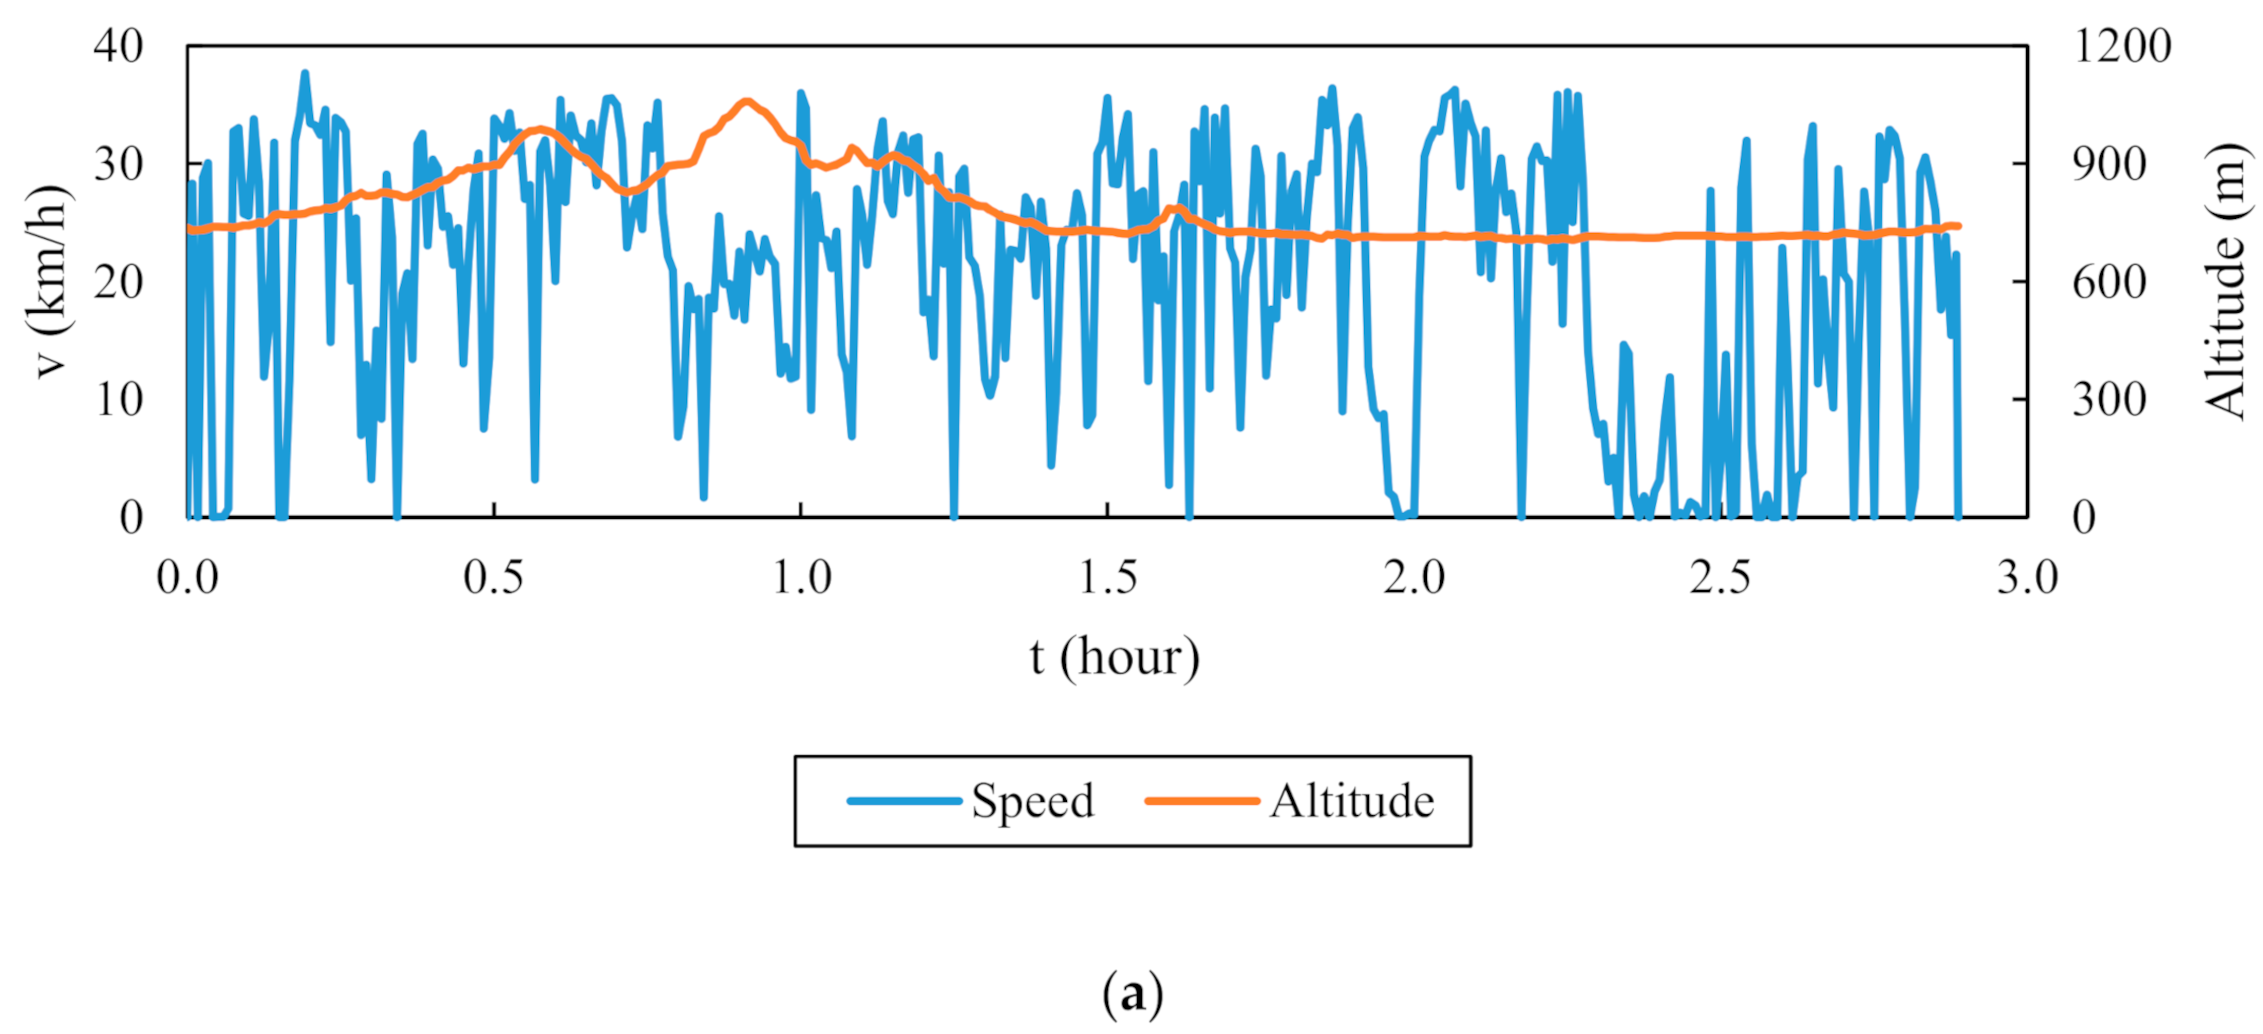
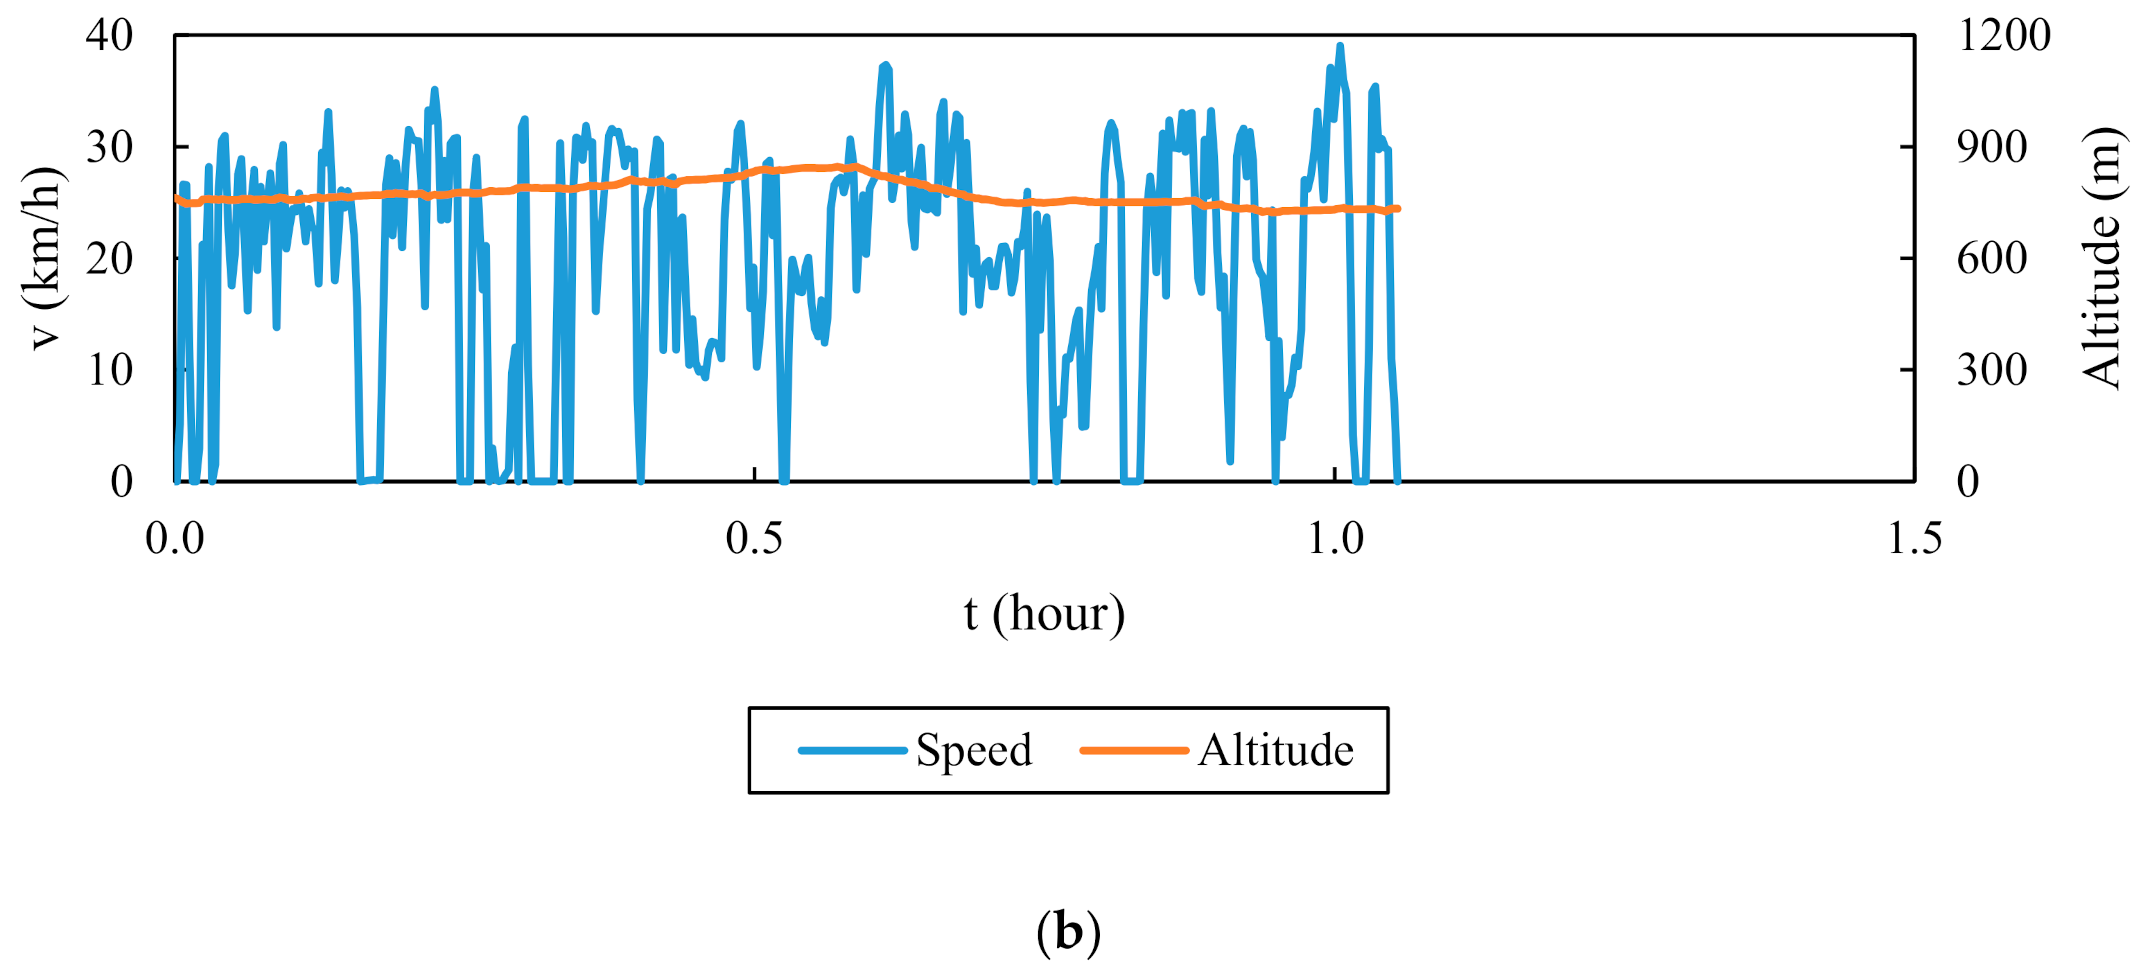
This paper aims to develop a model for simulating both electrical and mechanical energy management systems of the electric trike as good delivery services (See Figure 1). Unlike other vehicle types, such as electric city cars, electric SUVs, electric sedans, electric trucks, or electric buses, which were intensively developed and optimized, limited study has been done to design an energy management system of the e-trike type. The trike type also usually has limited regulation and standards compared to four-wheel or two-wheel vehicles. The energy management system model was developed based on equations of general engineering vehicles. The simulation of the model considers various parameters, such as the usage of battery types, the presence of RE, the implementation of braking strategies, and the variation of RE mass. The significance of each parameter to the energy management system is then comprehensively discussed. The use of universal driving cycles has also been carried out previously to simulate electric trikes with the specifications used in this study. Thus, data collection for the new driving cycle is carried out to describe how the electrical performance of an electric trike is used as a goods delivery vehicle.

2. Methodology

2.1. Propulsion System Modeling of e-Trike

The quasi-static approach is used for modeling and simulating the energy management system of an e-trike. This approach simplifies the power transmission in a vehicle, and the calculation is done backward, meaning that the input of the simulation is the speed ( v ), the acceleration ( a ), and the grade angle of the road ( θ ). The quasi-static approach also assumes that the inputs are constant throughout a specific time step [21]. The flow of the simulation can be seen in the block diagram of Figure 2. The input data is traction force ( F t ) and v . Each of the boxes processes the input into a specific output using various equations.
The traction force needed by the vehicle for acceleration or deceleration is calculated by summing the major external forces acting on the vehicle, namely rolling resistance ( R r ), aerodynamics resistance ( R a ), grade resistance ( R g ), and acceleration resistance/inertia ( R i ), as shown in Figure 3. Positive traction force means the vehicle is accelerating, while negative traction force means decelerating. Furthermore, the traction force is zero, so the vehicle is coasting. The equation of motion along the longitudinal x-axis of the vehicle is expressed by Equation (1) [22]:
F t ( t ) = R r ( t ) + R a ( t ) + R g ( t ) + R i ( t )
However, the grade angle ( θ ) is typically small and not always constant. Thus, using a parameter called the route gradient ( G ) is more convenient. The route gradient is the ratio of elevation ( A ) difference to the distance ( s ) between two points in a route. This value can be obtained using a numerical method called the finite-divided-difference method [23]. The route gradient and distance at the time ( t i ) can be seen in Equations (2) and (3), respectively:
G t =   A t i + 1 A t i 0 t + 1 s t i + 1 0 t s t i   ; t = 0 A t i + 1 A t i 1 0 t + 1 s t i + 1 0 t 1 s t i 1 ; 0 > t > t m a x A t i A t i 1 0 t s t i 0 t 1 s t i 1   ; t = t m a x
s ( t ) = { 0   ; t = 0 [ v ( t i ) + v ( t i 1 ) 2 ]   x   ( t i t i 1 )   ;   0 > t t m a x
Acceleration resistance/inertia ( R i ) is caused by the inertia forces which are present when an object with a mass ( m ) is accelerating. This is stated in d’Alembert’s principle. The acceleration resistance ( R i ) is shown in Equation (4). Note that there is a mass factor ( γ m ) due to the moments of inertia of the rotating parts. Due to the unavailability of the data for the rotating parts of the e-trike, the mass factor equation used for passenger cars is used, as shown in Equation (5), where R is the gear ratio [22]. The acceleration of the vehicle at each time can be calculated using the finite-divided-difference method, as shown in Equation (6):
R i ( t ) = γ m m   a ( t )
γ m = 1.04 + 0.0025 R 2 = 1
a ( t ) =   {   v ( t i + 1 ) v ( t i ) t i + 1 t i   ; t = 0 v ( t i + 1 ) v ( t i 1 ) t i + 1 t i 1 ; 0 > t > t m a x v ( t i ) v ( t i 1 ) t i t i 1   ; t = t m a x

2.2. Energy Management System Model

To satisfy the objectives of the research, the first step is to make a simulation model that can predict the actual performance of the e-trike accurately. The time step chosen for the model is one second, so it can be as accurate as possible. Six models are made based on three braking system configurations (full mechanical, serial regenerative, and parallel regenerative) and the presence of RE (non-RE and RE). Variations for the component configuration can later be inputted into the six models to find the most suitable and feasible component configuration for the e-trike. Figure 4 shows the Simulink of the modeling and control for the e-trike. In this case, using the quasi-static approach, the discrete model will be used. For the solver, a Fixed-step solver is used because the calculations are relatively simple, and thus each time step (1 s) will all be calculated and solved.
Major subsystems that can be seen in Figure 4 are the data input, traction force calculation, torque and rotational speed calculation, regenerative braking, battery SoC model, and range extender. The data input subsystem has several inputs that have been processed before, such as speed, acceleration, grade angle, and distance covered. The torque and rotational speed calculation subsystem contains torque and rotational speed calculations. The torque from the wheel ( T g b d w ) is converted into the torque supplied by the motor ( T m g b ) by dividing it with the gear ratio (R) of the gearbox. The rotational speed from the wheel ( ω g b d w ) is converted into the rotational speed supplied by the motor ( ω m g b ) by multiplying it with the gear ratio (R) of the gearbox. The regenerative braking subsystem contains equations that are further explored in the braking system section. After these subsystems, the motor power ( P m ) that is needed to be supplied by the battery or the regenerative braking power given to the battery is already calculated; thus the state-of-charge of the battery can be calculated in the battery SoC Model. The range extender subsystem acts as a controller that turns on and off. Switches exist in the model to choose the different configurations that will be tested in the simulation. Energy consumption will then be calculated once the simulations are over, and the results from each of the subsystems are given.

2.2.1. Braking System

Figure 3 shows the forces which act on a vehicle when it is braking. The traction force is substituted by the braking force, colored red in Figure 3. The braking force of the front and rear wheel can be calculated using the moment equilibrium at each of the wheels. To ensure that the vehicle can decelerate and stop safely, a braking force distribution between the rear and the front brake is needed. The maximum braking force of the front and rear brake should be achieved at the same time to avoid the front or rear tires locking at different times. Figure 5 shows how the braking system is modeled.
For the maximum brake force on the front ( F b f m a x ), the equation used is shown in Equation (7) [22]. The maximum brake force ( F b f m a x ) is influenced by wheel-road adhesion ( μ ), vehicle weight ( W ), the distance between the center-of-gravity and rear wheels ( l 2 ), the height of center-of-gravity from the ground ( h ), rolling resistance factor, and the wheelbase of the vehicle ( L ):
F b f m a x = μ   W   ( l 2 + ( h + ( μ + f r ) ) L
Knowing the maximum front brake force, the maximum rear braking force according to the ideal braking curve can be calculated using Equation (8) [24]:
F b r m a x = 1 2 [ W h l 2 2 + 4   h   L W F b f m a x ( W l 2 h + 2 F b f m a x ) ]
The braking force distribution between the front and rear wheel can be calculated by dividing the front/rear brake force with the total brake force required, as shown in Equations (9) and (10) [22]. Moreover, to calculate the brake force of the front or the rear wheel, it can be done by multiplying the brake force distribution ( K b ) of the designated wheel with the total brake force:
K b f = F b f m a x F b f m a x + F b r m a x = 1 K b r
K b r = F b f m a x F b f m a x + F b r m a x = 1 K b f
The brake force needed by the vehicle is also defined by the negative traction force obtained by the calculation using Equation (1). One of the electric vehicle’s advantages is the option to use regenerative braking. Regenerative braking uses the characteristics of an electric motor that acts as a generator whenever mechanical power is inputted. The presence of regenerative braking means that an electric vehicle can recover significant amounts of braking energy [5]. The addition of regenerative braking means that there is more brake force, but also the distribution of the regenerative braking needs to be controlled. The common controls of regenerative braking are serial and parallel configurations.
The serial braking strategy uses the regenerative braking force as the main braking force for the driven wheels; up until the maximum regenerative braking force can be given. Next, the mechanical brake will help give the rest of the braking force. The parallel braking strategy distributes the braking force needed in the driven wheels. The force distribution between both configurations is shown in Figure 6. To determine the maximum braking torque which can be provided by regenerative braking, the maximum available motor torque ( T m a v a i l ) is multiplied by weight factors speed ( K v ) and weight factor battery SoC ( K S o C ), as shown in Equation (11) [25]. The maximum available torque ( T m m a x ) is calculated using Equation (12):
T m a v a i l = T m m a x ( t ) K v ( t ) K S o C ( t )
T m m a x ( t ) = { T m a x m ;   ω m g b ω m c t P m a x m ω m g b ( t ) ; ω m g b > ω m c t
The limiting motor rotational speed is from the torque and power characteristic of an electric motor, using maximum motor torque and maximum motor speed as the limit. The factors, besides the maximum torque, are the weight factors. K v is present because of the motor’s difficulty generating electricity and delivering it to the store because of the low electric motive force (voltage) generated at low speeds [25]. Thus, it is affected by the speed of the vehicle. K S o C is present to protect the battery from overcharging, which may affect battery life [25], so it is affected by the state-of-charge of the battery. The equations for the weight factors are shown in Equations (13) and (14):
K v ( t ) = { 0   : 0 v ( t ) 3   [ m / s ] 1 / 5 [ v ( t ) 3 ]   ; 3 < v ( t ) < 8   [ m / s ] 1   ; v ( t ) 8   [ m / s ]
K s o c ( t ) = { 1   ; 0   S o C ( t ) 8   0.9 S o C ( t )   ; 0.8 < S o C ( t ) < 0.9 0   ; 0.9 S o C ( t ) 1

2.2.2. Range Extender

A range extender is a small auxiliary power unit installed in a vehicle to extend the range of the vehicle by charging the primary source of power. The auxiliary power unit is usually a small internal combustion engine due to its energy capacity per volume of fuel. A RE typically consists of three main components, an internal combustion engine, a gearbox, and a generator. The internal combustion engine will produce mechanical power, which then will be connected to a gearbox so that the desired output power that the generator will produce can be satisfied. The generator will then charge the battery if it is operating. The desired output power of the RE ( P R E ) is constant throughout its operation. Thus, a model of constant RE power can be applied.
Figure 7 shows how the range extender is modeled. Several parameters considered for the control of RE is the minimum SoC that the RE has to turn on ( S o C m i n ) which is 30%, the maximum SoC that the RE has to turn off ( S o C m a x ) which is 35%, the time interval between the RE turning off and turning on again, and the duration that the RE is turned on ( t t a r g e t ) which is targeted to 600 s. The time interval and the duration is considered to minimize the usage of the fuel but can still help increase the range of vehicles at certain times.

2.2.3. Battery

Batteries are the most common answer to the source of energy and energy storage in an electric vehicle. Current electric vehicles typically use the Li-ion battery due to its specific energy (Wh/kg), cycle life, and high efficiency [26]. In this work, two battery types, i.e., NCA and LFP, were modeled and simulated. Figure 8 shows the charging and discharging characteristics used in the simulation.
An electric vehicle usually needs a high voltage and high capacity to be able to power the vehicle and keep it operating for a specific period and, thus, a set of batteries is used. The batteries are arranged in a serial way to increase the voltage and parallel to increase the capacity. The voltage of a set of batteries is calculated by multiplying the serial row of the batteries ( N s e r i a l ) with its nominal voltage ( u n o m ). While the capacity of the battery is calculated by multiplying the parallel row of the batteries ( N p a r a l l e l ) with its nominal capacity ( q n o m ):
P b ( t ) = U b ( t ) I b ( t ) I b ( t ) 2 R b
The power which goes out of the battery can be calculated using Equation (15) [19]. The first term is for power, which is due to the voltage ( U b ) and current that goes out of the battery ( I b ), and the latter is the power dissipated due to the internal resistance of the battery ( R b ). For this model, the internal resistance of the battery is assumed as constant. Using Equation (15), the current which flows out of the battery ( I b ) can be calculated using Equation (16) [25]:
I b ( t ) = U b ( t ) U b ( t ) 2 4 R b P b ( t ) 2 R b
Both equations above are used for current that flows out of the battery (discharging). For current, which flows into the battery (charging), Equations (17) and (18) are used:
P b ( t ) = U b ( t ) I b ( t ) + I b ( t ) 2 R b
I b ( t ) = U b ( t ) + U b ( t ) 2 + 4 R b P b ( t ) 2 R b
To calculate the battery state-of-charge, the amount of charge ( Q ) in the battery at each time step ( t ) needs to be known. Using Equations (19) and (20), the battery’s state-of-charge can be calculated:
d Q ( t ) d t = I b ( t )
S o C ( t ) = Q ( t ) Q n o m
Energy consumption from the battery ( E ) can be calculated as follows:
E ( t ) = [ Q n o m Q b ( t ) ] U n o m
For the RE, the energy consumption ( E r e ) is calculated by multiplying the power of the RE and the times that the RE is on ( t r e o n ) per hour:
E R E ( t ) = P R E t r e o n 3600

2.3. Driving Cycle

The driving cycle is collected to be as similar as possible to the real condition of the e-trike while operating as good delivery vehicles. The driving cycle is collected in the Bandung region because there is no special driving cycle standard data in Indonesia, like in other cities or countries, such as JC08 and the China Automotive Testing Cycle (CATC). The method for data acquisition is to measure the speed and positional altitude of a motorcycle while moving through the streets in Bandung. The route is at least three hours and has at least ten stops (assuming the second shift is used to deliver as much package as possible). The stops, determined for the routes, are residences in Bandung, as it is the common destination for package deliveries. The driving cycle is taken using a GPS-based Android application, namely Speedometer GPS.
There are two driving cycles in use, the first driving cycle is the first route, and the second driving cycle is the total of the first and second routes. The first route will be used for cases on the first operating hour, where the e-trike delivers the packages on time, and the quantity target is on track to be met. In comparison, the second route will be used in addition to the first route, for cases where the e-trike delivers the packages in the second operating hour and is to meet the minimum quantity of packages delivered, which is ten packages. Thus, the simulation for each of the component configurations will be done using these two cases. The first one is the usual operating hour, only using the first route, while the second one is the overtime operating hour, using both the first and second routes. This is done to see how the effect of using a RE for longer distances. The routes are shown in Figure 9.
The measured speed and altitude from both routes are shown in Figure 10. The driving cycle looks fluctuating because almost every intersection in Bandung, Indonesia has traffic lights. Furthermore, the number of vehicles on Bandung road is very dynamics depending on working time. The total distance for the first route is 59.72 km and the second route is 21.06 km. Thus, the total distance for the complete route is 80.78 km. The record of the altitude is the distance above sea level. The maximum speed attained from the two trips was 39.44 km, which is below the maximum speed allowed for the vehicle. However, several problems were noticed from the measuring application “Speedometer GPS”. While the data were taken, the speed measured on the application most of the time was 10% less than the actual speed.

2.4. Simulation Parameters

This chapter includes all the data that would be used for the simulations. The specification of the e-trike is shown in Table 1. The data were obtained from the specification sheet of the e-trike from NCSTT (National Center for Sustainable Transportation Technology).
Other specifications needed for the simulation are the battery specifications and the RE specifications. For the RE, the specifications and parameters are shown in Table 2. The designated engine is an internal combustion engine with a single-piston and volumetric cylinder of 163 cc. The electrical power output is maintained constant of 1.55 kW with a rotational speed of 56.5 rpm. For the emission numbers, the engine is currently still being researched and being tested at the same time. However, according to the specification of the engine, the internal combustion engine results in low air emissions to comply with China’s exhaust gas emission regulations (second-degree). Two RE masses were used for the simulation, and they were the original mass and the desired mass. The masses were added to the gross vehicle weight for the RE cases.
For the battery, two types of batteries were used in the simulation, namely the NCA battery and the LFP battery. The NCA battery is the original battery of the e-trike. The mass which would be used for the simulation was the gross vehicle weight (500 kg). For the NCA cases, there was no added mass for the simulation. However, for the LFP, due to the increased amount of battery cells, the mass increases accordingly, as shown in Table 3. Furthermore, the e-trike has a traffic load of 4900 N. During the simulation, the electric trike’s traffic load will change depending on the battery type and the mass of the range extender that is simulated.

3. Results

The data from the previous sub-chapter are simulated, and the results can be shown in this section. The results are differentiated between non-RE and RE cases. This is done because the RE cases have more variations involved due to the variation of RE masses.

3.1. Non-RE Cases

The results from the first route are shown in Table 4 and the complete route is shown in Table 5. For the first route, compared with each respective braking strategy, the NCA gave better results in terms of the battery SoC remaining, with the serial regenerative braking strategy coming first with the most amount of battery SoC remaining with 33.84%. The parallel regenerative braking strategy offered the second-best braking strategy in terms of energy consumption. For the result of the complete route, half of the cases failed to finish the designated route. The exceptions are the NCA battery with serial regenerative braking strategy, NCA with parallel regenerative braking strategy, and LFP with serial regenerative braking, with a remaining battery SoC of 9.05%, 3.86%, and 4.60%, respectively.
For more details regarding the battery SoC, while going through the complete route, the plot of battery SoC v distance is shown in Figure 11. For the first 20 km, all the configurations had almost the same SoC. However, after that, the full mechanical braking strategy dipped more and followed by the parallel regenerative braking strategy. The serial braking strategy proved to be the most efficient and effective configuration for the vehicle, followed by the parallel braking strategy and then the fully mechanical.

3.2. RE Cases

The results for the RE cases for the first route are shown in Table 6 and Table 7 for the 20 kg and 36.3 kg RE, respectively. The results for the complete route of the RE cases are shown in Table 8 and Table 9 for the 20 kg and 36.3 kg, respectively. All the cases managed to finish the trip with remaining battery SoC around 30% , which is the minimum SoC allowed before the RE is turned on. From the results, it is shown the added mass of the RE caused the vehicle to consume more energy. The results also show that the LFP battery configuration used the RE more than the NCA battery configuration in each respective braking strategy. Additionally, as previously stated, the serial regenerative braking strategy also required the least amount of RE usage as it was the most energy-efficient, followed by the parallel regenerative braking strategy. An example of the battery SoC and RE versus distance traveled is plotted in Figure 12.

4. Discussion

4.1. Non-RE Cases

From Table 4 and Table 5, it is shown that the most efficient configuration was by using the serial regenerative braking strategy, followed by the parallel braking strategy. The lost kinetic energy from braking is recovered by the characteristic of the electric motor that functions as a generator. The mechanical power was given to the electric motor; it would convert it into electricity. The LFP battery configuration is 48 p and 24 s, which contributes to a total battery cell of 1152. In contrast, the NCA battery configuration is 27 p and 20 s, contributing to a total battery cell of 540. There was a 113% increase in LFP battery cell number than NCA battery cell, but only a 3.3% increase in energy existed (4995 to 5160 Wh). The increase in battery cell amount means that the e-trike mass will also increase. Thus, the LFP battery configuration has 42.152 kg more than the base case of the NCA battery configuration. An increase in mass will cause more energy consumption in a vehicle due to the three-component of the driving resistances, which are affected by mass (rolling resistance, gradient resistance, and acceleration resistance). This concludes why the usage of the LFP battery type decreases the efficiency of the e-trike.
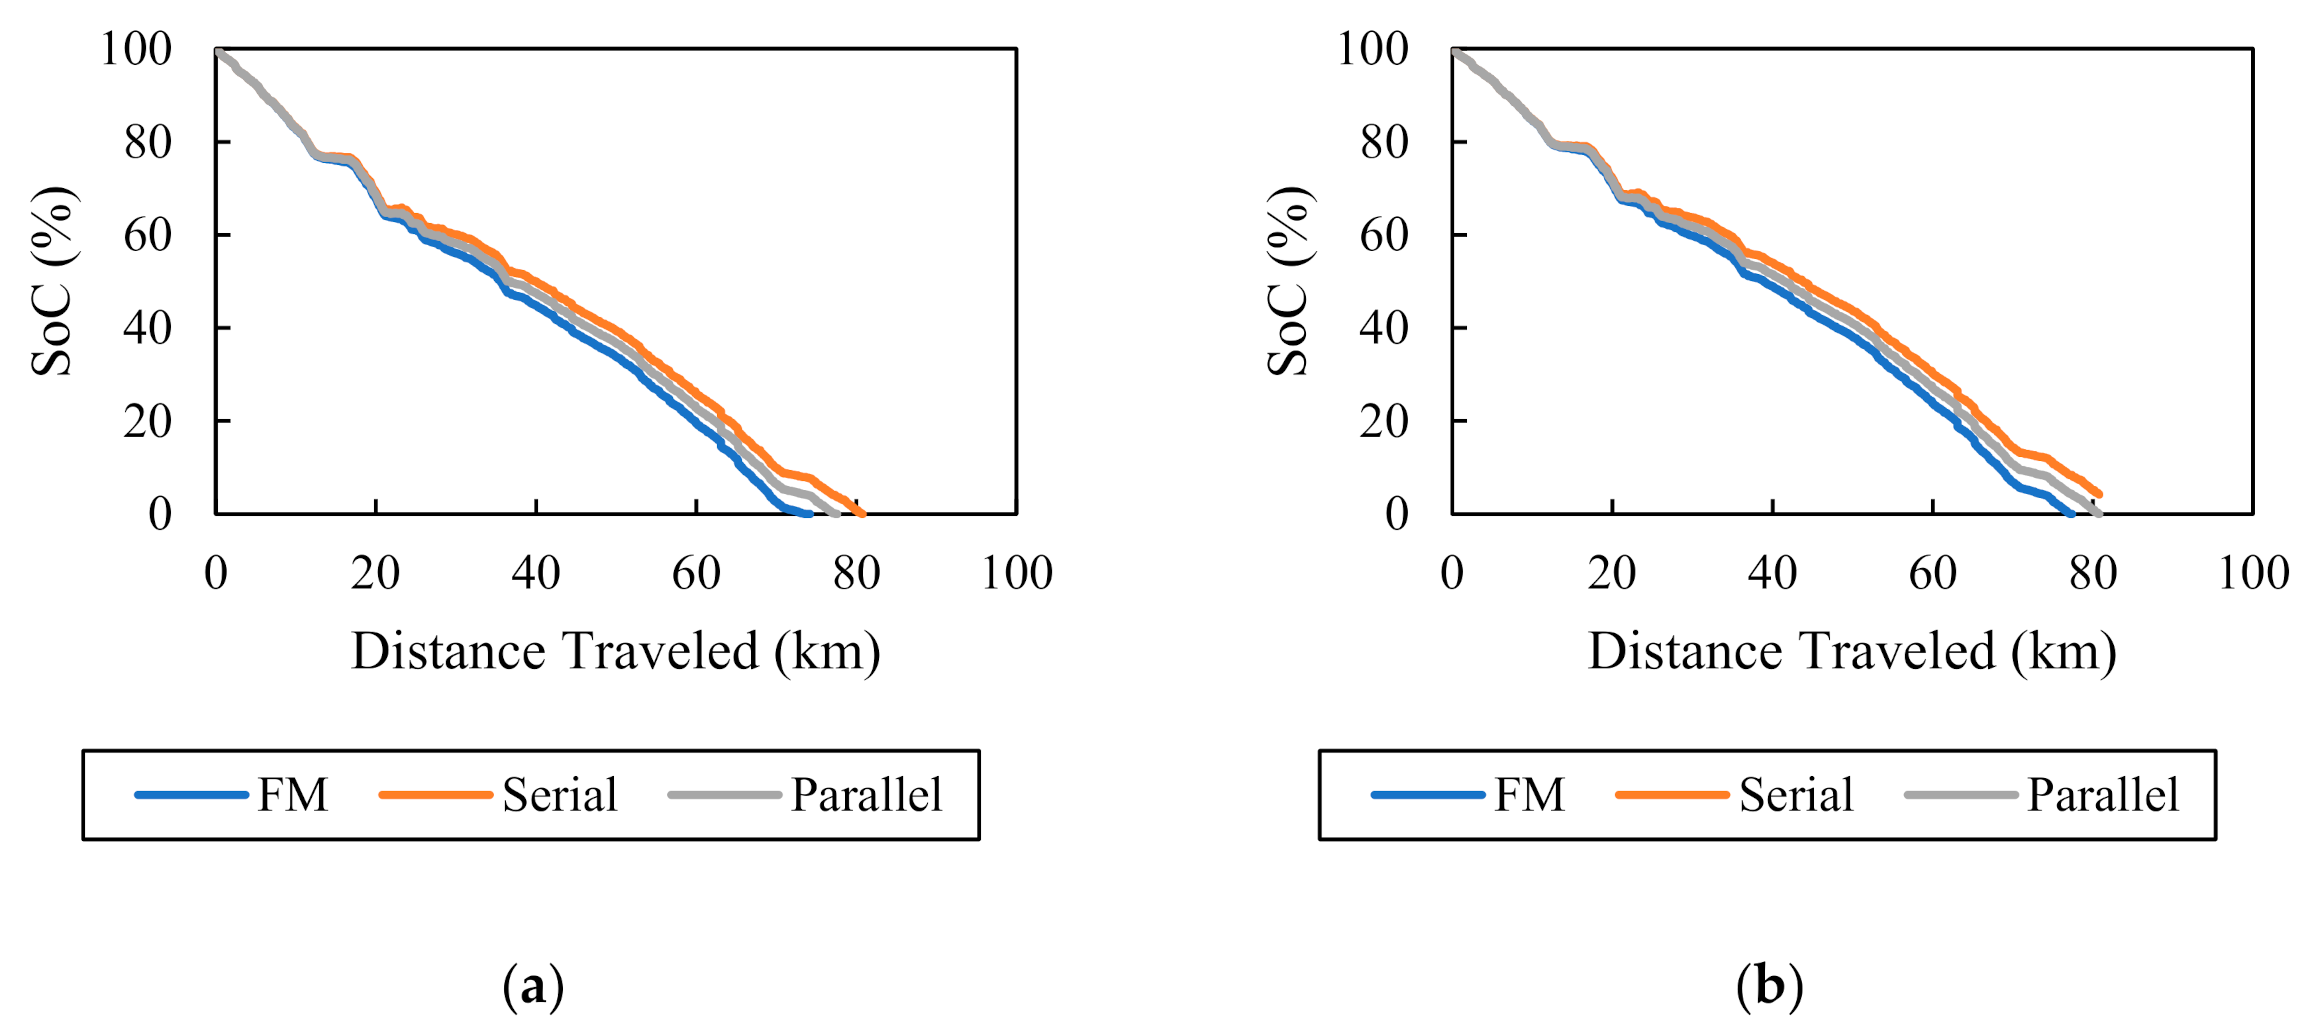
For the first route, all the cases that had been simulated managed to finish the route with a considerable amount of battery SoC. The serial regenerative braking strategy with the NCA battery gave the most amount of remaining SoC battery with 33.84%. This amount of SoC remaining was suitable for the battery as discharging the battery into lower than 30% might decrease the battery life cycle.
For the complete route, a decreased efficiency was caused by the low voltage of the batteries. The voltage of a battery varied according to its capacity. As the battery SoC was decreasing, the voltage was also decreasing. The lower amount of voltage with the same amount of power required results in a higher amount of current flowing out of the battery. Thus, the battery depletes faster and efficiency decrease. Several cases managed to finish the complete route, which is the NCA with serial and parallel and the LFP with serial. The remaining SoC for the configurations is 9.05%, 3.86%, and 4.60%. These values are not great because not only does it could potentially damage the battery, but also deviations that might happen while the e-trike is driven. If the distance needed is more than the calculations, then there will be a risk of over-discharging the battery.
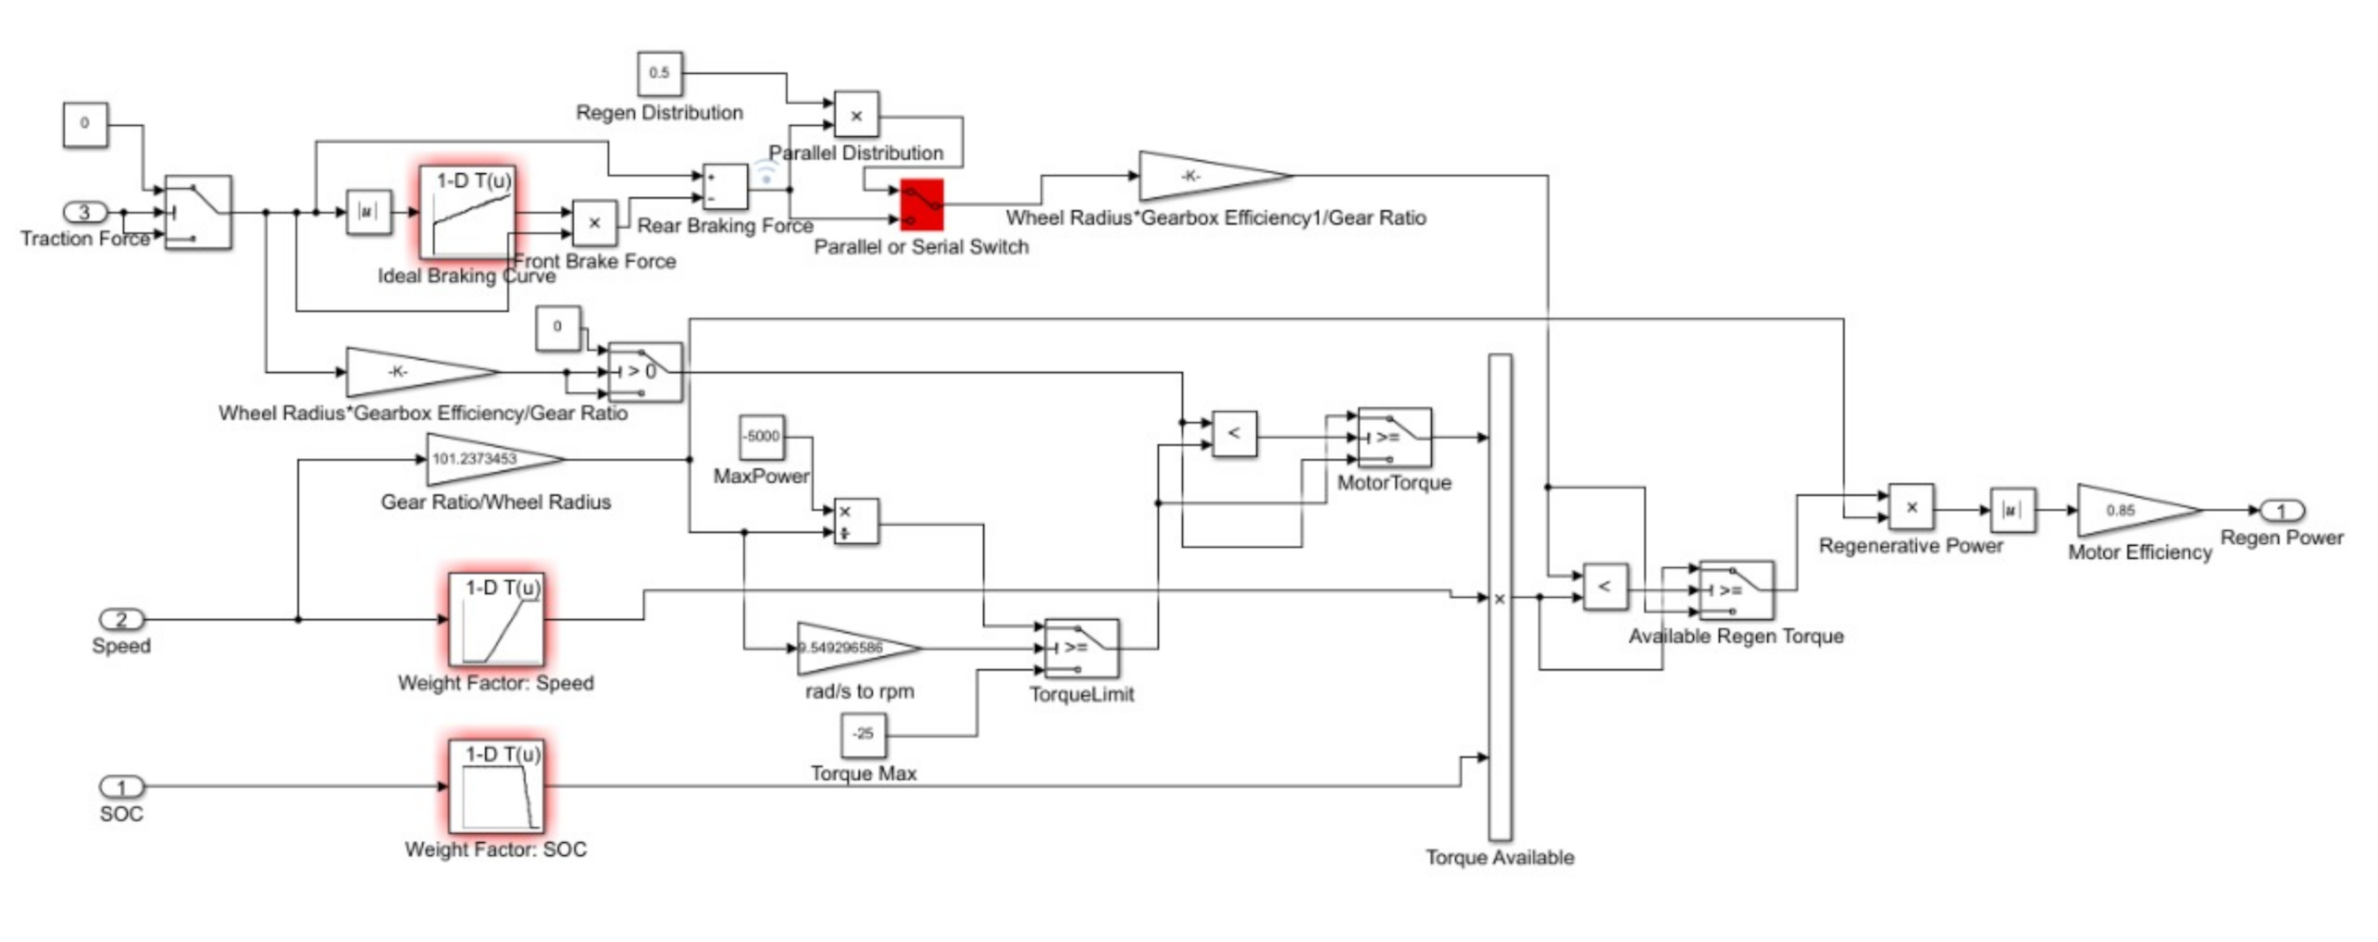
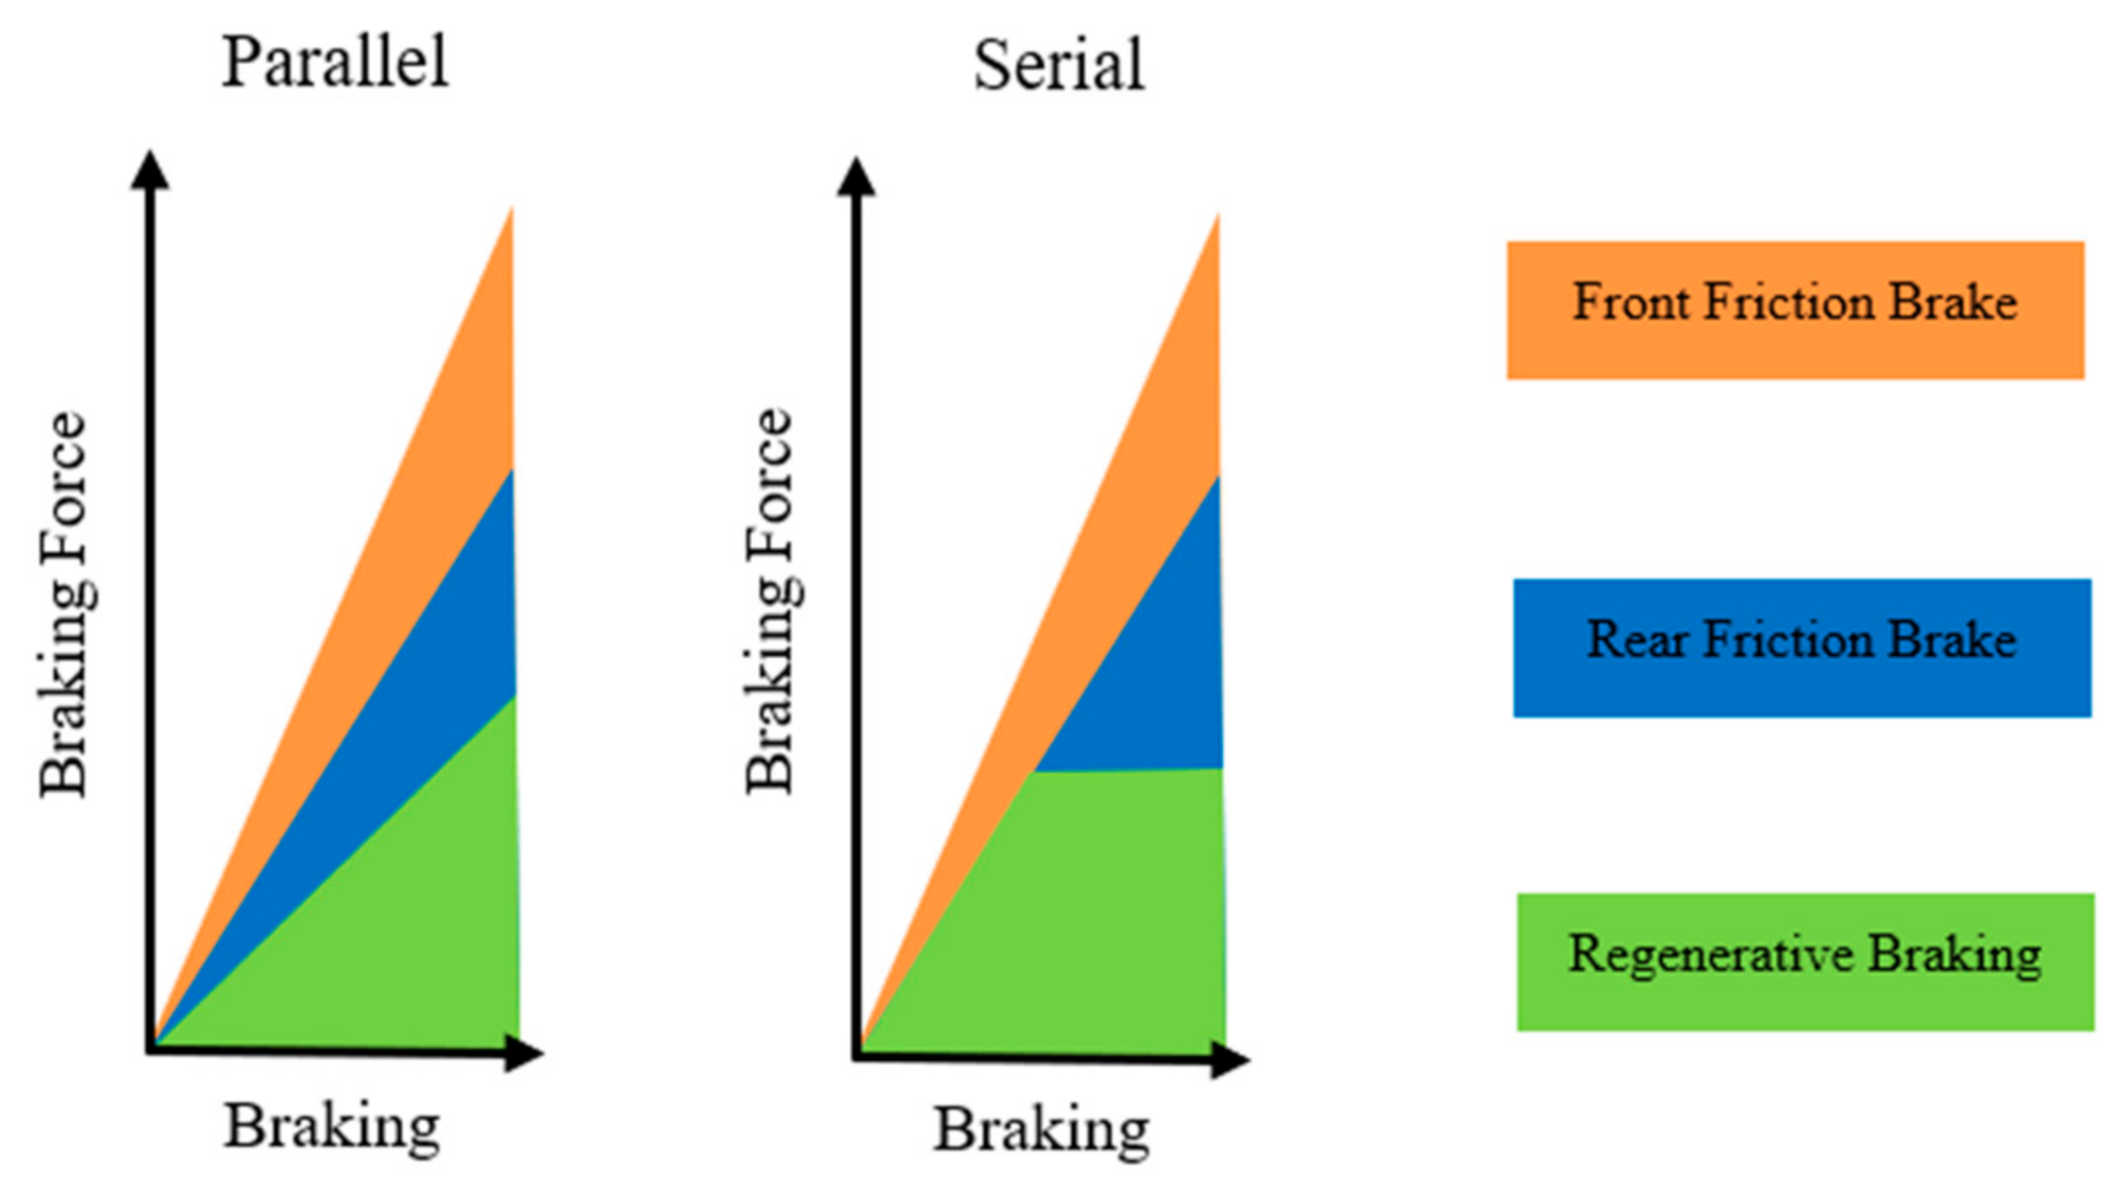
Figure 13 shows that for each battery type, the serial braking strategy offered an average increase an efficiency of 8.84%, while the parallel offered an increase an efficiency of 4.36%. The serial braking strategy was more than double the efficiency increase in the parallel braking strategy because the braking force distribution at the rear wheel for the parallel braking strategy was set to be in a constant number between the friction brake and the regenerative brake, which is set to 0.5 apiece. While the serial braking strategy used the regenerative braking for the rear brakes until the maximum brake torque available for the electric motor was reached, and then it used the friction brake. Overall, the NCA battery had more battery SoC remaining and more efficiency for each of the respective braking strategy.

4.2. RE Cases

For the RE cases, the addition of a RE added more mass to the vehicle, which caused more energy consumption. From Table 6 and 
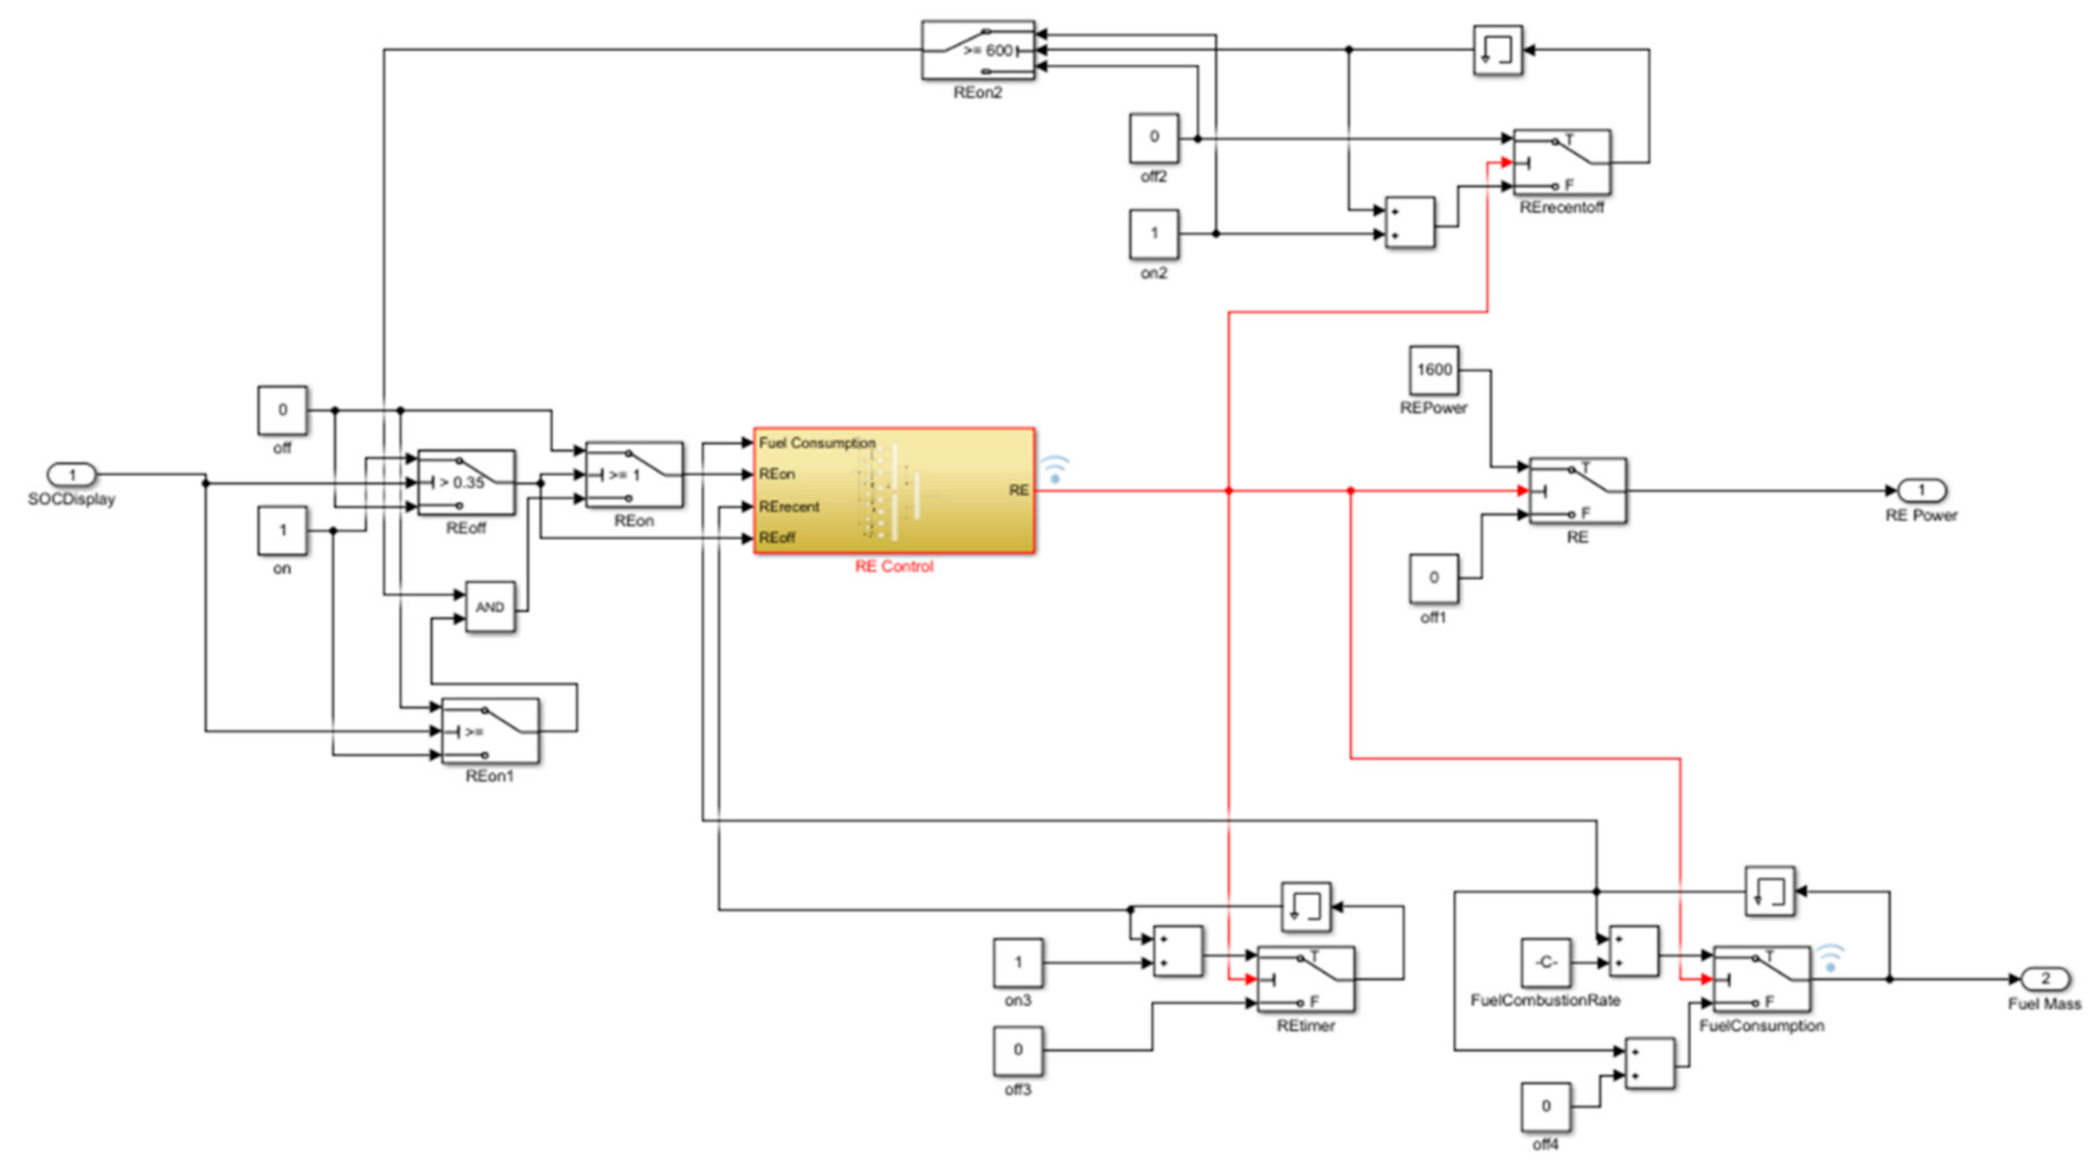
Table 7, it is shown that there are several cases where the usage of RE does not fulfill the target time operation of the RE, which is 600 s. Those cases were the full mechanical braking using NCA and LFP battery and LFP battery with serial regenerative braking with 20 kg and 36.3 kg RE.
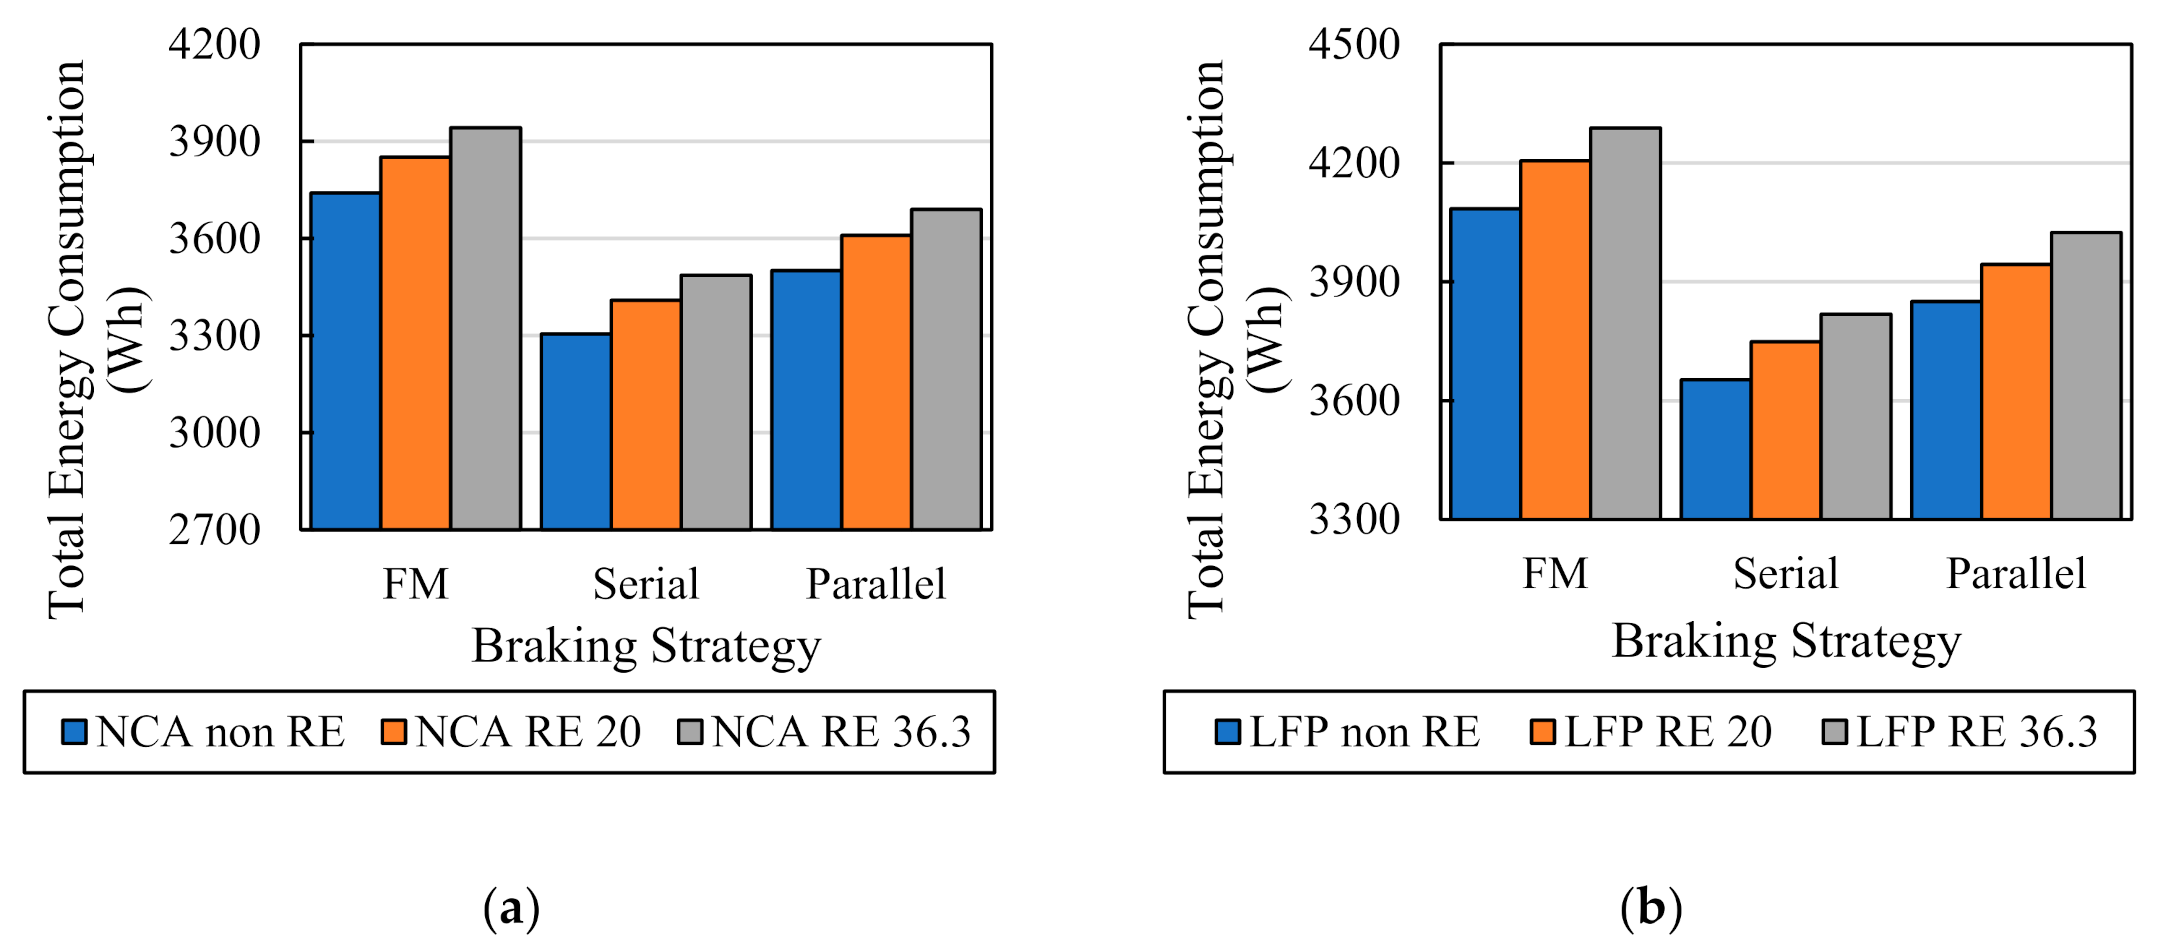
Figure 14 compares the total energy consumption for each braking strategy with NCA battery and LFP battery, respectively, with non-RE and RE cases for the first route. For every case, the heavier the RE mass, the more energy is used for the e-trike. It also shows that the serial regenerative braking with the NCA battery gave the least amount of energy consumed even without using a RE.
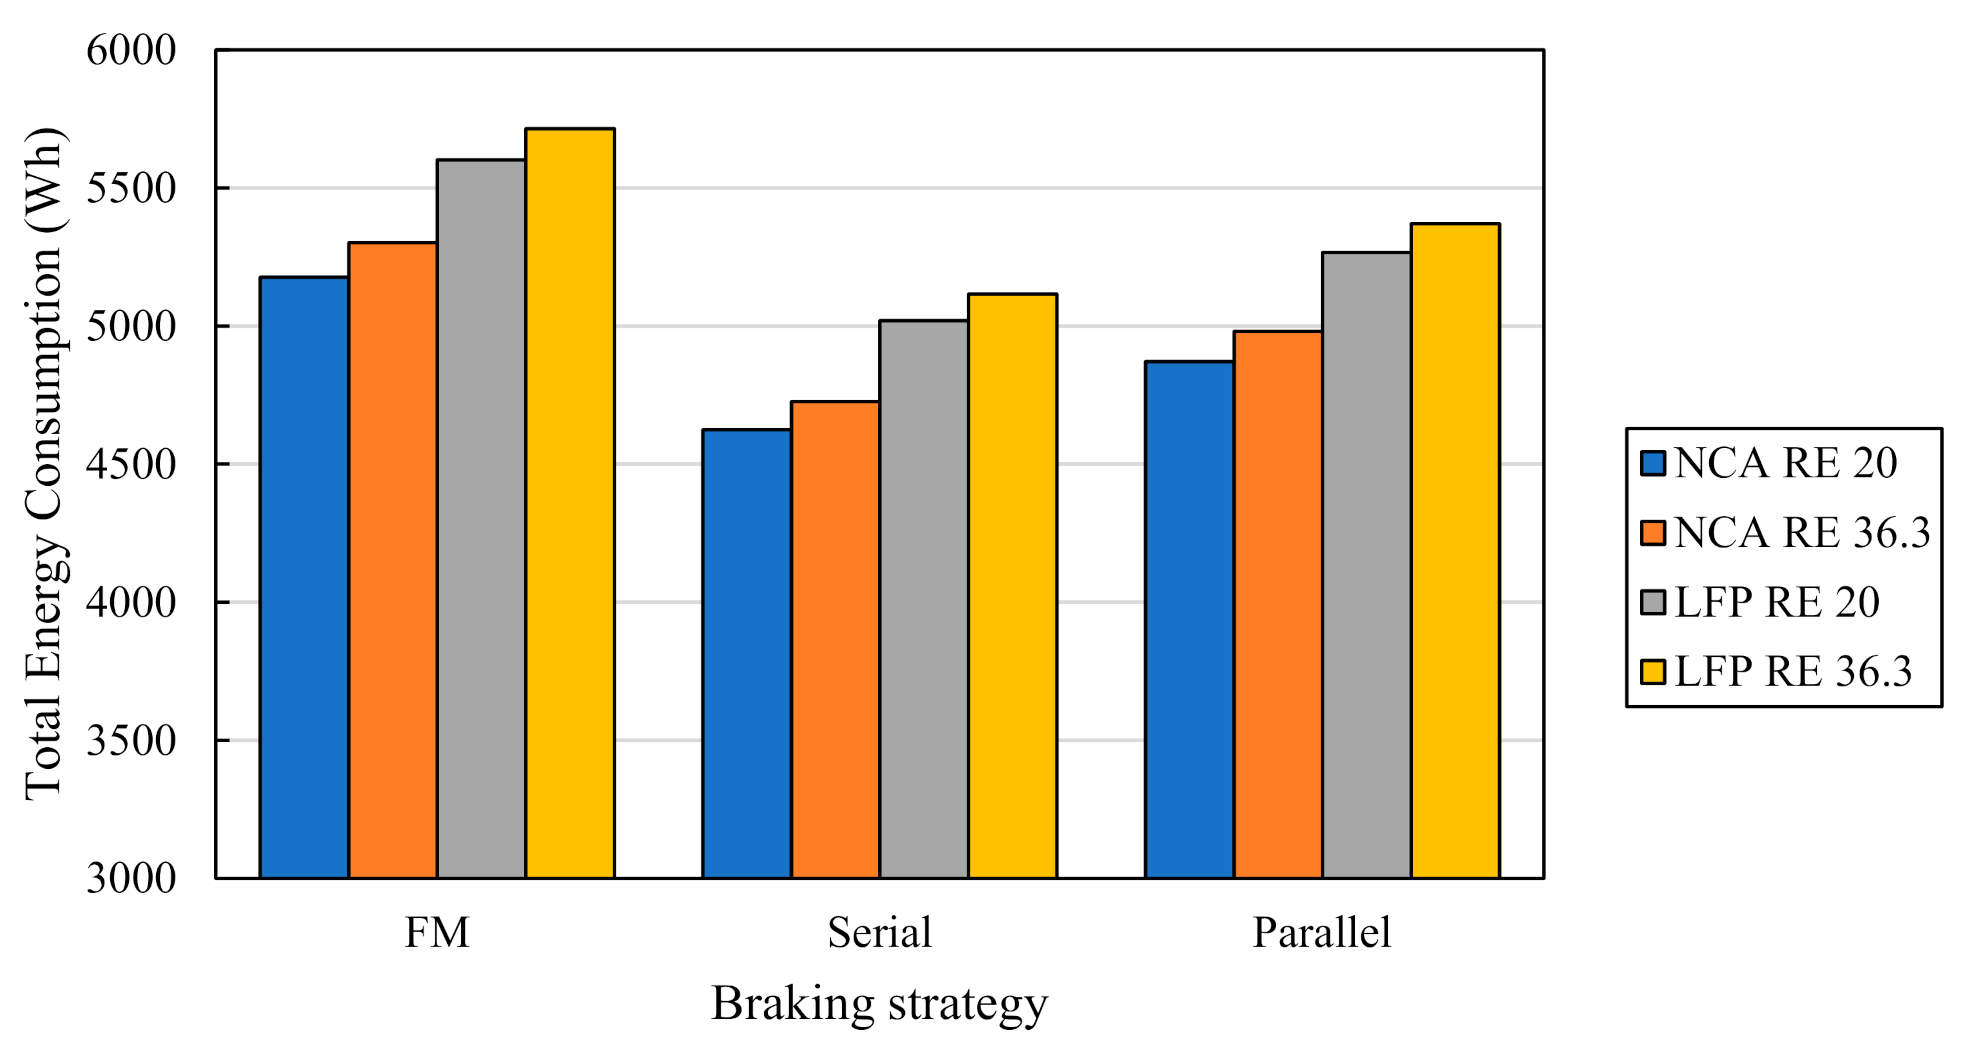
Figure 15 shows the comparison of energy consumption between RE cases with a complete route. As expected, the 20-kg RE combination with NCA and LFP battery consumed less energy than using 36.3 kg RE for each braking strategy. Serial regenerative braking strategy having the least amount of energy consumed. The total mass of the LFP battery (42.152 kg) and RE proved that the combination between LFP and RE configuration is too heavy, even using 20 kg or 36.3 kg RE. The energy consumption is much higher than the NCA battery combination configurations.
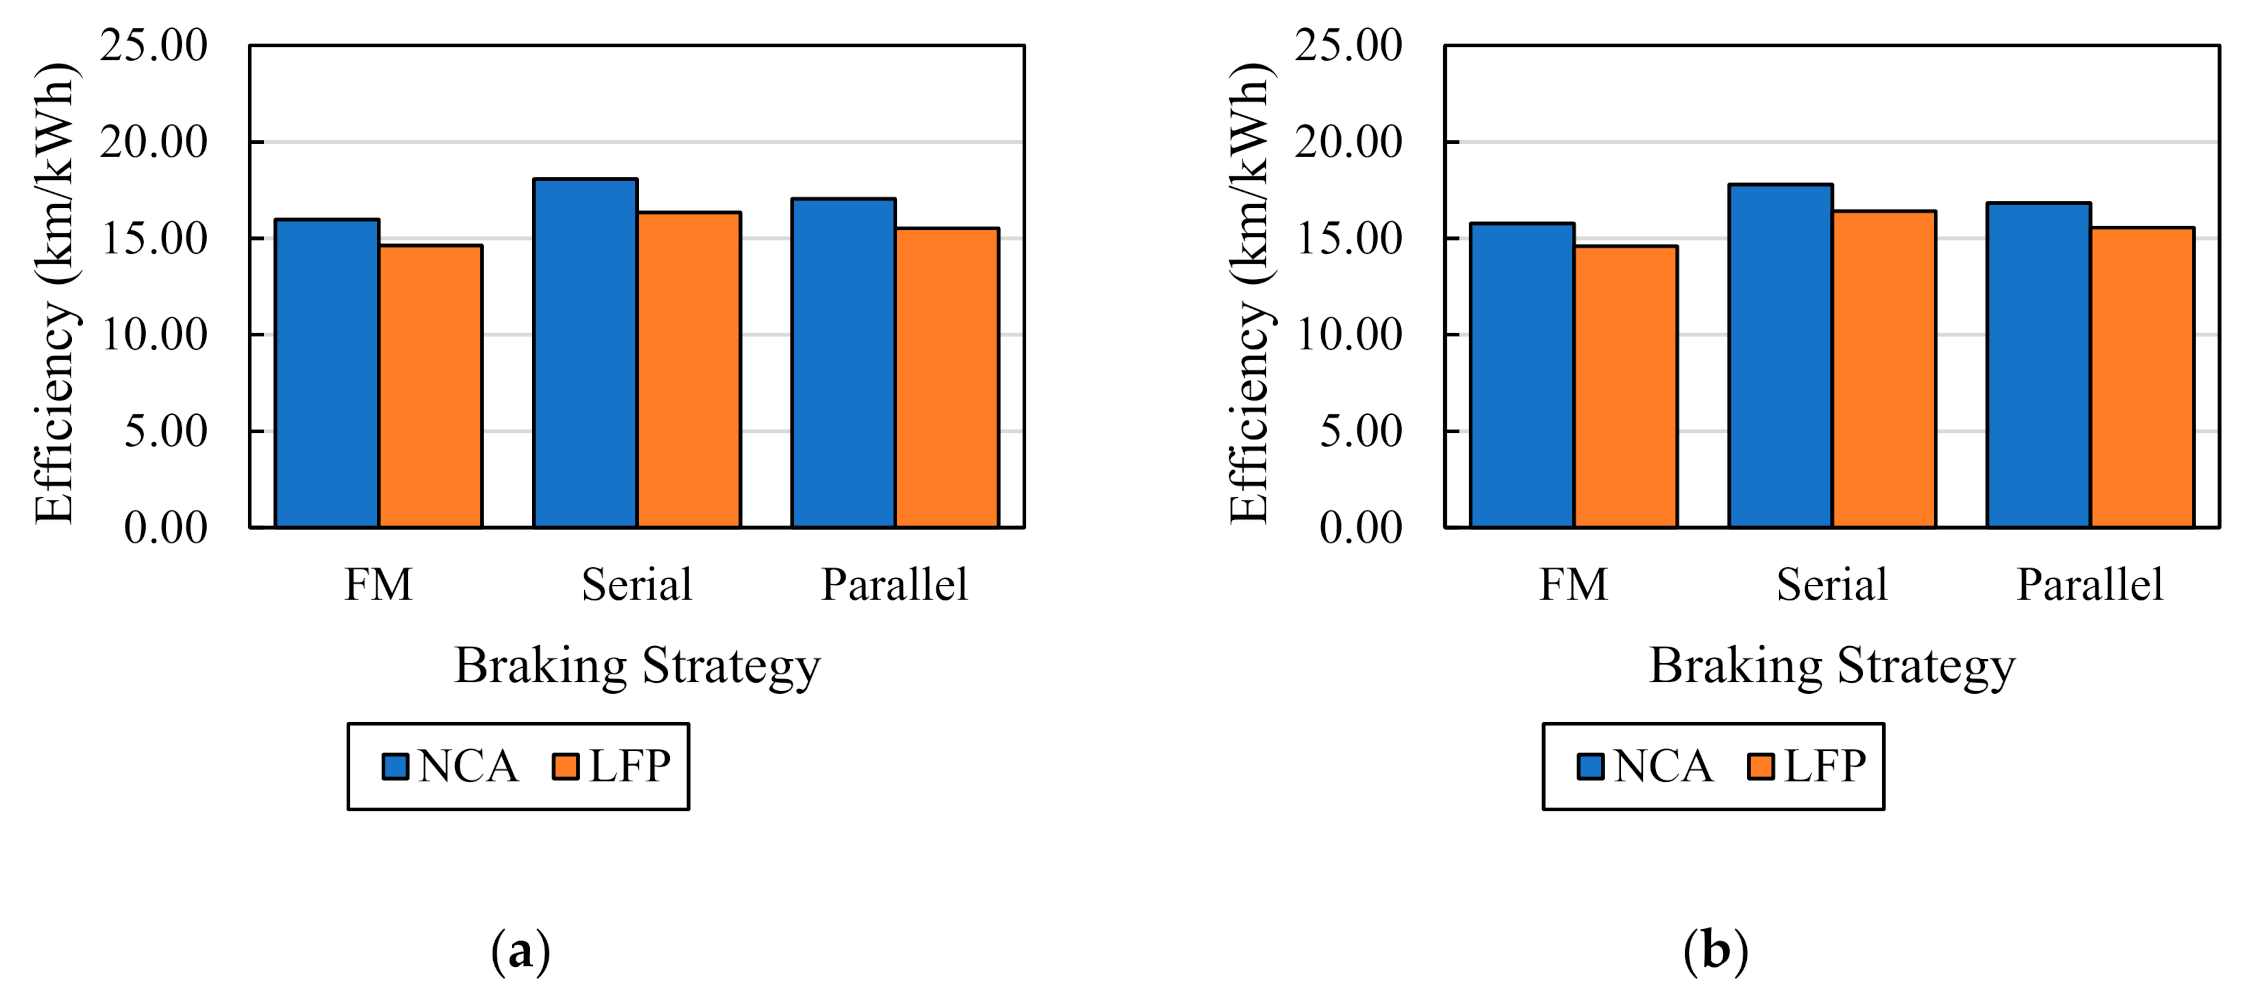
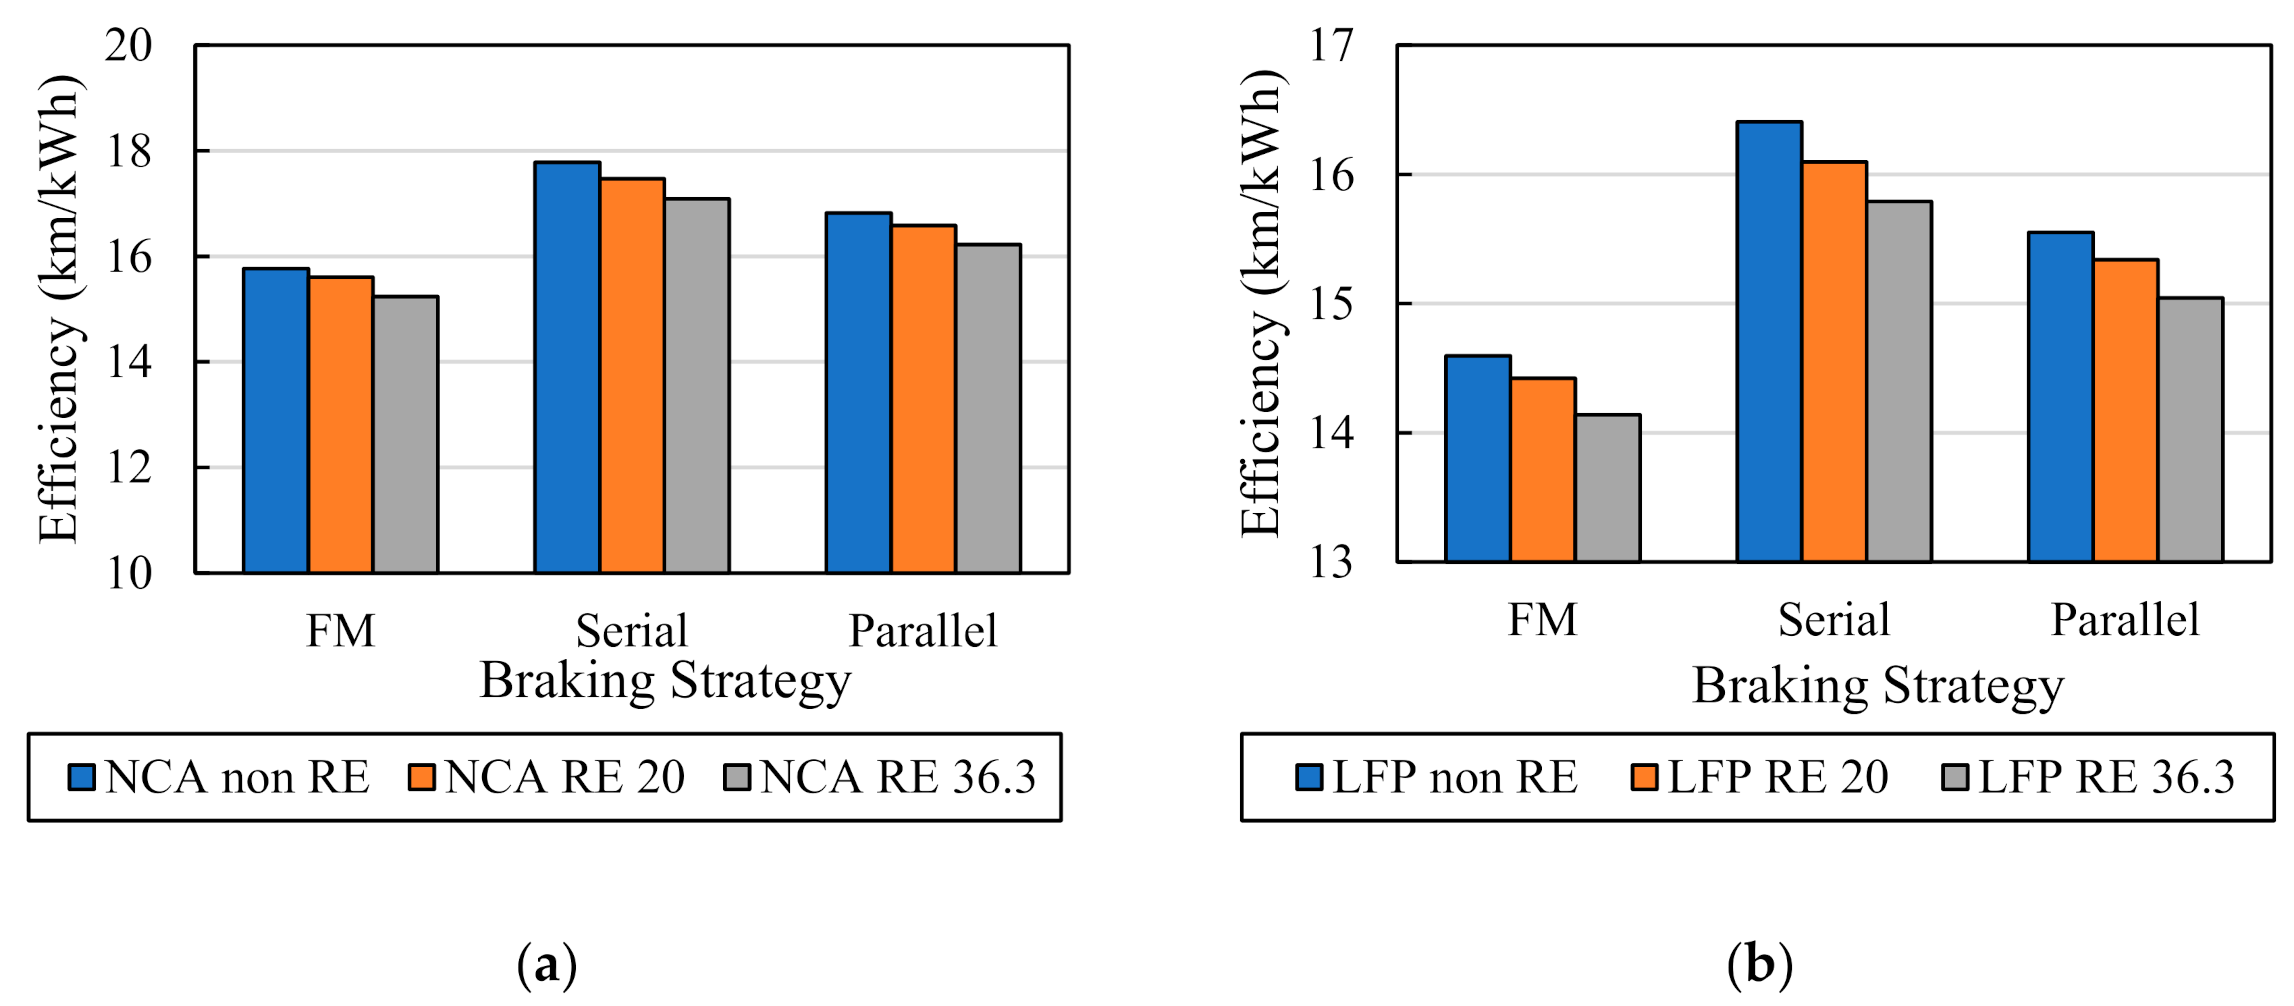
Figure 16 shows the efficiency comparison between the RE cases and non-RE cases for the complete route. The ranking of the most efficient configuration combinations is NCA battery with serial regenerative braking strategy non-RE at 17.78 km/kWh, NCA serial RE 20 at 17.47 km/kWh, and NCA serial RE 36.3 at 17.09 km/kWh. The addition of RE did not increase the efficiency because of the mass added. As previously stated, the higher mass, the more the consumption of energy. The decrease of 1.8% efficiency from NCA serial non-RE to NCA serial RE 20 kg is still fine with the addition of greater safety factor and longer-lasting battery life due to higher remaining SoC.

4.3. Effect of RE

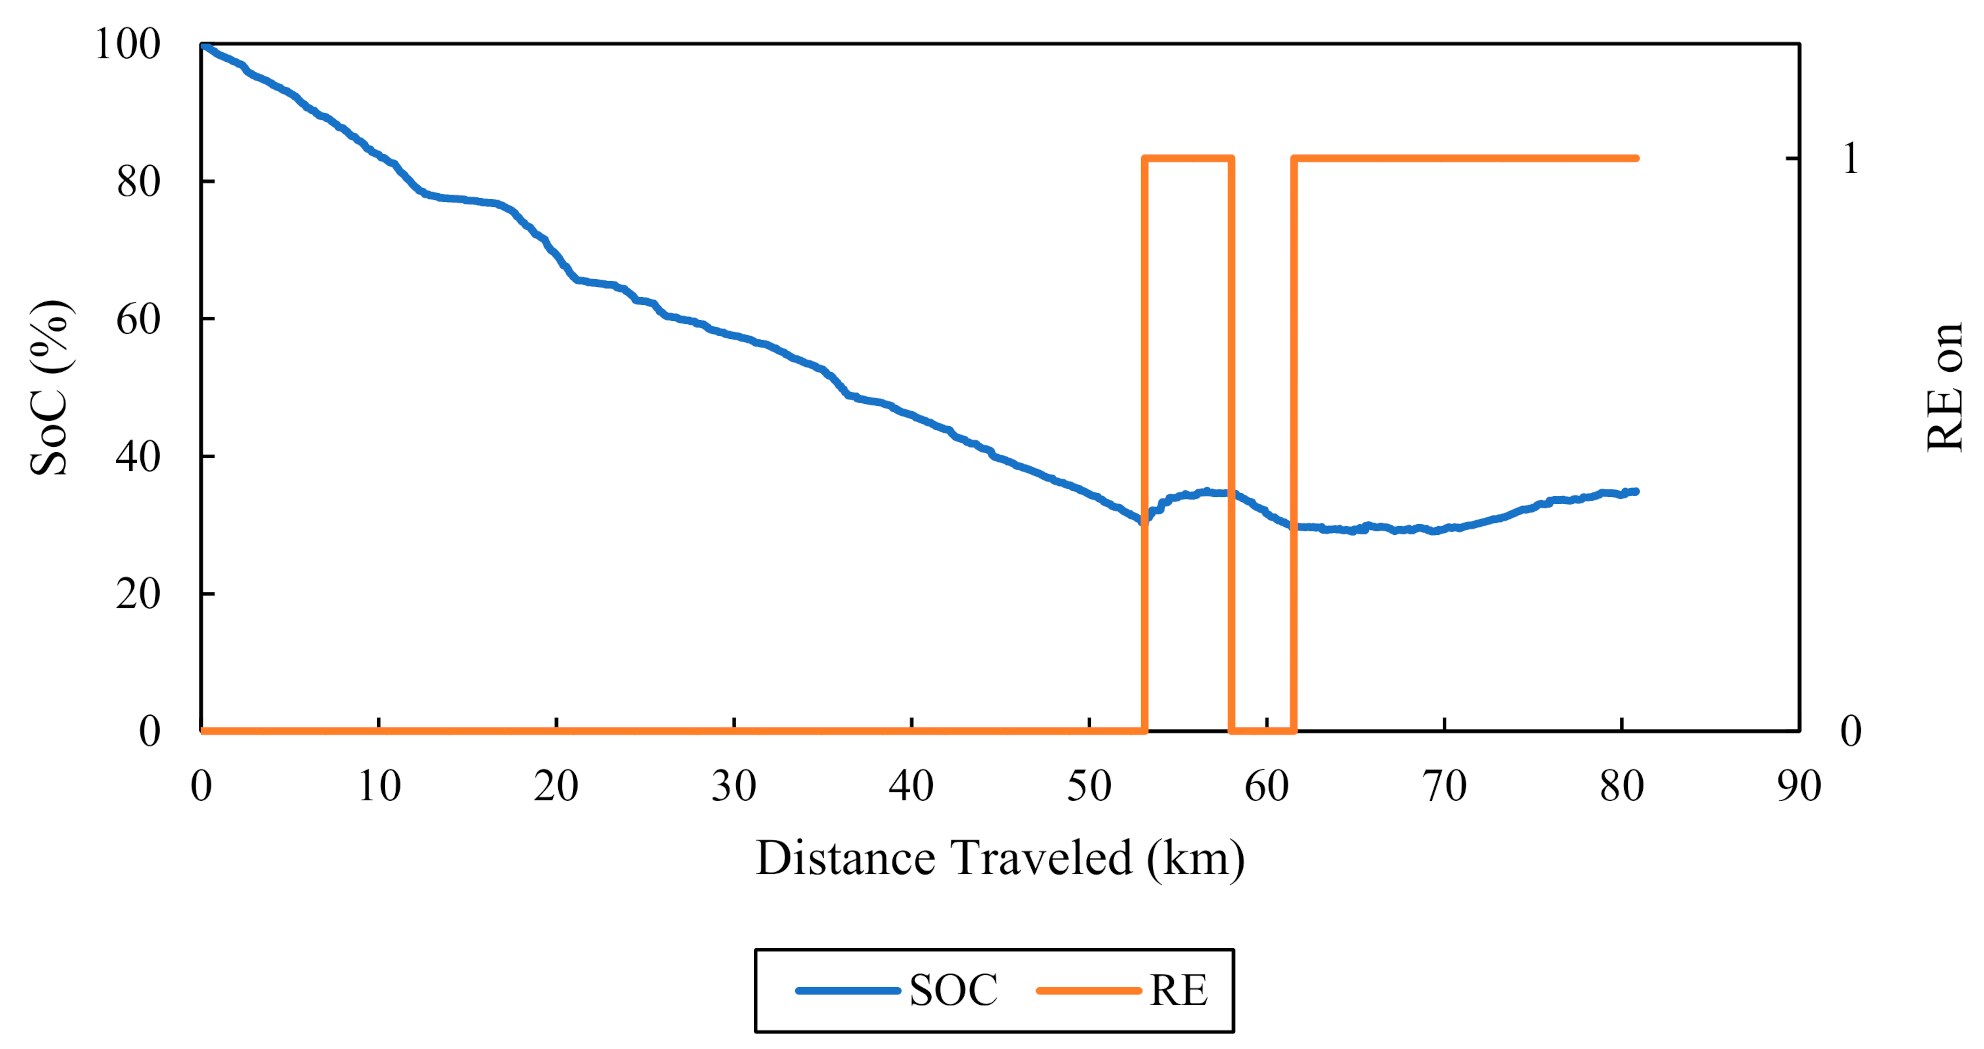
From the RE case discussion, it is concluded that the addition of RE into the e-trike reduces its efficiency. Additionally, the less amount of RE mass, the higher the efficiency of the vehicle. The cases that were simulated in this research were unable to showcase the effect of the RE, albeit by its range addition or efficiency. Nevertheless, one certain thing is that a RE guarantees that the e-trike finishes the route with at least around 30% battery SoC. This chapter focuses on further research on the impact of a RE on the e-trike’s performance.
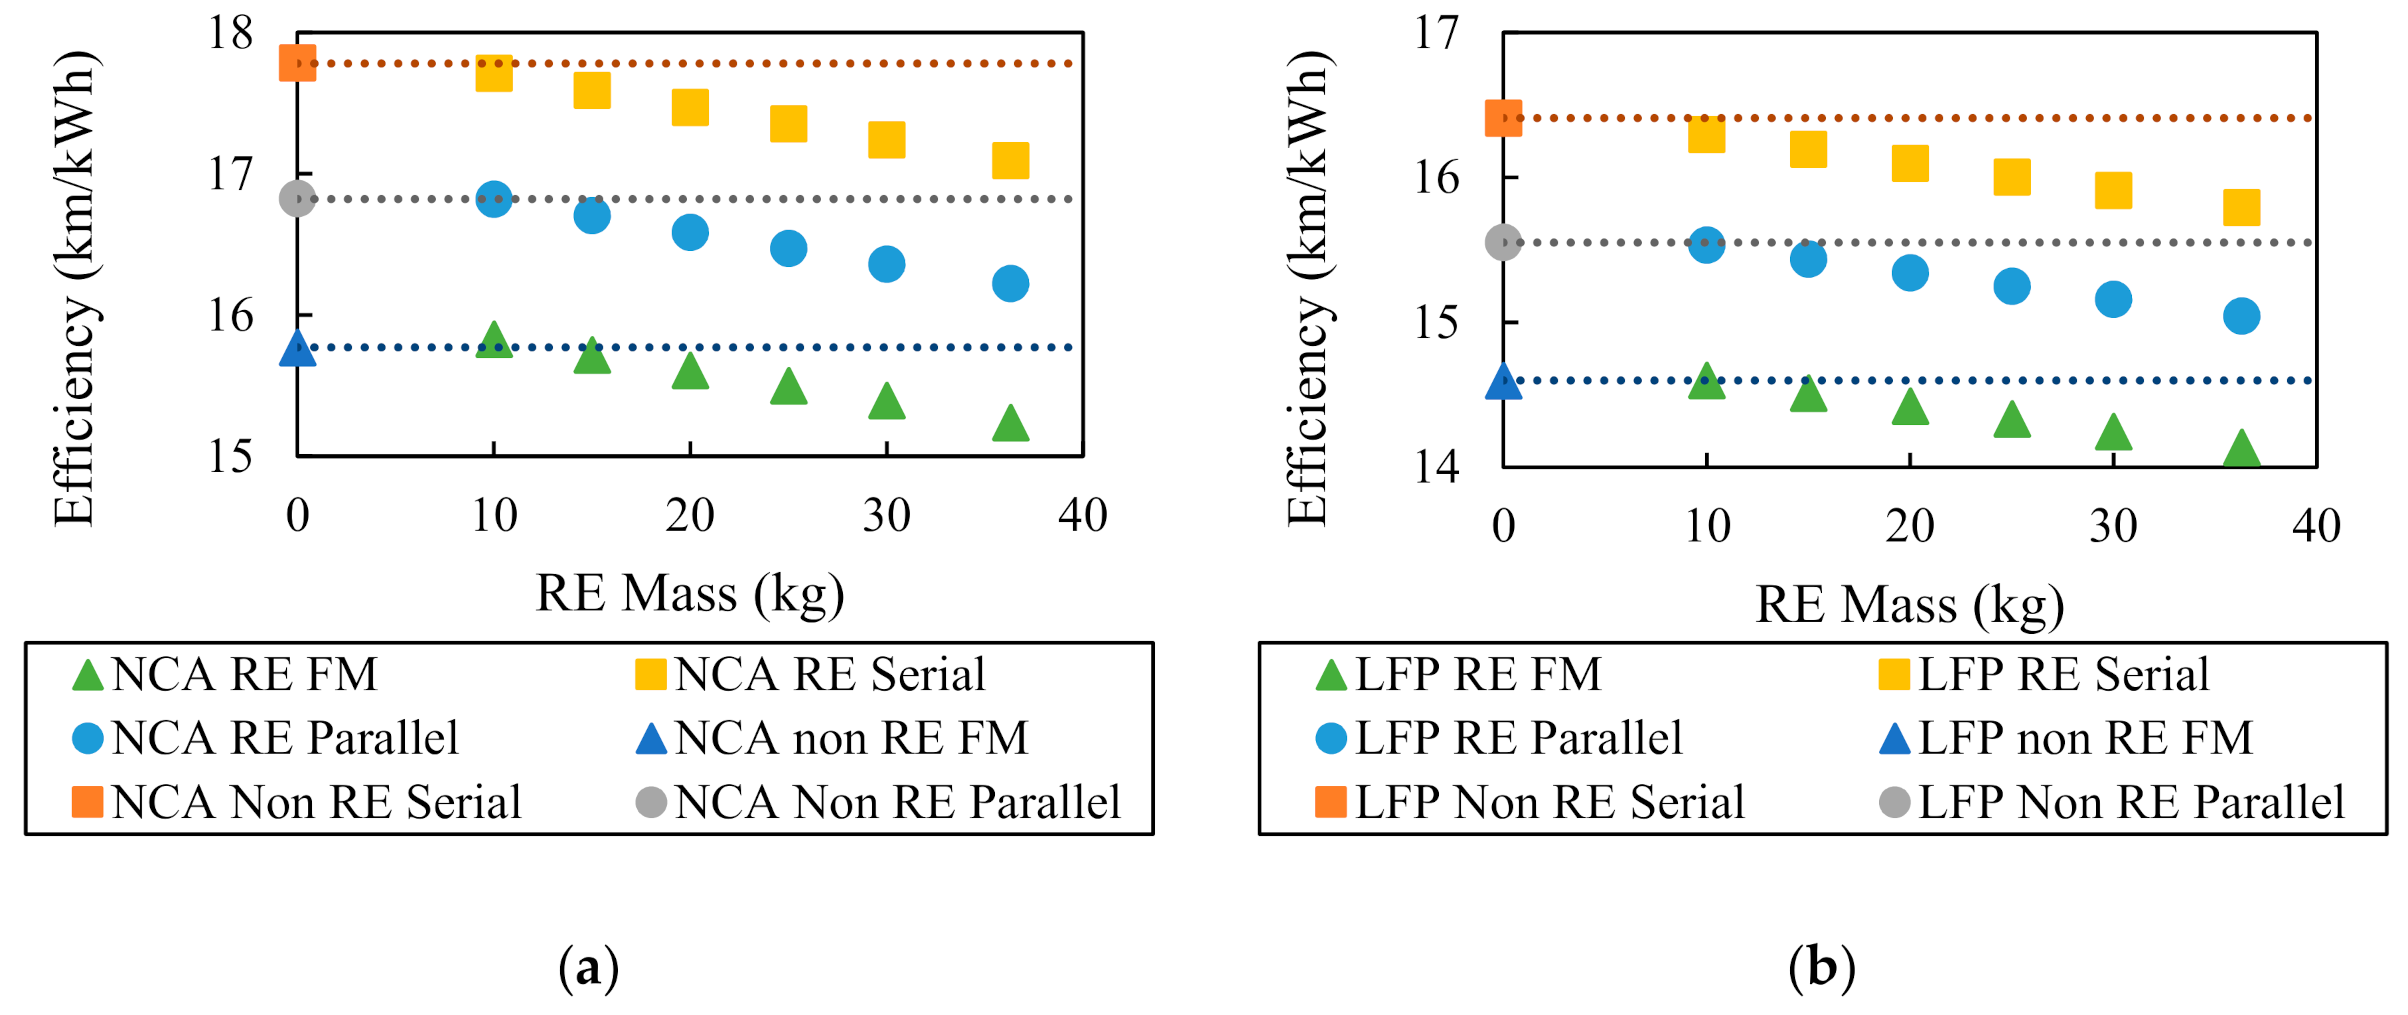
Figure 17 shows the results of several variations of RE mass ranging from 10, 15, 20, 25, 30, and 36.3 kg for NCA battery and LFP battery, respectively. For the NCA full mechanical configuration, the maximum mass of RE allowed increasing the efficiency from the non-RE case is around 15 kg. For the NCA parallel configuration, the maximum mass of RE allowed increasing the efficiency is also around 15 kg. For the NCA serial configuration, however, the maximum is around 10 kg. These numbers are quite impossible to obtain with the current RE technology. However, these numbers should be the target for future improvements regarding RE mass. These numbers also show that the current design of the e-trike is already quite efficient and a higher power-to-weight ratio of the RE is needed for its efficiency to increase.
For the LFP full mechanical configuration, the maximum mass allowed for the efficiency to increase is around 15 kg. For the LFP parallel configuration, the maximum mass allowed for the efficiency to increase is around 10 kg. For the LFP serial, however, the maximum mass allowed is less than 10 kg. Again, these numbers are impossible to achieve with the current technology. The maximum mass allowed is less than that of the NCA configurations, even though the LFP has significantly less efficiency and more energy usage. This means that the added LFP mass with the added RE mass is too high for the e-trike. The LFP has much lower specific energy than the NCA, thus requiring much more battery cells to provide around the same amount of energy. For the LFP configurations, perhaps a downsizing of the battery could be done, and an increase in the power of the RE could be done.

4.4. Design Evaluation of the e-Trike

From the simulation and analysis that have been conducted in the previous chapter, the energy usage of each variation was compared with each other in terms of its effectiveness (distance traveled) and efficiency (distance traveled/energy consumption).
Table 10 shows the efficient configuration for the first route. All the cases were proven to be effective with every case have a remaining SoC of at least 20%. Less than 30% of the SoC left might affect the battery life cycle, but every case was effective. In terms of efficiency, the most efficient configuration for the first route was the NCA battery with the serial regenerative strategy without a RE, with 17.26 km/kWh. The base case of the e-trike, which is the NCA battery with full mechanical braking and no RE yields and efficiency of 15.81 km/kWh, is mediocre compared to other configurations.
Table 11 shows the efficient configuration for the complete route. The non-RE case of NCA serial regenerative braking was effective and efficient, with 16.88 km/kWh. Although, the remaining SoC was 4%, which could potentially run out while in the process, leading to over-discharging of the battery and damage to the battery. Additionally, all the RE cases were effective in this case. Three of the most efficient causes were the serial regenerative braking case, which is undoubtedly great for efficiency. Although, the usage of serial regenerative braking might feel odd for the driver, as motor braking gave a different feel and different response times. The solution for this problem is using the parallel regenerative braking cases, giving not only a decent amount of efficiency (15.98 and 15.61 km/kWh) but also a quicker response time and better safety.
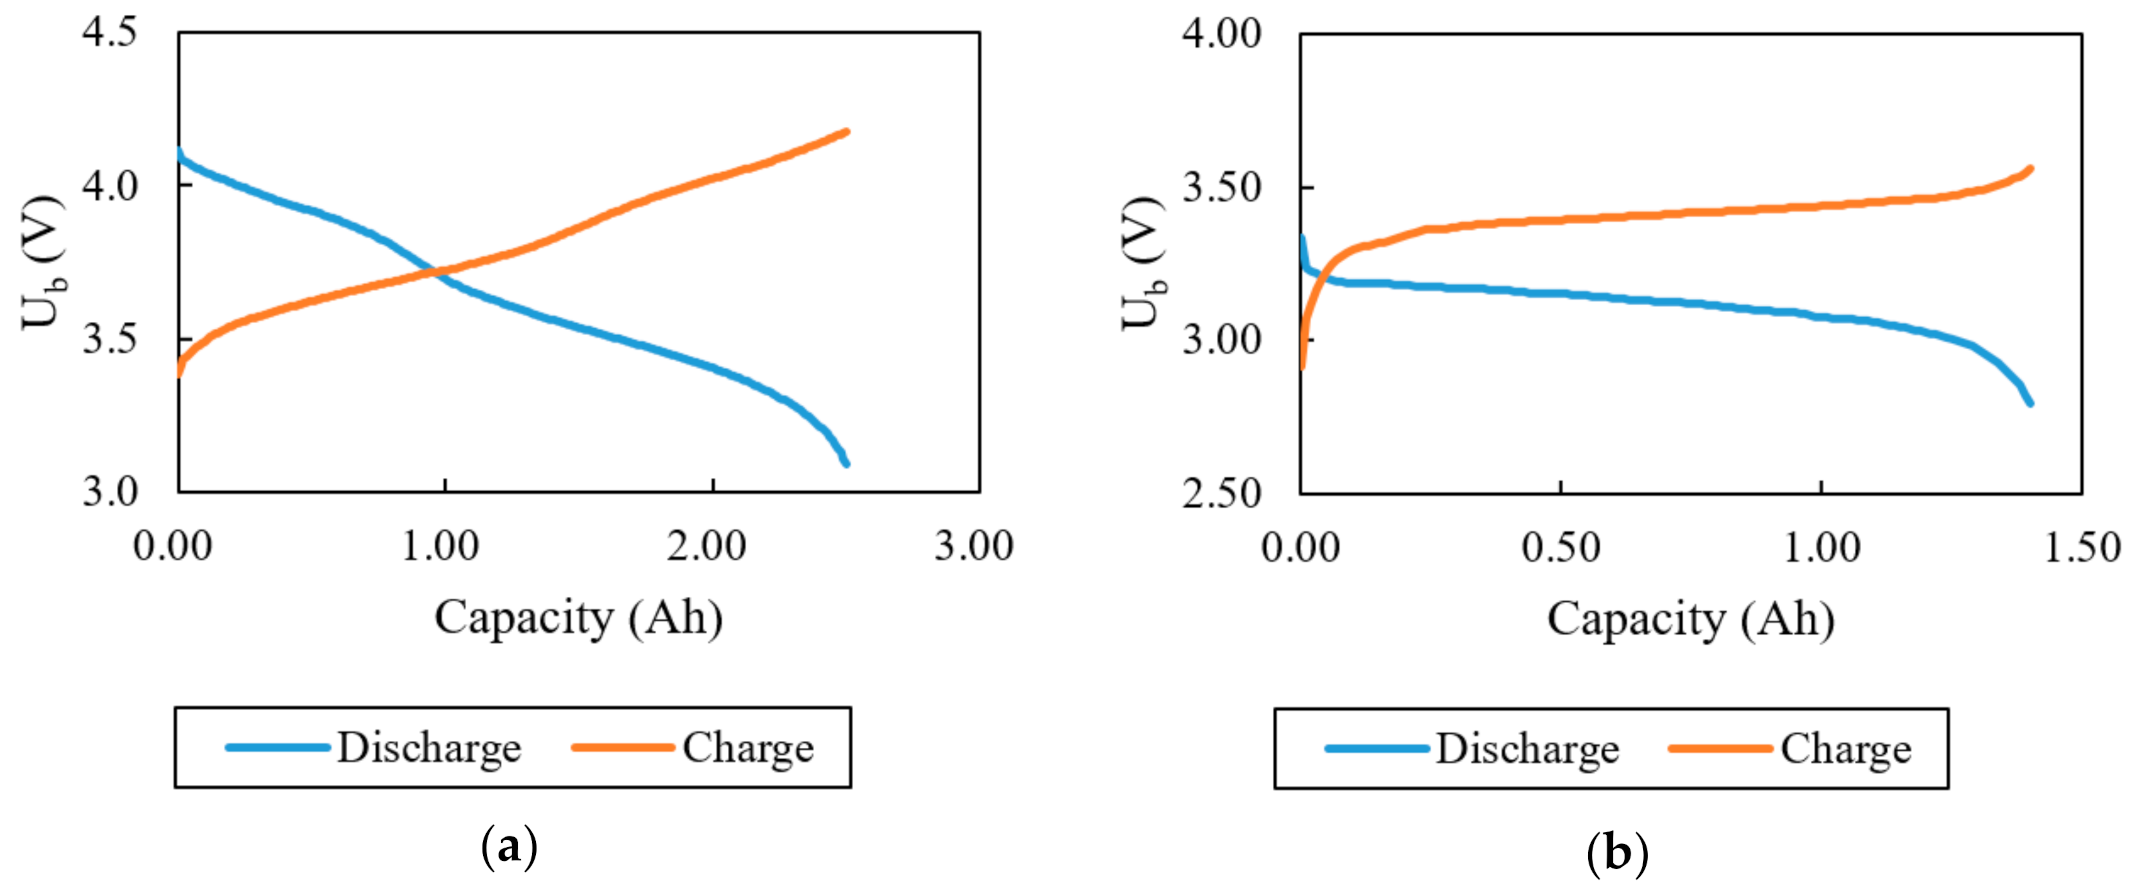
None of the LFP cases were made into the most efficient configurations since having been discussed before, which is the added mass. Therefore, the LFP battery is not suitable for the e-trike, or electric vehicle in general because of its low specific energy. The NCA battery has a clear advantage over the LFP in terms of specific energy (NCA 201.87 Wh/kg, LFP 97.13 Wh/kg). The LFP itself has advantages over the NCA, which is an excellent safety and long-life span. The NCA itself is an excellent battery with high energy and power density, but it has a high cost, and its safety is a bit questionable [28].
In conclusion, the best configuration for the e-trike in terms of efficiency is the NCA battery with serial regenerative braking strategy with no RE equipped. Although the remaining battery SoC is 4%, which can lead to over-discharging of the battery and then damage the battery life. Additionally, the main operating hour is still three hours on the first route only, and this configuration also gives the best efficiency for the first route. In case that the complete route must be completed, this configuration can complete it as well. The next best configuration will be the NCA serial regenerative braking with RE equipped. This configuration ensures that if the e-trike must complete the whole route, the e-trike will not have any problems completing it. The next best configuration for effectiveness and efficiency is the NCA, with a parallel braking strategy and RE equipped. This configuration might give less efficiency but give a better response time in braking and better safety.

5. Conclusions

A model of an energy management system based on equations of general engineering vehicles using Matlab software has been created. The model has considered many possible configurations, including typical braking strategies, the appearance of range extender including control strategy and its mass variation, and accommodating other possible electric motors/transmission configurations. Thus, other researchers can easily follow our algorithm implemented to the other type of vehicle or driving cycle required. The implementation of RE gives more effectiveness to the e-trike because it increases the range of the e-trike, although, in this case, the e-trike has almost fulfilled the needed distance. The heavier the mass of the RE, the more energy the e-trike consumes. For the e-trike to be more efficient than the non-RE case, the mass of the RE should be limited. The current design of the e-trike is only effective for the first route, but not effective for the complete route, and it is not efficient enough. The best configuration for the proposed e-trike in terms of efficiency and effectiveness for both routes is the NCA battery with serial regenerative braking and no RE needed (17.26 km/kWh and 16.88 km/kWh for first and complete route).
An experiment using the e-trike should be done to validate further the results obtained from this research. A dynamic approach model regarding the e-trike could be done for the next research for the results to be more accurate and to optimize the performances of the e-trike. Further research on the optimization of the serial and parallel regenerative braking systems can be done further to improve the performance and efficiency of the e-trike. Further developments to reduce the mass of the RE needs to be conducted to achieve a higher vehicle efficiency.

Author Contributions

Conceptualization, I.K.R. and B.A.B.; methodology, I.K.R., B.A.B., abd M.I.; software, R.R.A. and M.I.; validation, R.R.A., P.L.S. and M.I.; formal analysis, I.K.R. and P.L.S.; writing—original draft preparation, I.K.R., R.R.A., and B.A.B.; writing—review and editing, P.L.S., S.P.S., A.R.A.A., and E.Z.Z.A.; supervision, S.P.S. and A.R.A.A.; project administration, B.A.B. and E.Z.Z.A. All authors have read and agreed to the published version of the manuscript.

Funding

This research was funded by Institut Teknologi Bandung under Multidisciplinary Research Program with grant number 7469/I1.B04.1/PL/2019.

Conflicts of Interest

The authors declare no conflict of interest.

References

  1. United States Environmental Protection Agency. Greenhouse Gas Emissions from a Typical Passenger Vehicle. Available online: https://www.epa.gov/greenvehicles/greenhouse-gas-emissions-typical-passenger-vehicle (accessed on 18 August 2020).
  2. Aziz, M.; Budiman, B.A. Extended utilization of electric vehicles in electrical grid services. In Proceedings of the 2017 4th International Conference on Electric Vehicular Technology (ICEVT), Sanur, Indonesia, 2–5 October 2017; pp. 1–6. [Google Scholar]
  3. Islameka, M.; Leksono, E.; Yuliarto, B. Modelling of regenerative braking system for electric bus. J. Phys. Conf. Ser. 2019, 1402, 044054. [Google Scholar] [CrossRef] [Green Version]
  4. Halimah, P.N.; Rahardian, S.; Budiman, B.A. Battery Cells for Electric Vehicles. Int. J. Sustain. Transp. 2019, 2, 54–57. [Google Scholar] [CrossRef] [Green Version]
  5. Ehsani, M.; Gao, Y.; Longo, S.; Ebrahimi, K. Modern Electric, Hybrid Electric, and Fuel Cell Vehicles; CRC Press: Boca Raton, FL, USA, 2018. [Google Scholar]
  6. De Las Heras, A. Sustainability Science and Technology: An Introduction; CRC Press: Boca Raton, FL, USA, 2014. [Google Scholar]
  7. Aziz, M.; Huda, M.; Budiman, B.A.; Sutanto, E.; Sambegoro, P.L. Implementation of Electric Vehicle and Grid Integration. In Proceedings of the 2018 5th International Conference on Electric Vehicular Technology (ICEVT), Surakarta, Indonesia, 30–31 October 2018; pp. 9–13. [Google Scholar]
  8. Neubauer, J.; Wood, E. The impact of range anxiety and home, workplace, and public charging infrastructure on simulated battery electric vehicle lifetime utility. J. Power Sources 2014, 257, 12–20. [Google Scholar] [CrossRef]
  9. BloombergNEF. Electric Vehicle Outlook 2020. Available online: https://about.bnef.com/electric-vehicle-outlook/ (accessed on 28 September 2020).
  10. International Energy Agency. Global EV Outlook 2020. Available online: https://www.iea.org/reports/global-ev-outlook-2020 (accessed on 28 September 2020).
  11. Fabianski, B.; Wicher, B. Control algorithms in distributed system of three wheeled electric vehicle. In Proceedings of the 16th International Conference on Mechatronics-Mechatronika 2014, Brno, Czech Republic, 3–5 December 2014; pp. 38–44. [Google Scholar]
  12. Tate, E.; Harpster, M.O.; Savagian, P.J. The electrification of the automobile: From conventional hybrid, to plug-in hybrids, to extended-range electric vehicles. SAE Int. J. Passeng. Cars-Electron. Electr. Syst. 2008, 1, 156–166. [Google Scholar] [CrossRef] [Green Version]
  13. Dell, R.M.; Moseley, P.T.; Rand, D.A. Towards Sustainable Road Transport; Academic Press: Cambridge, MA, USA, 2014. [Google Scholar]
  14. Kerviel, A.; Pesyridis, A.; Mohammed, A.; Chalet, D. An Evaluation of Turbocharging and Supercharging Options for High-Efficiency Fuel Cell Electric Vehicles. Appl. Sci. 2018, 8, 2474. [Google Scholar] [CrossRef] [Green Version]
  15. Brito, F.; Martins, J.; Lopes, F.; Castro, C.; Martins, L.; Moreira, A. Development and Assessment of an Over-Expanded Engine to be Used as an Efficiency-Oriented Range Extender for Electric Vehicles. Energies 2020, 13, 430. [Google Scholar] [CrossRef] [Green Version]
  16. Waseem, M.; Suhaib, M.; Sherwani, A.F. Modelling and analysis of gradient effect on the dynamic performance of three-wheeled vehicle system using Simscape. SN Appl. Sci. 2019, 1, 225. [Google Scholar] [CrossRef] [Green Version]
  17. Targosz, M.; Skarka, W.; Przystałka, P. Model-based optimization of velocity strategy for lightweight electric racing cars. J. Adv. Transp. 2018, 2018, 3614025. [Google Scholar] [CrossRef] [Green Version]
  18. Hmidi, M.E.; Ben Salem, I.; El Amraoui, L. An efficient method for energy management optimization control: Minimizing fuel consumption for hybrid vehicle applications. Trans. Inst. Meas. Control 2020, 42, 69–80. [Google Scholar] [CrossRef]
  19. Islameka, M.; Kusuma, C.F.; Budiman, B.A. Influence of Braking Strategies for Electric Trike Energy Consumption. Int. J. Sustain. Transp. Technol. 2020, 3, 20–25. [Google Scholar] [CrossRef]
  20. Rahman, K.M.; Jurkovic, S.; Stancu, C.; Morgante, J.; Savagian, P.J. Design and performance of electrical propulsion system of extended range electric vehicle (EREV) chevrolet volt. IEEE Trans. Ind. Appl. 2014, 51, 2479–2488. [Google Scholar] [CrossRef]
  21. Guzzella, L.; Sciarretta, A. Vehicle Propulsion Systems; Springer: Berlin/Heidelberg, Germany, 2007; Volume 1. [Google Scholar]
  22. Wong, J.Y. Theory of Ground Vehicles; John Wiley & Sons: Hoboken, NJ, USA, 2008. [Google Scholar]
  23. Chapra, S.C.; Canale, R.P. Numerical Methods for Engineers; McGraw-Hill Higher Education: Boston, MA, USA, 2010. [Google Scholar]
  24. Zhang, Z.; Dong, Y.; Han, Y. Dynamic and control of electric vehicle in regenerative braking for driving safety and energy conservation. J. Vib. Eng. Technol. 2020, 8, 179–197. [Google Scholar] [CrossRef]
  25. Guo, J.; Wang, J.; Cao, B. Regenerative braking strategy for electric vehicles. In Proceedings of the 2009 IEEE Intelligent Vehicles Symposium, Xi’an, China, 3–5 June 2009; pp. 864–868. [Google Scholar]
  26. Miao, Y.; Hynan, P.; von Jouanne, A.; Yokochi, A. Current Li-ion battery technologies in electric vehicles and opportunities for advancements. Energies 2019, 12, 1074. [Google Scholar] [CrossRef] [Green Version]
  27. Perdana, F.A.; Waloyo, H.T.; Wiji, R.; Sebelas Maret University, Jawa Tengah, Indonesia. Unpublished datasheet. 2019.
  28. Battery University. Types of Lithium Ion. Available online: https://batteryuniversity.com/learn/article/types_of_lithium_ion (accessed on 24 August 2020).
Figure 1. Electric trike as a goods delivery vehicle.
Wevj 11 00076 g001
Figure 2. Quasi-static approach model for the simulation.
Wevj 11 00076 g002
Figure 3. Free body diagram of external forces acting on an e-trike.
Wevj 11 00076 g003
Figure 4. Simulink model for the e-trike.
Wevj 11 00076 g004
Figure 5. Regenerative braking subsystem block model.
Wevj 11 00076 g005
Figure 6. Schematic of the braking force distribution of serial and parallel configuration for a rear-wheeled vehicle [19].
Wevj 11 00076 g006
Figure 7. Range extender subsystem block model.
Wevj 11 00076 g007
Figure 8. Battery discharge and charge curve for (a) NCA and (b) LFP [27].
Wevj 11 00076 g008
Figure 9. The route is chosen for (a) the first route and (b) the second route using Google Maps.
Wevj 11 00076 g009
Figure 10. The speed and altitude data acquired from (a) the first route and (b) the second route.
Wevj 11 00076 g010aWevj 11 00076 g010b
Figure 11. SoC vs. distance graph of (a) non-RE LFP and (b) non-RE NCA battery configuration for the complete route.
Wevj 11 00076 g011
Figure 12. Example of a SoC and RE vs. distance graph of a fully-mechanical NCA 36 kg RE configuration.
Wevj 11 00076 g012
Figure 13. The efficiency of non-RE configurations (a) first route and (b) complete route.
Wevj 11 00076 g013
Figure 14. Total energy consumption for the (a) NCA and (b) LFP battery for the first route.
Wevj 11 00076 g014
Figure 15. Total energy consumption comparison of RE cases for the complete route.
Wevj 11 00076 g015
Figure 16. Efficiency comparison of RE usage in (a) NCA and (b) LFP battery configuration for the complete route.
Wevj 11 00076 g016
Figure 17. Efficiency vs. mass of the vehicle with various RE mass in (a) NCA and (b) LFP configuration.
Wevj 11 00076 g017
Table 1. e-Trike specifications.
e-Trike Specifications
NumberDescriptionSymbolValueUnits
1Gross vehicle weight m g r o s s 500kg
2Payload m p a y l o a d 300kg
3Maximum velocity v m a x 40km/h
4Air density ρ 1.275kg/m3
5Aerodynamic drag coefficient C d 0.295-
6Coefficient of friction μ 0.75-
7Auxiliary power P a u x 217.68W
8Gear ratio R 18-
9Gearbox efficiency η g b 96%
10Wheelbase L 1.95m
11Wheel radius r 0.1778m
12Height of center of gravity h 0.8052m
13Distance to center of gravity from the rear axle l 2 0.6189m
Electric Motor Specifications
NumberDescriptionSymbolValueUnits
1Continuous torque T c 17Nm
2Maximum torque T m a x m 25Nm
3Motor power P m a x m 5000W
4Constant torque speed ω c t 1909.859rpm
5Maximum operating speed ω m a x 10,741rpm
6Motor efficiency η m 85%
Table 2. RE specifications.
DescriptionSymbolValue
Power (W) P R E 1600
Fuel-Gasoline
Original Empty Tank Mass (kg)-36.3
Desired Empty Tank Mass (kg)-20
Original Full Tank Mass (kg) m R E i 37.79
Desired Full Tank Mass (kg) m R E d 21.49
Minimum battery SoC (%) S o C m i n 30
Maximum battery SoC (%) S o C m a x 35
Table 3. Battery specifications.
BatteryLFPNCA
TypeLIB-LFP18650-1400 mAhLIB-NCA18650-2500 mAh
q n o m (Ah)1.42.5
u n o m (V)3.23.7
Maximum Voltage (V)3.64.2
Mass of 1 Cell (g)4646
N p a r a l l e l 16 (3 Parallel Packs)27
N s e r i a l 2410 (2 Serial Packs)
U n o m (Ah)67.267.5
Q n o m (V)76.874
Energy (Wh)5160.964995.0
Internal Resistance ( Ω )0.0450.045
Mass of 1 Pack (kg)1211
Total Mass (kg)88.99246.84
Added Mass (kg)42.1520
Table 4. Non-RE cases result in the first route.
Battery TypeNCALFP
Braking StrategyFMSerialParallelFMSerialParallel
Distance Traveled (m)59,721.1759,721.1759,721.1759,721.1759,721.1759,721.17
Final Battery SoC (%)25.1233.8429.9120.8629.2225.40
E (Wh)3740.233304.613501.194084.413652.763850.05
Table 5. Non-RE cases result in the complete route.
Battery TypeNCALFP
Braking StrategyFMSerialParallelFMSerialParallel
Distance Traveled (m)78,763.5680,787.8280,787.8275,333.9080,787.8280,263.06
Final Battery SoC (%)09.053.8604.600
E (Wh)4995.004543.144802.095160.964923.555160.96
Table 6. Results for the 20 kg RE case for the first route.
Battery TypeNCALFP
Braking StrategyFMSerialParallelFMSerialParallel
Final Battery SoC (%)31.6831.7629.9330.0330.2631.11
E (Wh)3412.553408.633499.873610.913599.323555.38
E R E (Wh)438.670.00109.78594.67149.33388.89
Total Time of RE Usage (s)98702471338336875
Total Energy Consumed (Wh)3851.223408.633609.654205.583748.653944.27
Table 7. Results for the 36.3 kg RE case for the first route.
Battery TypeNCALFP
Braking StrategyFMSerialParallelFMSerialParallel
Final Battery SoC (%)33.7630.2130.1530.0030.0132.69
E (Wh)3308.743486.183489.073612.793612.063473.88
E R E (Wh)633.330.00201.33676.00206.22550.67
Total Time of RE Usage (s)1425045315214641239
Total Energy Consumed (Wh)3942.073486.183690.404288.793818.284024.54
Table 8. Results for the 20 kg RE case for the complete route.
Battery TypeNCALFP
Braking StrategyFMSerialParallelFMSerialParallel
Final Battery SoC (%)30.8830.5730.6331.3130.3430.50
E (Wh)3452.763467.973464.853545.083595.053586.65
E R E (Wh)1723.561156.891406.672056.441424.001679.56
Total Time of RE Usage (s)387826033165462732043779
Total Energy Consumed (Wh)5176.324624.864871.515601.535019.055266.20
Table 9. Results for the 36.3 kg RE case for the complete route.
Battery TypeNCALFP
Braking StrategyFMSerialParallelFMSerialParallel
Final Battery SoC (%)34.9830.6130.6032.4130.2730.84
E (Wh)3247.733465.873466.653488.503598.703569.55
E R E (Wh)2054.221260.891513.782225.331517.331800.89
Total Time of RE Usage (s)462228373406500734144052
Total Energy Consumed (Wh)5301.954726.764980.425713.835116.045370.44
Table 10. Most efficient configuration for the first route.
NumberConfigurationEfficiency (km/kWh)SoC Remaining (%)
1NCA Serial non-RE18.0733.84
2NCA Serial RE 20 kg17.5231.76
3NCA Serial RE 36.3 kg17.1330.21
Table 11. Effective and most efficient configuration for the complete route.
NumberConfigurationEfficiency (km/kWh)Comment
1NCA Serial RE 20 kg17.47Slower response time of braking, RE with 20 kg might not be available (ideal mass)
2NCA Serial RE 36.3 kg17.09Slower response time of braking
3NCA Parallel RE 20 kg16.58Quicker response time of braking, RE with 20 kg might not be available (ideal mass)
Publisher’s Note: MDPI stays neutral with regard to jurisdictional claims in published maps and institutional affiliations.

