CRITIC Method and Grey System Theory in the Study of Global Electric Cars


1
Department of Economics-Business Administration, ThanhDong University, Hai Duong 171960, Vietnam
2
Scientific Research-International Cooperation, Thanh Dong University, Hai Duong 171960, Vietnam
*
Author to whom correspondence should be addressed.
World Electr. Veh. J. 2020, 11(4), 79; https://0-doi-org.brum.beds.ac.uk/10.3390/wevj11040079
Submission received: 27 September 2020
/
Revised: 4 December 2020
/
Accepted: 14 December 2020
/
Published: 15 December 2020
Abstract
:Science and technology development is a crucial for the elimination of air pollutants. The electric car industry, for example, contributes to minimizing emissions and climate change. The purpose of this study is to present an overview of electric car sales and its market share in 14 countries, from past to future, by integrating important criteria through the inter-criteria correlation (CRITIC) method in multi-criteria decision-making (MCDM), grey model first-order one variables (GM(1,1)), and grey relation analysis (GRA) method in grey system theory. First, the GM(1,1) estimates future terms based on historical time-series. Second, the objective weights of each variable, in every year, are determined by the CRITIC method. Finally, the research uses the GRA method for computing grades and ranks. The empirical result then reveals the performance and rank of electric car sales during the time period of 2016–2023. The analysis results thus reveal market share picture and direction of growth in the electric car industry.
1. Introduction
Climate change is taking toll on our environment, and scientists around the world are studying a variety of smart devices and machines, to reduce air and environmental pollutions. Electric vehicles, for example, can reduce CO2 emissions and air pollutants [1], as an investigation of electric vehicle charging optimization [2] and plug-in hybrid electric vehicle [3] illustrated the minimization of greenhouse gas emissions. As a result of these benefits, the market share of electric vehicles is expanding in many countries: The market share of battery-electric vehicles extended from 50% in 2012 to 68% in 2018; the market share of plug-in hybrid electric vehicle sales dominated in Finland (76%) and Sweden (61%) in 2019; and electric car sales in Europe saw robust development at 50% in 2019, a growth rate higher than in the previous term (32%) [4]. Observation of electric car sales and related market share is conducted in this study by applying the inter-criteria correlation (CRITIC) method in multi-criteria decision-making (MCDM), grey model first-order one variables (GM(1,1)), and grey relation analysis (GRA) method in a grey theory system.
Electric vehicles run on electricity that is propelled by one or multiple electric motors. These vehicles utilize power from a traction battery pack and have a variety of advantages, such as reduced fuel consumption and emission and recovering energy from regenerative braking [5]. Further, scientists have innovated technology for smart and flexible electric vehicles; this new technology intended to utilize renewable energy and preserve energy resources [6]. These vehicles reduce energy costs [7] and unnecessary emissions from medium and heavy-duty sectors [8]. Electric vehicles can also minimize energy consumption, operation costs, and emissions. Electric cars have various characteristics:
- ▪
- The electric car is propelled by electric motors and uses energy stored in rechargeable batteries. The energy is drawn from electric-cells and converted to power, using electric motors.
- ▪
- The battery-electric car utilizes electricity stored in a battery pack, to power an electric motor and turn the wheels. Components of a battery-electric car include the electric motor, inverter, battery, control module, and drive train. The operation process does not produce tailpipe pollution. Thus, it is considered a renewable energy source.
- ▪
- The plug-in hybrid electric car is powered by conventional fuel, alternative fuel, and a rechargeable battery pack. Components of a plug-in hybrid electric car include the electric motor, engine, inverter, battery, fuel tank, control module, and battery charge.
In general, electric cars optimize operation costs and emissions. Considering these characteristics, electric vehicles are trending, and the electric car industry has seen robust growth all over the world. Development of consumer and market segmentation of each country, from past to future, was conducted and analyzed by the criteria importance through inter-criteria correlation (CRITIC method) and GRA method approaches.
The CRITIC method in multi-criteria decision-making (MCDM) calculates the weights of the criteria [9]. Previous studies have used many applications of the CRITIC method, e.g., a study of Spanish savings banks, which were transformed into private capital banks in the future [10]; the index weight of the soft power of 17 cities in Shangdong Province was employed via the CRITIC method [11]; a calculation of weights of the financial ratios of 14 large-scale conglomerates, from 2009 to 2011, was conducted by the CRITIC method [12]; the attribute weights of electric vehicle charging stations were computed by the algorithms of the CRITIC method [13]. Thus, the CRITIC method is a useful tool for determining objective weights which support to calculating the grade and determining the position of each unit via the GRA method.
Deng (1982) introduced the grey theory to deal with small samples and poor information [14]. The theory uses system analysis, data processing, modeling, prediction, decision-making, control, and optimization techniques [15]. It also analyzes the original data and searches for intrinsic regularities [16]. The grey method includes five fields, i.e., grey generating, grey relational analysis, grey forecasting, grey decision-making, and grey control [16], whereas, grey forecasting is not the same as other statistical regression models [17]. Other models require data for establishing a prediction model, while grey forecasting utilizes variations within the system, to explore the relations between sequential data, and then conducts the forecasting value.
Many universities offer courses in grey theory, e.g., Nanjing University of Aeronautics and Astronautics, Huazhong University of Science and Technology, Fuzhou University, De Monfort University, Bucharest University of Economics, Kanagawa University, and so on [17]. In addition, researchers typically apply grey system theory to various sectors. For instance, an evaluation of the intranet quality pointed out the important quality attributes via analysis and modeling of the grey system [18]. Estimated values of third-party logistics providers were computed by GM(1,1) [19]. Further, application of the grey relational theory is used in marine economics [20], as well as in the analysis of socioeconomics systems [21]. Finally, the grey system theory explored the future and position of the medical tourism industry [22].
Here, we study the grey theory system in the electric car industry. Notably, grey forecasting helps to clarify situations [17] that other model theories cannot. In this research, we exhibited the latest pictures of the electric car, battery-electric car, plug-in hybrid electric car, and market share; grey forecasting is the best tool through which to compute these future data. In addition, the estimated values were also checked for accuracy levels by the mean absolute percentage error. Therefore, the aim of this research was to use GM(1,1) in grey theory for predicting future terms; then, integration of the CRITIC method in MCDM and GRA in grey theory was used to calculate grades and rankings of electric car sales in 14 countries, from past to future. The analysis results present the status quo of the electric car segment in 14 countries. The research recommends a foreseen trend of electric car market share for electric automobile manufacturers.
This paper comprises four sections. Section 1 gives a general overview of electric vehicles, the CRITC method, and the grey system theory. Section 2 sets up equations of CRITIC, GM(1,1), and GRA, and then it proposes variables of the objective research. Section 3 computes the empirical results of electric car sales in 14 countries. Section 4 discusses the main finding. Section 5 reviews important points and recommends future research.
2. Materials and Methods
2.1. Research Framework
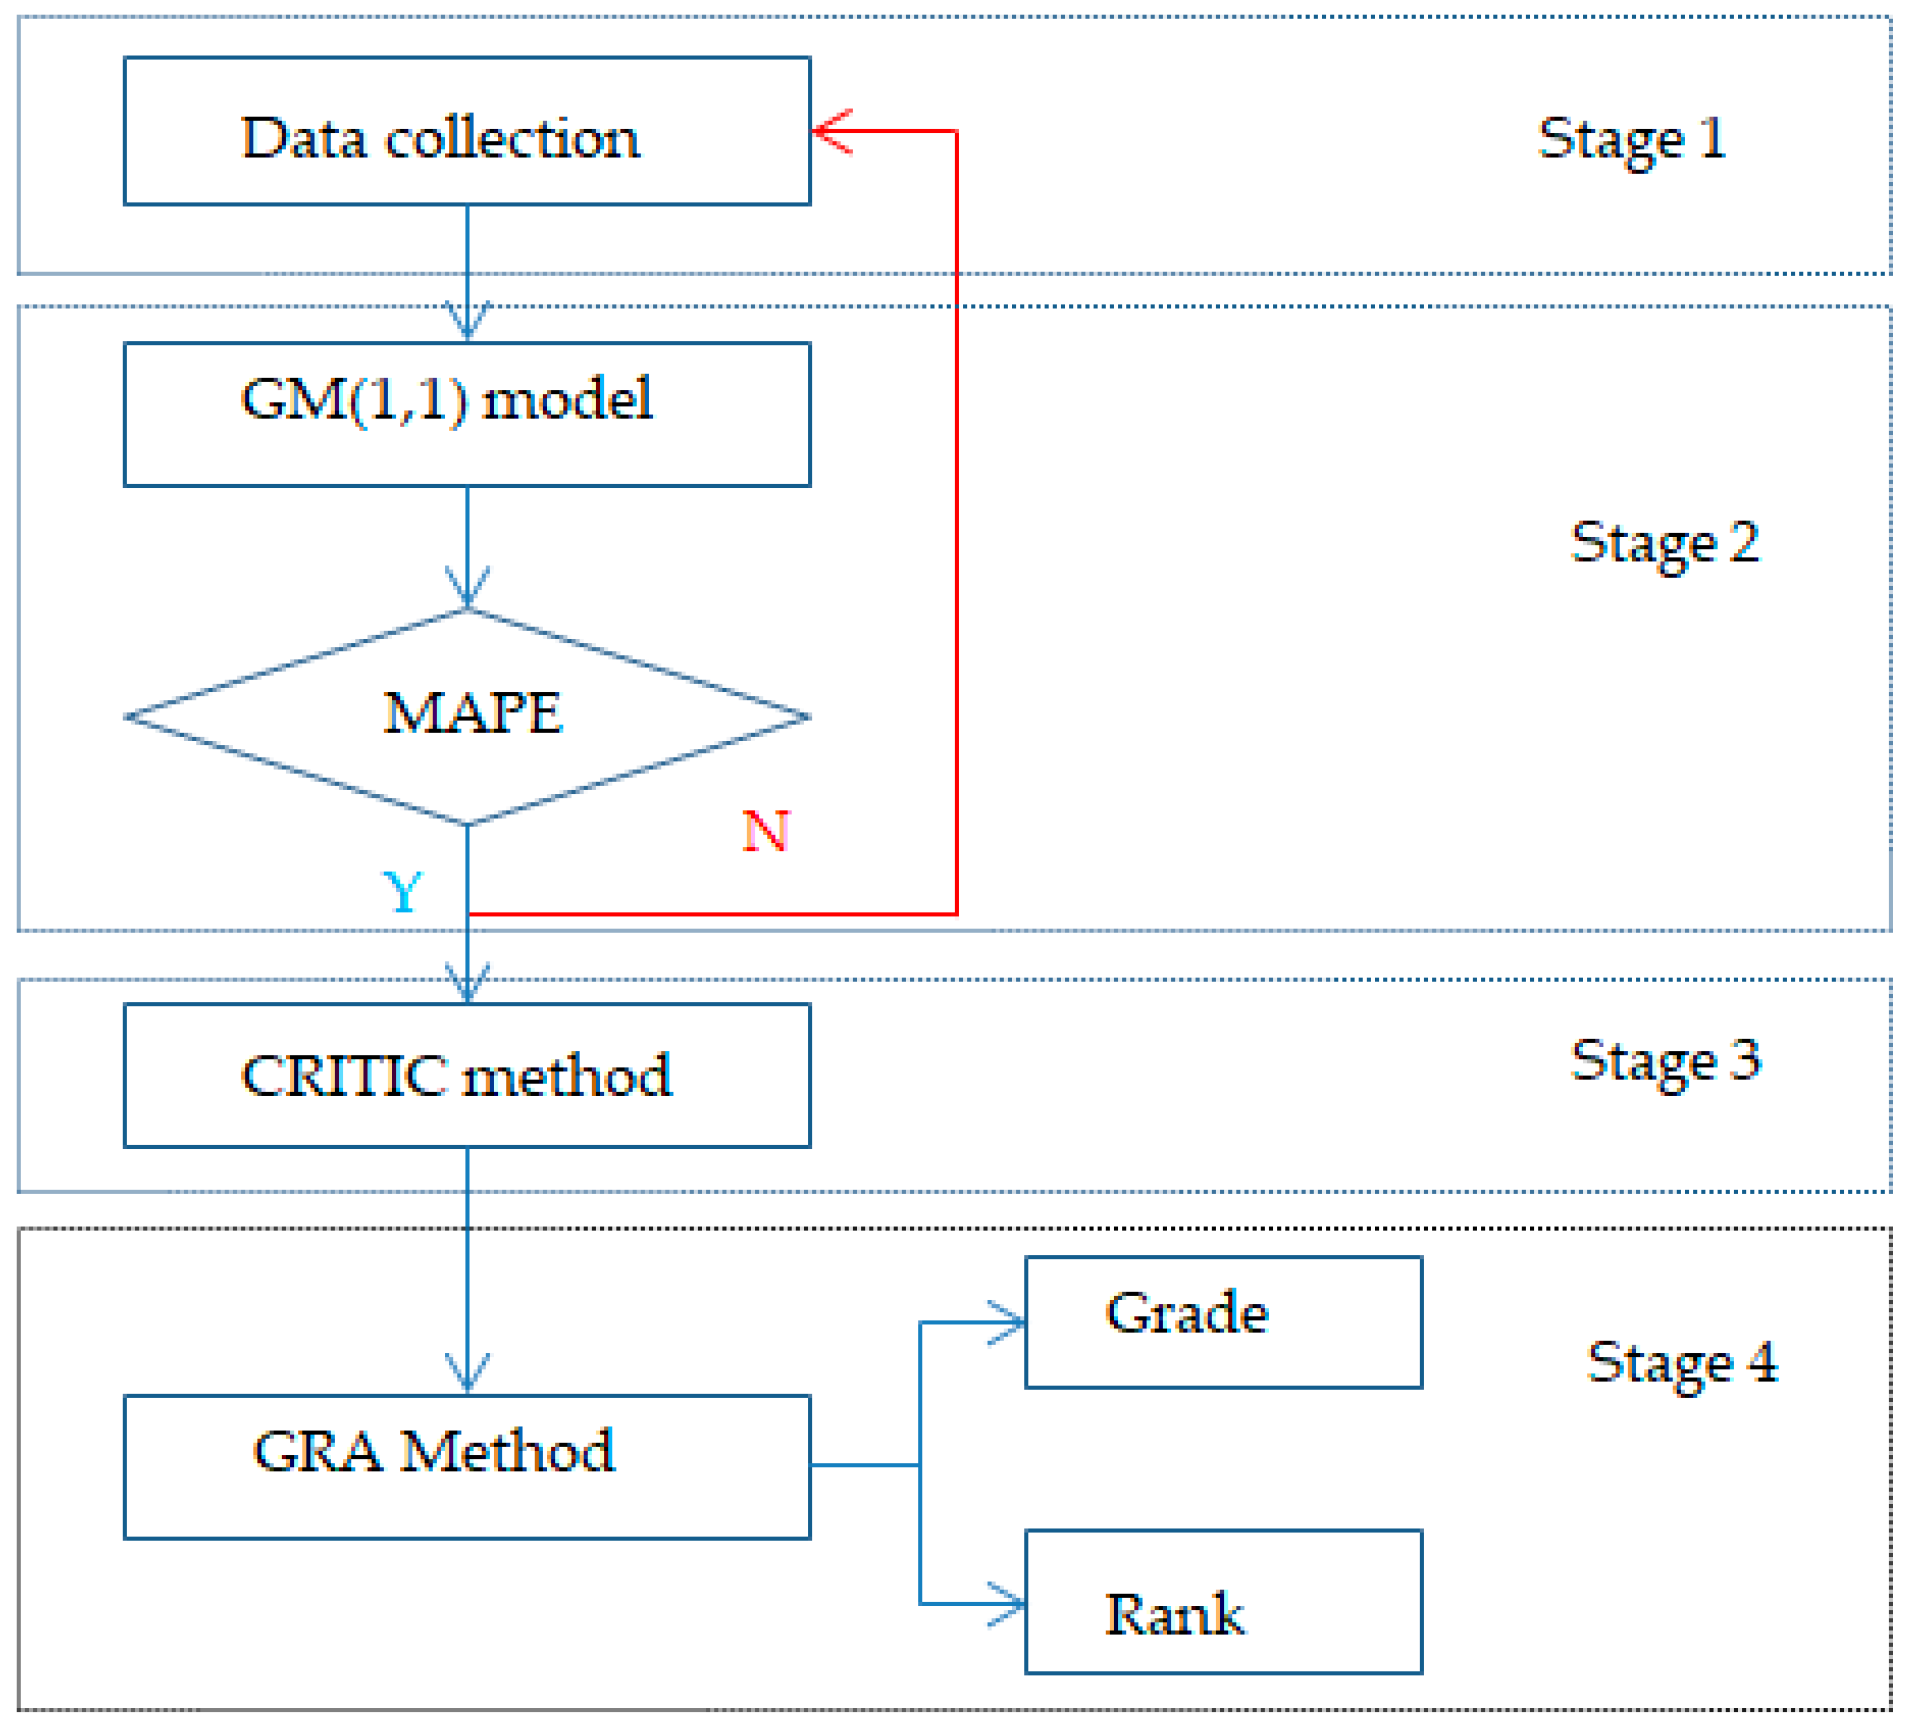
The electric car research process is arranged as follows: data collection, GM(1,1) model, checking the accuracy by mean absolute error percentage (MAPE) indicator, escalating the objective weights via the CRITIC method, and conducting grades and ranks via GRA method, as shown in Figure 1.
Stage 1. Based on the research target of electric car sales in 14 countries, we collected their raw data with historical time-series for four consecutive years. Data were posted on the IEA [4].
Stage 2. With the function of dealing with the short time-series, the GM(1,1) was chosen to forecast future terms. All estimated values must be tested to ensure accuracy levels via the mean absolute error percentage (MAPE). If the MAPE index is unsuitable, the raw data must return and reselect or use another model. If the MAPE index achieves the requirement, the predicted values will be utilized to count the grades and ranks of electric cars in the future.
Stage 3. Objective weights to each variable in every year were calculated by the CRITIC method. These values are used to conduct the grade and position in the next step.
Stage 4. The GRA method in the grey theory system is applied to calculate the score and determine the ranking of each country.
2.2. Data Collection
The study reviewed statistics of new electric car sales and market share of electric cars, in 14 countries, during the time period of 2016–2019. The research chose 14 countries, as shown in Table 1, and their four variables, i.e., new electric car sales (ECS), new battery-electric car sales (BECS), new plug-in hybrid electric car sales (PHECS), and market share of sales (MSS). ECS, BECS, and PHCES express the total sales of electric cars, battery cars, and plug-in hybrid electric cars, respectively, which are measure by thousands of vehicles; MSS is the market share of ECS, BECS, and PHCES and is measured by percentage (%). These data were posted on IEA [4].
All data were collected as shown in Table 2, Table 3, Table 4 and Table 5, and then these values were applied to predict the future, from 2020 to 2023, by the GM(1,1). Next, the actual and forecasted values were used for computing the grades and ranks of 14 countries, every year, based on the CRITIC and GRA methods.
2.3. Critic Method
In this research, the authors used the critic method in MCDM to determine objective weights of the relative importance of four variables, namely ECS, BECS, PHCES, and MSS. The method was performed by the analytical investigation of the evaluation matrix for extracting information in the evaluation criteria [23]. The basic characteristic of the CRITIC is the intensity of the constant [9]. The objective weights calculation is built as follows:
Step 1. Let represent alternatives, represent evaluation criteria, and represent a given system of evaluation criteria.
Step 2. Define a membership function for every criterion of the multi-criteria problem.
Step 3. Convert the initial matrix into a matrix of a relative score.
A measured valuation of the criterion to the decision-making process shows the standard deviation.
Step 4. Construct a measure of the conflict.
Step 5. Calculate the amount of information in the relation, based on the multiplicative aggregation.
Step 6. Compute the result of objective weights.
As a result, the objective weights of every variable (ECS, BECS, PHCES, and MSS) in every year are determined when executing the above steps. The objective weighs are accepted when they rank from 0 to 1 [23]. These values are used in the GRA method; furthermore, the unappreciated objective weights must also be removed and rechecked.
2.4. Grey System Theory
Deng (1982) [14] introduced the grey theory system, which presents forecasting data based on the historical time-series and grey relation analysis (GRA), based on the available dataset at the same time. Grey system theory includes main components such as system analysis, decision-making, etc., which are applied in the service industry [24], economics [25], textile and apparel industry [26], etc. Here, we examine predictions and evaluations in the electric car industry. Grey prediction produces quantitative forecasts on the basis of the GM model. Grey cluster evaluation comprises grey variable weight and cluster evaluation. First, the research uses grey forecasting to predict future data, based on the historical time-series. Second, the study combines all actual and estimated data and then utilizes grey relation analysis, to compute the grades of every nation in the electric car industry.
2.4.1. The GM(1,1)
The authors set up the historical time-series of ECS, BECS, PHCES, and MSS . Then the sequence is calculated by the following:
The sequence ( is generated from by adjacent neighbor means, and its equation is given as follows:
The equation of the a value and b value is counted as follows:
The matrix of a sequence of parameters is expressed as follows:
The least-squares estimate of the sequence of GM(1,1) needs to satisfy the following:
The whitening equation is calculated by the following:
Let the predicted valuation be , and the estimated value is computed by the following:
All predicted values must be checked the accuracy level by mean absolute error percentage (MAPE), as follows:
The MAPE indicator has four classifications [27], namely excellent classification (smaller than 10%), good classification (from 10% to 20%), reasonable classification (from 20% to 50%), and poor classification (higher than 50%). If the forecasted values of four variables (ECS, BECS, PHECS, and MSS) in 14 countries are not suitable with the MAPE condition, they are removed.
2.4.2. Grey Relational Analysis
After having all actual and forecasted values of four variables (ECS, BECS, PHECS, and MSS) in 14 countries, these values are applied to compute the grade and position via the GRA method, as follows:
Let a value of the GRA be generated, and the GRA method is performed as follows.
Upper effect measurement:
Lower effect measurement:
The deviation sequence, , is given by the following.
Moderate effect measurement:
where is called the distinguishing coefficient; this value normally equals 0.5.
The grey relational grade is computed as follows:
Depend on the grey relational grade,, and the rank of each unit in every term is ordered.
The grade and rank of the electric vehicle sale in 14 countries, from past to future, are determined by the GRA method.
3. Results
3.1. Estimated Values
The research uses the data collected in Section 2.3 to forecast the number of electric vehicle car sales and its market shares in 14 countries. The forecasted values are exhibited after using the previous series variables for calculation. We apply the equations of the GM(1,1) in Section 2.4.1; the ECS variable of Australia (AU) is used for illustration.
The historical time-series from 2016 to 2019 is determined as follows:
The sequence of is counted by:
The sequence of is generated from .
The matrix is transposed accordingly.
The least-squares of the sequence is defined by the following:
The predicted value is conducted as follows:
Instead of values of h, the forecasted values of ECS are computed as shown below:
h = 1, —result for year 2016. h = 5, —result for year 2020.
h = 2, —result for year 2017. h = 6, —result for year 2021.
h = 3, —result for year 2018. h = 7, —result for year 2022.
h = 4, —result for year 2019. h = 8, —result for year 2023.
We calculated all forecasted values of four variables (ECS, BECS, PHECS, and MSS) in 14 countries. The predicted results in 14 countries during the time period of 2016–2023 are counted, as shown in Table 6, Table 7, Table 8 and Table 9.
However, all predicted values need to check accuracy levels via the MAPE indicator, as shown in Equation (14), to remove unsuitable values.
3.2. Objective Weights
From the equations in Section 2.1, the objective weights of ECS, BECS, PHECS, and MSS every year are produced, as shown in Table 11.
3.3. Performance and Position
With the actual and forecasted data, the study reviewed the efficiency and rank of each country. First, the critical method was used for estimating the weights of ECS, BECS, PHECS, and MSS.
Observing the grades of each country, in every term, as shown in Table 12, the grade of sales and market shares for the electric car industry of 14 countries shows upward and downward trends in every term. China (CN) has the best grade, from past to future, with 0.904 to 0.961. The US showed a good grade in two previous continual terms as 0.731 in 2016 and 0.715 in 2017. Other terms of US and other countries, excluding the Netherlands (NL) in 2016 and 2019–2013 and NO, have average grades, with minimum and maximum values of 0.502 and 0.678, respectively. Grades in other terms of NL are from 0.365 to 0.499. Norway (NO) is the worst country, as it has the lowest grades, from 0.335 to 0.43, in the whole term. Consequently, the amount of electric car sales, battery car sales, plug-in hybrid sales, and market share of sales of CN shows good results; others countries are at an average level. NL in 2016 and 2019–2013 and NO are at the worst level.
Observing the grades of each country, in every term, as shown in Table 12, we note that the grade of sales and market shares for the electric car industry of 14 countries show upward and downward trends in every term. CN has the best grade, from past to future, with 0.904 to 0.961. The US showed a good grade in two previous continual terms, i.e., 0.731 in 2016 and 0.715 in 2017. Other terms of US and other countries, excluding NL in 2016 and 2019–2013 and NO, have average grades with minimum and maximum values as 0.502 and 0.678, respectively. Grades in other terms of NL are from 0.365 to 0.499. NO is the worst country, which has the lowest grades from 0.335 to 0.43 in the whole term. Consequently, the amount of electric car sales, battery car sales, plug-in hybrid sales, and market share of sales of CN shows good results; others countries are at an average level; NL in 2016 and 2019–2013 and NO are at the worst level.
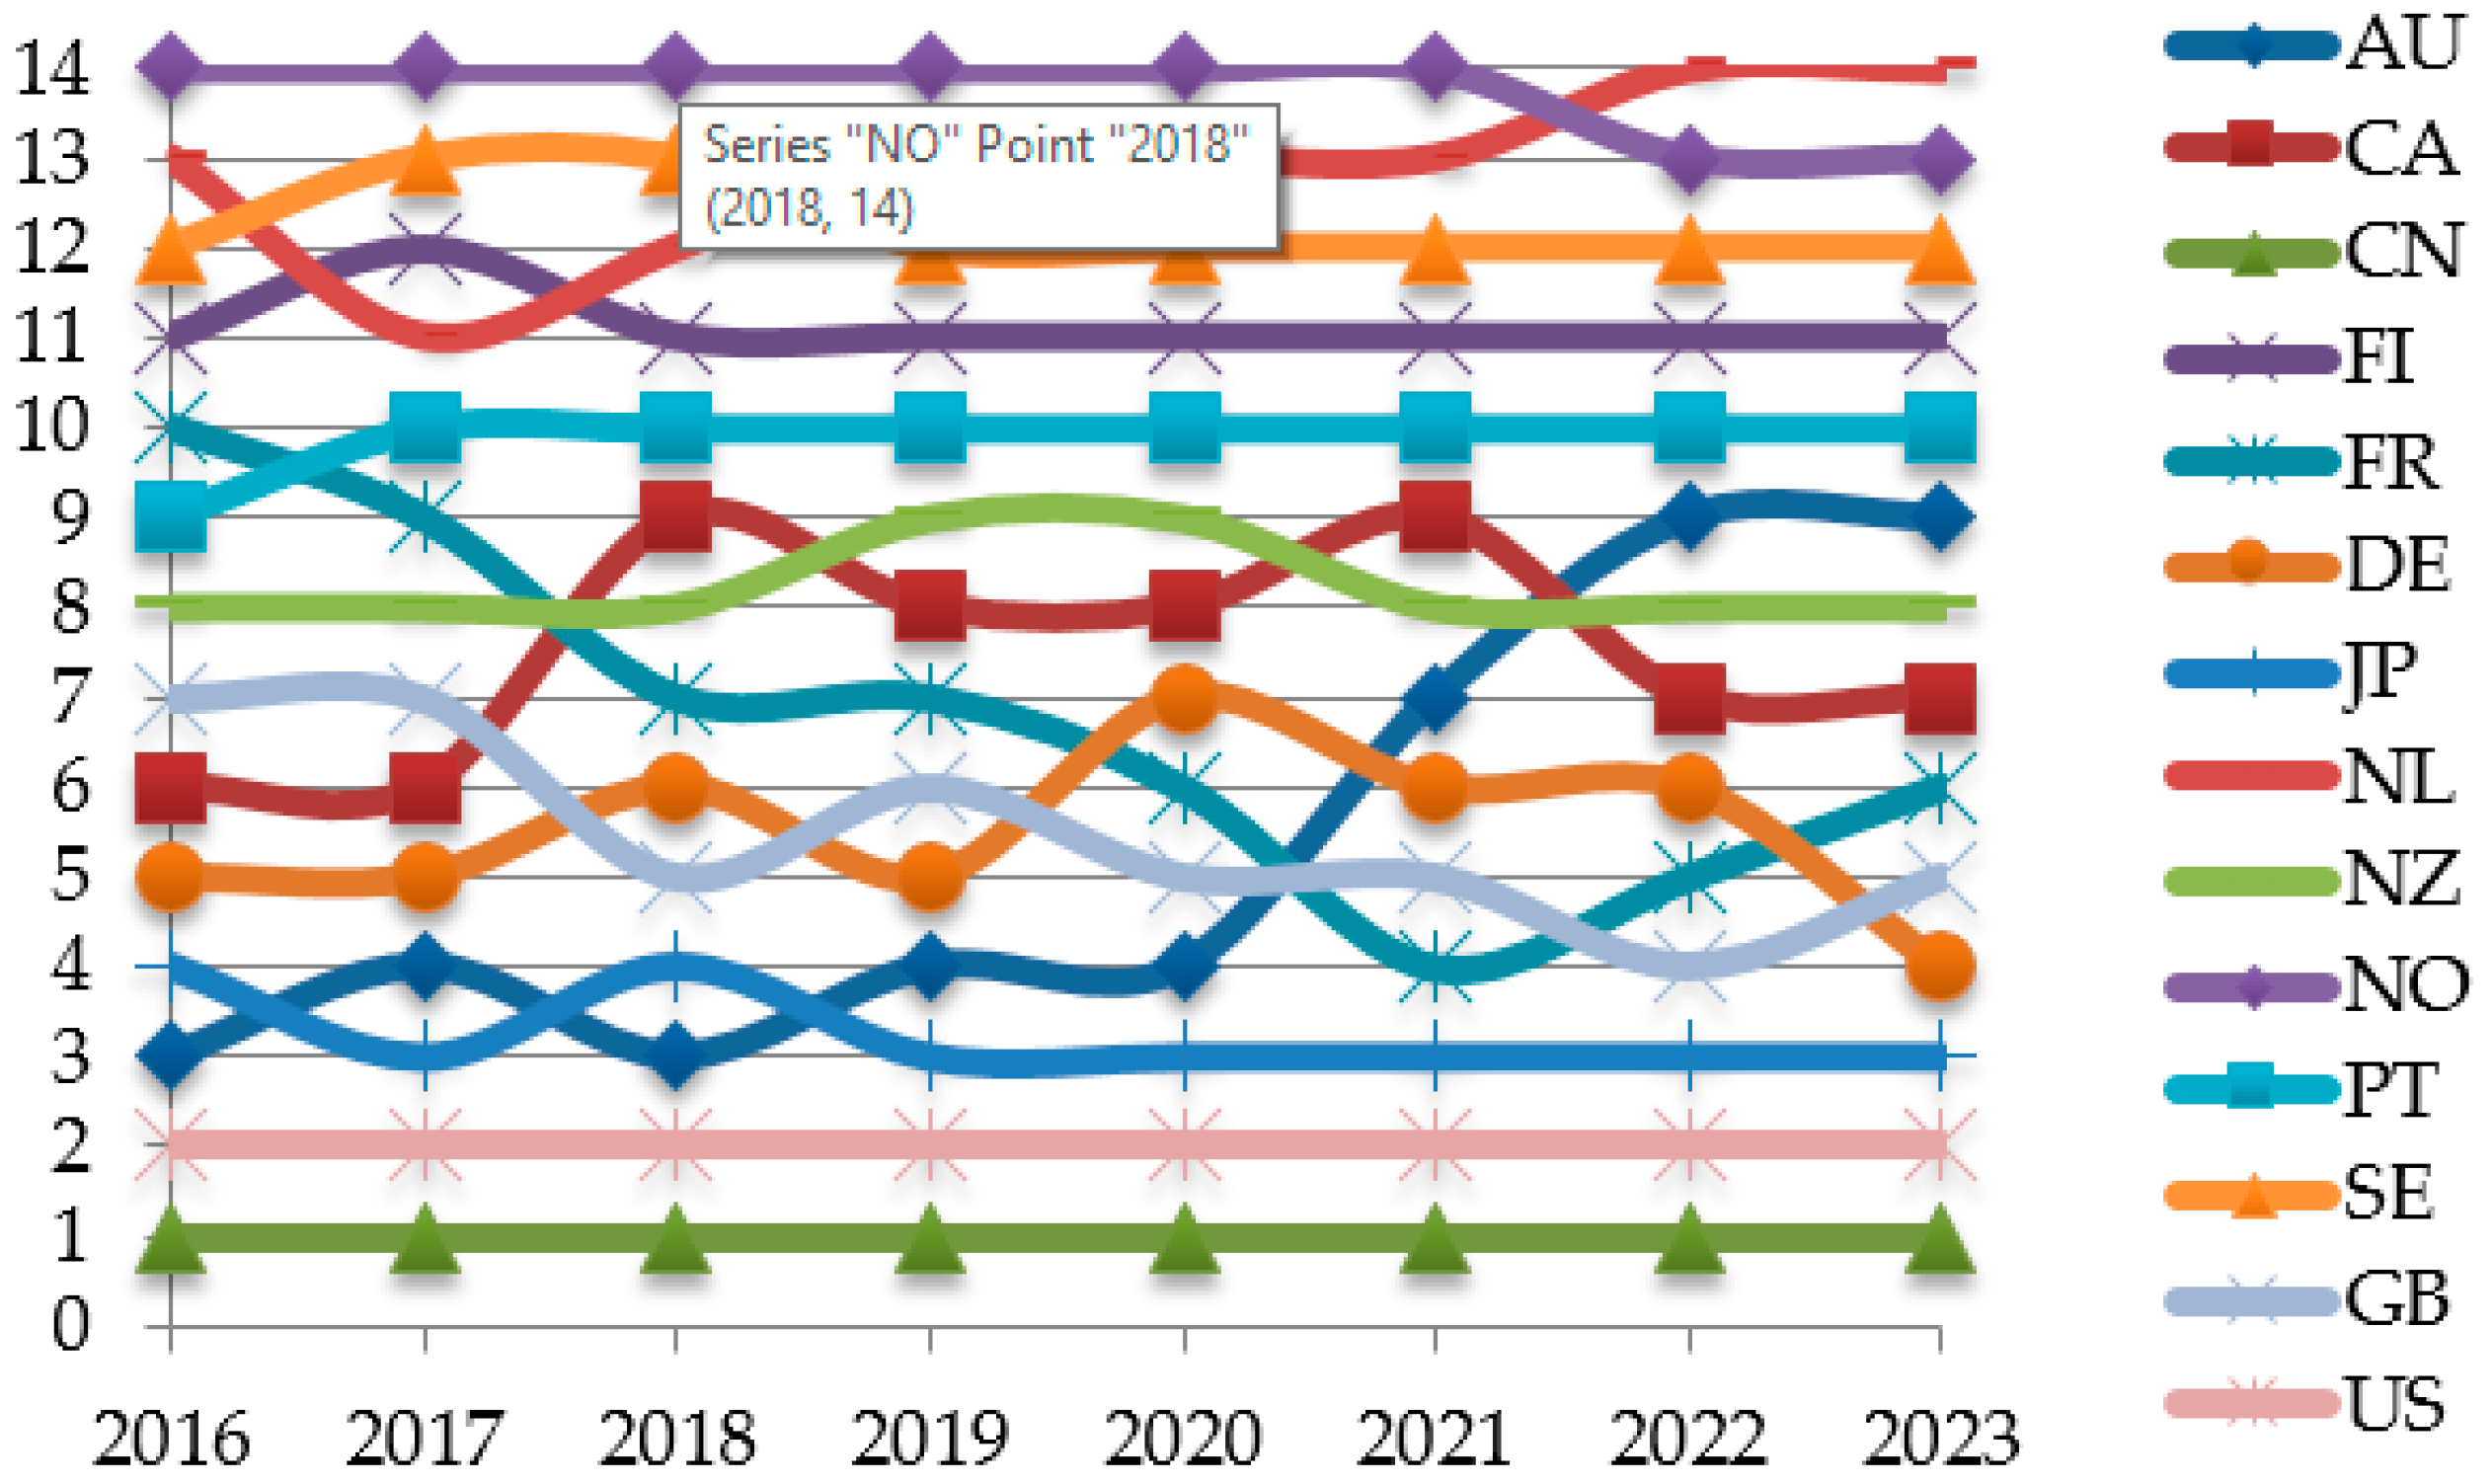
From the grade shown in Table 12, the position of each country in every term is determined as shown in Figure 2.
Figure 1 shows the ranks of electric car sales for each country during the time period of 2016–2023. CN always holds the first rank from past to future. The US ranks second position in the whole term. Positions of remaining countries change every year, from third to fourteenth. JP shows an effort when the car sale indicator is at the fourth position in 2016 and 2018; other terms of JP always range in the third position. Although Finland (FI) stands at the final rank, it is forecasted at the ninth position in the future term of 2022–2023. The positions of AU, Canada (CA), France (FR), Germany (DE), NL, and United Kingdom (GB) show a continual variation; they only keep a fixed position in two continual terms, and then they are either up or down.
Integrating CRITIC and GRA methods defines the rank of electric car sales for 24 countries during the time period of 2016–2023, based on historical and forecasted values. The final empirical result points out the grades and positions of each nation.
4. Discussion
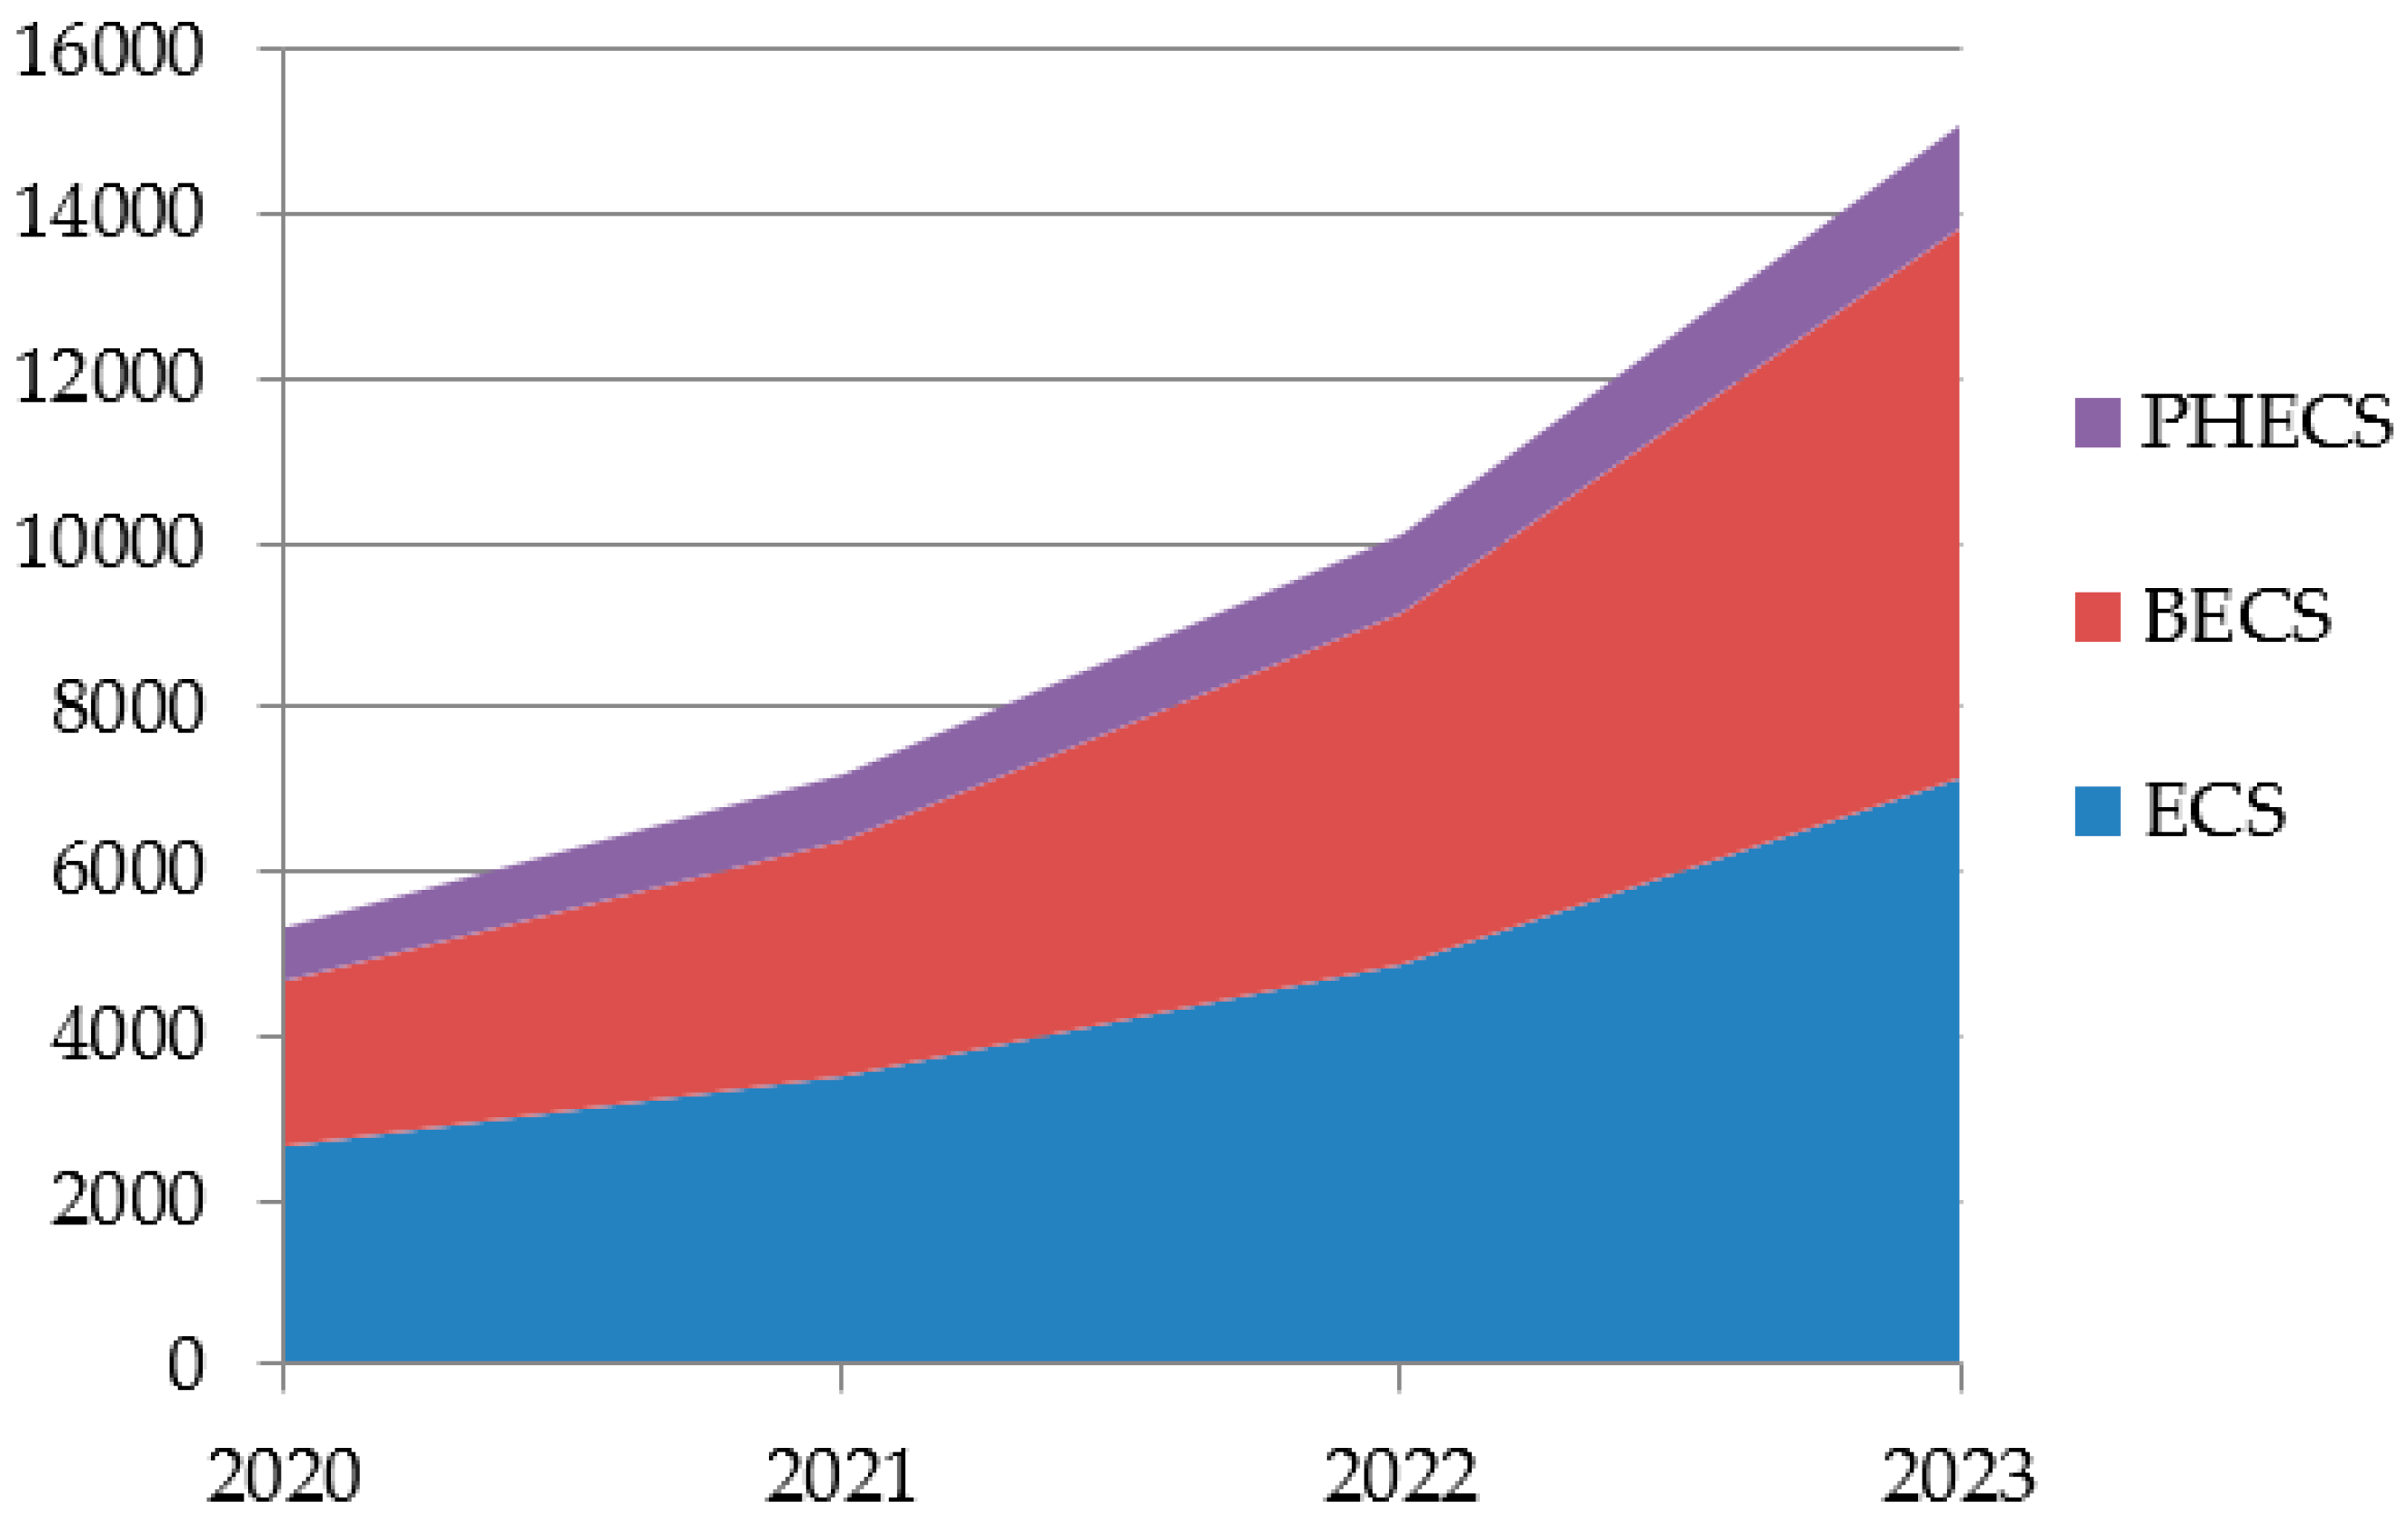
The electric car industry is a revolution of power minimization [28], as it utilizes electric energy sources instead of gasoline. According to Helmers and Marx, electric vehicles can reduce CO2 equivalent emissions by 80% [29]. Therefore, total sales and market shares of the electric car industry are expanding and increasing all over the world. The market share of electric cars in 2005 increased in four countries, i.e., France, Germany, United Kingdom, and United States; however, in recent years, the shares have extended all over the world. According to Smith, the electric car market is expected to reach $1.5 trillion by the year 2025 [30]. The study carries on a prediction of four related electric car sale elements by GM(1,1). The forecasted values denote total ECS, BECS, and PHECS, as shown in Figure 3, and the percentage of MSS shows an upward trend. Particularly, PHECS will reach the highest development with total sales.
Analysis results via the GRA method reveal that the electric car industry is increasing. It is recognized as a sustainable condition for the economic growth contributions and pollutant optimization as well. The main findings reveal that total electric car sales in China is increasing; thus, China always ranks first in total sales and market shares in the electric car industry. Several countries, such as FI, NO, Portugal (PT), and Sweden (SE), are often at the bottom position; thus, they should advertise the useful functions of electric cars and promote product strategies, to inspire drivers to invest in electric car.
The quick development of the electric car industry contributes to not only the economy but also in reducing pollutants. Increasing the total use of the electric car is necessary and has important meaning, while the industrialization and modernization process is being optimized for quick growth. To create a fresh life environment, each person, organization, and enterprise should reduce the manufacture of gasoline vehicles and replace them with electric vehicles. Generally, electric vehicles create important valuable economics and environments; therefore, governments should introduce policies to promote the production of electric vehicles.
5. Conclusions
An investigation of the electric car in 14 countries was employed by combining the CRITIC method and grey system theory. Estimated values of variables, including ECS, BECS, PHECS, and MSS, of each country, during the time period of 2020–2023, are realized via GM(1,1). CN is expected to increase total sales of electric cars, battery-electric cars, and plug-in hybrid electric cars over the next four years; further, the number of ECS, BECS, and PHECS is expected to increase to 2956.46, 2285.18, and 669.79, respectively.
Next, analysis results exhibit the grade and position of the electric car industry when integrating CRITIC and GRA methods. The result of the GRA method indicates that CN maintains high performance to remain the top country for total electric car sales over the whole term. NO is the worst country, as its total sales are always at the lowest level; this country should promote marketing strategies to upgrade its electric car industry.
Moreover, analysis results reveal the potential development of the electric car industry in the future term when actual and future data express an expanded and increased continual trend for previous and future terms. Furthermore, manufacturers can foresee these trends, which will provide economic advantages.
The GM(1,1) can compute forecasting values based on historical data that only require short-term, current, and limited data [31]. Other models, such as Holt–Winters, must have a long-term to calculate predicted values. However, the GM(1,1) only tests the accuracy of the forecast result through the MAPE index. The Holt–Winters can give full tested parameters, such as root-mean-square error, mean absolute percentage error, and mean absolute error, so that the forecasting value can be checked for accuracy.
As a result of the available data limitation of variables, the study only forecasted and analyzed electric car sales and their market shares. Future research can add more factors, such as revenue, labor, emission, etc., for a deeper analysis of the development and effectiveness of the electric car industry. Moreover, the number of countries in a study can be expanded, for a greater comparison.
Author Contributions
T.K.L.N. designed the research framework, set up the methods, analyzed data, and wrote the paper; H.N.L. collected the data; V.H.N. created the visualization; B.A.H. reviewed and edited the paper. All authors have read and agreed to the published version of the manuscript.
Funding
This research was funded by Thanh Dong University.
Conflicts of Interest
The authors declare no conflict of interest.
References
- Adila, A.J.; Ping, J. Synergy and co-benefits of reducing CO2 and air pollutant emissions by promoting electric vehicles—A case of Shanghai. Energy Sustain. Dev. 2020, 55, 181–189. [Google Scholar] [CrossRef]
- Tu, R.; Gai, Y.J.; Farooq, B.; Posen, I.D.; Hatzopoulou, M. Electric vehicle charging optimization to minimize marginal greenhouse gas emissions from power generation. Appl. Energy 2020, 277, 1–10. [Google Scholar] [CrossRef]
- Krupa, J.S.; Rizzo, D.M.; Eppstein, M.J.; Lanute, D.B.; Gaalema, D.E.; Lakkaraju, K.; Warrender, C.E. Analysis of a consumer survey on plug-in hybrid electric vehicles. Trans. Res. Part A Policy. Pr. 2014, 64, 14–31. [Google Scholar] [CrossRef]
- IEA. Global EV Outlook 2020. Available online: iea.org (accessed on 4 August 2020).
- Mahmoudi, C.; Flah, A.; Sbita, L. An overview of electric Vehicle concept and power management strategies. In Proceedings of the 2014 International Conference on Electrical Sciences and Technologies in Maghreb (CISTEM), Tunis, Tunisia, 3–6 November 2014; pp. 1–8. [Google Scholar] [CrossRef]
- Wolf, S.; Korzynietz, R. Innovation Needs for the Integration of Electric Vehicles into the Energy System. World Electr. Veh. J. 2019, 10, 76. [Google Scholar] [CrossRef] [Green Version]
- Deschênes, A.; Gaudreault, J.; Rioux-Paradis, K.; Redmont, C. Predicting Electric Vehicle Consumption: A Hybrid Physical-Empirical Model. World Electr. Veh. J. 2019, 11, 2. [Google Scholar] [CrossRef] [Green Version]
- Forrest, K.; Mac Kinnon, M.; Tarroja, B.; Samuelsen, S. Estimating the technical feasibility of fuel cell and battery electric vehicles for the medium and heavy duty sectors in California. Appl. Energy 2020, 276, 1–13. [Google Scholar] [CrossRef]
- Tus, A.; Adali, E.A. The new combination with CRITIC and WASPAS methods for the time and attendance software selection problem. OPSEARCH 2019, 56, 528–538. [Google Scholar] [CrossRef]
- Bellver, J.A.; Royo, R.E.C.; Garcia, F. Spanish Savings Banks and their Future Transformation into Private Capital Banks. Eur. J. Econ. Finance Admin. Sci. 2011, 35, 156–164. [Google Scholar]
- Guo, C.Y.; Wang, Y.F.; Jiang, W.H. An Empirical Study of Evaluation Index System and Measure Method on City’s Soft Power: 17 Cities in Shandong Province. Cross Cult. Commun. 2013, 9, 27–31. [Google Scholar] [CrossRef]
- Kazan, H.; Özdemir, O. Financial Performance Assessment of Large Scale Conglomerates Via Topsis and Critic Methods. Int. J. Manag. Sustain. 2014, 3, 203–224. [Google Scholar]
- Wei, G.W.; Lei, F.; Lin, R.; Wang, R.; Wei, Y.; Wu, J.; Wei, C. Algorithms for probabilistic uncertain linguistic multiple attribute group decision making based on the GRA and CRITIC method: Application to location planning of electric vehicle charging stations. Economic Res. Ekon. Istraz. 2020, 33, 828–846. [Google Scholar] [CrossRef] [Green Version]
- Deng, J.L. Control problem of Grey system. Syst. Control. Lett. 1982, 1, 288–294. [Google Scholar] [CrossRef]
- Deng, J.L. Introduction to Grey system theory. J. Grey Syst. 1989, 1, 1–24. [Google Scholar]
- Liu, S.F.; Lin, Y. A brief introduction to grey systems theory. Grey Syst. Theory Appl. 2012, 2, 89–104. [Google Scholar] [CrossRef]
- Liu, S.F.; Lin, Y. Understanding Complex Systems; Springer: Berlin/Heidelberg, Germany, 2010. [Google Scholar] [CrossRef]
- Slavek, N.; Krmpotic, D.; Blažević, D. Grey System Theory Approach to Quality of Intranet. Int. J. Adv. Res. Electr. Electron. Instrum. Eng. 2015, 4, 8223–8230. [Google Scholar] [CrossRef]
- Wang, C.N.; Day, J.D.; Nguyen, T.K.L. Applying EBM Model and Grey Forecasting to Assess Efficiency of Third-Party Logistics Providers. J. Adv. Trans. 2018, 2018, 1–14. [Google Scholar] [CrossRef]
- Xuemei, L.; Cao, Y.; Wang, J.; Dang, Y.; Kedong, Y. A summary of grey forecasting and relational models and its applications in marine economics and management. Mar. Econ. Manag. 2019, 2, 87–113. [Google Scholar] [CrossRef]
- Javanmardi, E.; Liu, S.F. Exploring Grey Systems Theory-Based Methods and Applications in Analyzing Socio-Economic Systems. Sustainability 2019, 11, 4192. [Google Scholar] [CrossRef] [Green Version]
- Dang, H.S.; Nguyen, T.M.T.; Wang, C.N.; Day, J.D.; Dang, T.M.H. Grey System Theory in the Study of Medical Tourism Industry and Its Economic Impact. Int. J. Environ. Res. Public Health. 2020, 17, 961. [Google Scholar] [CrossRef] [Green Version]
- Diakoulaki, D.; Mavrotas, G.; Papayannakis, L. Determining objective weights in multiple criteria problems: The CRITIC method. Comput. Oper. Res. 1995, 22, 763–770. [Google Scholar] [CrossRef]
- Xue, J.; Gelder, P.H.A.J.M.; Reniers, G.; Papadimitriou, E.; Wu, C. Multi-attribute decision making method for prioritizing maritime traffic safety influencing factors of autonomous ships’ maneuvering decisions using grey and fuzzy theories. Saf. Sci. 2019, 120, 323–340. [Google Scholar] [CrossRef]
- Huang, C.Y.; Lu, C.Y.; Chen, C.I. Application of grey theory to the field of economic forecasting. J. Glob. Econ. 2014, 3, 1–3. [Google Scholar] [CrossRef] [Green Version]
- Wang, C.N.; Nguyen, H.K.; Liao, R.Y. Partner Selection in Supply Chain of Vietnam’s Textile and Apparel Industry: The Application of a Hybrid DEA and GM (1,1) Approach. Math. Probl. Eng. 2017, 2017, 7826840. [Google Scholar] [CrossRef] [Green Version]
- Lewis, C.D. Industrial and Business Forecasting Methods: A Practical Guide to Exponential Smoothing and Curve Fitting; Butterworth Scientific: Boston, MA, USA, 1982; pp. 1–143. [Google Scholar]
- Helmers, E.; Marx, P. Electric cars: Technical characteristics and environmental impacts. Environ. Sci. Eur. 2012, 24, 1–15. [Google Scholar] [CrossRef] [Green Version]
- Smith, A. Electric Car Innovation: How Electric Vehicles are Changing the World. Available online: plugandplay.com (accessed on 9 September 2020).
- Huang, Y.P.; Huang, C.C. The integration and application of fuzzy and grey modeling methods. Fuzzy Sets Syst. 1996, 78, 107–119. [Google Scholar] [CrossRef]
- Chiou, H.-K.; Tzeng, G.-H.; Cheng, C.-K. Grey Prediction GM (1,1) Model for Forecasting Demand of Planned Spare Parts in Navy of Taiwan. MCDM 2004, 2004, 6–11. [Google Scholar]
Figure 1.
Research framework.

Figure 2.
Position of countries from past to future.

Figure 3.
Forecasted electric car sale (thousand in millions).


Table 1.
List of countries in electric car industry.
| Country | Code | Country | Code |
|---|---|---|---|
| Australia | AU | Netherlands | NL |
| Canada | CA | New Zealand | NZ |
| China | CN | Norway | NO |
| Finland | FI | Portugal | PT |
| France | FR | Sweden | SE |
| Germany | DE | United Kingdom | GB |
| Japan | JP | United State | US |
Source: IEA [4].
Table 2.
Actual values of electric car sales (ECS).
| Country | 2016 | 2017 | 2018 | 2019 |
|---|---|---|---|---|
| AU | 1.37 | 2.28 | 3.61 | 9.16 |
| CA | 11.58 | 16.68 | 44.15 | 50.96 |
| CN | 336.00 | 579.00 | 1081.09 | 1060.30 |
| FI | 1.43 | 3.06 | 5.71 | 7.88 |
| FR | 29.51 | 37.60 | 46.70 | 61.35 |
| DE | 24.61 | 54.56 | 67.50 | 108.63 |
| JP | 24.69 | 54.10 | 49.75 | 38.90 |
| NL | 22.67 | 10.32 | 27.97 | 67.52 |
| NZ | 1.50 | 3.47 | 5.54 | 6.88 |
| NO | 44.89 | 62.31 | 72.69 | 79.64 |
| PT | 1.84 | 4.39 | 8.34 | 12.68 |
| SE | 13.42 | 20.35 | 28.96 | 40.70 |
| GB | 37.91 | 47.25 | 50.36 | 75.14 |
| US | 159.62 | 198.35 | 361.32 | 326.64 |
Table 3.
Actual values of battery-electric car sales (BECS).
| Country | 2016 | 2017 | 2018 | 2019 |
|---|---|---|---|---|
| AU | 0.67 | 1.21 | 1.80 | 6.28 |
| CA | 5.22 | 8.71 | 22.66 | 32.40 |
| CN | 257.00 | 468.00 | 815.87 | 834.20 |
| FI | 0.22 | 0.50 | 0.78 | 1.90 |
| FR | 21.76 | 25.98 | 31.06 | 42.80 |
| DE | 11.32 | 25.07 | 36.06 | 63.28 |
| JP | 15.30 | 18.10 | 26.53 | 21.30 |
| NL | 4.05 | 9.19 | 24.43 | 62.00 |
| NZ | 1.16 | 2.94 | 4.36 | 5.28 |
| NO | 24.22 | 33.08 | 46.14 | 60.35 |
| PT | 0.81 | 1.89 | 4.43 | 6.88 |
| SE | 2.95 | 4.36 | 7.15 | 15.80 |
| GB | 10.51 | 13.55 | 15.74 | 38.51 |
| US | 86.73 | 104.49 | 238.82 | 241.91 |
Table 4.
Actual values of plug-in hybrid electric car sales (PHECS).
| Country | 2016 | 2017 | 2018 | 2019 |
|---|---|---|---|---|
| AU | 0.70 | 1.08 | 1.80 | 2.88 |
| CA | 6.36 | 7.97 | 21.49 | 18.56 |
| CN | 79.00 | 111.00 | 265.22 | 226.11 |
| FI | 1.21 | 2.55 | 4.93 | 5.98 |
| FR | 7.75 | 11.61 | 15.65 | 18.55 |
| DE | 13.29 | 29.50 | 31.44 | 45.35 |
| JP | 9.39 | 36.00 | 23.22 | 17.60 |
| NL | 18.62 | 1.13 | 3.54 | 5.52 |
| NZ | 0.34 | 0.54 | 1.19 | 1.60 |
| NO | 20.67 | 29.23 | 26.55 | 19.30 |
| PT | 1.03 | 2.50 | 3.91 | 5.80 |
| SE | 10.46 | 15.99 | 21.81 | 24.91 |
| GB | 27.40 | 33.70 | 34.62 | 36.63 |
| US | 72.89 | 93.86 | 122.49 | 84.73 |
Source: IEA [4].
Table 5.
Actual values of market share of sales (MSS).
| Country | 2016 | 2017 | 2018 | 2019 |
|---|---|---|---|---|
| AU | 0.10 | 0.13 | 0.27 | 0.77 |
| CA | 0.47 | 0.67 | 1.73 | 2.00 |
| CN | 0.90 | 1.53 | 3.03 | 3.30 |
| FI | 0.80 | 1.67 | 3.13 | 4.60 |
| FR | 0.97 | 1.17 | 1.47 | 1.83 |
| DE | 0.47 | 1.07 | 1.33 | 2.03 |
| JP | 0.40 | 0.80 | 0.73 | 0.60 |
| NL | 3.97 | 1.67 | 4.2 | 10.07 |
| NZ | 0.40 | 0.80 | 1.43 | 1.90 |
| NO | 17.77 | 22.4 | 32.73 | 37.3 |
| PT | 0.53 | 1.27 | 2.43 | 3.80 |
| SE | 2.27 | 3.47 | 4.67 | 7.60 |
| GB | 0.93 | 1.20 | 1.27 | 1.90 |
| US | 0.63 | 0.87 | 1.53 | 1.37 |
Source: IEA [4].
Table 6.
The forecasted values of ECS.
| Country | 2016 | 2017 | 2018 | 2019 | 2020 | 2021 | 2022 | 2023 |
|---|---|---|---|---|---|---|---|---|
| AU | 1.37 | 1.57 | 3.35 | 7.15 | 15.27 | 32.6 | 69.62 | 148.65 |
| CA | 11.58 | 23.37 | 35.35 | 53.45 | 80.83 | 122.23 | 184.84 | 279.52 |
| CN | 336 | 699.11 | 889.03 | 1130.55 | 1437.67 | 1828.23 | 2324.89 | 2956.46 |
| FI | 1.43 | 3.38 | 5.15 | 7.85 | 11.97 | 18.25 | 27.82 | 42.4 |
| FR | 29.51 | 36.83 | 47.2 | 60.48 | 77.51 | 99.33 | 127.3 | 163.14 |
| DE | 24.61 | 49.48 | 71.63 | 103.7 | 150.14 | 217.37 | 314.7 | 455.61 |
| JP | 24.69 | 55.09 | 47.14 | 40.34 | 34.52 | 29.54 | 25.28 | 21.63 |
| NL | 22.67 | 10.26 | 24 | 56.14 | 131.35 | 307.31 | 719 | 1682.22 |
| NZ | 1.5 | 3.72 | 5.09 | 6.95 | 9.49 | 12.97 | 17.72 | 24.2 |
| NO | 44.89 | 63.07 | 71.11 | 80.18 | 90.4 | 101.93 | 114.92 | 129.57 |
| PT | 1.84 | 4.71 | 7.64 | 12.39 | 20.09 | 32.58 | 52.83 | 85.67 |
| SE | 13.42 | 20.2 | 28.42 | 40 | 56.3 | 79.24 | 111.53 | 156.97 |
| GB | 37.91 | 43.09 | 55.7 | 72.01 | 93.09 | 120.34 | 155.57 | 201.11 |
| US | 159.62 | 240.28 | 291.76 | 354.26 | 430.16 | 522.31 | 634.2 | 770.07 |
Table 7.
The forecasted values of BECS.
| Country | 2016 | 2017 | 2018 | 2019 | 2020 | 2021 | 2022 | 2023 |
|---|---|---|---|---|---|---|---|---|
| AU | 0.67 | 0.46 | 1.2 | 3.11 | 8.08 | 21 | 54.56 | 141.75 |
| CA | 5.22 | 11.36 | 19.23 | 32.55 | 55.08 | 93.22 | 157.76 | 266.98 |
| CN | 257 | 544.54 | 691.59 | 878.34 | 1115.52 | 1416.74 | 1799.31 | 2285.18 |
| FI | 0.22 | 0.36 | 0.74 | 1.53 | 3.17 | 6.55 | 13.56 | 28.04 |
| FR | 21.76 | 24.85 | 32.23 | 41.8 | 54.2 | 70.29 | 91.15 | 118.21 |
| DE | 11.32 | 22.59 | 36.62 | 59.37 | 96.24 | 156.03 | 252.95 | 410.08 |
| JP | 15.3 | 20.55 | 21.94 | 23.44 | 25.03 | 26.73 | 28.55 | 30.49 |
| NL | 4.05 | 8.58 | 20.64 | 49.66 | 119.45 | 287.34 | 691.17 | 1662.56 |
| NZ | 1.16 | 3.1 | 4.07 | 5.33 | 7 | 9.19 | 12.06 | 15.82 |
| NO | 24.22 | 33.44 | 44.78 | 59.98 | 80.34 | 107.6 | 144.11 | 193.02 |
| PT | 0.81 | 2.24 | 3.89 | 6.75 | 11.7 | 20.29 | 35.17 | 60.99 |
| SE | 2.95 | 3.49 | 6.87 | 13.52 | 26.6 | 52.33 | 102.96 | 202.57 |
| GB | 10.51 | 9.1 | 17.04 | 31.94 | 59.84 | 112.13 | 210.1 | 393.67 |
| US | 86.73 | 138.36 | 189.2 | 258.72 | 353.77 | 483.75 | 661.49 | 904.53 |
Table 8.
The forecasted values of PHECS.
| Country | 2016 | 2017 | 2018 | 2019 | 2020 | 2021 | 2022 | 2023 |
|---|---|---|---|---|---|---|---|---|
| AU | 0.7 | 1.07 | 1.72 | 2.77 | 4.45 | 7.16 | 11.51 | 18.51 |
| CA | 6.36 | 11.88 | 15.7 | 20.74 | 27.4 | 36.2 | 47.82 | 63.18 |
| CN | 79 | 154.72 | 197.52 | 252.16 | 321.92 | 410.97 | 524.65 | 669.79 |
| FI | 1.21 | 2.98 | 4.27 | 6.12 | 8.77 | 12.57 | 18.02 | 25.82 |
| FR | 7.75 | 11.95 | 14.95 | 18.69 | 23.37 | 29.23 | 36.54 | 45.7 |
| DE | 13.29 | 27.23 | 34.47 | 43.63 | 55.24 | 69.93 | 88.52 | 112.06 |
| JP | 9.39 | 35.23 | 24.28 | 16.73 | 11.53 | 7.94 | 5.47 | 3.77 |
| NL | 18.62 | 1.62 | 2.99 | 5.51 | 10.16 | 18.73 | 34.53 | 63.68 |
| NZ | 0.34 | 0.65 | 1.03 | 1.61 | 2.54 | 3.99 | 6.27 | 9.86 |
| NO | 20.67 | 29.9 | 24.68 | 20.37 | 16.82 | 13.88 | 11.46 | 9.46 |
| PT | 1.03 | 2.51 | 3.77 | 5.66 | 8.51 | 12.8 | 19.25 | 28.94 |
| SE | 10.46 | 16.67 | 20.53 | 25.28 | 31.12 | 38.32 | 47.18 | 58.09 |
| GB | 27.4 | 33.52 | 34.96 | 36.46 | 38.03 | 39.66 | 41.37 | 43.14 |
| US | 72.89 | 104.49 | 100.3 | 96.29 | 92.43 | 88.73 | 85.18 | 81.77 |
Table 9.
The forecasted values of MSS.
| Country | 2016 | 2017 | 2018 | 2019 | 2020 | 2021 | 2022 | 2023 |
|---|---|---|---|---|---|---|---|---|
| AU | 0.1 | 0.09 | 0.22 | 0.54 | 1.32 | 3.27 | 8.07 | 19.91 |
| CA | 0.47 | 0.92 | 1.39 | 2.09 | 3.15 | 4.74 | 7.14 | 10.75 |
| CN | 0.9 | 1.86 | 2.53 | 3.45 | 4.71 | 6.42 | 8.76 | 11.94 |
| FI | 0.8 | 1.81 | 2.86 | 4.53 | 7.17 | 11.35 | 17.96 | 28.44 |
| FR | 0.97 | 1.17 | 1.46 | 1.82 | 2.27 | 2.84 | 3.54 | 4.42 |
| DE | 0.47 | 0.99 | 1.39 | 1.96 | 2.74 | 3.85 | 5.4 | 7.58 |
| JP | 0.4 | 0.81 | 0.7 | 0.61 | 0.53 | 0.46 | 0.4 | 0.35 |
| NL | 3.97 | 1.58 | 3.63 | 8.33 | 19.15 | 44.01 | 101.14 | 232.42 |
| NZ | 0.4 | 0.88 | 1.29 | 1.9 | 2.8 | 4.13 | 6.08 | 8.95 |
| NO | 17.77 | 23.86 | 30.13 | 38.05 | 48.05 | 60.68 | 76.63 | 96.76 |
| PT | 0.53 | 1.35 | 2.23 | 3.69 | 6.1 | 10.07 | 16.65 | 27.51 |
| SE | 2.27 | 3.19 | 4.81 | 7.25 | 10.94 | 16.49 | 24.86 | 37.47 |
| GB | 0.93 | 1.09 | 1.41 | 1.82 | 2.35 | 3.03 | 3.91 | 5.05 |
| US | 0.63 | 1.04 | 1.24 | 1.49 | 1.78 | 2.12 | 2.54 | 3.03 |
Table 10.
Mean absolute percentage.
| Country | MAPE | Country | MAPE |
|---|---|---|---|
| AU | 25.778 | NL | 9.212 |
| CA | 13.877 | NZ | 3.705 |
| CN | 10.252 | NO | 1.087 |
| FI | 9.169 | PT | 6.355 |
| FR | 1.873 | SE | 5.318 |
| DE | 4.701 | GB | 10.226 |
| JP | 6.451 | US | 13.624 |
MAPE, mean absolute error percentage.
Table 11.
Objective weights.
| Years | 2016 | 2017 | 2018 | 2019 | 2020 | 2021 | 2022 | 2023 | |
|---|---|---|---|---|---|---|---|---|---|
| Objective weights | ECS | 0.17 | 0.17 | 0.17 | 0.17 | 0.17 | 0.15 | 0.15 | 0.16 |
| BECS | 0.18 | 0.18 | 0.17 | 0.17 | 0.16 | 0.15 | 0.15 | 0.17 | |
| PHECS | 0.21 | 0.22 | 0.18 | 0.17 | 0.17 | 0.17 | 0.19 | 0.24 | |
| MSS | 0.44 | 0.43 | 0.48 | 0.49 | 0.50 | 0.52 | 0.51 | 0.43 | |
Table 12.
Grade of electric vehicle sale.
| Country | 2016 | 2017 | 2018 | 2019 | 2020 | 2021 | 2022 | 2023 |
|---|---|---|---|---|---|---|---|---|
| AU | 0.617 | 0.620 | 0.653 | 0.656 | 0.651 | 0.633 | 0.608 | 0.563 |
| CA | 0.604 | 0.605 | 0.619 | 0.631 | 0.624 | 0.619 | 0.622 | 0.598 |
| CN | 0.933 | 0.952 | 0.930 | 0.937 | 0.925 | 0.904 | 0.927 | 0.961 |
| FI | 0.585 | 0.569 | 0.582 | 0.573 | 0.558 | 0.539 | 0.543 | 0.538 |
| FR | 0.588 | 0.593 | 0.626 | 0.636 | 0.639 | 0.644 | 0.649 | 0.612 |
| DE | 0.611 | 0.608 | 0.633 | 0.640 | 0.638 | 0.639 | 0.644 | 0.618 |
| JP | 0.612 | 0.621 | 0.647 | 0.665 | 0.669 | 0.678 | 0.674 | 0.620 |
| NL | 0.497 | 0.569 | 0.562 | 0.499 | 0.455 | 0.384 | 0.365 | 0.424 |
| NZ | 0.602 | 0.596 | 0.622 | 0.628 | 0.623 | 0.620 | 0.622 | 0.591 |
| NO | 0.345 | 0.356 | 0.342 | 0.342 | 0.340 | 0.335 | 0.371 | 0.430 |
| PT | 0.597 | 0.581 | 0.598 | 0.588 | 0.573 | 0.552 | 0.551 | 0.542 |
| SE | 0.537 | 0.530 | 0.555 | 0.531 | 0.520 | 0.502 | 0.513 | 0.525 |
| GB | 0.603 | 0.605 | 0.633 | 0.638 | 0.640 | 0.644 | 0.649 | 0.616 |
| US | 0.731 | 0.715 | 0.675 | 0.687 | 0.683 | 0.685 | 0.687 | 0.648 |
Publisher’s Note: MDPI stays neutral with regard to jurisdictional claims in published maps and institutional affiliations. |
© 2020 by the authors. Licensee MDPI, Basel, Switzerland. This article is an open access article distributed under the terms and conditions of the Creative Commons Attribution (CC BY) license (http://creativecommons.org/licenses/by/4.0/).
Share and Cite
MDPI and ACS Style
Nguyen, T.K.L.; Le, H.N.; Ngo, V.H.; Hoang, B.A. CRITIC Method and Grey System Theory in the Study of Global Electric Cars. World Electr. Veh. J. 2020, 11, 79. https://0-doi-org.brum.beds.ac.uk/10.3390/wevj11040079
AMA Style
Nguyen TKL, Le HN, Ngo VH, Hoang BA. CRITIC Method and Grey System Theory in the Study of Global Electric Cars. World Electric Vehicle Journal. 2020; 11(4):79. https://0-doi-org.brum.beds.ac.uk/10.3390/wevj11040079
Chicago/Turabian StyleNguyen, Thi Kim Lien, Hoang Nga Le, Van Hai Ngo, and Bang An Hoang. 2020. "CRITIC Method and Grey System Theory in the Study of Global Electric Cars" World Electric Vehicle Journal 11, no. 4: 79. https://0-doi-org.brum.beds.ac.uk/10.3390/wevj11040079