
An Approach to Reliability, Availability and Maintainability Analysis of a Plug-In Electric Vehicle


Department of Electrical Engineering, Assam Engineering College, Guwahati, Assam 781013, India
*
Author to whom correspondence should be addressed.
World Electr. Veh. J. 2021, 12(1), 34; https://0-doi-org.brum.beds.ac.uk/10.3390/wevj12010034
Submission received: 27 December 2020
/
Revised: 15 January 2021
/
Accepted: 21 January 2021
/
Published: 1 March 2021
(This article belongs to the Special Issue Electric Vehicles—Solution toward Zero Emission from the Transport Sector)
Abstract
:Electric vehicle technologies have seen rapid development in recent years. However, Reliability, Availability, and Maintainability (RAM) related concerns still have restricted large-scale commercial utilization of these vehicles. This paper presents an approach to carry out a quantitative RAM analysis of a plug-in electric vehicle. A mathematical model is developed in the Markov Framework incorporating the reliability characteristics of all significant electrical components of the vehicle system, namely battery, motor, drive, controllers, charging unit, and energy management unit. The study shows that the vehicle’s survivability can be increased by improving its components’ restoration rates. The paper also investigates the role of a charging station on the availability of the vehicle. It illustrates how the grid power supply’s reliability influences the operational effectiveness of a plug-in electric vehicle. The concepts that are presented in the article can support further study on the reliability design and maintenance of a plug-in electric vehicle.
1. Introduction
The Electric Vehicle (EV) is one of the significant technological advancements in the modern transport sector. It finds growing global importance because of its pollution-free and low-cost operation [1,2]. The conventional transport sector contributes the highest share of greenhouse gas (GHG) emissions [3]. The petroleum fuel-run vehicles emit hydrocarbons, oxides of nitrogen and sulphur, carbon monoxide, volatile organic compounds (VOC), and other particulate matters. These emissions are the major climate forcers and harmful to living bodies [4]. Many countries have placed stringent policies and regulations to reduce such emissions and consider electric vehicles to be alternatives to conventional transport options [5,6,7,8]. Although the electric vehicle’s journey begins with a hybrid model concept, after the remarkable evolutions in battery technologies, the policymakers and manufacturers have diverted their attention towards making pure electric vehicles [6,9]. A plug-in electric vehicle (PEV) falls under this category. It is powered by a rechargeable battery bank and it has no secondary source of propulsion [10].
While purchasing a vehicle, people are mostly concerned about the vehicle’s reliability, safety, cost, and maintainability. PEVs are designed with a large number of electrical components and systems (e.g., battery, motor-drive, controllers, energy management systems, etc.) [10]. These systems are highly failure-prone. Therefore, such vehicles offer less reliability than mechanically driven IC engine-based vehicle systems. To achieve a higher reliability, the vehicle system must be designed with reliable components. Among all the parts, the battery’s reliability is the most sensitive to the reliability of a PEV [11]. The vehicle’s protective schemes must also fulfill the minimum reliability criteria to ensure safety to the personnel. Although a highly reliable vehicle system demands a higher price, it reduces the frequency of maintenance and lowers the servicing cost [12].
The operation of a PEV is also affected by the reliability of a charging station. For a reliable charging station, the reliability of the power supply is a dominant factor. In many countries, load shedding is a major issue [13]. Because of frequent load shedding, charging stations offer less charging hours to a discharged PEV. As a result, the operational effectiveness or availability of a PEV decreases considerably.
A thorough investigation of the reliability, availability, and maintainability (RAM) of the vehicle system can help manufacturers to identify the failure-prone zones in the design and to estimate their contributions to the overall system failure. It encourages searching for more reliable alternatives. RAM analysis ascertains the critical performance metrics, such as Survivability, Mean Time to Failure, Mean Down Time, and Frequency of Failure [14]. Apart from these, RAM analysis is also essential from the customer’s point of view. A large investment is associated while purchasing a PEV, and such investments deserve dedicated research in order to ensure that the most critical reliability criteria are satisfied. The components’ reliability information can help to follow proper maintenance strategies [15] and improve the vehicle’s health.
In the existing literature, reliability-oriented researches for a PEV system are found to be very limited. However, some notable research works deal with evaluating the reliability of some vital components of a PEV system. For example, Shu et al. evaluated the electric motors’ reliability using the fault-tree method [16]. They proposed an integrated motor-drive reliability model. Xia et al. developed a reliability model for Li-ion batteries used in EVs [17]. This model integrated the degradation model and multiphysics model. They cited various relevant research works in [11,17]. Sakhdari et al. proposed an energy management strategy for EVs in [18]. Dynamic Programming method was applied in order to optimize the distribution of energy and improve the health of the battery. Bolvashenkov et al. proposed a model for predictive reliability assessment of electric drive trains [19]. They illustrated various factors that can affect the reliability of a drive train. Ammaiyappan et al. illustrated a simulation model focusing on the reliability of lead-acid battery, controller, and brushless dc motor required for EV operation [20]. Khalilzadeh et al. developed a reliability model of a DC-DC converter system used in the Plug-in hybrid EV in [21]. They applied the Markov concepts to determine the useful lifetime of the bidirectional converter. The latest research works were centered on discussing the reliability issues that are faced by power distribution networks due to electric vehicle charging [22,23,24]. Many researchers are currently working on the Grid-to-Vehicle (G2V) and Vehicle-to-Grid (V2G) concepts [25,26,27]. However, no significant research work has been noticed addressing the RAM of the overall PEV system. This motivates the research of this article. The existing literature also has not yet discussed how the availability of a PEV depends on the grid power supply and the charging system’s reliability. This study aspires to fill these knowledge gaps by examining the RAM issues of a PEV system from all probable aspects. The upshot of this research can complement the current knowledge in PEV’s reliability design and maintenance. The main objectives of the study are:
- To develop a mathematical model for reliability, availability, and maintainability analysis of a PEV system. The model incorporates the reliability characteristics of all the critical components of the vehicle system.
- To examine how the fault events are logically related to each other, how the reliability of the PEV depends on these fault events, and how the vehicle’s availability gets improved with proper maintenance strategies.
- To investigate the role of a charging station on the availability of a PEV. For this, a reliability model is developed for a grid-connected charging station. A modified probabilistic index is proposed for evaluating the reliability of the power supply. With this index’s help, the study illustrates how the power supply’s reliability influences the operational effectiveness of a PEV.
The remaining sections are organized, as follows:
Section 2 explains the methodology. Section 3 shows a typical configuration of a PEV system. Section 4 presents the reliability models of the vehicle system. Section 5 proposes a model for a charging station to demonstrate its role in the availability of a PEV. Section 6 illustrates the case studies and results. Section 7 outlines the conclusion.
2. Methodology
The life cycle of a component encounters three types of failure rates or hazard rates in three stages of life. It experiences a decreasing failure rate during early life, constant failure rate during a useful life, and increasing failure rate during the wear out period. The probability that a failure may not occur in a specified time interval is called ’reliability’ [12]. Poor design and incorrect manufacturing techniques are the main reasons for low reliability. Poor maintenance policies and human errors due to a lack of understanding of the system and process, carelessness, forgetfulness, poor judgmental skills, etc. also contribute to a system’s unreliability [12,15]. Despite the designer’s best effort, a system cannot be 100% reliable. The system is likely to fail during its operation. It might be costly in terms of money and time, or sometimes dangerous in terms of safety. Therefore, maintenance becomes an essential consideration in the long-term performance of a system [15]. The system demands preventive maintenance to keep away from any possible failures. The term ‘Maintainability’ refers to the probability that a failed system is restored to the operable condition in a specified time [12,28]. It characterizes the system’s adaptability to the detection and the elimination of failures and their prevention. ’Availability’ is another measure of the effectiveness of a maintained system. It integrates both reliability and maintainability parameters, and it depends on the number of failures that occur and how quickly any faults are rectified [12,15,28]. The long-term or steady-state availability is the proportion of time during which the system is available for use [12].
Most of the analytical techniques only consider the failure characteristics in reliability studies and assume that the repair process is instantaneous or negligible [28]. It is an inherent limitation and thus requires additional methods if this assumption is not valid. Markov framework alleviates this limitation. It can incorporate the stochastic behaviors of both the failure and repair process [28]. Therefore, this framework has been regarded as a useful tool by many researchers for reliability modeling of engineering systems [29,30,31,32]. The basic concepts of Markov modeling can be explained by a single component repairable system. The state-space diagram of this system is shown in Figure 1.
As demonstrated in Figure 1, the system has two states: UP (Operable) and DOWN (Failed). The parameter and are the state transition rates. They denote the rates at which the component transits from one state to another. In other words, the transition rate is the ratio of the number of times that a transition occurs from a given state to the time spent in that state [28]. Based on this definition, the failure rate () and repair rate can be defined as:
The reciprocals of failure rate and repair rate are called Mean Operating Time (MOT) and Mean Down Time (MDT), respectively [12,28]. Transition probabilities can be represented by a matrix. This matrix is known as ’stochastic transitional probability matrix’ (STPM) [28].
where is the probability of transition from state i to state j. For the system that is shown in Figure 1, the STPM will be:
The availability (i.e., probability that the system is in operable state) and the unavailability (i.e., probability that the system is in failed state) can be determined by solving Equation (5)
where, P is the individual state probability vector.
For a system having constant failure and repair rates, the probability density function (pdf) is exponential. The reliability and maintainability of the system at time ‘t’ can be defined by Equations (7) and (8), respectively [12].
The present study implements the aforesaid framework in a typical PEV system for conducting a quantitative RAM assessment. Section 4 includes the modeling details and assumptions. Before that, it is essential to have a look at the topological layout of the vehicle system and its components.
3. Typical PEV Configuration for RAM Assessment
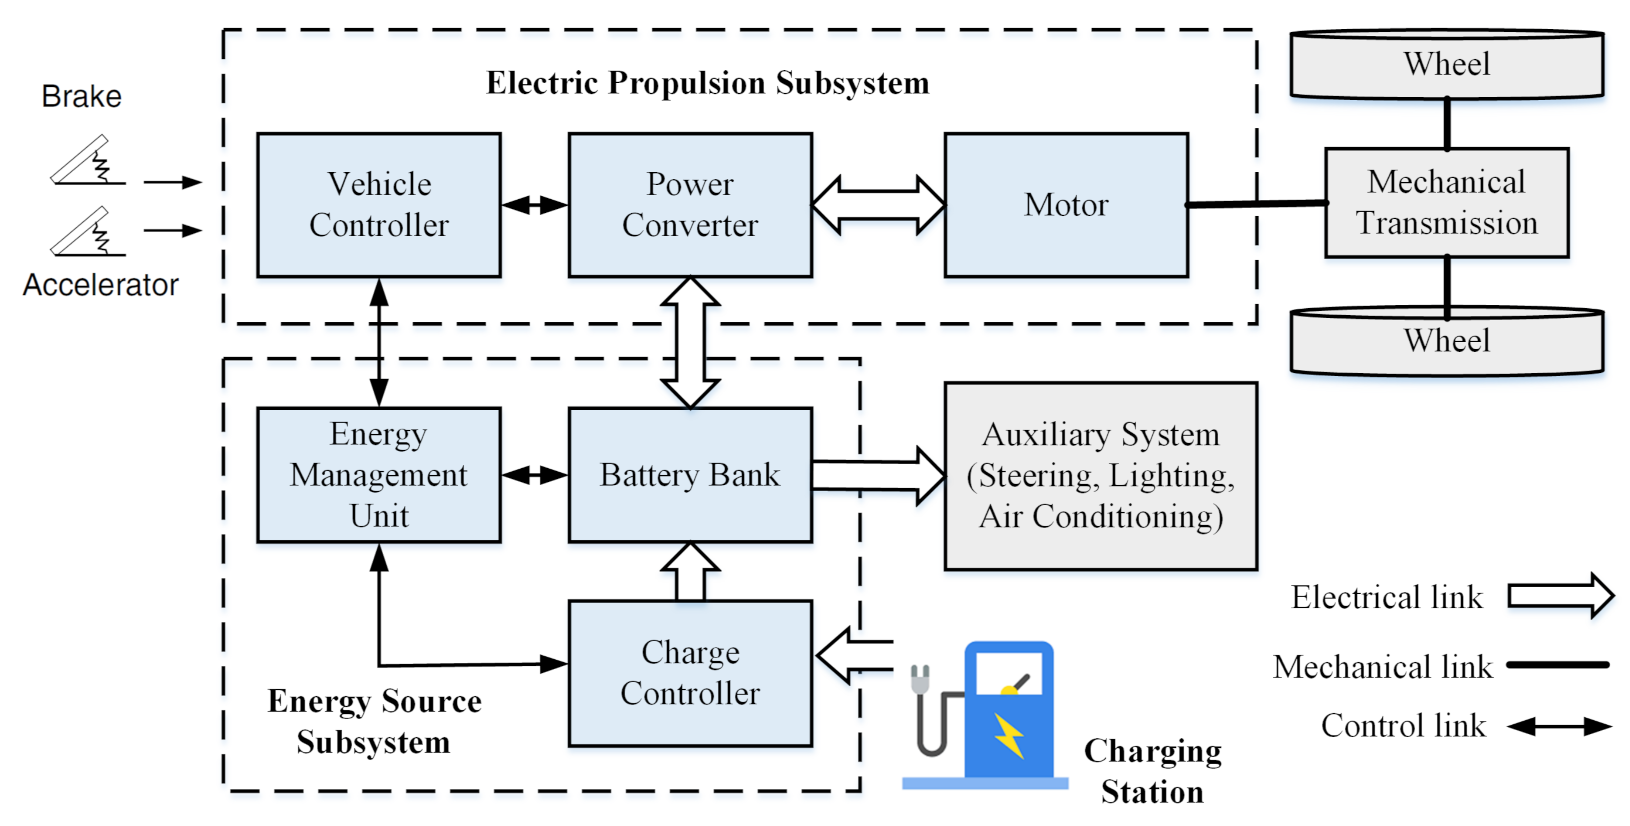
Figure 2 illustrates the schematic diagram of a typical PEV system. The entire vehicle system can be divided into four major functional blocks or subsystems: (a) Energy Source Subsystem (ESS), (b) Electric Propulsion Subsystem (EPS), (c) Auxiliary System (AS), and (d) Mechanical Transmission System (MTS) [10].
The ESS is comprised of a Charge Controller (CC), Battery Bank (BB), and Energy Management Unit (EMU), whereas the EPS consists of a Vehicle Controller (VC), a Power Converter (PC), and a Motor. The motor’s shaft torque is transferred to the wheels through a mechanical transmission mechanism. The AS controls the auxiliary power supply that is required for power steering, lighting, air conditioning, etc. [6,10].
The heart of an EV is the EPS. The motor receives the electrical power from the battery bank through the PC at proper voltage and current level and transforms it into mechanical power to propel the vehicle.
The VC sends the control signals to the PC, depending on the command from the accelerator and brake pedals. The PC regulates the power flow between the ESS and motor. During braking, the PC receives the regenerative power from the motor and restores it in the battery, provided that the ESS is receptive. Most of the EV batteries have the ability to store regenerated energy [10]. The EMU cooperates with the VC to initiate the process of energy recovery from regenerative braking. It also monitors the state of charge (SOC) and state of health (SOH) of the battery bank in real-time and asks the CC to act accordingly [33].
4. Formulation of Mathematical Models
Figure 3 shows the fault-tree [28] of the PEV system. It represents all of the possible fault events associated with the vehicle system, their logical combinations, and their correlations to the system failure [12]. The mathematical models developed for RAM assessment are based on the principle that is defined by this fault-tree.
In this study, the battery, charge controller, vehicle controller, drives, motor, and energy management unit failures constitute the basic events. It is assumed that the failure and repair characteristics of these components are already known and exponentially distributed [34]. Repair commences immediately if the component is repairable and the repair facility is available. Otherwise, it waits in the queue to avail the first opportunity of service. If the component is not repairable or the repair cost is close to the component’s price, then the component is replaced. The restoration rate will get modified accordingly. The proposed reliability model focuses on the vehicle’s main link, i.e., ESS and EPS. The AS and MTS are considered to be 100% reliable.
4.1. Modeling of Energy Source Subsystem
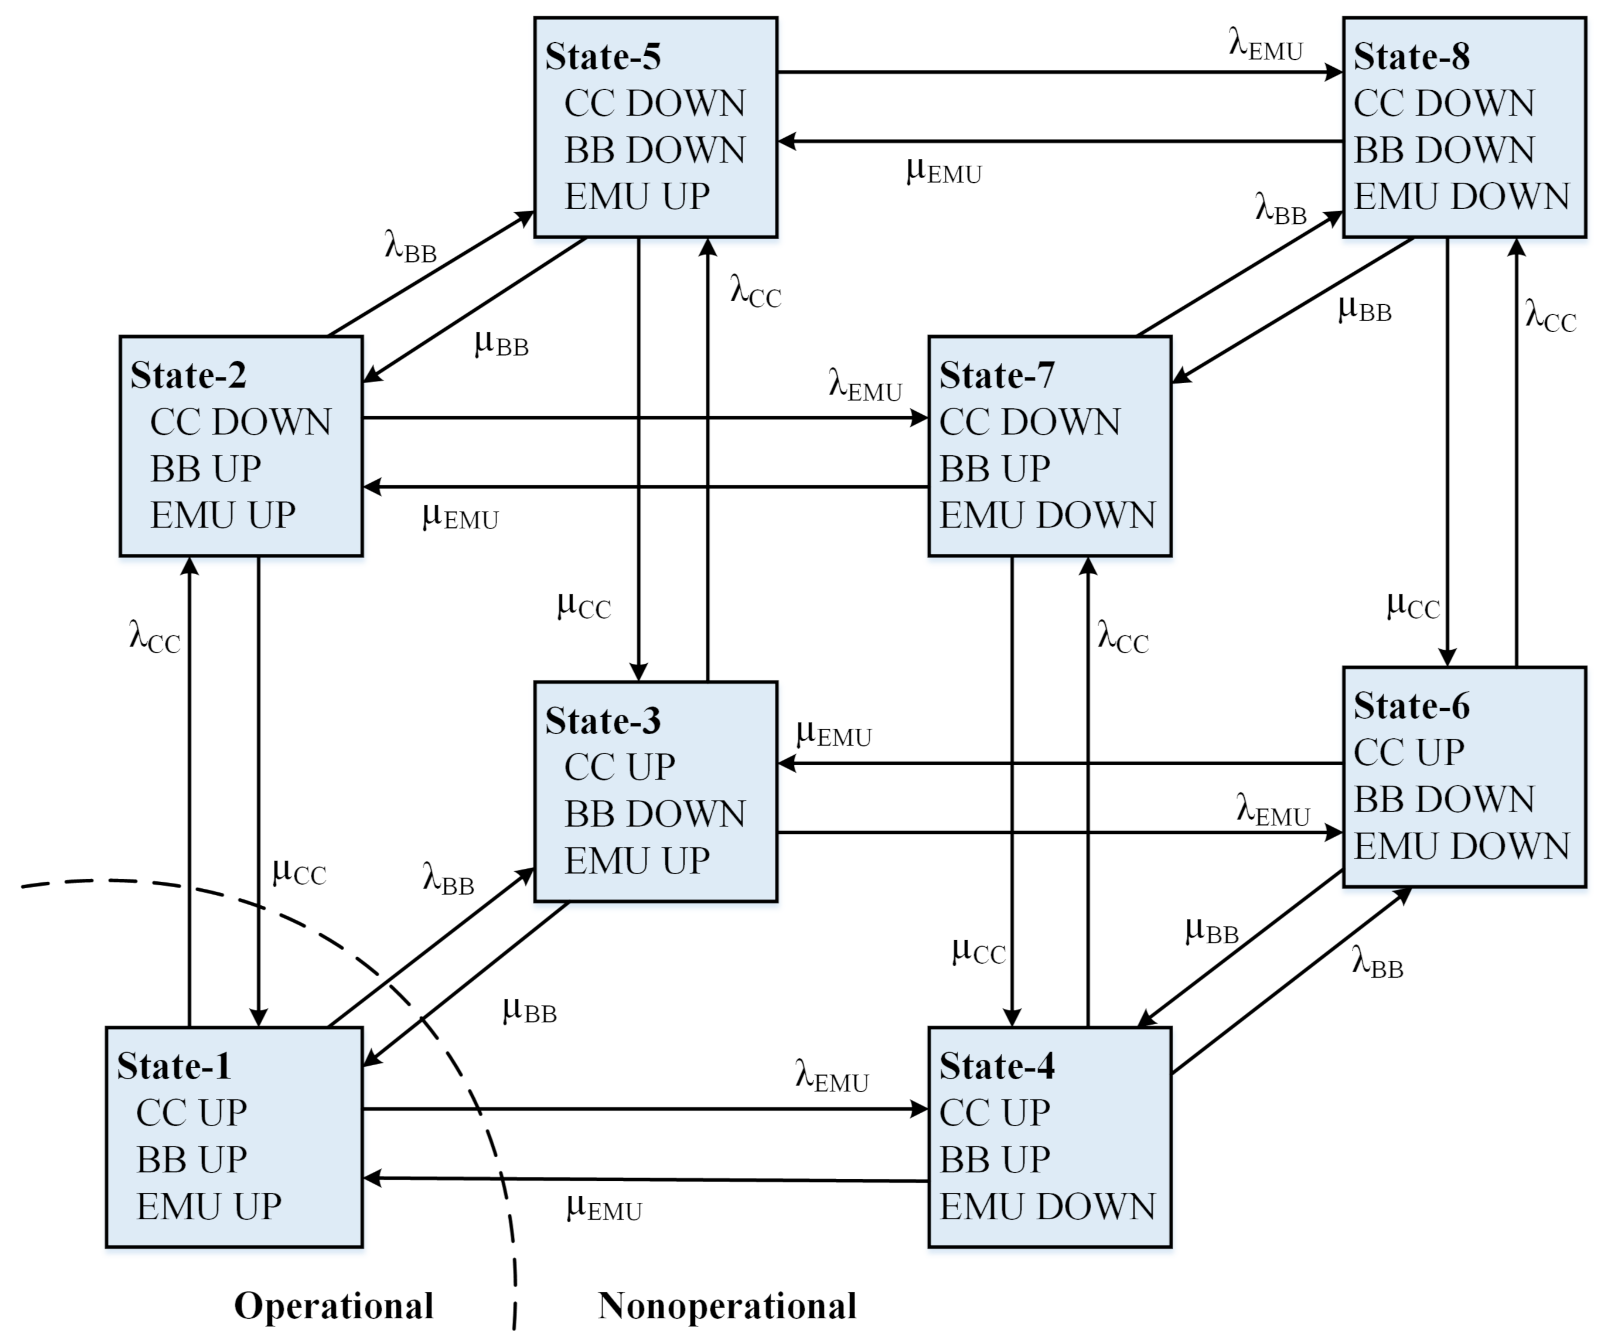
The ESS consists of three main components: CC, BB, and EMU, as mentioned in Section 3. Among these, battery is the most crucial component from the vehicle’s reliability perspective. At any instant, the battery may stay either in the operational (UP) state or in the nonoperational (DOWN) state. In the operational state, the battery has enough electrostatic energy to supply the power that is required by the EPS and AS. The battery goes to the DOWN state because of two reasons: (a) it has not sufficient electrostatic energy (discharged state) and (b) it loses the ability to store charge (damaged state).
Similarly, the CC and EMU also have two possible states (UP and DOWN) at any time ‘t’. Therefore, the entire ESS will have a total no. of transitional states. Figure 4 shows the state-space model of the ESS illustrating the transitions among all of the possible states. represent the failure rates and represent the restoration rates of the CC, BB, and EMU, respectively.
Equation (9) shows the STPM of a three-components system.
If the suffix 1, 2, and 3 used in and are replaced by CC, BB, and EMU, respectively, then Equation (9) will represent the STPM of the ESS model.
The probability of occurrence of each state of the ESS model that is shown in Figure 4 can be determined using Equations (10)–(17).
The ESS will be operational if, and only if, all of its components are in UP states, i.e., the ESS will be working in state-1 only. Thus, the availability of the ESS will be equal to and it can be determined from Equation (10). In the remaining seven states, at least one component is in the failed state, which makes the whole ESS non-operable. Thus, the unavailability of the ESS will be the net probability of these seven states, and it can be calculated using Equation (18).
Eliminating the DOWN states from Equation (9), the STPM reduces to a truncated matrix (Q) that is given by Equation (19).
The mean time that the ESS spent in state-1 is determined using Equation (20).
∴ The mean operating time (MOT) of the ESS is:
The effective failure rate of the ESS will be:
Again, the Mean Down Time (MDT) or Mean-time-to-repair (MTTR) of the ESS can be calculated using Equation (23).
∴ The effective restoration rate of the ESS will be:
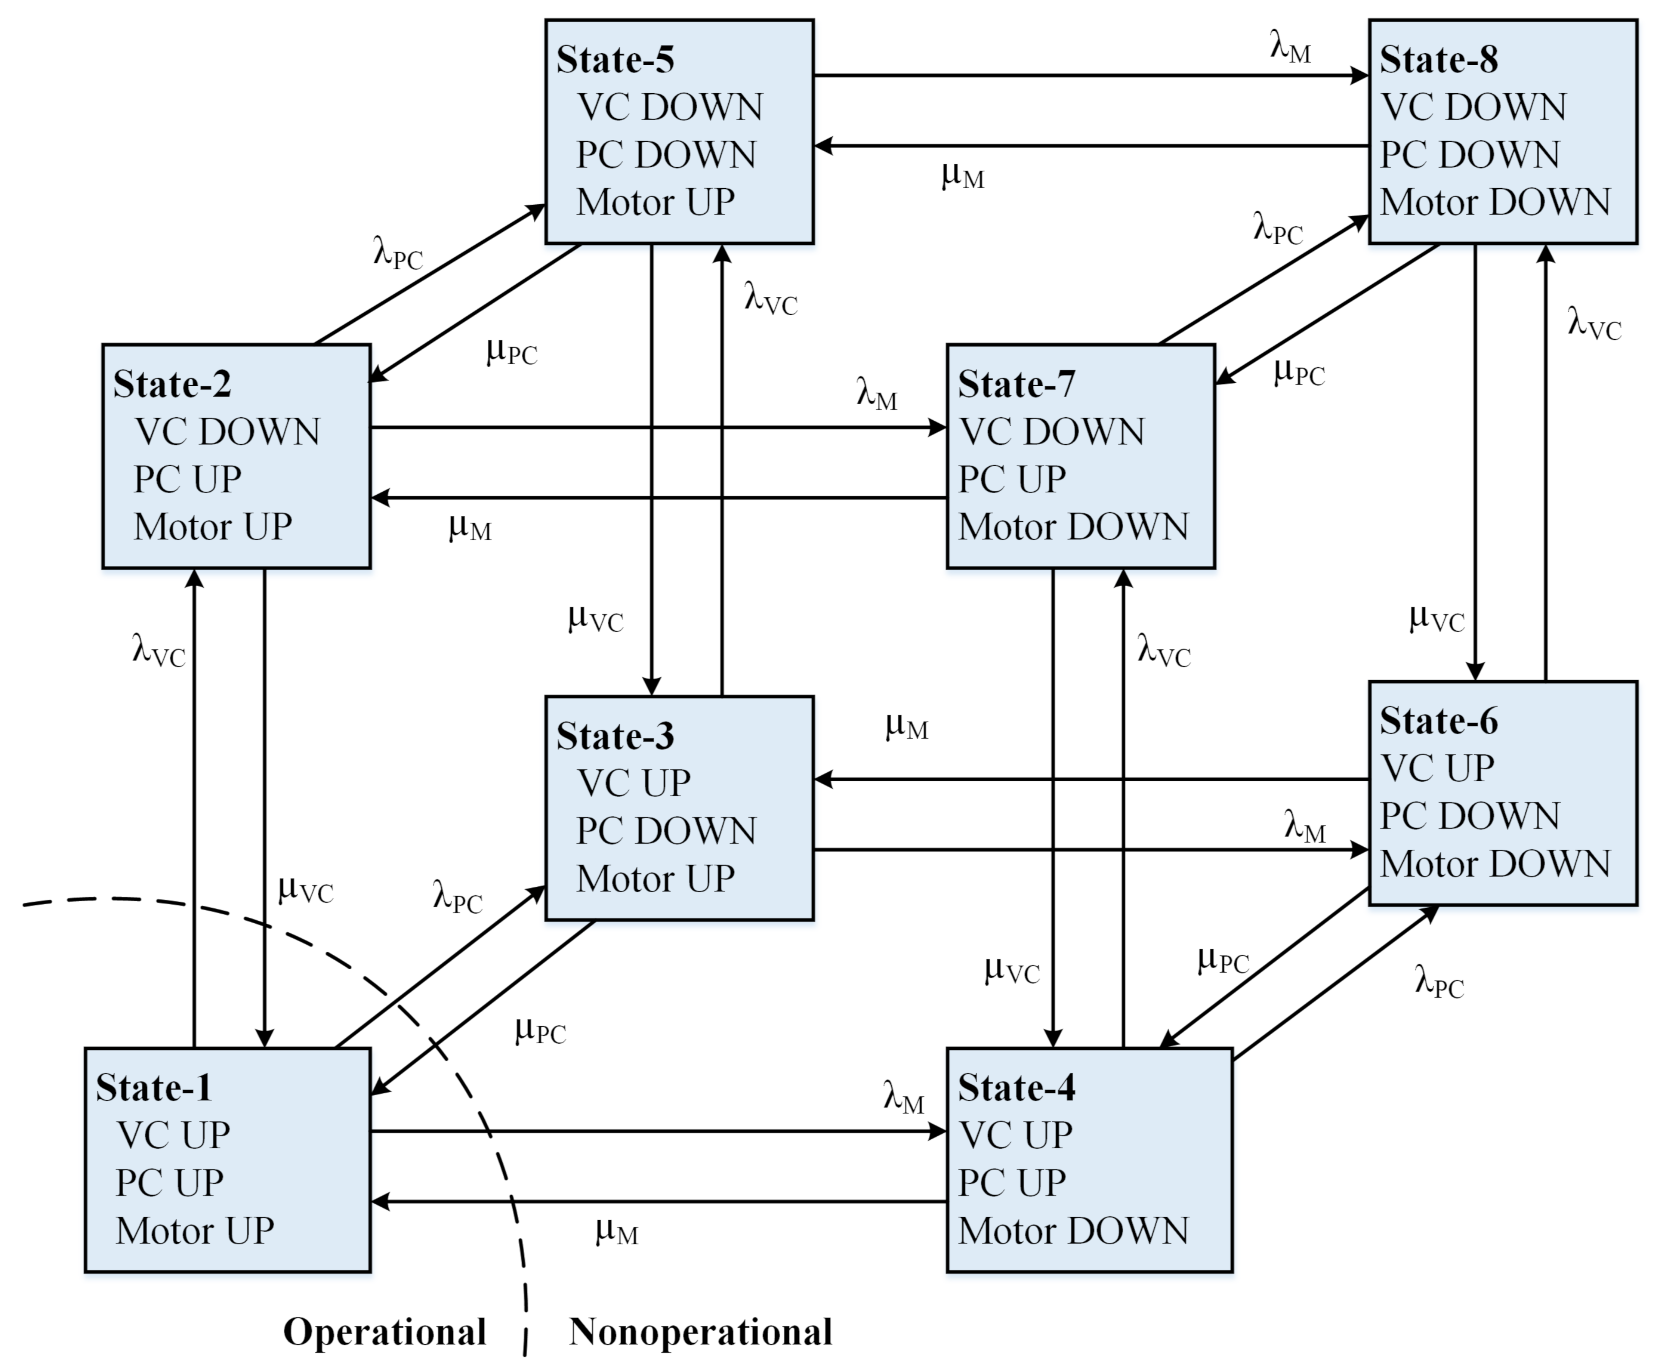
4.2. Modeling of the Electric Propulsion Subsystem
The stochastic model for the EPS (Figure 5) is comprised of a vehicle controller (VC), a power converter (PC), and a motor, each of having two operational states (i.e., UP and DOWN).
The model architecture is similar to that of the ESS. For the successful operation of the EPS, it is necessary to remain all of its components in the working (UP) state. This means that the EPS will be operational in state-1 only. Therefore, the availability of the EPS will be equal to the limiting state probability of state-1, which can be calculated using Equation (25).
The effective failure and restoration rates of the EPS can be determined using Equations (26) and (27), respectively.
4.3. Modeling of the PEV System
After evaluating the reliability parameters (i.e., failure rates and restoration rates) of the ESS and EPS blocks, the reliability model for the PEV system can be constructed, as shown in Figure 6.
Depending on the operating status of the ESS and EPS, the PEV system may remain in any one of the four probable states that are mentioned in Figure 6. The transition rates between two adjacent states will define the STPM, as follows:
In order to make the vehicle operational, ESS and EPS must both be in working state. Thus, the availability of the PEV is equal to the probability of occurrence of state-1, which can be determined using (29).
If the transitions that are associated with the nonoperational states are eliminated, the STPM of the PEV reduces to Equation (30).
The mean-time-to-first-failure (MTTFF) which decides the warranty period of the vehicle, can be determined using Equation (31).
Again, the mean down time of the vehicle can be determined using Equation (32).
∴ The effective failure rate and repair rate or the vehicle can be estimated using Equations (33) and (34), respectively.
The reliability of the PEV system at time ‘t’ can be determined using Equation (35).
Additionally, the maintainability of the PEV at time ‘t’ can be calculated using Equation (36).
5. Charging Station’s Role on PEV’s Availability
The reliability of a charging station (CS) plays a vital role in the availability of a PEV. A charging station’s reliability depends on two factors: (a) Reliability of power supply, and (b) Reliability of the charging system.
If the charging station is subjected to a power outage, the vehicle will have to wait for a longer time to get recharged and, hence, the Mean Down Time of the PEV increases. The vehicle will be remaining nonoperational (forced outage) until the power supply is restored. The higher the downtime, the lesser will be the availability. It can be justified from Equation (37).
In addition to a reliable power supply, a reliable charging system is also important for reducing the downtime of a vehicle. Charging systems experience forced outages due to internal faults and they remain out of service for a certain period. An unreliable charging system provides fewer charging hours to a PEV.
In order to investigate how a charging station’s reliability impacts the availability of a PEV, a two-state battery model is integrated with a two-state CS model.The state-space diagram of this composite model is shown in Figure 7.
Figure 7 shows that the battery is in the UP state (charged) in states 1 and 2 only. The vehicle has the maximum availability in state-1 ( provided all other PEV components are operating well). In state-2, the vehicle is operable, but the availability is restricted by the discharging rate of the battery () and restoration rate of the CS ). In state-3, the vehicle is in discharged mode and, hence, unavailable to operate. Here, the unavailability is controlled by the charging rate of the battery and failure rate of CS (). The vehicle is also not operable in state-4, and its availability will depend on and .
The probability that the PEV may enter into the aforesaid four states can be determined using Equations (38)–(41).
The power supply’s reliability at a particular charging station can be determined with the help of a probabilistic index, called Average Service Availability Index (ASAI) [29]. Although it is a distribution system’s reliability index, it can also be applied in the charging station with few modifications. The modified ASAI is defined, as follows:
where, is the no. of vehicles to be recharged and is the annual outage time at the th charging point.
Now, considering the charging system as a single component having an effective failure rate of and restoration rate of , the reliability of the CS at time ‘t’ can be determined using Equation (43).
The availability of the CS can be determined using Equation (44).
The mean operable time of the CS can be calculated using Equation (45).
The effective failure rate of the CS can be determined using Equation (46).
The effective restoration rate of the CS can be obtained using Equation (47).
Now, the availability of the PEV at different stochastic operational situations of a charging station can be investigated using Equations (38)–(41).
6. Case Study
The developed mathematical models have been implemented to a typical PEV system in order to carry out the RAM assessment. The Appendix A provides the reliability data and other relevant information required for the analysis. The case study is categorized in two parts, as follows:
6.1. RAM Assessment of the PEV System
Figure 8 shows the reliability, availability, and maintainability characteristic curves for the PEV system. It indicates that the vehicle’s reliability is exponentially decreasing and it becomes , and after a period of 5, 10, and 15 years, respectively. However, due to maintenance (i.e., inclusion of repair rates), its operational effectiveness increases significantly and it becomes and , respectively, after the said periods. The improvement can be noticed by comparing the reliability and availability curves that are shown in Figure 8. Again, as time passes, the vehicle’s maintenance rate has to be increased, so that its availability increases and attains the maximum (steady-state) value. As the maintainability curve approaches 1 (i.e., the availability curve becomes saturated and cannot be further improved with standard restoration rates.
For further improvement in steady-state availability, three possible options are available: (a) using components having lower failure rate, (b) using spare components as standby redundancy, and (c) increasing the repair or restoration rates. The first two options are only possible at the manufacturing stage and restricted by the design and cost constraints. The failure properties are usually stochastic, and the operator cannot do much on it. However, the repair time and restoration rates of faulty components can be controlled by the operator up to a certain level. If the vehicle’s defective part is replaced or repaired at a higher rate, then the vehicle’s availability increases significantly.
Figure 9 graphically illustrates how the vehicle’s operational effectiveness improves with higher restoration rates (RR). It is observed that, if the RR is increased by 25%, the steady-state availability of the PEV improves by 3.50%. Similarly, and increment in restoration rates of the failed components will give and improvement of steady-state availability, respectively.
In this way, a RAM analysis helps to improve the well-being of the vehicle system.
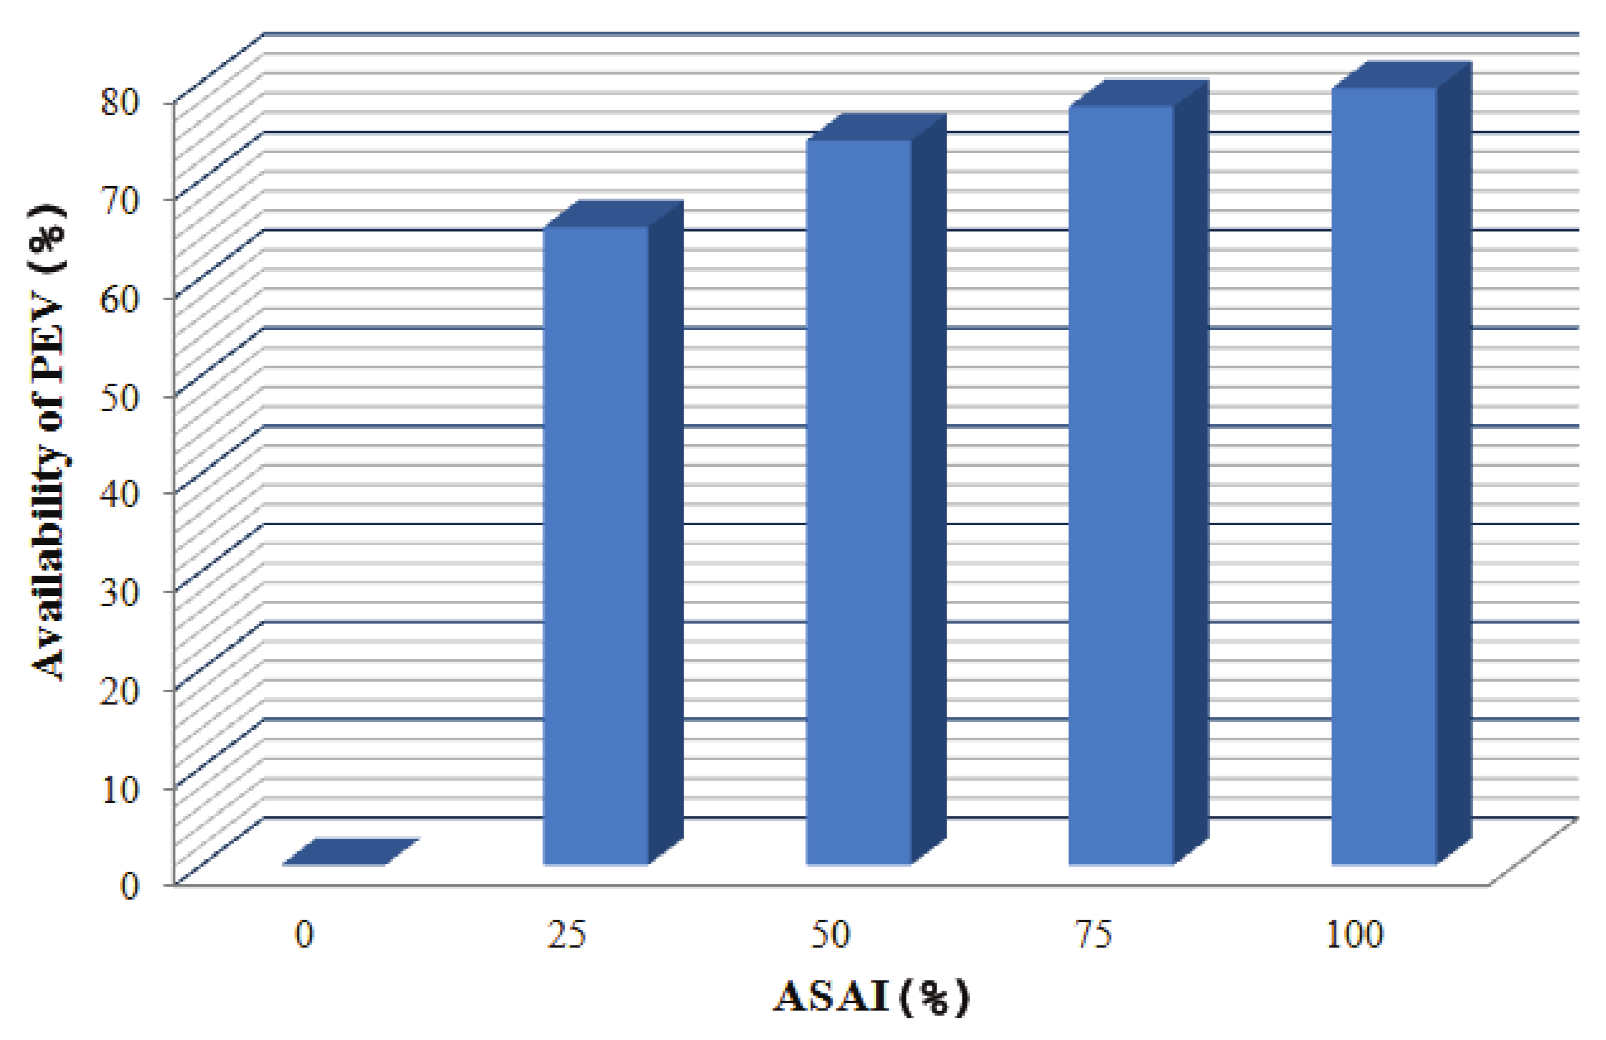
6.2. Impact of ASAI on the PEV
In Section 6.1, RAM analysis of the PEV is performed while assuming that the charging station is reliable. However, in practice, this assumption does not hold good, as no system is reliable.
The reliability and availability of a charging station are mainly dependent on three parameters namely, ASAI, and , as mentioned in Section 5. Using the charging station’s data (Table A2) given in Appendix A, the value of ASAI is found to be . Corresponding to this value, the charging station offers reliability and availability to the PEV after five years of operation.
Figure 10 shows the availability of a five years old PEV system at different values of ASAI. The results show that the vehicle’s availability or operational effectiveness is highly dependent on the value of ASAI. At zero ASAI, a vehicle coming for recharge will be lying ineffective at the charging station. As ASAI increases, the PEV’s availability increases. For example, at ASAI, the availability of the PEV becomes . At ASAI, the availability of the vehicle (after five years of operation) becomes . It cannot reach the mark due to the unreliability contributed by the charging unit and other components of the PEV. If all the other components are available, then only the PEV can achieve availability at ASAI value.
In many developing countries, where frequent power outages occur, ASAI can be a useful indicator for the vehicle owners. The knowledge of ASAI will help the PEV owner in the effective and reliable operation of their vehicles. However, modern charging stations are equipped with captive power plants (most preferably by renewable energy) to reach the ASAI close to 100%. A battery with a high charging rate can save the charging hours of a charging station. It reduces the MDT of a discharged PEV. Again, a slow discharging rate increases the MOT of the vehicle. It helps to improve the availability of a PEV.
7. Conclusions
This paper seeks to explore a way to investigate the RAM of a PEV system in Markov Framework. The study justifies that the reliability and availability of a PEV deteriorate with time, due to its components’ failures. However, with timely repair or replacement of the faulty components, the vehicle’s operational effectiveness can be improved significantly. Although a vehicle owner does not have the option to control the system’s stochastic failures, the restoration process of faulty components can be accelerated up to a certain level. It will increase the availability of the vehicle. Again, it is observed that the availability of a PEV highly depends on the charging station’s reliability. A charging station’s reliability mostly relies on the reliability of the power supply. The present study demonstrates this aspect with the help of a modified reliability index, ASAI. Because of frequent load shedding in the rural areas of many developing countries like India, ASAI can be a useful indicator for vehicle owners. There is a noticeable literature gap on this topic. The concepts that have been introduced in this paper can inspire further research on the RAM issues of a vehicle system. The Markov Framework is a useful tool to construct reliability models of engineering systems. However, its applications are primarily limited to exponential probability density functions (pdf) only. Almost all of the electrical components follow exponential pdfs and, therefore, the present study fits in this methodology. There is a scope for further continuation of the study concentrating on reliability worth assessment. It will assist manufacturers in designing more reliability-centric, but cost-effective PEV models.
Author Contributions
B.K.T.—conceptualization, methodology, software, validation formal analysis, investigation, resources, writing—original draft preparation, review and editing; B.C.D.—supervision, validation formal analysis, writing—review and editing. All authors have read and agreed to the published version of the manuscript.
Funding
This research received no external funding.
Conflicts of Interest
The authors declare no conflict of interest.
Abbreviations and Symbols
| Abbreviation/Symbol | Full Form/Meaning |
| EV | Electric Vehicle |
| PEV | Plug-in Electric Vehicle |
| IC | Internal Combustion |
| RAM | Reliability, Availability, Maintainability |
| ESS | Energy Storage Subsystem |
| EPS | Electric Propulsion Subsystem |
| AS | Auxiliary System |
| MTS | Mechanical Transmission System |
| CC | Charge Controller |
| BB | Battery Bank |
| EMU | Energy Management Unit |
| VC | Vehicle Controller |
| PC | Power Converter |
| CS | Charging Station |
| MOT | Mean Operating Time |
| MDT | Mean Down Time |
| MTTF | Mean Time to Failure |
| STPM | Stochastic Transitional Probability Matrix |
| Failure Rate of a component | |
| Repair or Restoration Rate of a component | |
| ASAI | Average Service Availability Index |
Appendix A

Table A1.
Reliability Data for PEV.
| Component | Failure Rate () (per Year) | Restoration Rate () (per Year) |
|---|---|---|
| Charge controller | 0.00741 | 0.285 |
| Battery bank | 0.00746 | 0.668 |
| Energy management unit | 0.01624 | 0.556 |
| Power converter | 0.01255 | 0.342 |
| Motor | 0.01825 | 0.586 |
| Vehicle controller | 0.01525 | 0.345 |
| Charging system | 0.06000 | 0.768 |
Table A2.
Charging Station Data.
| Charging Point/Station (i) | No.of Vehicles (N) (per Year) | Annual Outage (U) (Hour) |
|---|---|---|
| 1 | 1200 | 1000 |
| 2 | 1400 | 950 |
| 3 | 1100 | 700 |
| 4 | 700 | 850 |
| 5 | 1300 | 900 |
| 6 | 1500 | 750 |
| 7 | 1000 | 800 |
| 8 | 800 | 650 |
References
- Casals, L.C.; Martinez-Laserna, E.; García, B.A.; Nieto, N. Sustainability analysis of the electric vehicle use in Europe for CO2 emissions reduction. J. Clean. Prod. 2016, 127, 425–437. [Google Scholar] [CrossRef]
- Colvile, R.N.; Hutchinson, E.J.; Mindell, J.S.; Warren, R.F. The transport sector as a source of air pollution. Atmos. Environ. 2001, 35, 1537–1565. [Google Scholar] [CrossRef] [Green Version]
- Sources of Greenhouse Gas Emissions|Greenhouse Gas (GHG) Emissions|US EPA. Available online: https://www.epa.gov/ghgemissions/sources-greenhouse-gas-emissions (accessed on 16 September 2020).
- US EPA. Air Emissions Sources. Available online: https://www.epa.gov/air-emissions-inventories (accessed on 16 September 2020).
- Ehsani, M.; Wang, F.-Y.; Brosch, G.L. (Eds.) Transportation Technologies for Sustainability; Springer: New York, NY, USA, 2013. [Google Scholar]
- Chan, C.C.; Bouscayrol, A.; Chen, K. Electric, Hybrid, and Fuel-Cell Vehicles: Architectures and Modeling. IEEE Trans. Veh. Technol. 2010, 59, 589–598. [Google Scholar] [CrossRef]
- Besbes, W.; Dhouib, D.; Wassan, N.; Marrekchi, E. (Eds.) Solving Transport Problems: Towards Green Logistics, 1st ed.; Wiley: Hoboken, NJ, USA, 2019. [Google Scholar]
- Raugei, M.; Hutchinson, A.; Morrey, D. Can electric vehicles significantly reduce our dependence on non-renewable energy? Scenarios of compact vehicles in the UK as a case in point. J. Clean. Prod. 2018, 201, 1043–1051. [Google Scholar] [CrossRef]
- Brown, S.; Pyke, D.; Steenhof, P. Electric vehicles: The role and importance of standards in an emerging market. Energy Policy 2010, 38, 3797–3806. [Google Scholar] [CrossRef]
- Ehsani, M. Modern Electric, Hybrid Electric, and Fuel Cell Vehicles: Fundamentals, Theory, and Design; CRC Press: Boca Raton, FL, USA, 2005. [Google Scholar]
- Xia, Q.; Wang, Z.; Ren, Y.; Sun, B.; Yang, D.; Feng, Q. A reliability design method for a lithium-ion battery pack considering the thermal disequilibrium in electric vehicles. J. Power Sources 2018, 386, 10–20. [Google Scholar] [CrossRef]
- Balagurusamy, E. Reliability Engineering, First. P-24, Green Park Extension; McGraw Hill Education (India) Private Limited: New Delhi, India, 2002. [Google Scholar]
- Oluwasuji, O.I.; Malik, O.; Zhang, J.; Ramchurn, S.D. Solving the fair electric load shedding problem in developing countries. Auton. Agents Multi-Agent Syst. 2019, 34, 12. [Google Scholar] [CrossRef] [Green Version]
- Corvaro, F.; Giacchetta, G.; Marchetti, B.; Recanati, M. Reliability, Availability, Maintainability (RAM) study, on reciprocating compressors API 618. Petroleum 2017, 3, 266–272. [Google Scholar] [CrossRef]
- Aggarwal, K.K. Maintainability and Availability, Topics in Safety Reliability and Quality; Springer: Dordrecht, The Netherlands, 1993. [Google Scholar]
- Shu, X.; Guo, Y.; Yang, W.; Wei, K.; Zhu, Y.; Zou, H. A Detailed Reliability Study of the Motor System in Pure Electric Vans by the Approach of Fault Tree Analysis. IEEE Access 2020, 8, 5295–5307. [Google Scholar] [CrossRef]
- Xia, Q.; Wang, Z.; Ren, Y.; Tao, L.; Lu, C.; Tian, J.; Hu, D.; Wang, Y.; Su, Y.; Chong, J.; et al. A modified reliability model for lithium-ion battery packs based on the stochastic capacity degradation and dynamic response impedance. J. Power Sources 2019, 423, 40–51. [Google Scholar] [CrossRef]
- Sakhdari, B.; Azad, N.L. An Optimal Energy Management System for Battery Electric Vehicles. IFAC-PapersOnLine 2015, 48, 86–92. [Google Scholar] [CrossRef]
- Bolvashenkov, I.; Herzog, H.-G. Approach to predictive evaluation of the reliability of electric drive train based on a stochastic model. In Proceedings of the 2015 International Conference on Clean Electrical Power (ICCEP), Taormina, Italy, 16–18 June 2015; pp. 486–492. [Google Scholar]
- Ammaiyappan, B.S.; Ramalingam, S. Reliability investigation of electric vehicle. Life Cycle Reliab. Saf. Eng. 2019, 8, 141–149. [Google Scholar] [CrossRef]
- Khalilzadeh, M.; Fereidunian, A. A Markovian approach applied to reliability modeling of bidirectional DC-DC converters used in PHEVs and smart grids. IJEEE 2016, 12, 301–313. [Google Scholar]
- Sadeghian, O.; N-Heris, M.; Abapour, M.; Taheri, S.S.; Zare, K. Improving reliability of distribution networks using plug-in electric vehicles and demand response. J. Mod. Power Syst. Clean Energy 2019, 7, 1189–1199. [Google Scholar] [CrossRef] [Green Version]
- Galiveeti, H.R.; Goswami, A.K.; Choudhury, N.B.D. Impact of plug-in electric vehicles and distributed generation on reliability of distribution systems. Eng. Sci. Technol. Int. J. 2018, 21, 50–59. [Google Scholar] [CrossRef]
- Kheradmand-Khanekehdani, H.; Gitizadeh, M. Well-being analysis of distribution network in the presence of electric vehicles. Energy 2018, 155, 610–619. [Google Scholar] [CrossRef]
- Garcés Quílez, M.; Abdel-Monem, M.; El Baghdadi, M.; Yang, Y.; Van Mierlo, J.; Hegazy, O. Modelling, Analysis and Performance Evaluation of Power Conversion Unit in G2V/V2G Application—A Review. Energies 2018, 11, 1082. [Google Scholar] [CrossRef] [Green Version]
- Salvatti, G.A.; Carati, E.G.; Cardoso, R.; da Costa, J.P.; Stein, C.M.D.O. Electric Vehicles Energy Management with V2G/G2V Multifactor Optimization of Smart Grids. Energies 2020, 13, 1191. [Google Scholar] [CrossRef] [Green Version]
- Kasturi, K.; Nayak, C.K.; Nayak, M.R. Electric vehicles management enabling G2V and V2G in smart distribution system for maximizing profits using MOMVO. Int. Trans. Electr. Energy Syst. 2019, 29, e12013. [Google Scholar] [CrossRef]
- Billinton, R.; Allan, R.N. Reliability Evaluation of Engineering Systems; Springer: Boston, MA, USA, 1992. [Google Scholar]
- Billinton, R.; Allan, R.N. Reliability Evaluation of Power Systems, 2nd ed.; Springer: Boston, MA, USA, 1996. [Google Scholar]
- Adefarati, T.; Bansal, R.C. Reliability assessment of distribution system with the integration of renewable distributed generation. Appl. Energy 2017, 185, 158–171. [Google Scholar] [CrossRef]
- Esau, Z.; Jayaweera, D. Reliability assessment in active distribution networks with detailed effects of PV systems. J. Mod. Power Syst. Clean Energy 2014, 2, 59–68. [Google Scholar] [CrossRef] [Green Version]
- Al-Muhaini, M.; Heydt, G.T. Evaluating Future Power Distribution System Reliability Including Distributed Generation. IEEE Trans. Power Deliv. 2013, 28, 2264–2272. [Google Scholar] [CrossRef]
- Lacey, G.; Putrus, G.; Bentley, E. Smart EV charging schedules: Supporting the grid and protecting battery life. IET Electr. Syst. Transp. 2017, 7, 84–91. [Google Scholar] [CrossRef]
- Billinton, R.; Allan, R.N. System reliability evaluation using probability distributions. In Reliability Evaluation of Engineering Systems; Springer: Boston, MA, USA, 1992; pp. 221–259. [Google Scholar]
Figure 1.
State-space diagram of a repairable component.

Figure 2.
Schematic diagram of a typical plug-in electric vehicle (PEV) system.

Figure 3.
Fault-tree diagram of the PEV system.

Figure 4.
State-space diagram of the Energy Source Subsystem.

Figure 5.
State-space diagram of the Electric Propulsion Subsystem.

Figure 6.
State-space diagram of the PEV system.

Figure 7.
State-space diagram of the CS-Battery Model.

Figure 8.
Reliability, Availability, and Maintainability curves for the PEV.

Figure 9.
Vehicle’s availability at different restoration rates (RR).

Figure 10.
Availability of PEV at different Average Service Availability Index (ASAI).

Publisher’s Note: MDPI stays neutral with regard to jurisdictional claims in published maps and institutional affiliations. |
© 2021 by the authors. Licensee MDPI, Basel, Switzerland. This article is an open access article distributed under the terms and conditions of the Creative Commons Attribution (CC BY) license (http://creativecommons.org/licenses/by/4.0/).
Share and Cite
MDPI and ACS Style
Talukdar, B.K.; Deka, B.C. An Approach to Reliability, Availability and Maintainability Analysis of a Plug-In Electric Vehicle. World Electr. Veh. J. 2021, 12, 34. https://0-doi-org.brum.beds.ac.uk/10.3390/wevj12010034
AMA Style
Talukdar BK, Deka BC. An Approach to Reliability, Availability and Maintainability Analysis of a Plug-In Electric Vehicle. World Electric Vehicle Journal. 2021; 12(1):34. https://0-doi-org.brum.beds.ac.uk/10.3390/wevj12010034
Chicago/Turabian StyleTalukdar, Bipul Kumar, and Bimal Chandra Deka. 2021. "An Approach to Reliability, Availability and Maintainability Analysis of a Plug-In Electric Vehicle" World Electric Vehicle Journal 12, no. 1: 34. https://0-doi-org.brum.beds.ac.uk/10.3390/wevj12010034