
Real-World Mobility and Environmental Data for the Assessment of In-Vehicle Battery Capacity Fade

European Commission—Joint Research Centre (JRC), Via Enrico Fermi 2749, 21027 Ispra, Italy
*
Author to whom correspondence should be addressed.
World Electr. Veh. J. 2021, 12(1), 48; https://0-doi-org.brum.beds.ac.uk/10.3390/wevj12010048
Submission received: 15 February 2021
/
Revised: 28 February 2021
/
Accepted: 9 March 2021
/
Published: 20 March 2021
(This article belongs to the Special Issue Selected Papers from The 33rd International Electric Vehicles Symposium and Exhibition (Portland, Oregon, USA))
Abstract
:This work develops scenario-based analyses for predicting in-vehicle performance degradation of automotive traction batteries. It combines recent capacity performance-based models of NCM-LMO Li-ion (Nickel Cobalt Manganese Oxide—Lithium Manganese Oxide) variant batteries with real-world vehicle driving data from different geographical areas of Europe. The analysis addresses different battery and vehicle architectures (PHEVs (Plug-in Hybrid Electric Vehicles) and BEVs (Battery Electric Vehicles)) combined with different recharging strategies and mobility patterns and environmental temperatures. The mobility pattern datasets used in this analysis refer to six European cities and include up to 508,609 private vehicles, corresponding to 1.78 billion GPS records, 9.1 million trips and parking events and a total driven distance of 106.1 million kilometers. The results show the effect that the environmental temperature, the recharging power, and the driven kilometers have on the calendar and cycling aging. The majority of the combinations of the considered vehicle architectures and recharge strategies do not lead to battery capacity drop below 80% of its nominal value in less than five calendar years for a usage profile of up to 1000 km/month.
1. Introduction
Battery durability is a key element for evaluating the economic, social, and environmental impact of electrified vehicles [1,2,3]. Loss of environmental performance is important in particular because governmental regulatory compliance programs often credit electrified vehicles with a certain level of expected environmental benefit, which might fail to be realized over the life of the vehicle if sufficient battery degradation occurs. In addition to changes in driving range and energy consumption, for hybrid electric vehicles that are equipped with both a conventional and electric powertrain, the criteria for pollutant emissions from the conventional powertrain could be impacted by the degradation of the battery [4]. The problem of establishing battery durability for representative usage scenarios, chemistries, and configurations is extremely complex. Hence, a better understanding of the degradation mechanisms relevant for automotive applications is highly desirable, together with a quantification of the battery life in real-world use conditions. Several studies have been carried out in this respect to determine the key mechanisms responsible for electrochemical aging of battery cells, such as [5,6], and hence, loss of energy capacity and decrease of the output power of the cell [7,8,9].
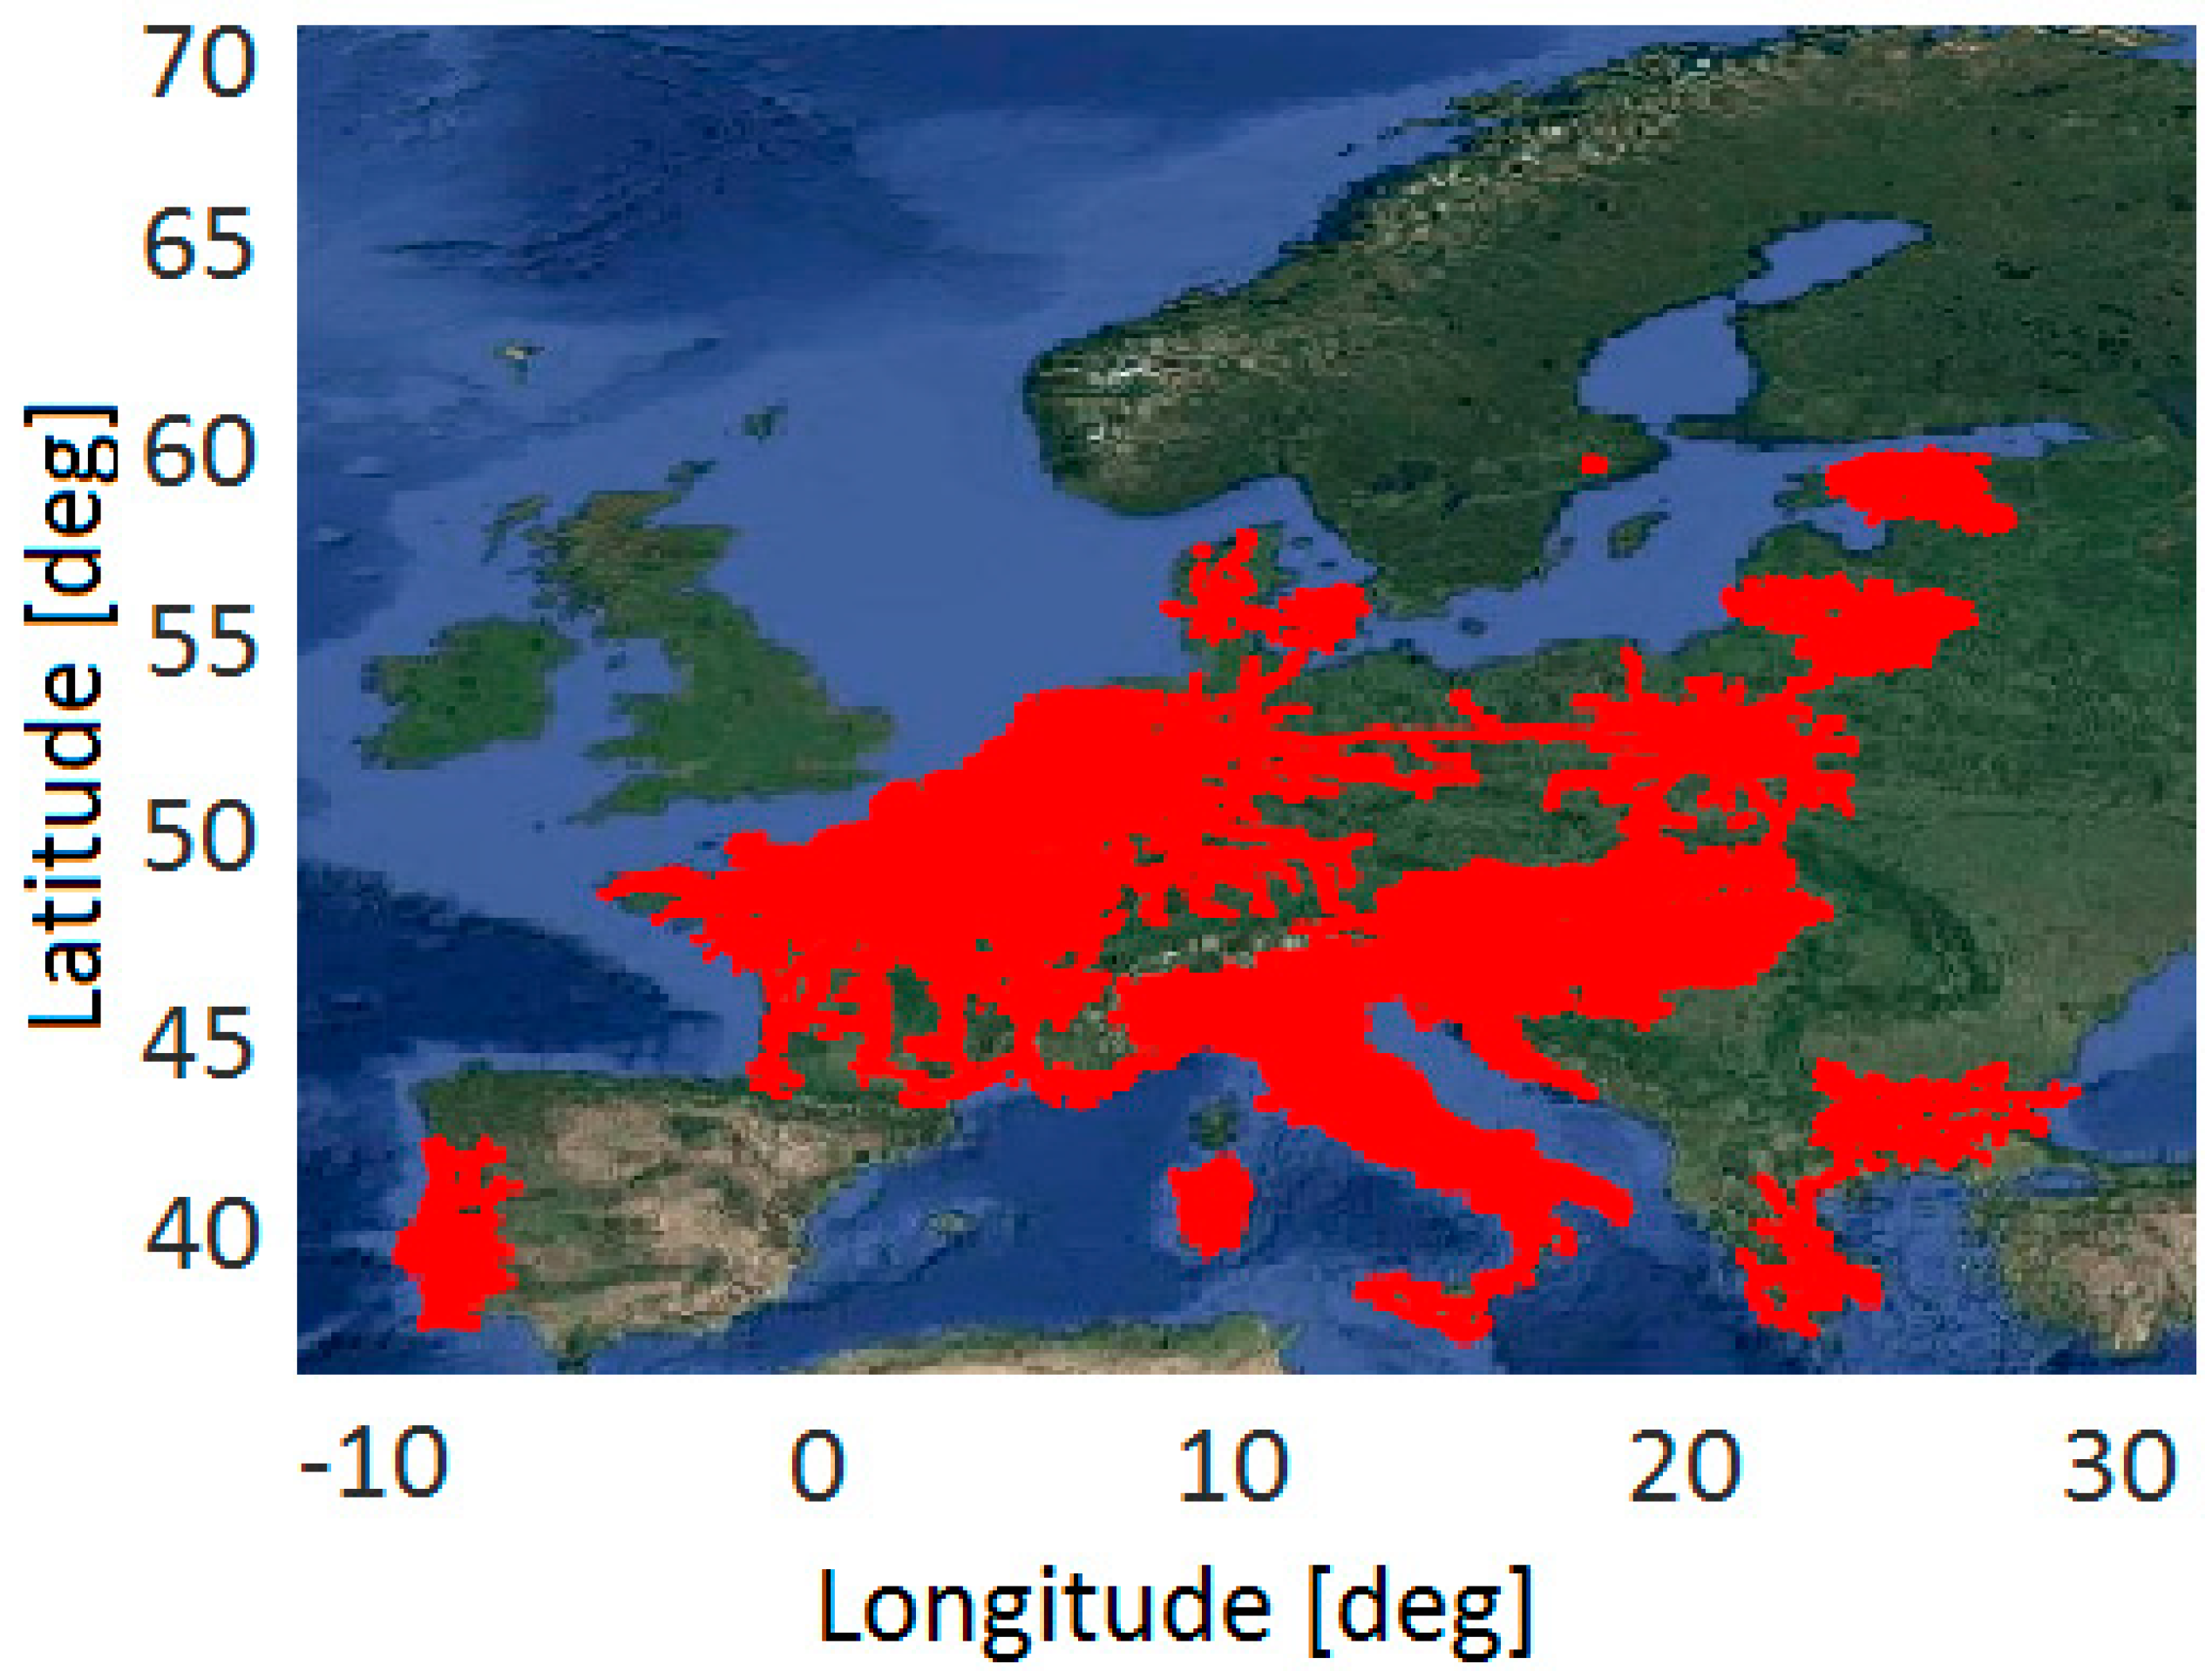
This work presents in-vehicle battery durability performances of different electrified vehicles and usage conditions. The work relies on performance-based models [10,11,12,13,14,15,16,17] retrieved from literature and implemented in the EU JRC Transport tEchnology and Mobility Assessment (TEMA) platform [18], developed to explore the potential of big data in support to transport policy assessments. The work is an extension of [19], where EU-wide scale mobility driving patterns from conventional fuel vehicles [20] are the inputs for TEMA. They consist of twenty databases of navigation data for a total of 691,751 monitored vehicles, 10.7 million trips and parking events, 146.7 million kilometers, and 2.8 billion records [21,22,23]. Figure 1 shows the European map of the cleansed database records, reporting 1.66 billion red dots. This map is intended to be purely indicative, aiming at visualizing the geographical extension of the available databases [20].
The results of this work and the flexibility shown by the TEMA battery aging analyses contribute to informing the discussion on the new vehicle global technical regulation (GTR) on in-vehicle battery durability under development within the United Nation Economic Commission for Europe (UN ECE) Electric Vehicles and Environment Informal Working Group (EVE IWG). This group is one of the IWGs of the Working Party on Pollution and Energy (GRPE) [24] subsidiary body of the World Forum for Harmonization of Vehicle Regulations (WP.29) that prepares regulatory proposals on pollution and energy efficiency.
2. Background Information and Methodology
2.1. TEMA Platform
JRC TEMA [18] is a modular big data platform designed to reproduce mobility behaviors of vehicles from datasets of trips collected on conventional fuel vehicles by means of GPS [21,22,23]. It is used to quantify the possible impacts of new vehicle technologies on real-world mobility and develop scenarios to assess the impact of policy actions in transport [25,26,27,28,29,30,31,32]. A comprehensive overview of TEMA with applications and results is provided in [18]. The platform has been extended with the calendar and cycle capacity fade models [3]. The advantage of adopting TEMA for estimating the capacity fade of lithium-ion batteries is that the platform allows for combining state-of-the-art cycle and calendar fade models with large-scale real-world driving data representative of thousands of vehicles and millions of kilometers [20,33]. This enables the simulation of a large variety of EV deployment scenarios with different driving styles, recharge patterns, vehicle architectures, and environmental conditions. This work focuses on six province areas: Modena (IT), Florence (IT), Amsterdam (NL), Brussels (BE), Paris (FR), and Luxembourg (LU), mostly or exclusively including passenger vehicles, as reported in Table 1.
2.2. Battery Aging Models
Battery degradation is the result of electrochemical aging, a process that degrades the electrical, chemical, and mechanical properties of a cell. Several performance-based models from the literature [11,12,13,14,15,16,17] have been implemented in TEMA. The different combinations of models to calculate the capacity and power fade of three different cell chemistries, LiFePO4, NCM (LiNi1/3Co1/3Mn1/3) +spinel Mn and NCM- LMO (LiNi1/3Co1/3Mn1/3 +LiMn2O4) are reported in Table 2. These models are typically calibrated using experimental datasets and despite the fact that their validity is confined to the boundaries of the experimental data used for calibrating the model, performance-based models can provide good results that highlight the direct link between aging and its influencing factors [34]. Details information for all the aging models implemented in TEMA are reported in [3]. TEMA has also been generalized for using fitting coefficients of calendar and cycling aging cell test data with given equations and parameters.
This work focuses on the capacity fade according to Model 5 of Table 2, where the calendar aging of NCM is given by [14,15] and the cycling aging by [16]:
where Qloss-calendar is the calendar loss, Qloss-cycle is the cycling loss, T is the cell temperature in K, t is the calendar time in days, Ah is the total ampere-hours exchanged by the battery and SOCmin is the minimum State of Charge value reached during the cycle.
The total capacity fade is calculated as net of the capacity fade reserve. This is a region of the SOC that is used to balance the loss of capacity of the cell during the first life. The total capacity fade of the vehicle is, therefore, calculated as per Equation (5), which considers calendar aging and cycle aging as additive components of total aging, according to [17,35,36]:
The capacity fade models adopted in this work describe cell-level operation phenomena. A series of assumptions, as described in [3], are applied to scale them up at the vehicle-level in order to be combined with activity data within TEMA and simplify a complex phenomenon as the in-vehicle battery durability. TEMA model aging results have been compared with real-world data from the field, showing a good agreement in end of life (EoL) years estimates [3,34].
2.3. Reference Vehicles, Battery Architectures, and Recharge Strategies
To assess the battery durability performance, the authors considered in this work five reference battery packs associated with vehicle architectures available on the market. The vehicles are generically labeled as PHEV (Plug-in Hybrid Vehicle) 1, 2, and 3 (PHEV-1, PHEV-2, PHEV-3), and BEV (Battery Electric Vehicle) 1 and 2, (BEV-1, BEV-2). PHEV-1 adopts a T-shaped battery pack of 192 pouch cells (2P-96S electric architecture) for a total of 16 kWh nominal capacity, PHEV-2 adopts a parallelepiped battery pack of 95 prismatic cells (95S electric architecture) of 8.8 kWh nominal capacity, PHEV-3 adopts a parallelepiped battery pack of 80 prismatic cells (80S electric architecture) of 12 kWh nominal capacity, BEV-1 adopts instead a parallelepiped battery of 192 pouch cells (48S‑2P‑2S electric architecture) for a total of 24 kWh nominal capacity, while BEV-2 has a flat battery pack, sometimes referred to as “skateboard”, of 6912 cylindrical cells (16S-72P-6S electric architecture) for a total of 85 kWh nominal capacity. Each battery is assumed to have a beginning of life (BoL) usable energy equal to 75% of the nominal capacity, i.e., 12 kWh for the PHEV-1, 6.6 kWh for the PHEV-2, 9 kWh for the PHEV-3, 18 kWh for BEV-1 and 63.75 kWh for BEV-2. Each battery is considered to reach its EoL when the usable energy becomes equal to 80%. In addition, each battery allows for an energy reserve value equal to 25% of the nominal capacity for PHEVs and 15% of the nominal capacity for BEVs. Table 3 reports the assumed usable energy criteria for the reference vehicles together with their distance-specific energy consumption from real drive-tests [37,38,39]. The presented results should not be taken as definitive predictions for their durability, neither must they be intended to specifically address these vehicles because of their different battery chemistries in respect of those considered in this work and the several assumptions made to address this complex phenomenon.
TEMA replicates the driving behavior from the selected datasets in combination with recharge behavioral models, which aim at representing the most likely recharging behaviors, depending on the individual choices of the driver and on the recharge infrastructure available. Among the sixteen strategies of TEMA [19], three are presented in this paper, as reported in Table 4. Strategy 1 (Long-Stop Random AC) requires a vehicle stop longer than 120 min. It is assumed that charging uses conventional Italian recharge infrastructure (i.e., AC, single-phase at 3.3 kW, IEC 62196 Mode 1/2 [25]), and it is representative of a recharge that can take place at home or wherever the vehicle is subject to a long parking event (e.g., offices, shopping malls, airports, or train station parking lots, etc.). The recharge power is scaled down to a constant value of 2 kW to account for the recharging profile (i.e., power modulation applied from the vehicle), and the recharge is subject to a random-generated threshold parameter between 0 and 1. Recharging is assumed to occur if this number is higher than 0.6 (i.e., 40% of the probabilities). This random threshold represents three possible situations: There is no recharge station where the vehicle is parked, the recharge station is not available, or the driver does not connect the vehicle to the recharge station (forgets or chooses not to recharge). Strategy 2 (Short-Stop Random DC) requires a vehicle stop longer than 20 min, (i.e., short-stop) and the recharge is done with high-power DC (55 kW, IEC 62196 Mode 4, [25]). The random threshold is the same as per Strategy 1, and charging is only assumed to occur in 40% of stops. It is representative of the recharge that could take place in parking lots equipped with fast-charging devices. In this case, the recharge power is scaled down to a constant value of 40 kW to account for the recharging profile. Strategy 3 (Night AC) recharges a vehicle when it is parked in a specific time window between 22.00 and 07.00, and the parking event is longer than 4 h. No random threshold is applied. The recharge is applied in AC (3.3 kW, IEC 62196 Mode 1/2, [25]), and the power is scaled down to a constant value of 2 kW, as in Strategy 1. The Night AC (Strategy 3) represents the typical recharge that might happen overnight at home. The charging efficiency has been set equal to 95% [25] for all strategies, according to measured values [38].
2.4. Ambient Temperature
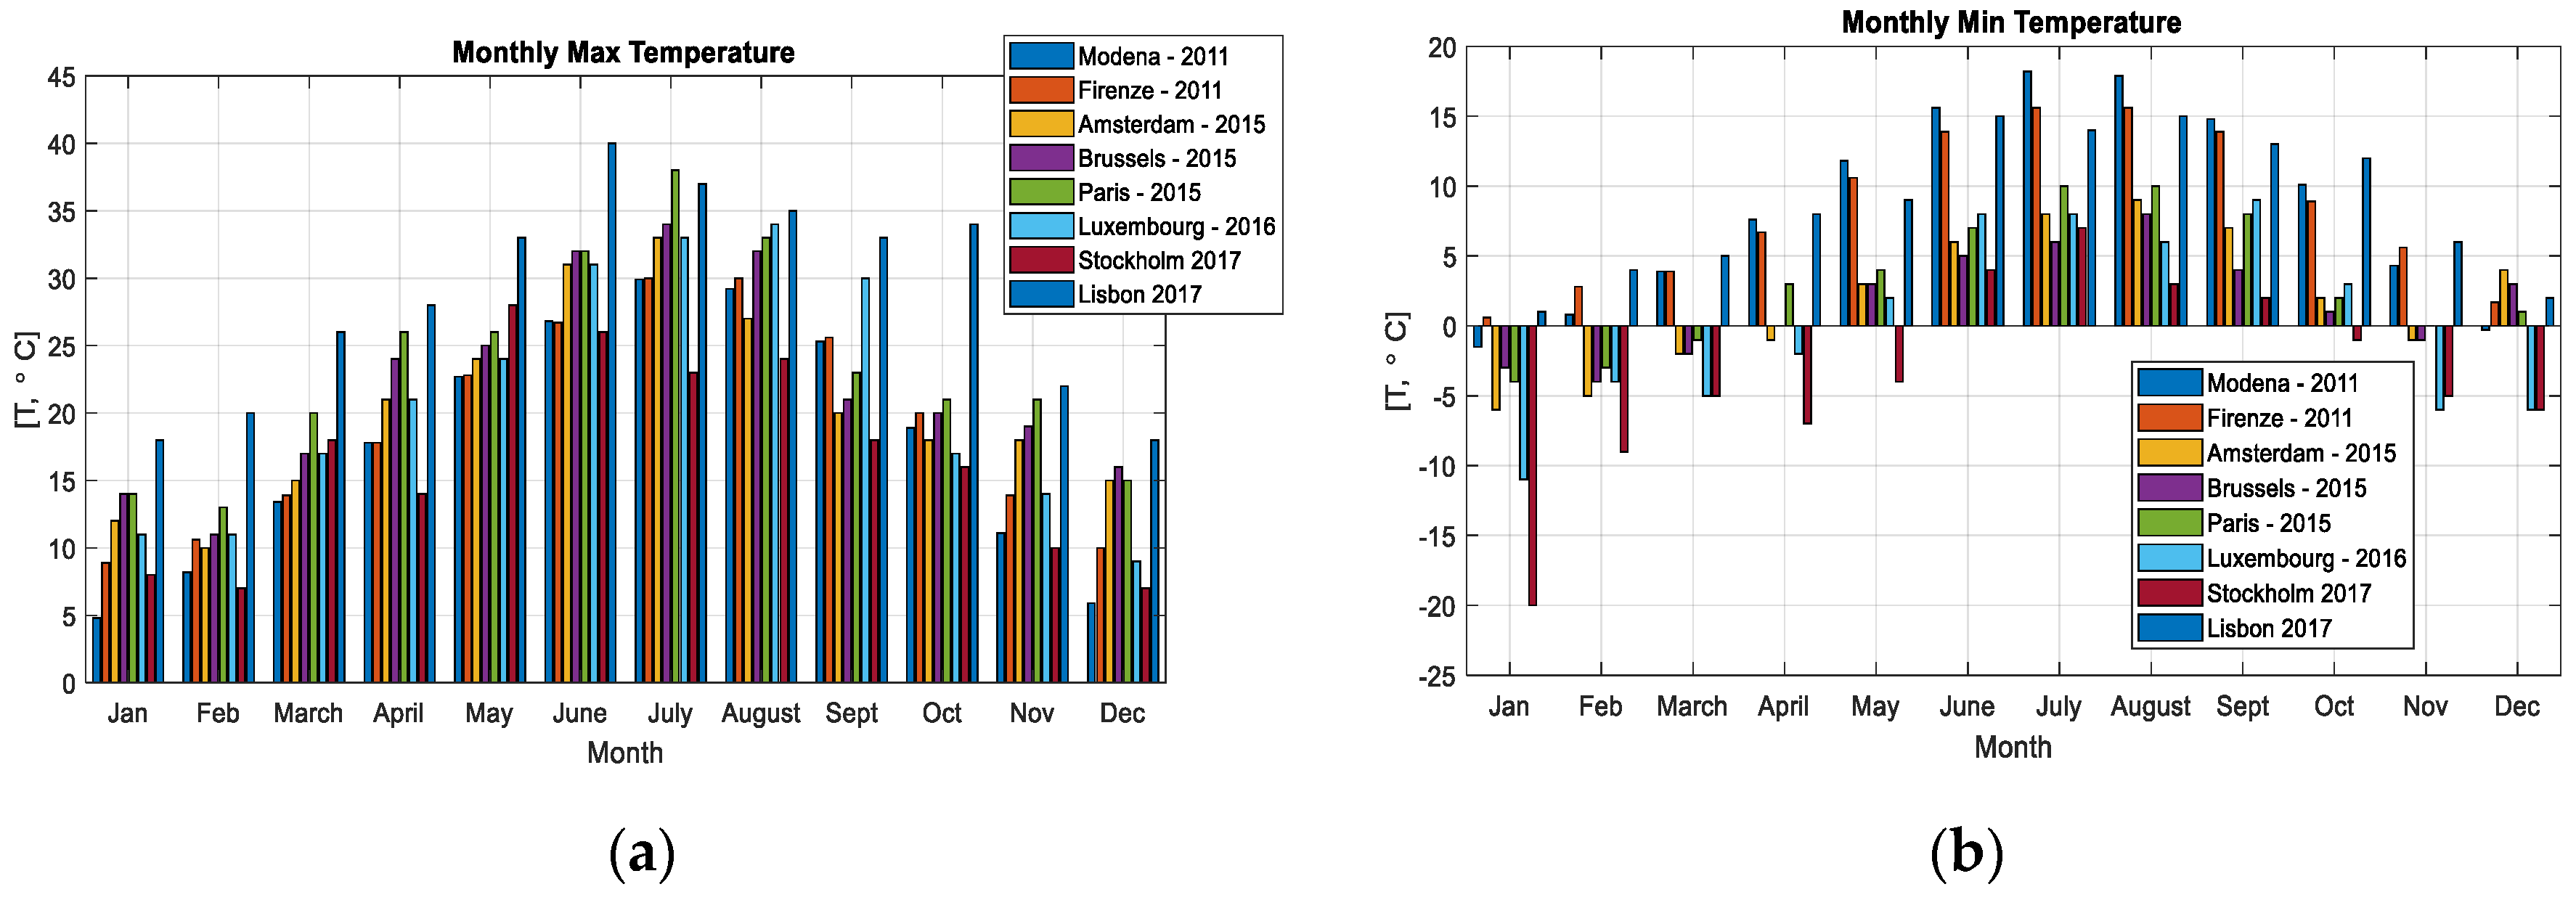
Figure 2 depicts the monthly maximum and minimum temperatures in several province areas for the year during which the data have been collected [40]. Moreover, the monthly temperatures referring to Stockholm and Lisbon have been included in the plot being them used for studying the effect of cold and warm environmental temperatures on the in-vehicle battery durability. Analyzing Europe as a whole, in the first week of March 2015, the average minimum temperature was around 0 °C [40] in Amsterdam, Brussels, and Paris. Moreover, the average maximum temperature was 9 °C in Amsterdam, 14 °C in Brussels, 12 °C in Paris. Paris has slightly higher temperatures in comparison to the other provinces.
3. Results
3.1. Mobility Patterns in Different EU Geographic Regions
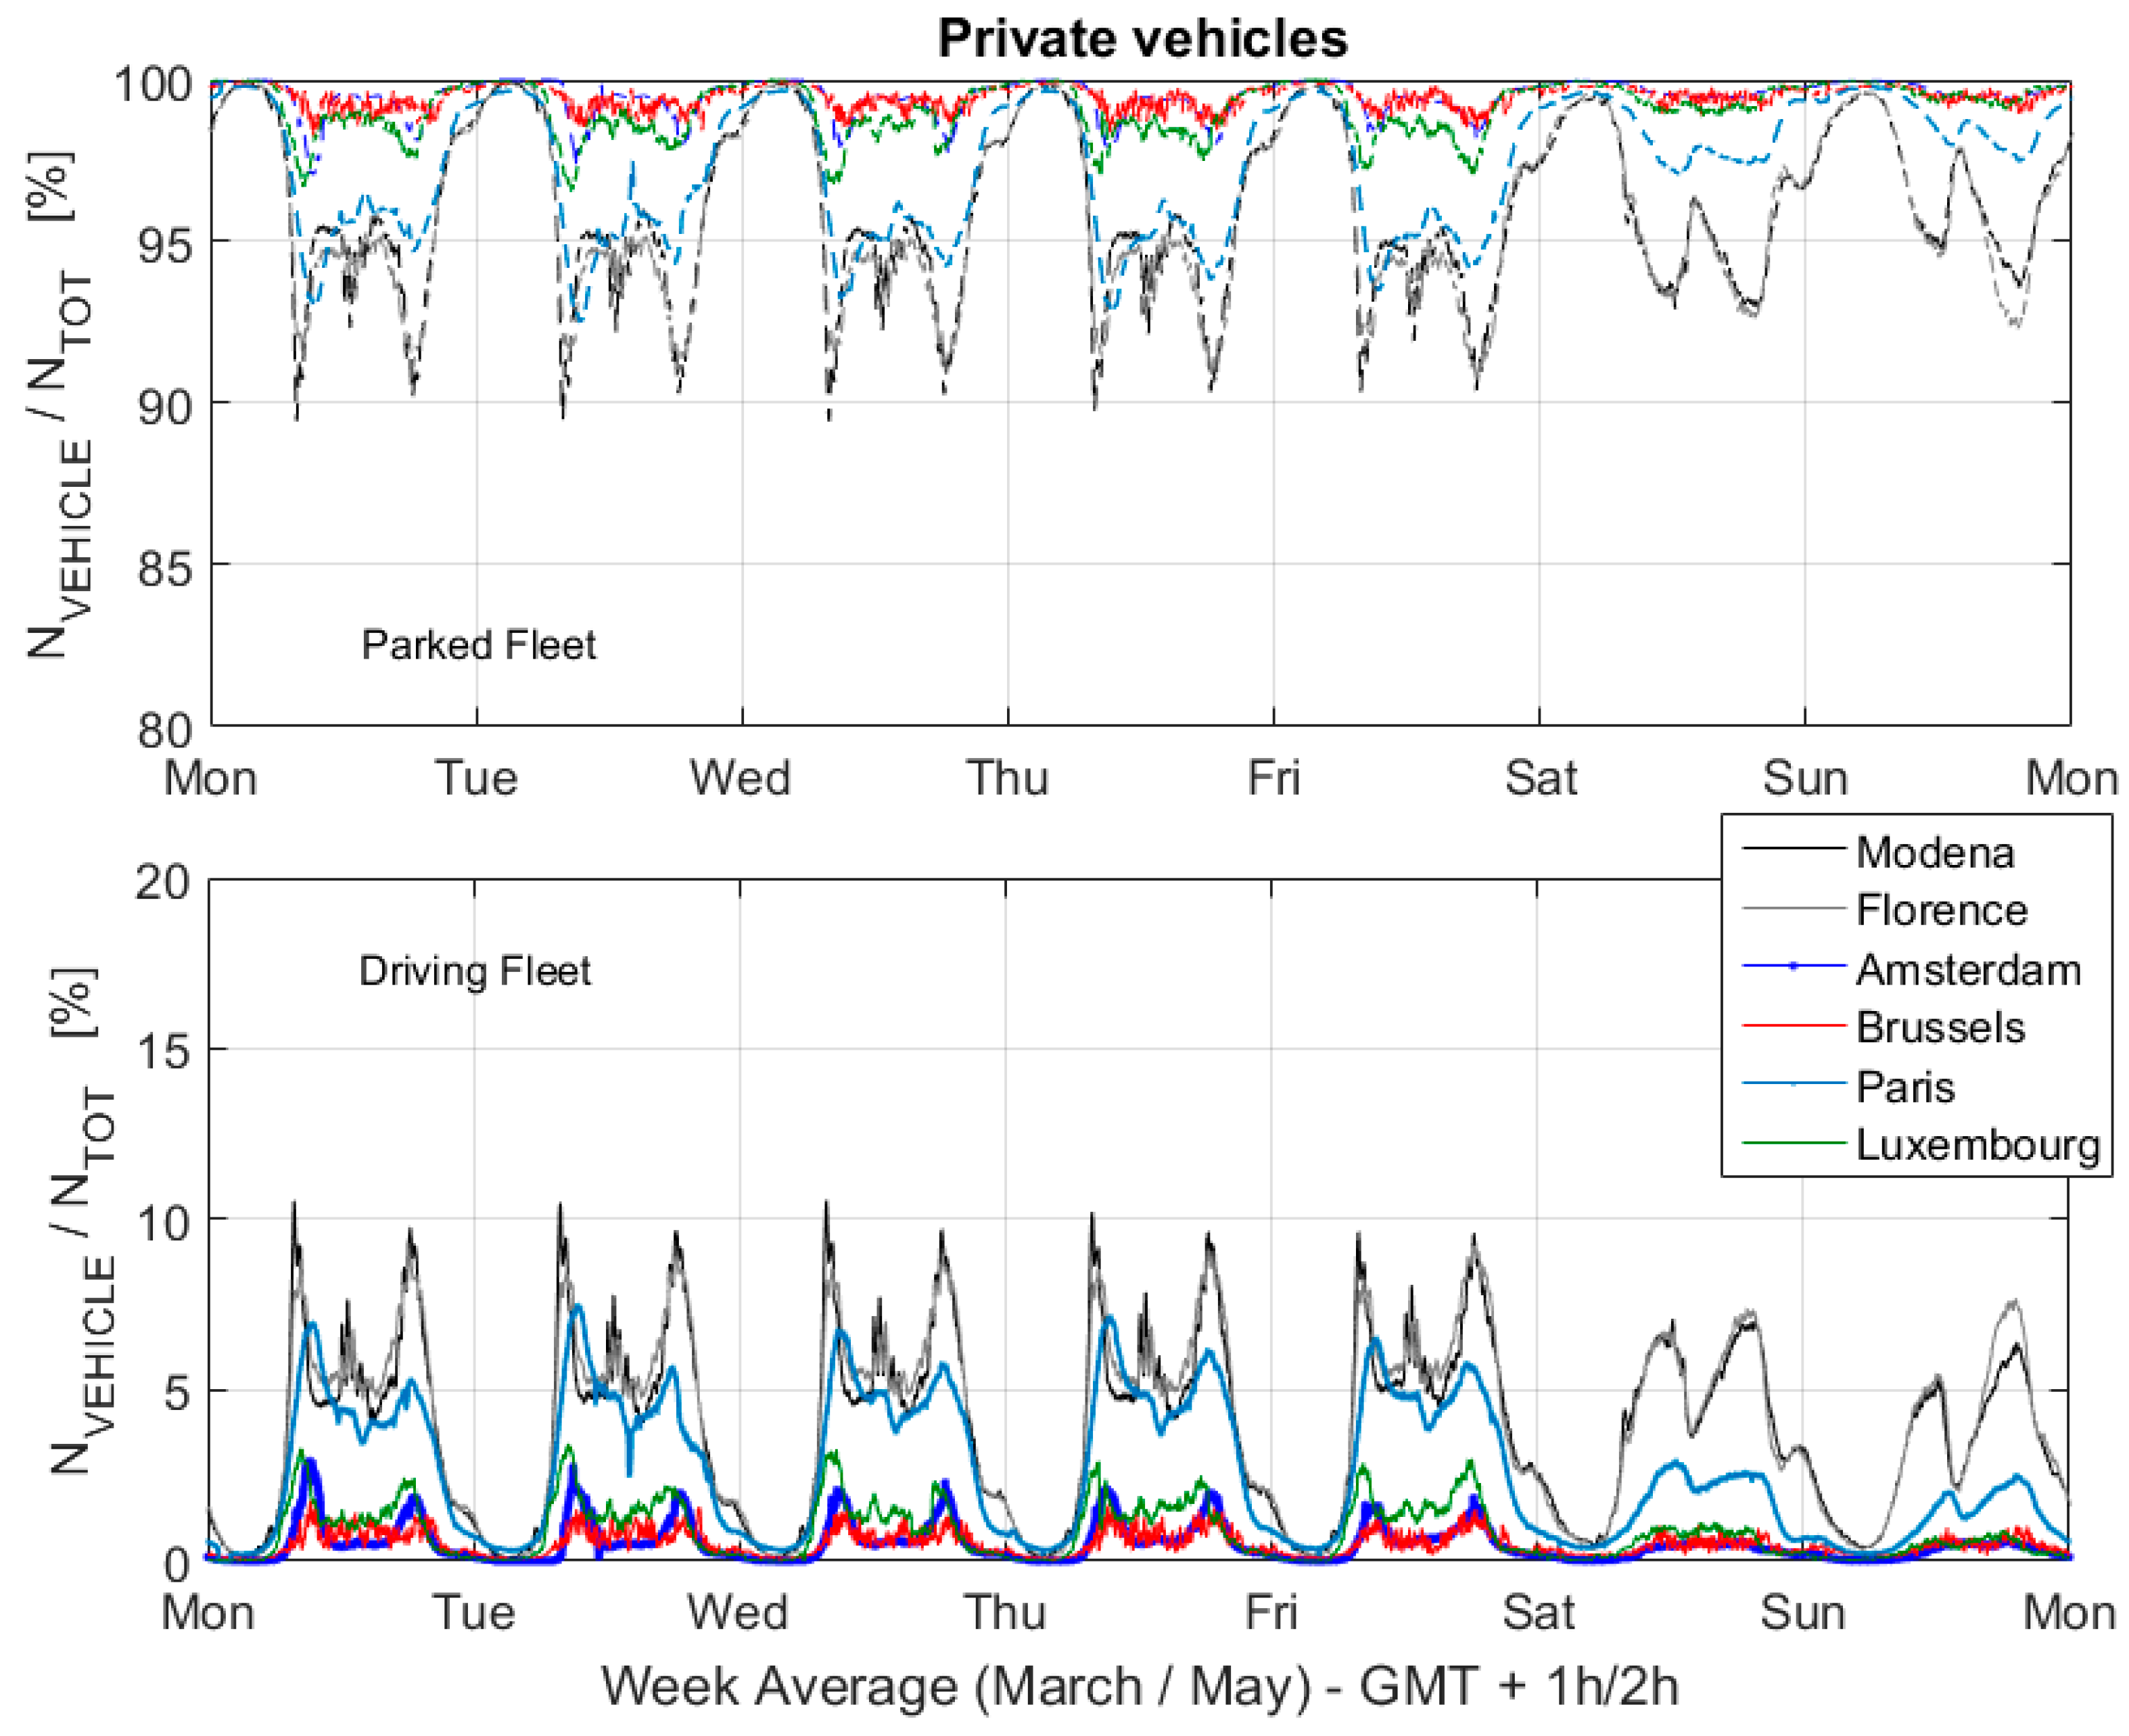
Figure 3 depicts the share of the fleet parked (top) and in motion (bottom) in the week from Monday to Sunday [20]. The top and bottom pictures are complementary. The derived mobility behavior of passenger cars is similar for all databases, periodically repeated in the days of the week, exhibiting three traffic peaks from Monday to Friday, i.e., in the morning (approximately at 7.30), at noon, and in the evening (approximately at 18.30). On the weekend (Saturday and Sunday), the shape of the curves is different, showing mainly two peaks, approximately at 12.00 and at 19.00. Some vehicles are in motion during late Saturday night, although values above 99% of the vehicles are always parked between 1 and 5 o’clock in the morning. The share of the vehicles in motion at the same time never exceeds 11.7% of the complete fleet for Modena and 10.4% for Florence, with a mean value of 4.3% for Modena and 4.5% for Florence. It is observed that Amsterdam shows peak values below 7% while Brussels, Paris, and Luxembourg well below 5% in line with [41,42]. Table 5 reports the main trip indicators for the analyzed data. The averaged trip has a length between 5 and 20 km, the averaged trip duration varies between 10 and 20 min and the trip speed varies between 26 and 54 km/h. The average parking duration lasts between 2 and 12 h. These values are average values on the full sample available in each dataset.
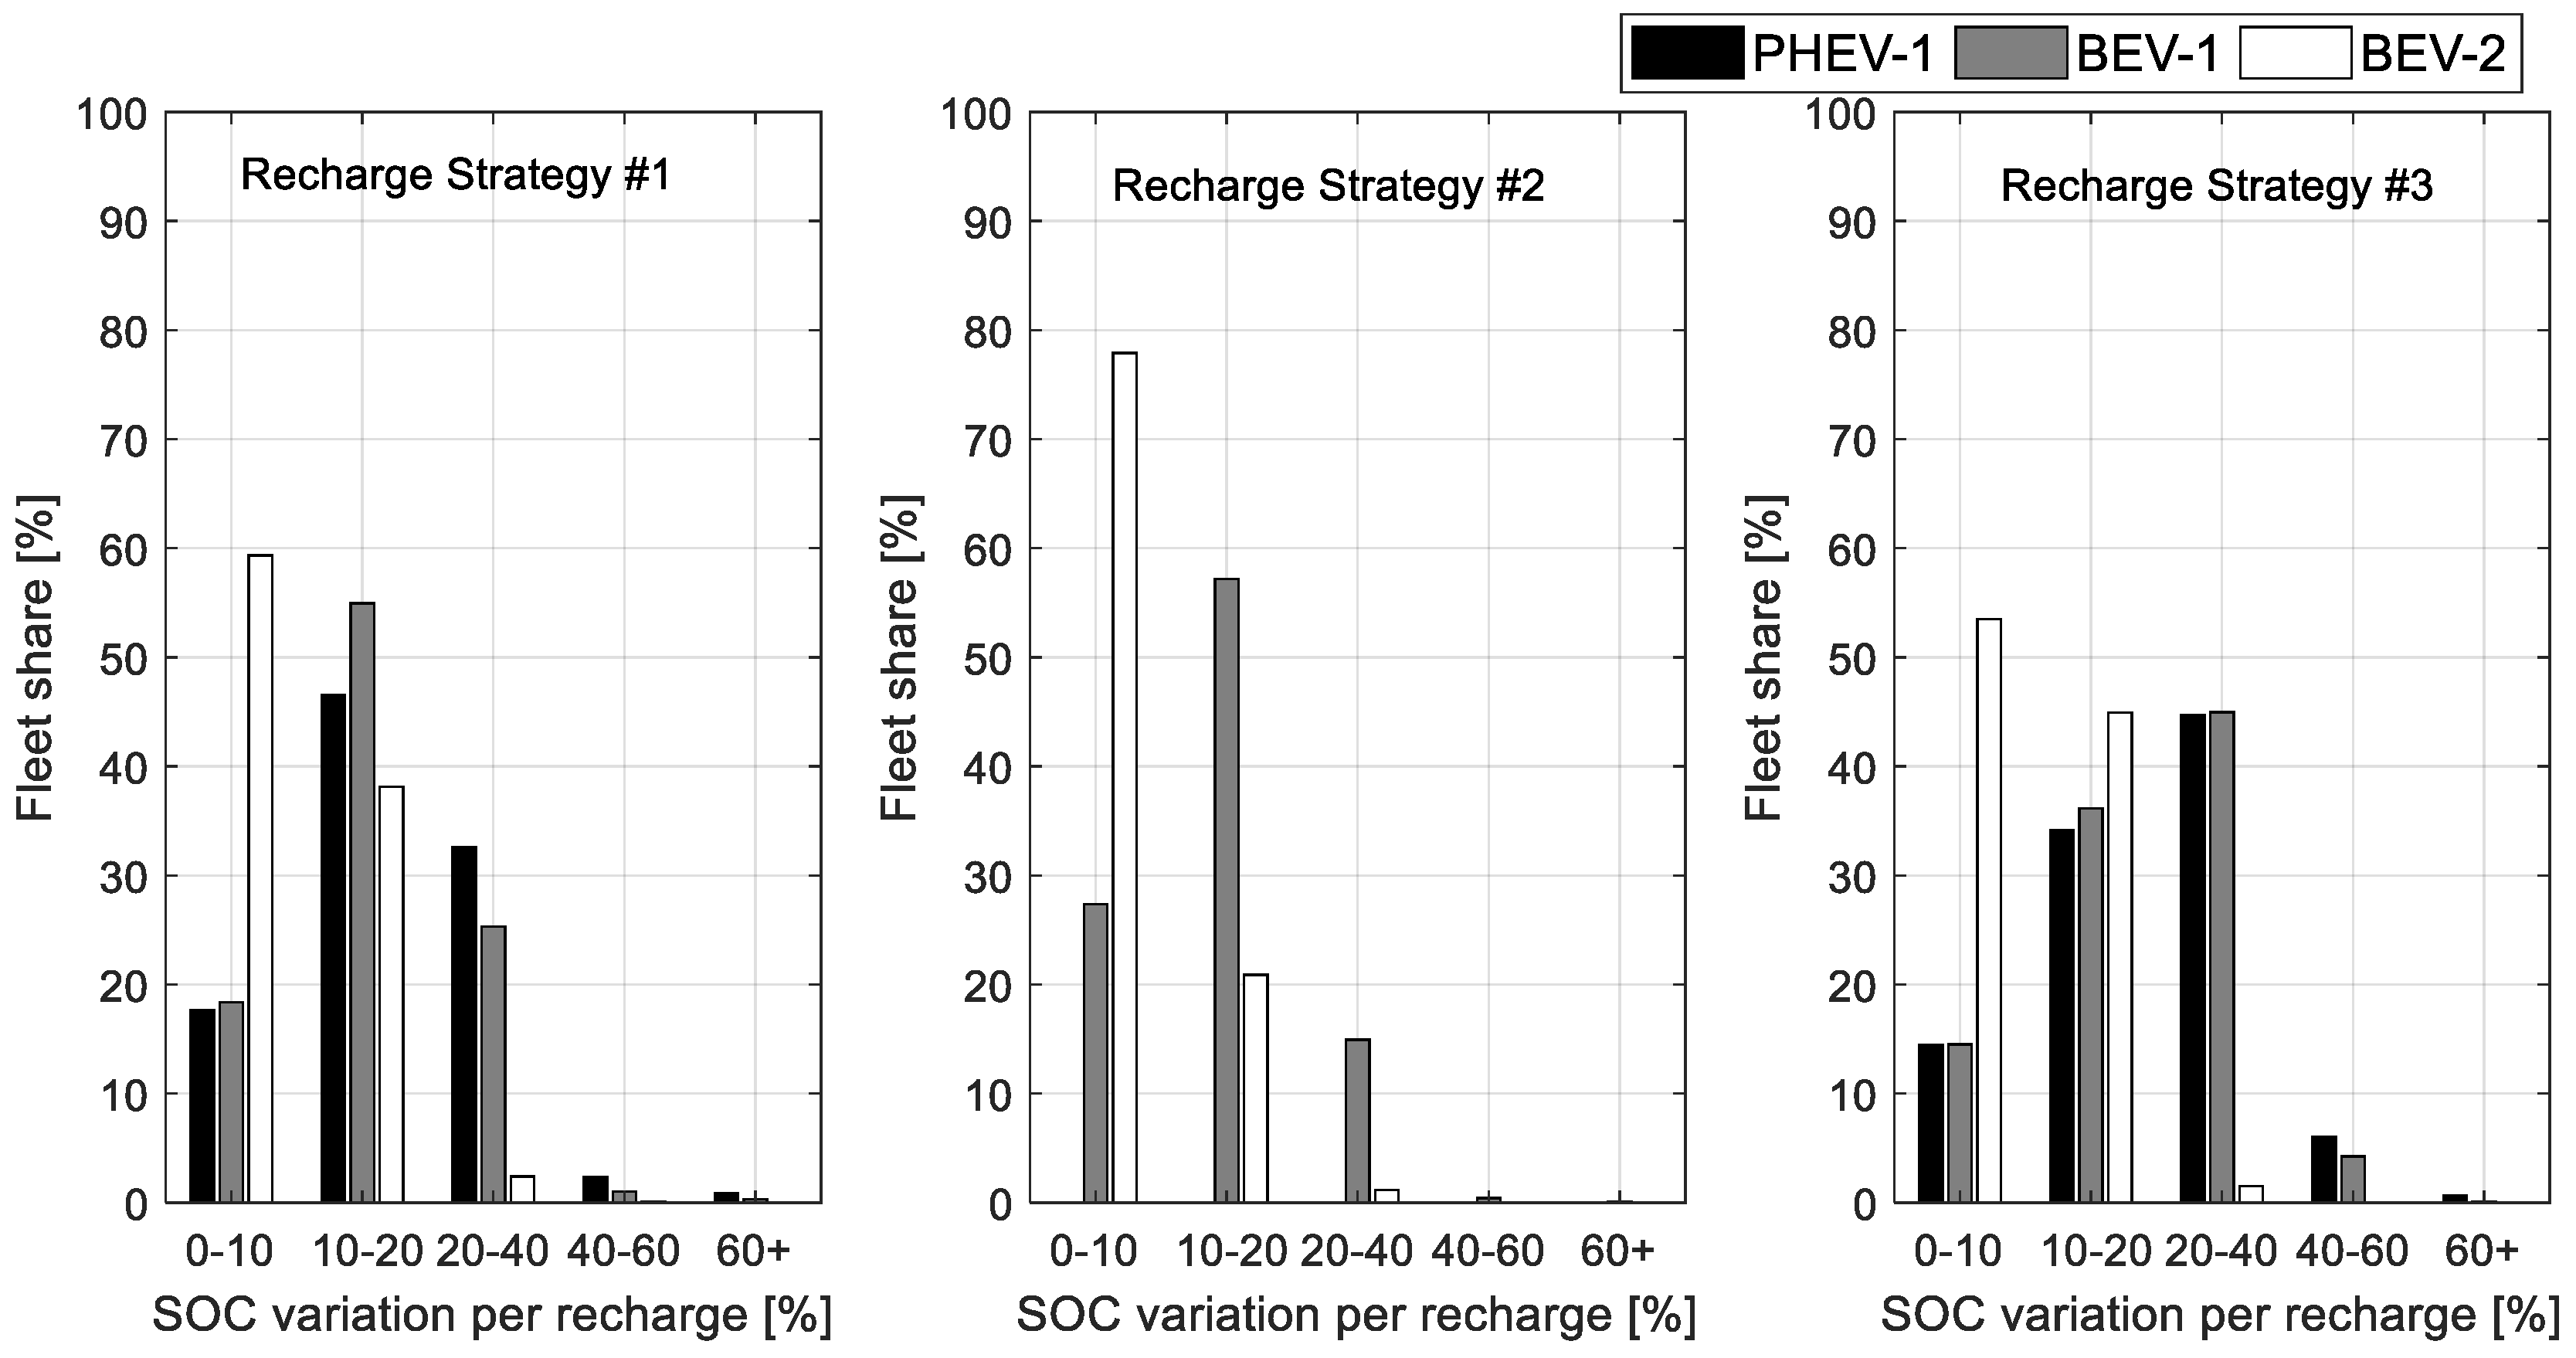
Following the approach depicted in [25], the work focuses only on the users that can drive all their trips electric on the analyzed time period. The results show that vehicles with larger battery packs accumulate greater electric kilometers, a higher number of electric trips, and a greater number of recharges per month, but not a high variation of the SOC per recharge due to their high battery capacity, as shown in Figure 4. For the majority of the vehicles, the number of trips ranges between 60 and 120 trips/month (i.e., 2–4 trips/day), with 15–30 recharging events per month in AC and 30–60 in DC [3].
3.2. Capacity Fade Results in Real-World Use Conditions
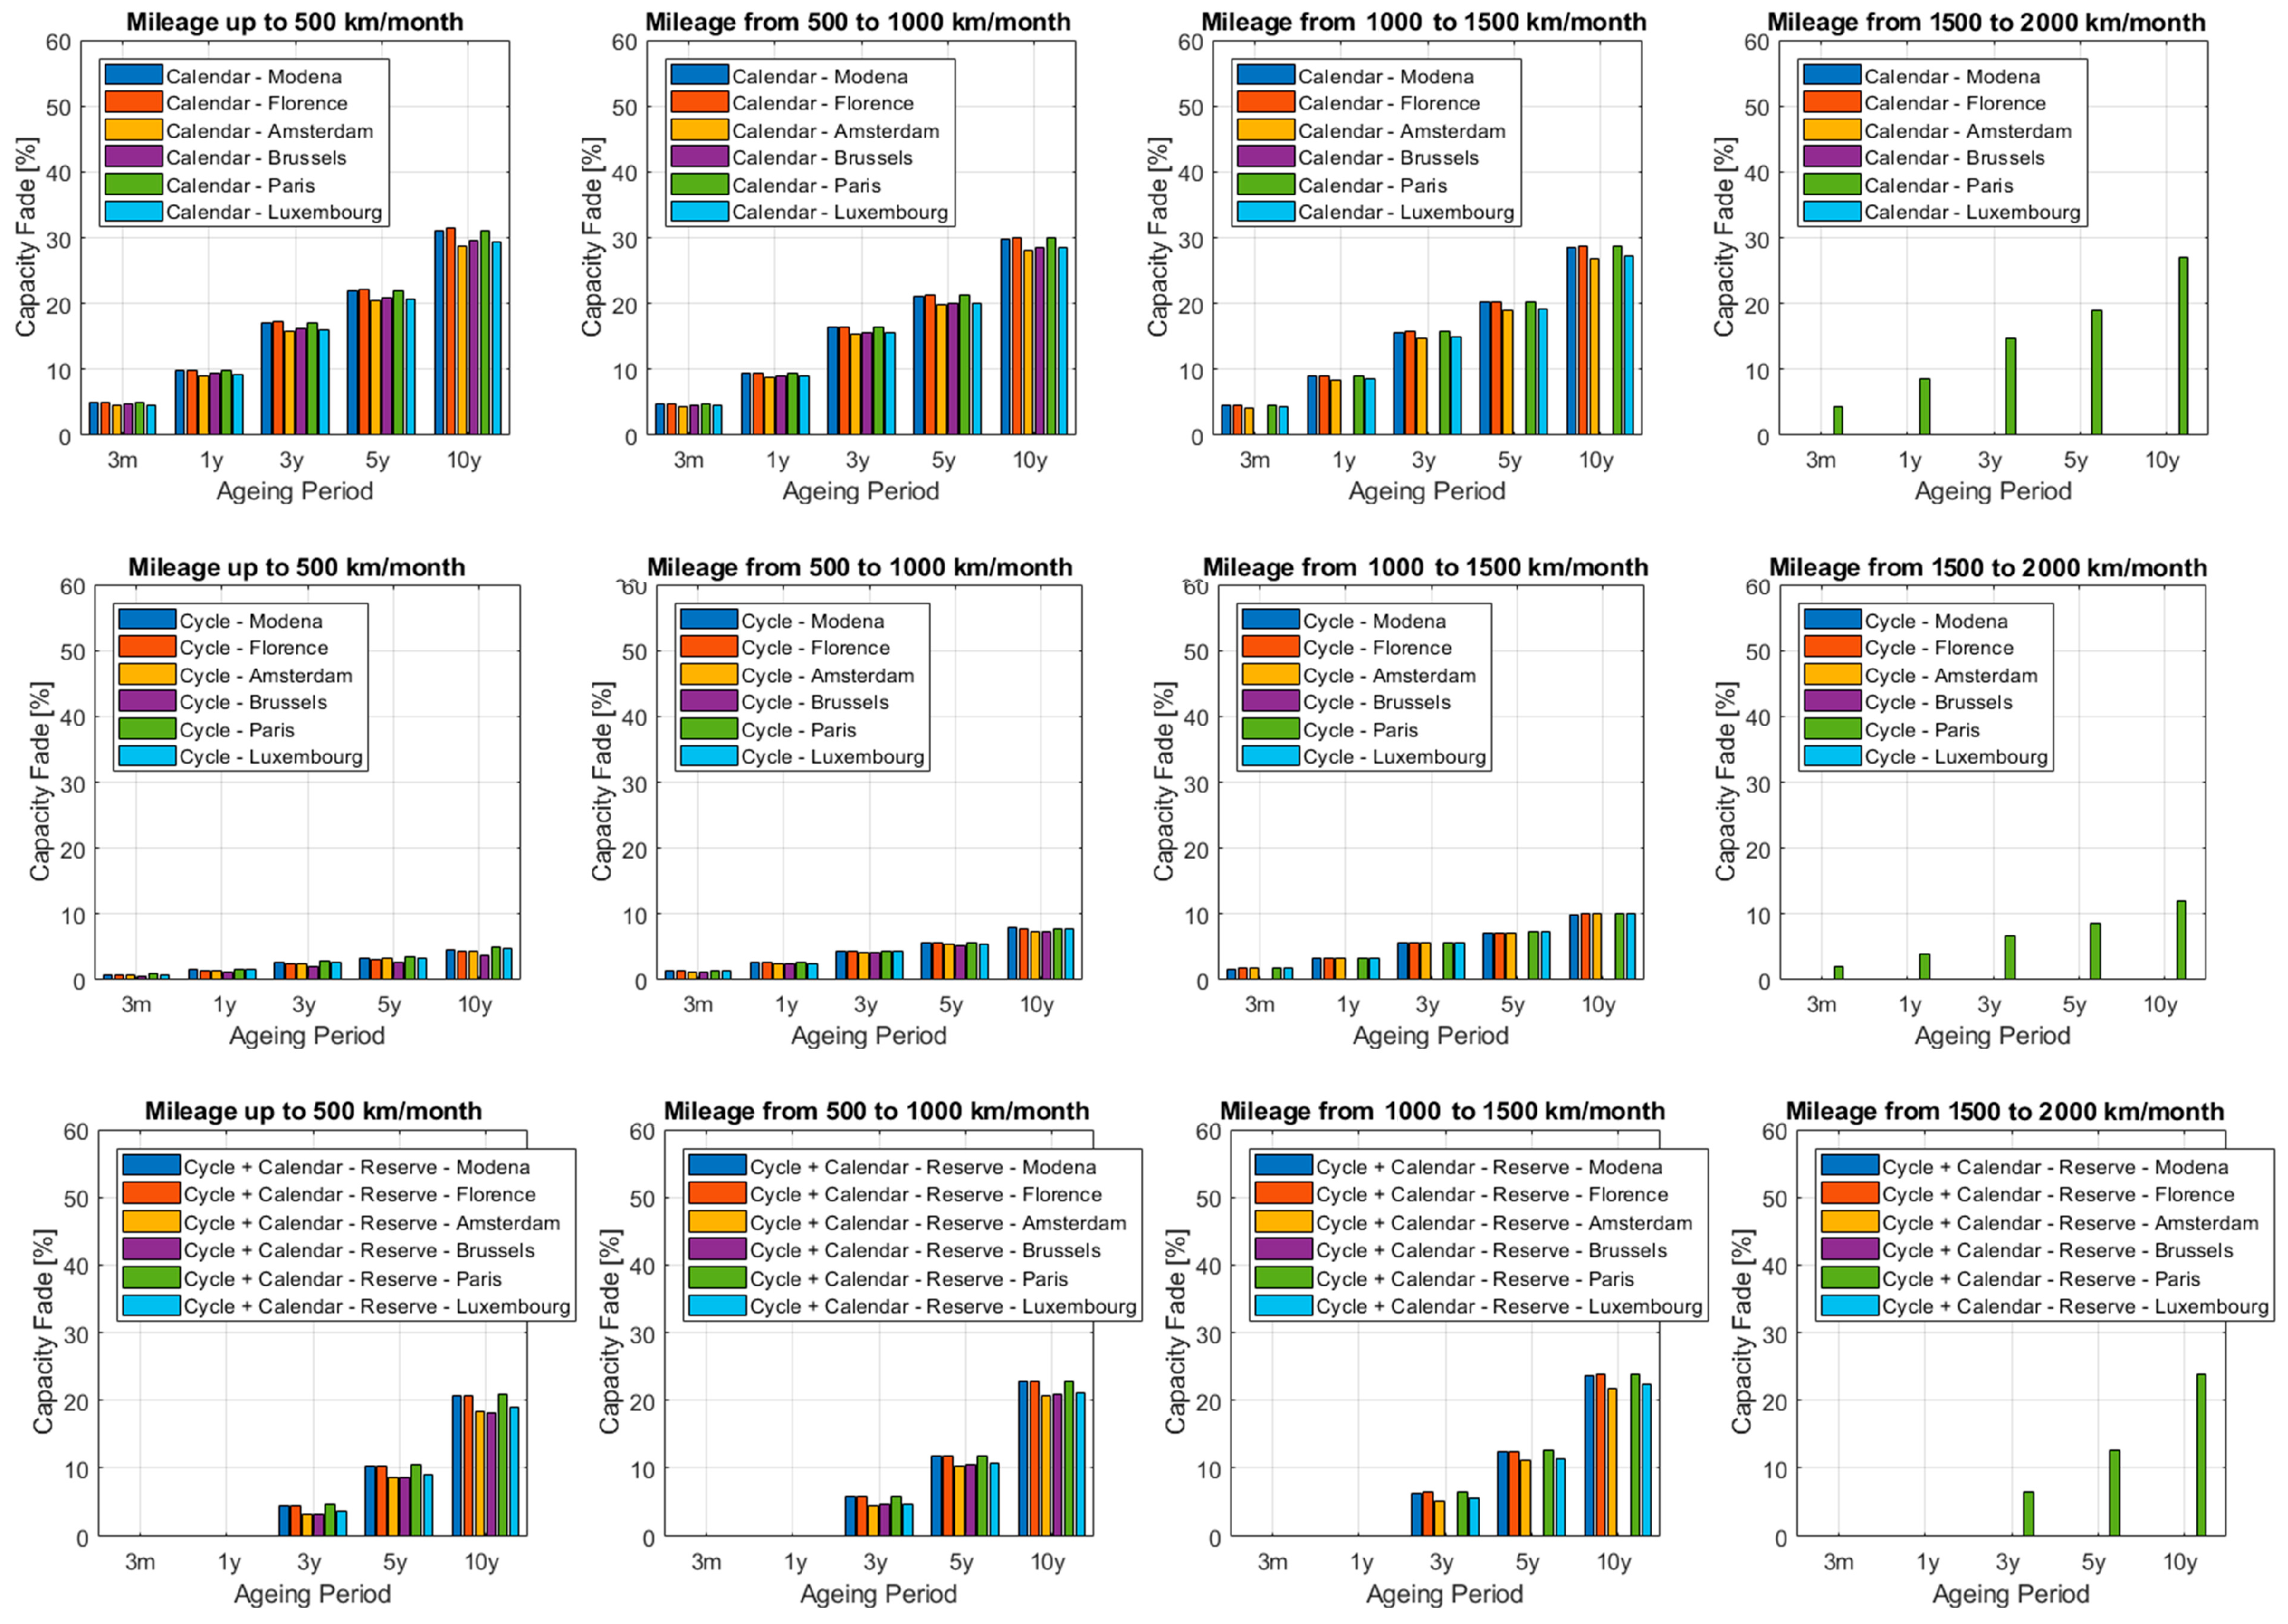
Figure 5 shows the calendar, the cycling aging, and the calendar plus cycle aging minus the reserve in the function of the years for the several provinces considered in the analyses, given the mobility patterns of each geographical area and temperature, as described above.
Figure 5 refers to the case of BEV-1 and Recharge Strategy 1 as an example. Each scenario is further broken down into five usage bins, representing different categories of users, e.g., from users that drive less than 500 km/month (6000 km/year), to users that drive more than 2000 km/month (24,000 km/year), and they are key elements for classifying the EoL performance. The usage bins corresponding to more than 1500 km/month are not present for most of the provinces, showing that the combination of these specific vehicle characteristics and recharge strategy does not allow driving long distances in the month. This might be possible considering a recharge strategy with a higher frequency of recharge and higher recharging electric power. The Battery Management System (BMS) that regulates the temperature of the battery is assumed active only during battery cycling, i.e., driving or charging the vehicle, and not during the calendar aging, i.e., vehicle parked without being charged. Hence, the environmental temperature of the areas has a larger effect on the calendar aging. The cycling aging is higher in the areas corresponding to higher average driven distance and charging power. Paris and Florence provinces correspond to a higher calendar and cycling aging in respect to the other geographical areas, given the same recharging strategy, due to the average long driving distance and characteristic environmental temperatures.
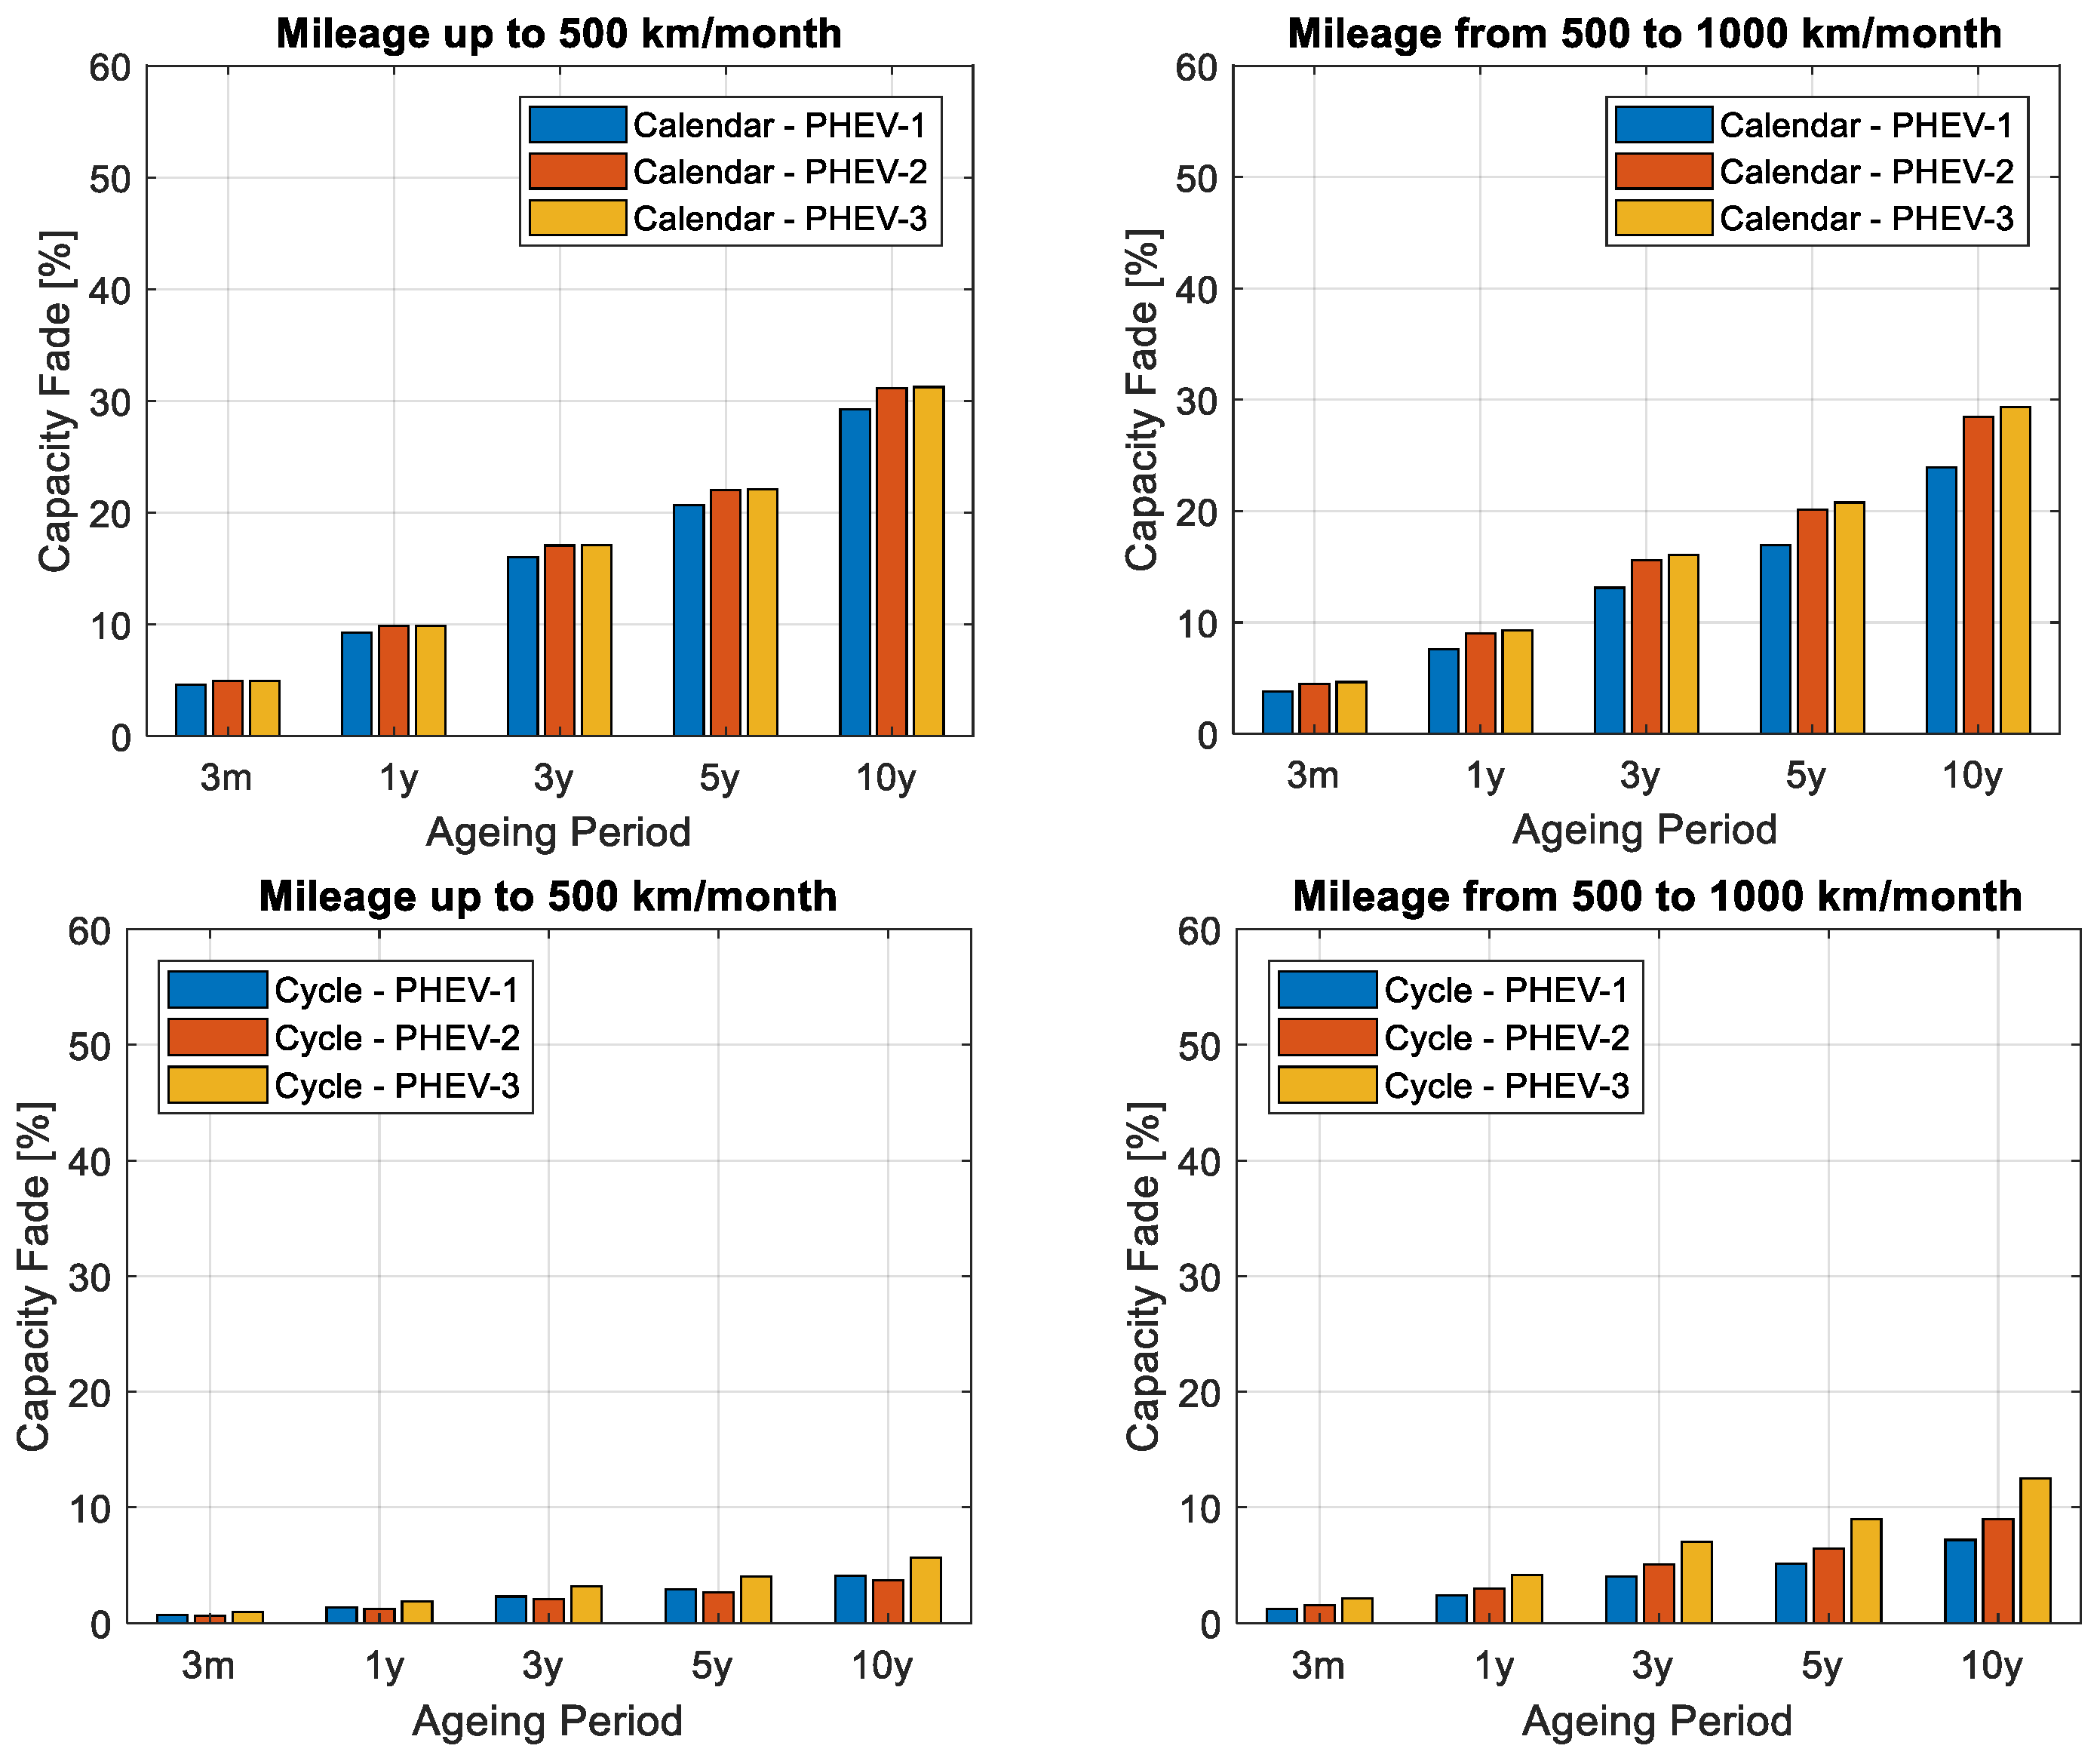
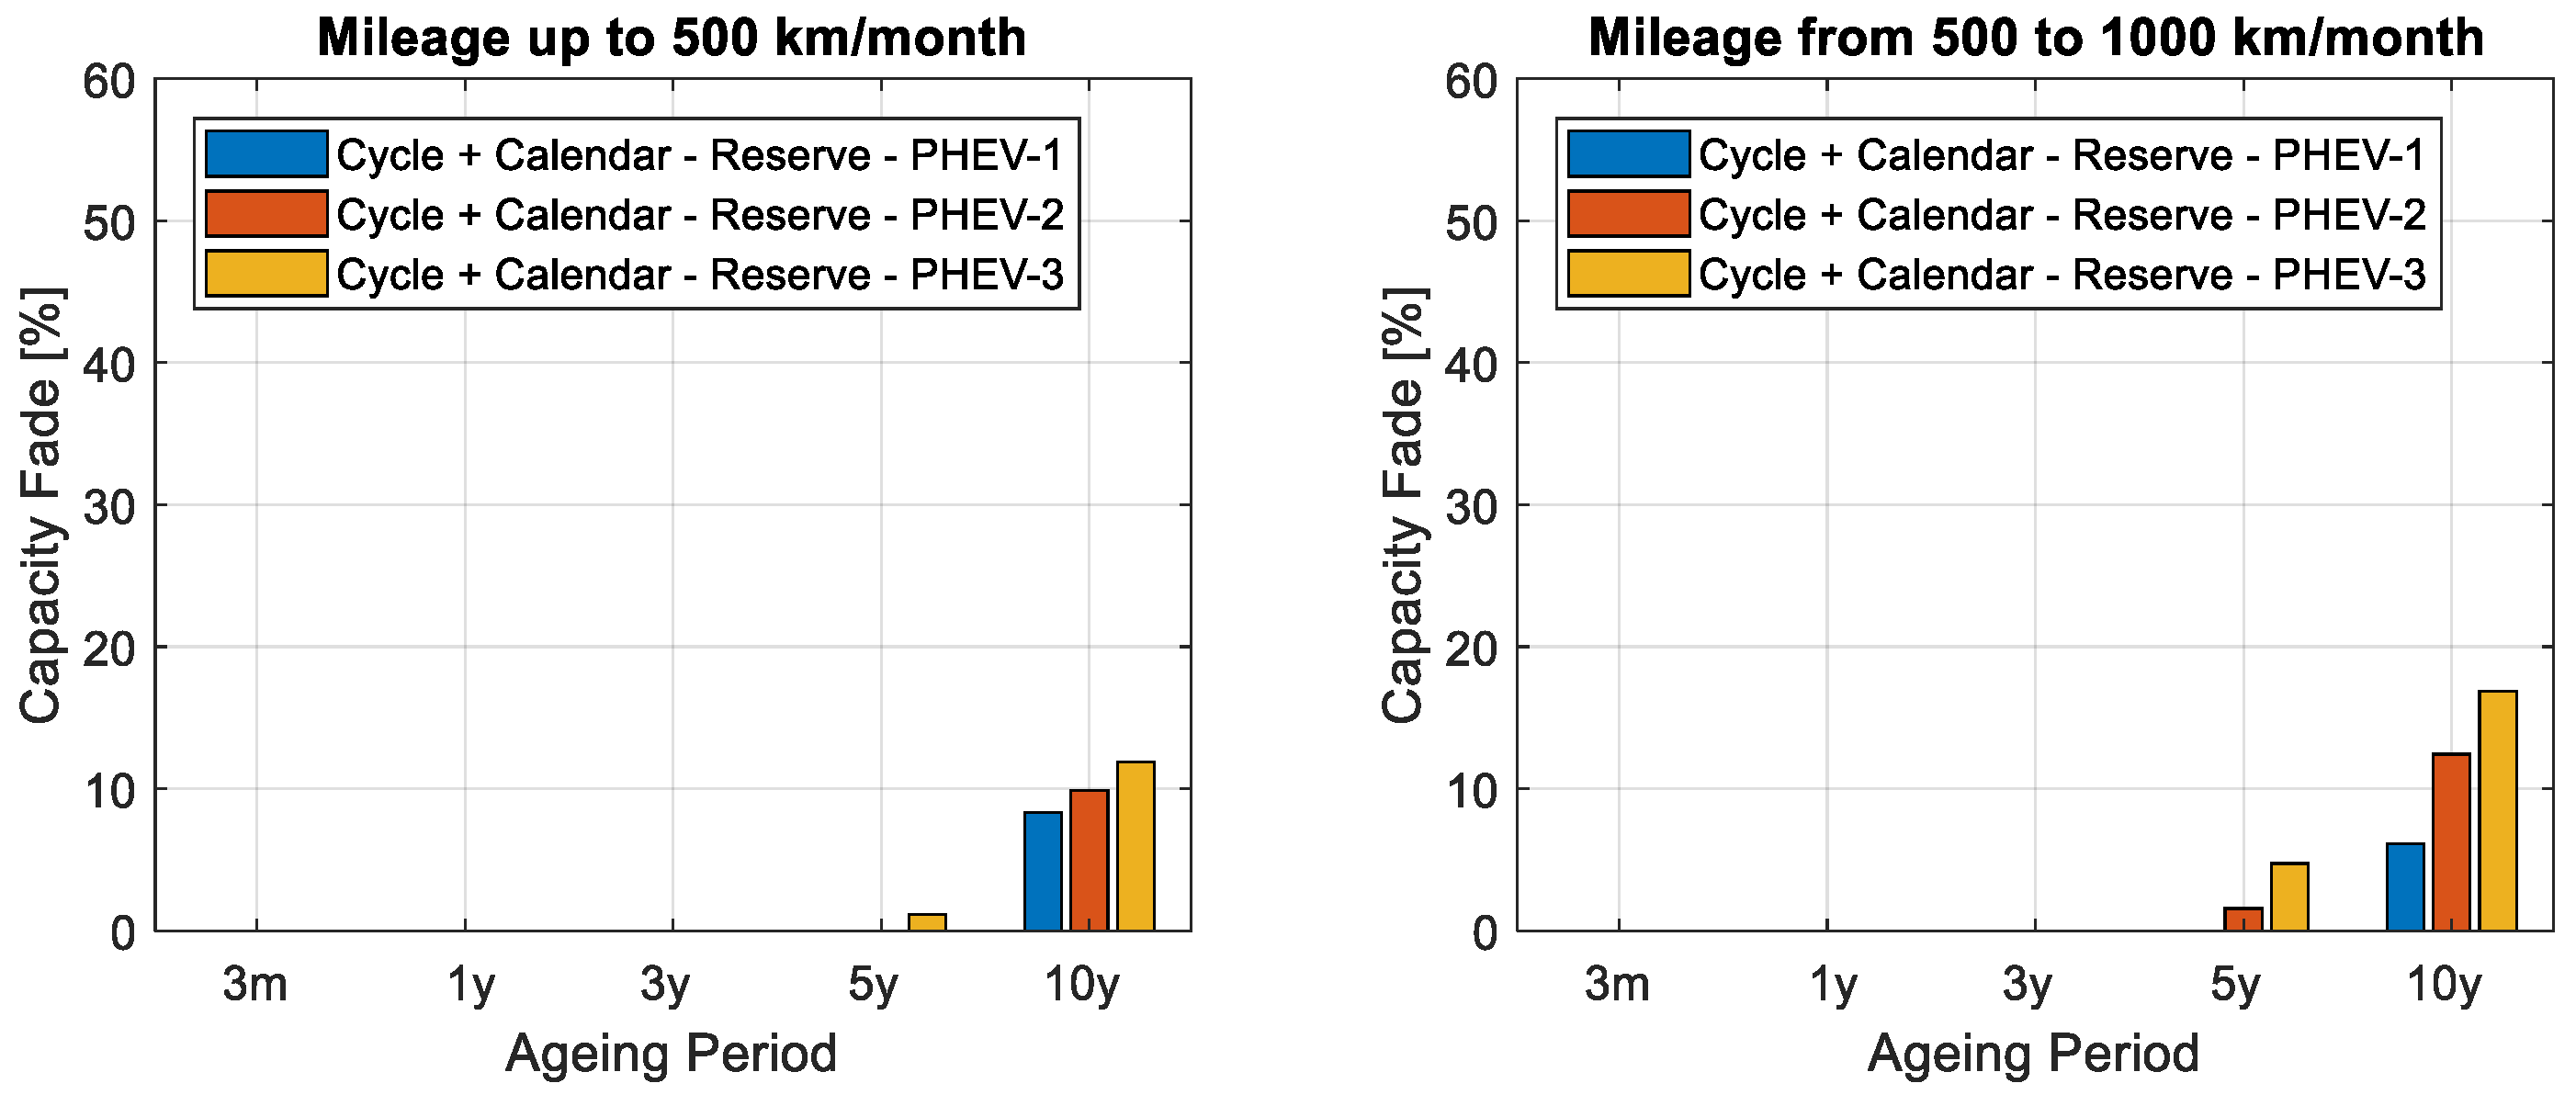
Table 6 presents the EoL estimates in years and the years needed to reach both 100,000 and 160,000 km of cumulative kilometers, per each recharge strategy, vehicle type, and geographical area. The predicted number of years needed to reach 100,000 km and 160,000 km of cumulative kilometers for a specific usage bin is calculated using average km per month of that user scenario. Each value is then colored red if it is below 5.0 years, yellow if it is between 5.0 years and 10.0 years, and green if it is above 10.0 years. The coloring criterion is purely arbitrary, with the sole aim of providing the reader with a simpler visualization of the results [3]. The results show that the users that drive up to 1500 km/month (i.e., first three bins) experience EoL beyond five years. It is interesting to note that through the first two bins, the capacity fade EoL criteria (<80% initial capacity) is normally reached before 100,000 km for BEV-1. Results for users in the third bin have EoL predictions that vary between the years to EoL and kilometers threshold, depending on battery architecture, charging strategy, and vehicle technology. Bins 4 and 5 are considered higher kilometer drivers, and EoL predictions suggest that the kilometer threshold is more likely to be reached before the capacity fade EoL threshold for all the scenarios. Red scenarios are only predicted for kilometers accumulation threshold for the considered battery chemistry. BEV-2 never shows a predicted lifetime below 10 years due to its battery architecture that optimizes the Ah-throughput and its large battery capacity. By comparing recharge strategy #2 (fast charge) with the other strategies (slow charge), aging is predicted to occur slightly more quickly with fast DC charging, though this does not seem to be a dominant effect for BEV-2. Figure 6 shows the calendar aging, the cycling aging, and the calendar plus cycle aging minus the reserve in function of the years of the three reference PHEVs for the province of Modena. High kilometers per month are not possible to be driven in pure electric mode by the PHEVs. Calendar aging is higher than cycling aging. However, for these chemistries and vehicle technologies, capacity fade is shown to become significant after more than 10 years. Aging appears to be higher for PHEV-3. A comparison has been performed with a set of real-world aging data for PHEVs, confirming the dependence on the results of the assumed capacity reserve for PHEVs [43].
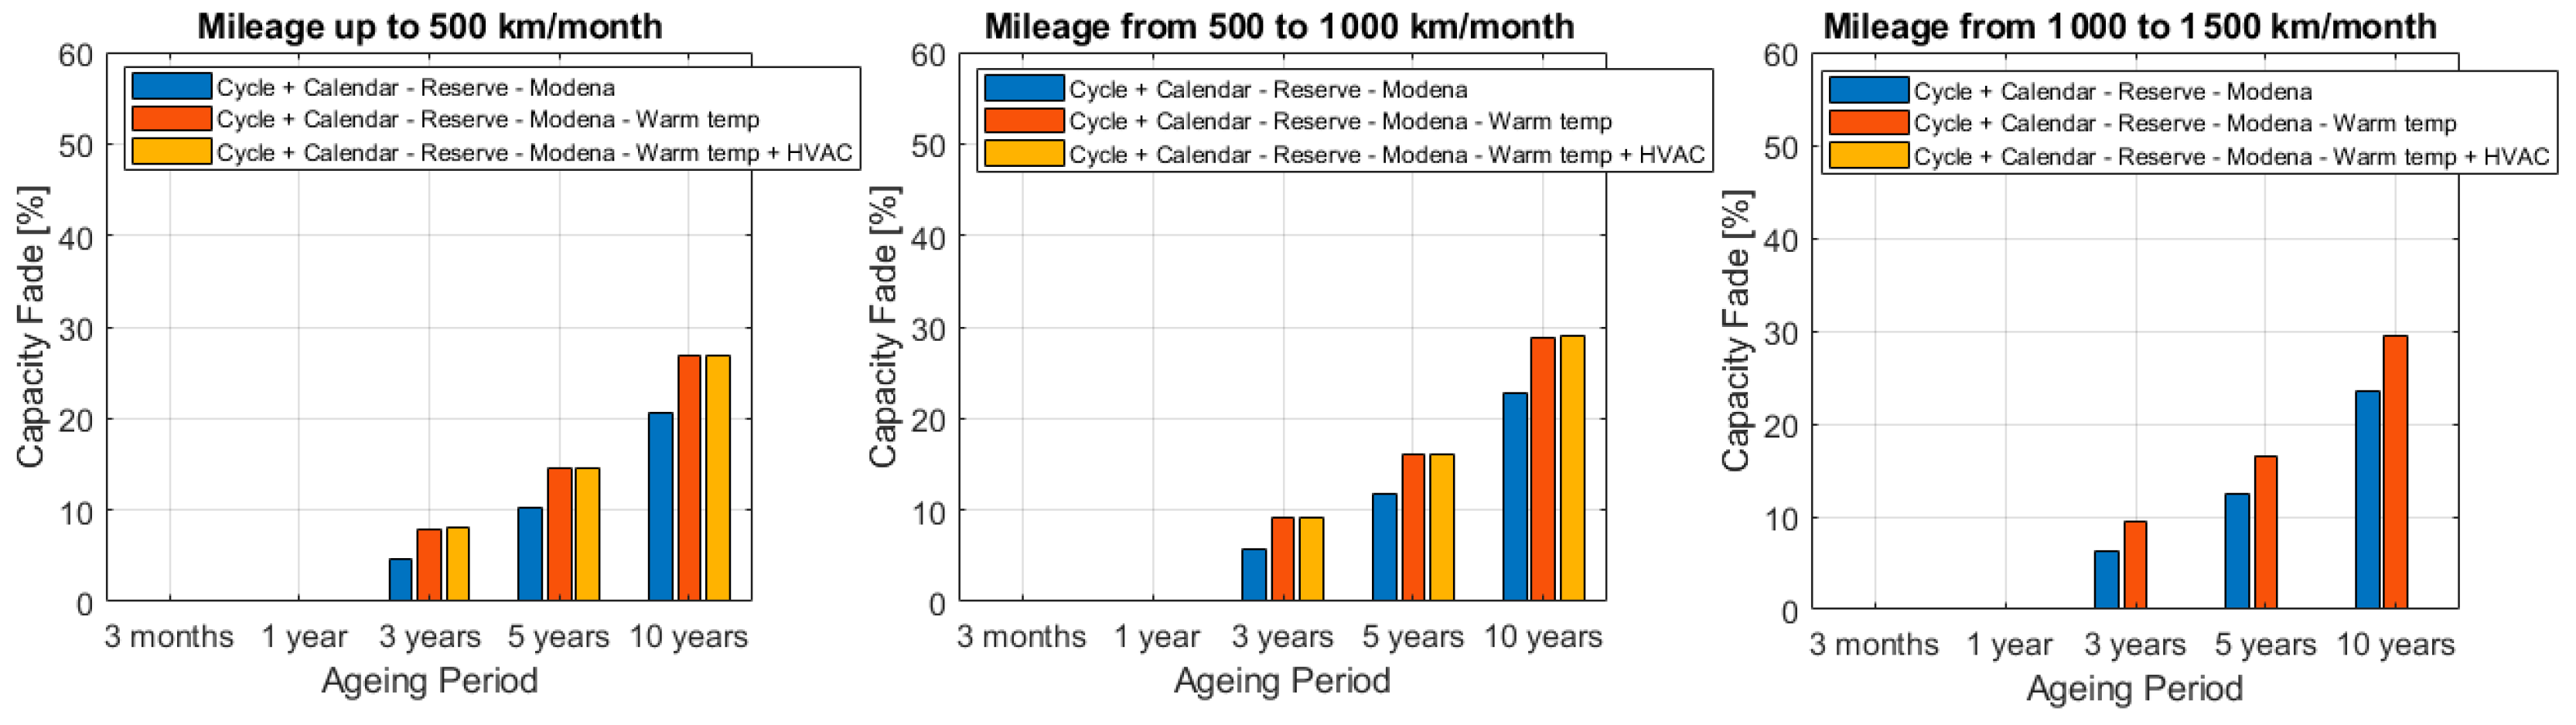
3.3. Capacity Fade Results: Effect on Warm Environmental Temperature
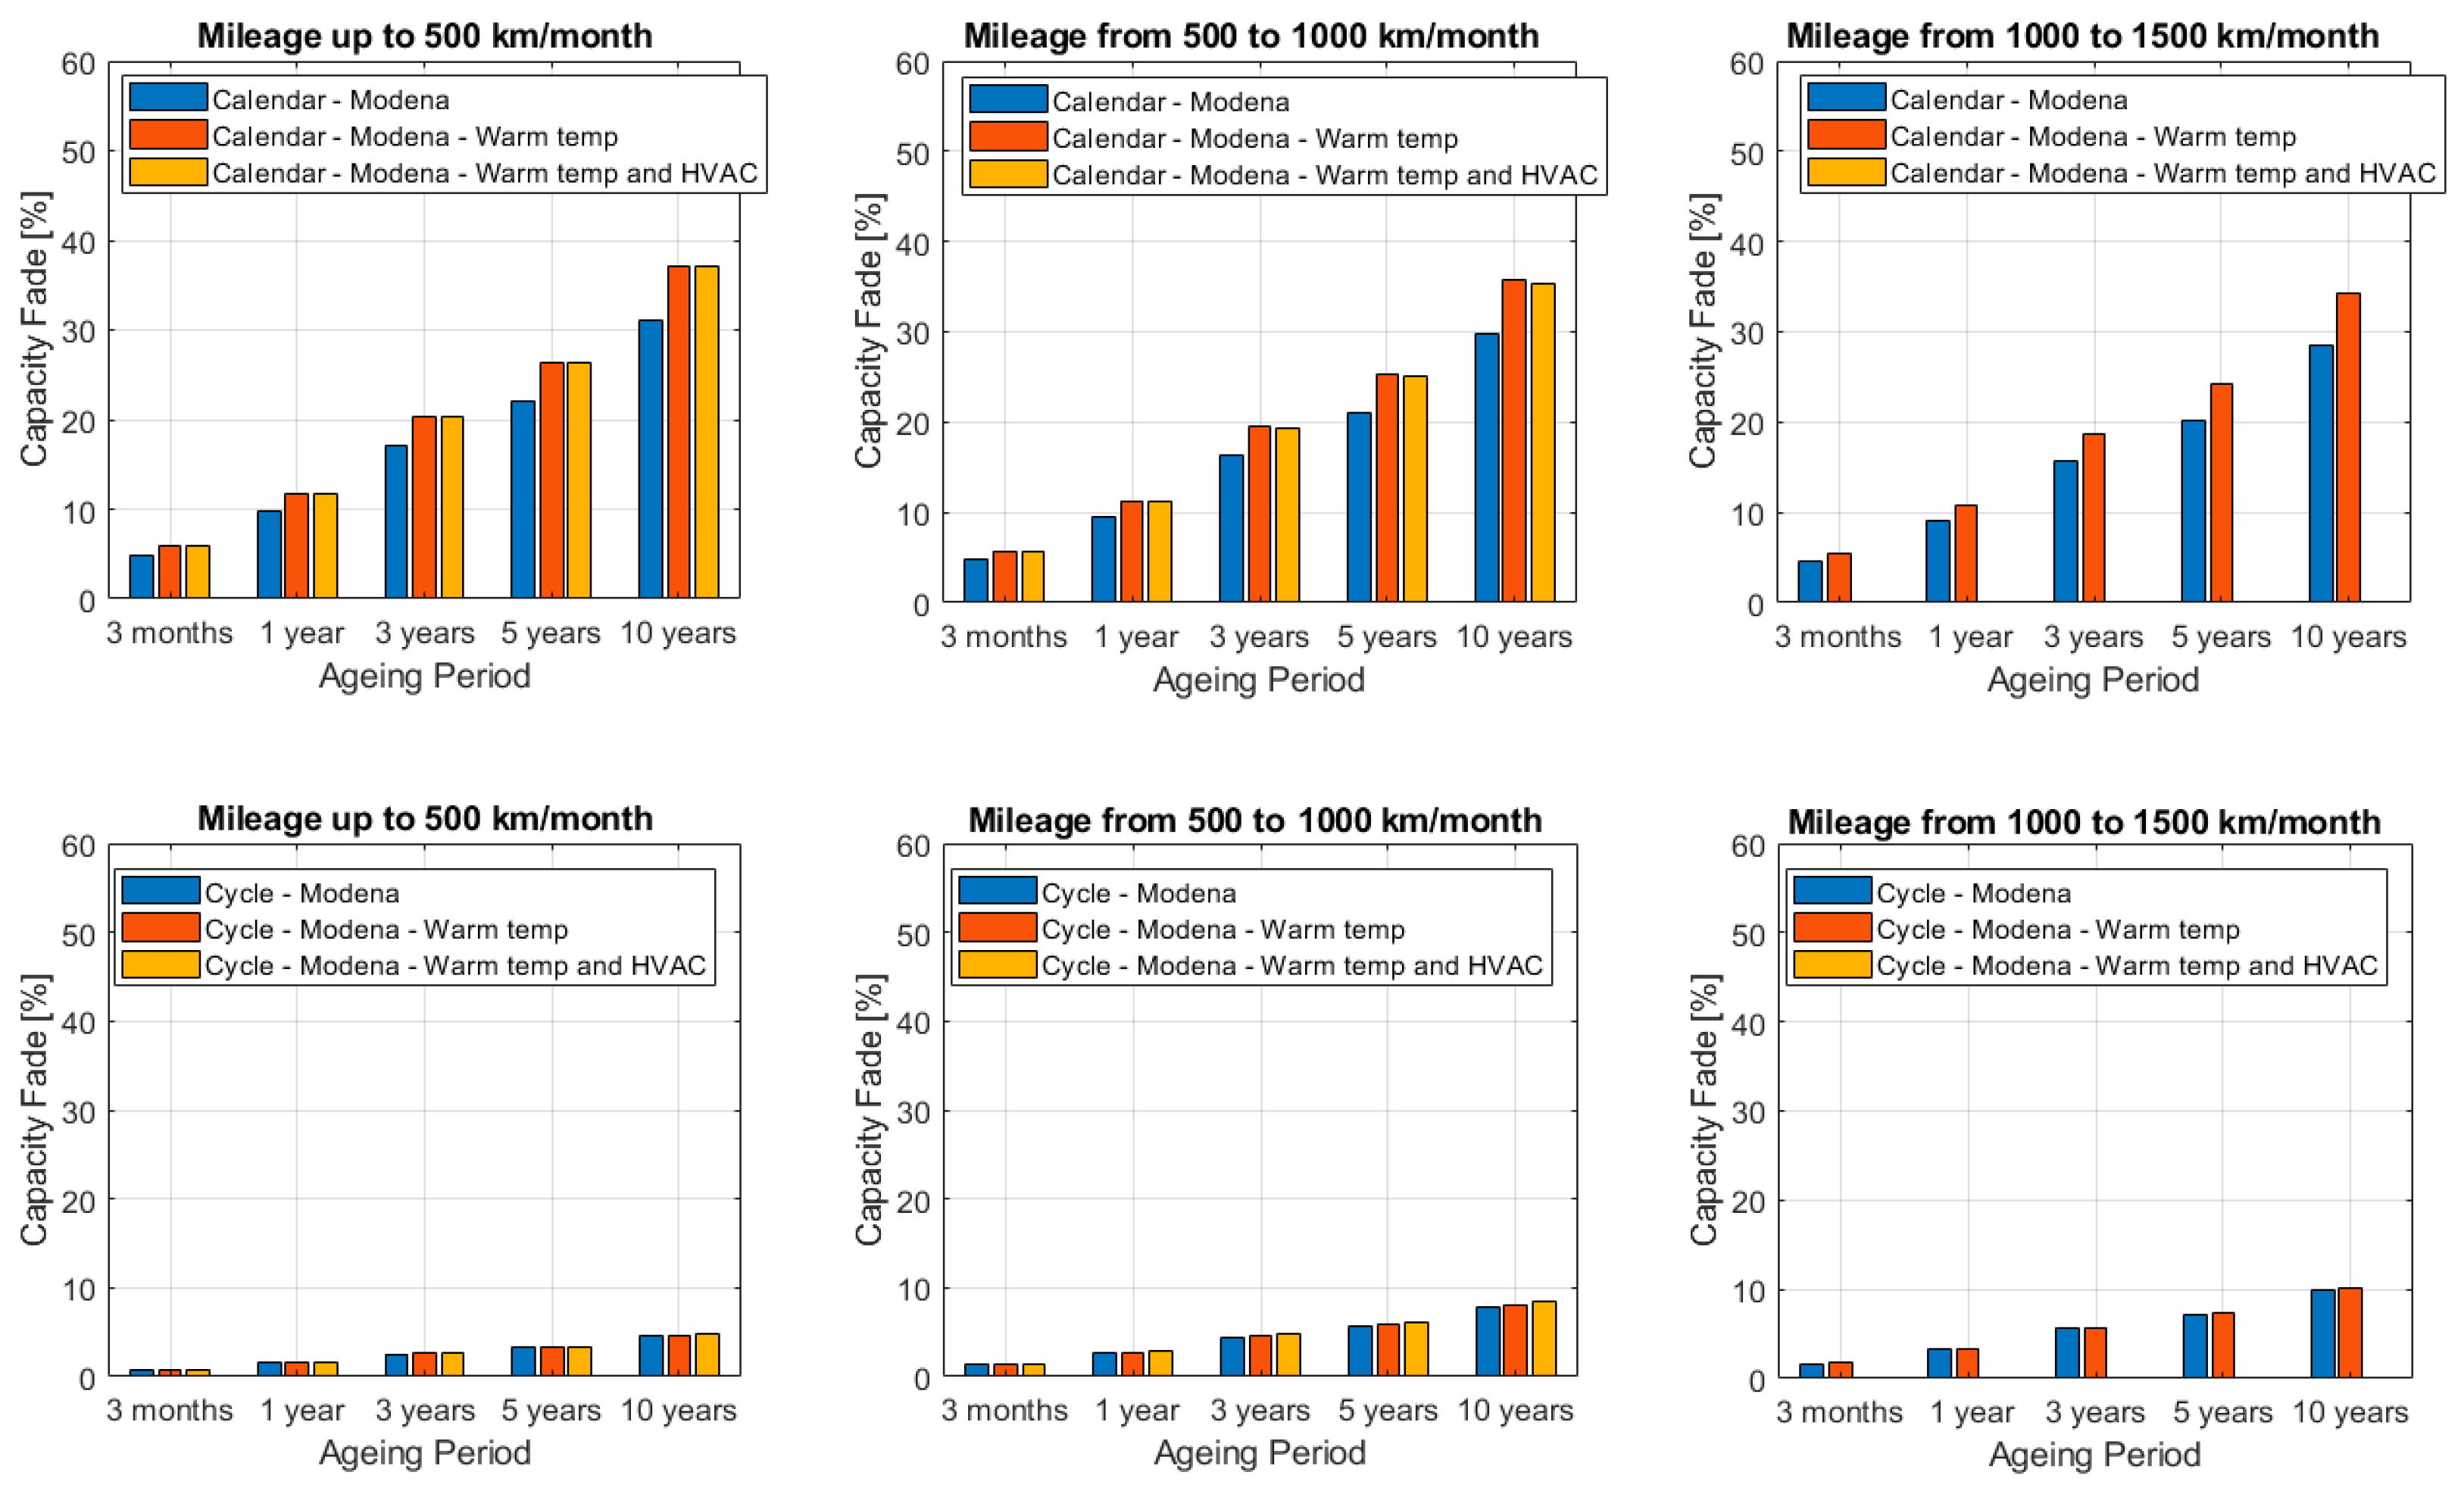
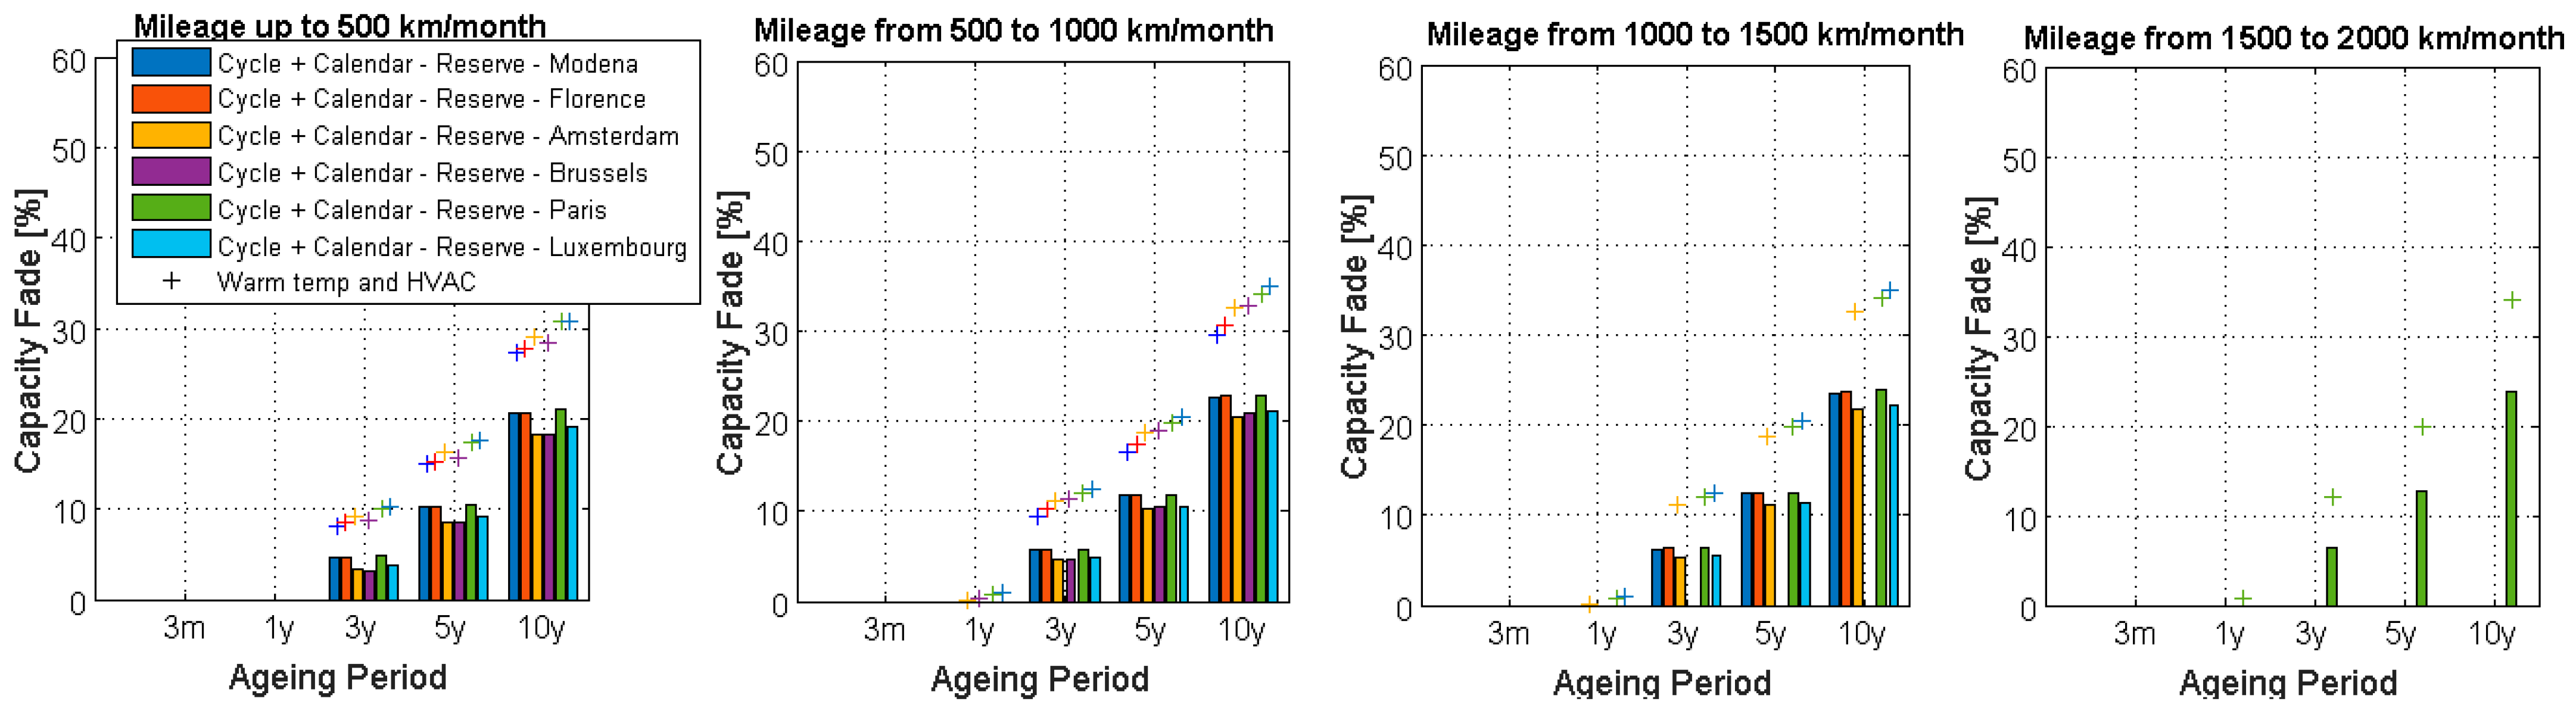
To estimate the effect of warm environmental temperatures on the battery capacity fade, the duty cycle of Modena is combined with the environmental temperature of Lisbon [40]. If a vehicle is driven in a warm environment, such as that of Lisbon in summer, it is assumed that the user operates the air conditioning system to cool the vehicle cabin down. This is reflected in higher energy consumption while driving the vehicle. In this simulation, a constant increase of 15% in the driving energy consumption due to the air conditioning is assumed [38]. The basic scenario (Modena province duty cycle and environmental temperature) is compared to the warm environmental temperature scenario (Modena province duty cycle with the temperature of Lisbon) and its combination with the usage of the Heating, Ventilation, and Air Conditioning (HVAC) system (Modena province duty cycle with HVAC system in operation and the temperature of Lisbon) in Figure 7 for BEV-1 and Recharge Strategy 1. The effect of the warmer temperature is visible in the calendar aging plots (red bars) in each figure in comparison to the base scenario (blue bars) (the BMS is not in operation). The HVAC system operation affects the cycling aging (yellow bars) but in slightly the same way as the environmental temperature during driving and charging. Figure 8 shows the results assuming the same scenario with HVAC system in operation and warm temperature for different geographic areas.
Table 7 shows the EoL in years and years needed to reach 100,000 km and 160,000 km for the Modena province area with the environmental the temperature of Lisbon and both BEV-1 and BEV-2 with Recharge strategy 1 and 2 to be compared to Table 6. In general, a lower number of years are needed to reach the EoL.
4. Conclusions
The visible effects of electrochemical aging of battery cells are a loss of energy capacity and a decrease of the output power of the cell. An aging model must aim at reproducing these two effects while considering driving cycles, environmental and battery temperature, charging rate and frequency, and parking time. To this purpose, the EU JRC has developed a dedicated in-vehicle battery durability assessment module within its TEMA platform, based on performance-based models and large-scale real-world driving data. JRC TEMA is a modular big data platform designed to reproduce mobility behaviors of vehicles from datasets of navigation system data of conventional fuel vehicles and quantify possible impacts of new vehicle technologies on real-world mobility while supporting transport policy assessment.
The mobility pattern datasets used in this analysis refer to six cities, Modena (IT), Florence (IT), Amsterdam (NL), Brussels (BE), Paris (FR), and Luxembourg (LU), and include up to 508,609 private vehicles, corresponding to 1.78 billion GPS records, 9.1 million trips and parking events and a total driven distance of 106.1 million km. The analysis focuses on calendar and cycle capacity fade of NCM LMO Li-ion variant [14,15,16], PHEV and BEV batteries architectures, combining different recharging strategies of different power and profiles with different driving duty cycles from the six cities mentioned above and related yearly environmental temperatures. In the studied scenarios, the cycling aging is affected more by the distance driven than the temperature, so its contribution is higher in the areas corresponding to higher average driven distance and charging power. The HVAC system operation affects the cycling aging in slightly the same way as the environmental temperature. Additionally, by comparing recharge strategy #2 (fast charge) with strategy #1 and #3 (slow charge), aging is predicted to occur slightly more quickly at first, though this does not seem to be a dominant effect for BEV-2. TEMA model aging results have been compared with real-world data from the field, showing a good agreement in EoL years estimates [3,34].
Despite the assumptions and limitations of the aging model, the results constitute a step forward in the topic of in-vehicle battery durability assessment combining calendar and cycle capacity fade models for electrified vehicle traction batteries with large-scale real-world driving data. The presented approach might contribute to determining the key influencing parameters of the phenomenon in view of new regulatory frameworks.
Author Contributions
Conceptualization, methodology, software, formal analysis, data curation, E.P.; writing—original draft preparation, E.P.; writing—review and editing, G.M. All authors have read and agreed to the published version of the manuscript.
Funding
This research received no external funding.
Conflicts of Interest
The authors declare no conflict of interest.
Nomenclature
| BEV | Battery Electric Vehicle |
| BoL | Beginning of Life |
| BMS | Battery Management System |
| EoL | End of Life |
| EVE IWG | Electric Vehicles and Environment Informal Working Group |
| GMT | Greenwich Mean Time |
| GPS | Global Positioning System |
| GRPE | Working Party on Pollution and Energy |
| HVAC | Heating, Ventilation and Air Conditioning |
| LiFePO4 | Lithium-Iron-Phosphate |
| Li-ion | Lithium-ion |
| LMO | Lithium Manganese Oxide |
| NCM | Nickel Cobalt Manganese Oxide |
| PHEV | Plug-in Hybrid Electric Vehicle |
| SOC | State of Charge |
| TEMA | Transport tEchnology and Mobility Assessment |
| WP.29 | UN’s World Forum for Harmonization of Vehicle Regulations |
References
- European Commission. COM 293 Final, Europe on Move. Sustainable Mobility for Europe: Safe, Connected and Clean 2018. Available online: https://eur-lex.europa.eu/resource.html?uri=cellar:0e8b694e-59b5-11e8-ab41-01aa75ed71a1.0003.02/DOC_3&format=PDF (accessed on 16 January 2020).
- Miller, P. Automotive Lithium-Ion Batteries—State of the art and future developments in lithium-ion battery packs for passenger car applications. Johns. Matthey Technol. Rev. 2015, 59, 4–13. [Google Scholar] [CrossRef]
- de Gennaro, M.; Paffumi, E.; Martini, G.; Giallonardo, A.; Pedroso, S. A case study to predict the capacity fade of the battery of electrified vehicles in real-world use conditions. Case Stud. Transp. Policy 2020, 8, 517–534. [Google Scholar] [CrossRef]
- UNECE EVE IWG, ECE/TRANS/WP.29/2014/81—(GRPE). Proposal for an Electric Vehicle Regulatory Reference Guide. Working Party on Pollution and Energy. World Forum for Harmonization of Vehicle Regulations. 2014. Available online: www.unece.org/trans/main/wp29/wp29 (accessed on 4 January 2019).
- Vetter, J.; Novak, P.; Wagner, M.R.; Veit, C.; Moller, K.C.; Besenhard, J.O.; Winter, M.; Wohlfahrt-Mehrens, M.; Vogler, C.; Hammouche, A. Ageing mechanisms in lithium-ion batteries. J. Power Sources 2005, 147, 269–281. [Google Scholar] [CrossRef]
- Barré, A.; Deguilhem, B.; Grolleau, S.; Gérard, M. A review on lithium-ion battery ageing mechanisms and estimations for automotive applications. J. Power Sources 2013, 241, 680–689. [Google Scholar] [CrossRef] [Green Version]
- Abraham, D.P.; Reynolds, E.M.; Sammann, E.; Jansen, A.N.; Dees, D.W. Aging characteristics of high-power lithium-ion cells with LiNi0.8Co0.15Al0.05O2 and Li4/3Ti5/3O4 electrodes. Electrochim. Acta 2005, 51, 502–510. [Google Scholar] [CrossRef]
- Zhang, Q.; White, R.E. Capacity fade analysis of a lithium ion cell. J. Power Sources 2008, 179, 793–798. [Google Scholar] [CrossRef]
- Murphy, J.L.; Winnick, J.; Kohl, P.A. Studies on the cycle life of commercial lithium ion batteries during rapid charge—Discharge cycling. J. Power Sources 2001, 102, 294–301. [Google Scholar]
- Wang, J.; Liu, P.; Hicks-Garner, J.; Sherman, E.; Soukiazian, S.; Verbrugge, M.; Tataria, H.; Musser, J.; Finamore, P. Cycle-life model for graphite-LiFePO4 cells. J. Power Sources 2011, 196, 3942–3948. [Google Scholar] [CrossRef]
- Sarasketa-Zabala, E.; Laresgoiti, I.A.; Rivas, M.; Villareal, I.; Blanco, F. Validation of the methodologies for lithium-ion batteries lifetime prognosis. In Proceedings of the Electric Vehicle Symposium 27th (EVS27), Barcelona, Spain, 17–20 November 2013. [Google Scholar]
- Sarasketa-Zabala, E.; Gandiaga, I.; Rodriguez-Martinez, L.M.; Villareal, I. Calendar ageing analysis of a LiFePO4/graphite cell with dynamic model validations: Towards realistic lifetime predictions. J. Power Sources 2014, 272, 45–57. [Google Scholar] [CrossRef]
- Sarasketa-Zabala, E.; Gandiaga, I.; Martinez-Laserna, E.; Rodriguez-Martinez, L.M. Cycle ageing analysis of a LiFePO4/graphite cell with dynamic model validations: Towards realistic lifetime predictions. J. Power Sources 2015, 275, 573–587. [Google Scholar] [CrossRef]
- Wang, J.; Purewal, J.; Liu, P.; Hicks-Garner, J.; Soukazian, S.; Sherman, E.; Sorenson, A.; Vu, L.; Tataria, H.; Verbrugge, M.W. Degradation of lithium ion batteries employing graphite negatives and nickelecobaltemanganese oxide þ spinel manganese oxide positives: Part 1, aging mechanisms and life estimation. J. Power Sources 2014, 269, 937–948. [Google Scholar] [CrossRef]
- Purewal, J.; Wang, J.; Graetz, J.; Soukazian, S.; Tataria, H.; Verbrugge, M.W. Degradation of lithium ion batteries employing graphite negatives and nickelecobaltemanganese oxide þ spinel manganese oxide positives: Part 2, chemicalemechanical degradation model. J. Power Sources 2014, 272, 1154–1161. [Google Scholar] [CrossRef]
- Cordoba-Arenas, A.; Onori, S.; Guezennec, Y.; Rizzoni, G. Capacity and power fade cycle-life model for plug-in hybrid electric vehicle lithium-ion battery cells containing blended spinel and layered-oxide positive electrodes. J. Power Sources 2015, 278, 473–483. [Google Scholar] [CrossRef] [Green Version]
- Wang, D.; Coignard, J.; Zeng, T.; Zhang, C.; Saxena, S. Quantifying electric vehicle battery degradation from driving vs. vehicle-to-grid services. J. Power Sources 2016, 332, 193–203. [Google Scholar] [CrossRef] [Green Version]
- de Gennaro, M.; Paffumi, E.; Martini, G. Big Data for Supporting Low-Carbon Road Transport Policies in Europe: Applications, Challenges and Opportunities. Big Data Res. 2016, 6, 11–25. [Google Scholar] [CrossRef]
- Paffumi, E.; Martini, G. Capacity fade of Lithium-ion automotive batteries using real-world driving behaviour. In Proceedings of the 33rd World Electric Vehicle Symposium & Exposition (EVS33), Portland, OR, USA, 14–17 June 2020. [Google Scholar] [CrossRef]
- Paffumi, E.; de Gennaro, M.; Martini, G. European-wide study on big data for supporting road transport policy. Case Stud. Transp. Policy 2018, 6, 785–802. [Google Scholar] [CrossRef]
- Octo Telematics Italia, S.r.l. 2013. Available online: www.octotelematics.it (accessed on 14 December 2014).
- Be-Mobile, Traffic and Mobility. 2016. Available online: http://www.be-mobile-international.com/ (accessed on 13 March 2021).
- Universalis. 2016. Available online: http://www.universalis.be/ (accessed on 14 May 2019).
- UN ECE, Working Party on Pollution and Energy (GRPE). Available online: http://www.unece.org/trans/main/wp29/meeting_docs_grpe.html (accessed on 12 March 2021).
- Paffumi, E.; de Gennaro, M.; Scholz, H.; Masera, G. Assessment of the potential of electric vehicles and charging strategies to meet urban mobility requirements. Transp. Transp. Sci. 2015, 11, 22–60. [Google Scholar] [CrossRef]
- de Gennaro, M.; Paffumi, E.; Scholz, H.; Martini, G. GIS-driven analysis of e-mobility in urban areas: An evaluation of the impact on the electric energy grid. Appl. Energy 2014, 124, 94–116. [Google Scholar] [CrossRef]
- Chaouachi, A.; Bompard, E.; Fulli, G.; Masera, M.; De Gennaro, M.; Paffumi, E. Assessment framework for EV and PV synergies in emerging distribution systems. Renew. Sustain. Energy Rev. 2016, 55, 719–728. [Google Scholar] [CrossRef]
- Paffumi, E.; de Gennaro, M.; Martini, G. Innovative technologies for smart cities: Towards customer driven infrastructure design for large scale deployment of electric vehicles and Vehicle-to-Grid applications. Transp. Res. Procedia 2014, 14, 4505–4514. [Google Scholar] [CrossRef]
- de Gennaro, M.; Paffumi, E.; Martini, G. Customer-driven design of the recharge infrastructure and Vehicle-to-Grid in urban areas: A large-scale application for electric vehicles deployment. Energy 2015, 82, 294–311. [Google Scholar] [CrossRef]
- Martini, G.; Paffumi, E.; de Gennaro, M.; Mellios, G. European type-approval test procedure for evaporative emission from passenger cars against real-world mobility data from two Italian provinces. Sci. Total. Environ. 2014, 478, 506–520. [Google Scholar] [CrossRef]
- de Gennaro, M.; Paffumi, E.; Martini, G. Data-driven analysis of the effectiveness of evaporative emissions control systems of passenger cars in real-world use condition. Atmos. Environ. 2016, 129, 277–293. [Google Scholar] [CrossRef]
- Paffumi, E.; de Gennaro, M.; Martini, G. Alternative utility factor versus the SAE J2841 standard method for PHEV and BEV applications. Transp. Policy 2018, 68, 80–97. [Google Scholar] [CrossRef]
- Paffumi, E.; de Gennaro, M.; Martini, G. Big data for assessing travel behaviour in Europe: Initiating a continental scale pilot for supporting the next generation of policy makers. In Proceedings of the 7th Transport Research Arena, Vienna, Austria, 16–19 April 2018. [Google Scholar]
- Loiselle-Lapointe, A.; Pedroso, S.; de Gennaro, M.; Paffumi, E.; Christenson, M.; Safoutin, M. Impacts of Mileage Accumulation and Fast Charging on EV Range and Energy Usage. In Proceedings of the EVS 31& EVTec, Kobe, Japan, 30 September–3 October 2018. [Google Scholar]
- Smith, K.; Earleywine, M.; Wood, E.; Pesaran, A. Battery Wear from Disparate Duty-Cycles: Opportunities for Electric-Drive Vehicle Battery Health Management. In Proceedings of the American Control Conference, Montreal, Canada, 27–29 June 2012. [Google Scholar]
- Marano, V.; Onori, S.; Guezennec, Y.; Rizzoni, G.; Madella, N. Lithium-ion Batteries Life Estimation for Plug-in Hybrid Electric Vehicles. In Proceedings of the IEEE Vehicle Power and Propulsion Conference, Dearborn, MI, USA, 7–10 September 2009. [Google Scholar]
- US EPA. Green Vehicle Guide. 2012. Available online: https://www.epa.gov/greenvehicles (accessed on 12 January 2018).
- de Gennaro, M.; Paffumi, E.; Martini, G.; Manfredi, U.; Vianelli, S.; Ortenzi, F.; Genovese, A. Experimental Test Campaign on a Battery Electric Vehicle: Laboratory Test Results (Part 1). SAE Int. J. Altern. Powertrains 2015, 4, 100–114. [Google Scholar] [CrossRef]
- Paffumi, E.; de Gennaro, M.; Martini, G.; Manfredi, U.; Vianelli, S.; Ortenzi, F.; Genovese, A. Experimental Test Campaign on a Battery Electric Vehicle: On-Road Test Results (Part 2). SAE Int. J. Altern. Powertrains 2015, 4, 277–292. [Google Scholar] [CrossRef]
- World Temperatures—Weather Around the World.2017. Available online: https://www.timeanddate.com/weather/ (accessed on 12 March 2021).
- Gyan, P. Battery ageing tests and modelling under calendar, cycling and mixed conditions. In Proceedings of the 2nd International Conference Automotive Battery Management Systems, Potsdam, Germany, 19–21 September 2016; Available online: https://battery-safety-summit.iqpc.de/battery-ageing-tests-and-modelling-under-calendar (accessed on 22 November 2018).
- Grolleau, S. Cycling Aging of Lithium-ion Batteries, EIGSI, MAT4BAT Summer School, Ra Rochelle, EIGSI, France. 2015. Available online: http://mat4bat.eu/wp-content/uploads/2014/03/Cycling-Aging-of-Lithium-Ion-batteries_Grolleau_EIGSI.pdf (accessed on 22 November 2018).
- Argue, C. What can 6000 Electric Vehicles Tell us about EV Battery Health? 2019. Available online: https://www.geotab.com/ (accessed on 14 October 2020).
Figure 1.
Map of the EU-wide database billion data records.

Figure 2.
Monthly (a) maximum and (b) minimum temperatures in several geographical areas.

Figure 3.
Share of the private vehicles in motion and parked during a week.

Figure 4.
Distribution of the SOC of the battery variation during recharge for the case of Modena province and all the vehicles considered.
Figure 4.
Distribution of the SOC of the battery variation during recharge for the case of Modena province and all the vehicles considered.

Figure 5.
Calendar aging, cycling aging, and calendar plus cycle aging minus reserve for the several provinces considered in the analyses. BEV-1 + Recharge Strategy 1-Li-Ion NCM-LMO (2015).
Figure 5.
Calendar aging, cycling aging, and calendar plus cycle aging minus reserve for the several provinces considered in the analyses. BEV-1 + Recharge Strategy 1-Li-Ion NCM-LMO (2015).

Figure 6.
Calendar aging, cycling aging, and calendar plus cycle aging minus reserve for PHEV-1, PHEV-2, and PHEV-3 with Recharge Strategy 1-Li-Ion NCM-LMO (2015). Modena province area.
Figure 6.
Calendar aging, cycling aging, and calendar plus cycle aging minus reserve for PHEV-1, PHEV-2, and PHEV-3 with Recharge Strategy 1-Li-Ion NCM-LMO (2015). Modena province area.


Figure 7.
Comparison of the calendar aging, cycling aging, and calendar plus cycle aging minus reserve for the BEV-1 with Recharge Strategy 1- Li-Ion NCM-LMO (2015), for three scenarios: Modena province duty cycle and environmental temperature, Modena province duty cycle with the temperature of Lisbon, and the Modena province duty cycle with HVAC system in operation and the temperature of Lisbon.


Figure 8.
Comparison of the calendar plus cycle aging minus reserve for the BEV-1 with Recharge Strategy 1—Li-Ion NCM-LMO (2015), for different geographic areas and their environmental temperature and the scenario with HVAC system in operation and the temperature of Lisbon.
Figure 8.
Comparison of the calendar plus cycle aging minus reserve for the BEV-1 with Recharge Strategy 1—Li-Ion NCM-LMO (2015), for different geographic areas and their environmental temperature and the scenario with HVAC system in operation and the temperature of Lisbon.


Table 1.
Data overview.
| No. of Days [#] | No. of Vehicles [#] | Records [·106] | Trips [·106] | Total Trips Lengths [km·106] | No. of Trip per Day (Mean) [#] | Trip Length [km] (Mean) | Daily Driven Distance (Mean) [km] | Private Vehicles Share | Commercial Vehicles Share | Analyzed Sample (% of Registered Vehicles in the Province Area) | |
|---|---|---|---|---|---|---|---|---|---|---|---|
| Modena province | 31 | 16,263 | 16.00 | 1.9 | 14.98 | 6.6 | 7.8 | 51.9 | 91.6% | 8.4% | 3.68% |
| Florence province | 31 | 12,478 | 32.01 | 2.6 | 20.66 | 6.4 | 8.0 | 51.3 | 90.9% | 9.1% | 1.82% |
| Amsterdam province | 7 | 197,756 | 466.28 | 1.1 | 19.86 | 1.9 | 19.7 | 37.2 | 83.2% | 16.8% | 17.17% |
| Brussels province | 14 | 96,802 | 277.05 | 1.1 | 11.21 | 7.9 | 7.7 | 55.2 | 91.2% | 8.8% | 16.26% |
| Paris province | 7 | 171,220 | 963.27 | 2.3 | 38.39 | 4.2 | 17.0 | 71.7 | 99.1% | 0.9% | 2.43% |
| Luxemb. province | 7 | 14,090 | 24.33 | 0.08 | 1.0 | 2.5 | 11.9 | 30.1 | 92.0% | 8.0% | 17.63% |
| TOTAL | 508,609 | 1.78 × 10³ | 9.08 | 106.1 | |||||||
Table 2.
Overview of the performance-based capacity and power fade models implemented in TEMA [3].
Table 2.
Overview of the performance-based capacity and power fade models implemented in TEMA [3].
| Capacity Fade | Power Fade | |||||
|---|---|---|---|---|---|---|
| Model # | Calendar | Cycle | Model # | Calendar | Cycle | |
| LiFePO4 | Model 1 | Sarasketa-Zabala et al. (2013/14) [11,12] | Wang et al. (2011), [10] | Model 1 | Sarasketa-Zabala et al. (2013), [11] | |
| Model 2 | Sarasketa-Zabala et al. (2013), [3,11] | |||||
| Model 3 | Sarasketa-Zabala et al. (2015), [13] | |||||
| NCM + spinel Mn | Model 4 | Wang et al. (2014), [14,15] | - | - | ||
| NCM–LMO | Model 5 | Wang et al. (2014), [14,15] | Cordoba-Arenas et al. (2014), [16] | Model 2 | - | Cordoba-Arenas et al. (2015), [16] |
Table 3.
Characteristics of the reference vehicles.
| Vehicle Type | Battery Size [Wh] | Battery Shape and Cells Type | Usable Energy at BoL [Wh] | Usable Energy at EoL [Wh] | Reserve [% of Battery Capacity] | Energy Consumption [Wh/km] | |
|---|---|---|---|---|---|---|---|
| PHEV-1 | Large-sized vehicle | 16,000 | T-shaped pouch cells | 12,000 | 9600 | 25% | 205 |
| PHEV-2 | Medium-sized vehicle | 8800 | Parallelepiped Prismatic cell | 6600 | 5280 | 25% | 160 |
| PHEV-3 | Large-sized vehicle | 12,000 | Parallelepiped Prismatic cell | 9000 | 7200 | 25% | 194 |
| BEV-1 | Medium-sized vehicle | 24,000 | Parallelepiped pouch cells | 18,000 | 14,400 | 15% | 210 |
| BEV-2 | Large-sized vehicle | 85,000 | Flat cylindrical cells | 63,750 | 51,000 | 15% | 235 |
Table 4.
Recharge strategies.
| Strategy ID–Name | Recharge Constraints | Power [kW] | Recharge Model Inputs |
|---|---|---|---|
| 1–Long-Stop Random AC | parking ≥ 120 min and random parameter ≥ 0.6 | 2 | parking duration and random parameter |
| 2–Short-Stop Random DC | parking ≥ 20 min and random parameter ≥ 0.6 | 40 | parking duration and random parameter |
| 3–Night AC | parking ≥ 4 h and parking between 10 p.m. and 7 a.m. | 2 | parking duration and night recharge window |
Table 5.
Average trip distance, trip duration, parking duration, and trip speed for all the databases.
Table 5.
Average trip distance, trip duration, parking duration, and trip speed for all the databases.
| Average Trip Distance [km] | Average Trip Duration [min] | Average Parking Duration [h] | Average Trip Speed [km/h] | ||
|---|---|---|---|---|---|
| Private Vehicles | Province of Modena | 7.69 | 11.63 | 4.07 | 28.92 |
| Province of Florence | 7.85 | 13.0 | 4.33 | 26.13 | |
| Province of Amsterdam | 19.68 | 14.32 | 1.14 | 78.75 | |
| Province of Brussels | 7.75 | 9.13 | 1.45 | 51.98 | |
| Province of Paris | 16.97 | 20.05 | 1.18 | 44.87 | |
| Province of Luxembourg | 11.88 | 13.99 | 1.703 | 54.491 | |
Table 6.
EoL in years, years needed to reach 100,000 km and 160,000 km for the different province areas, vehicle technologies, and recharge strategies.
Table 6.
EoL in years, years needed to reach 100,000 km and 160,000 km for the different province areas, vehicle technologies, and recharge strategies.
| EoL @ 80% Capacity Fade Li-Ion NCM-LMO (2015) Years Driving to Set Threshold | 0–500 km/month | 500–1000 km/month | 1000–1500 km/month | 1500–2000 km/month | 2000+ km/month | ||||||||||||
|---|---|---|---|---|---|---|---|---|---|---|---|---|---|---|---|---|---|
| Years to EoL | Years to 100,000 km | Years to 160,000 km | Years to EoL | Years to 100,000 km | Years to 160,000 km | Years to EoL | Years to 100,000 km | Years to 160,000 km | Years to EoL | Years to 100,000 km | Years to 160,000 km | Years to EoL | Years to 100,000 km | Years to 160,000 km | |||
| Recharge Strategy #1 | PHEV-1 | Modena Prov. | 16.5 | ≥20 | ≥20 | 14.6 | 14.2 | ≥20 | |||||||||
| Amsterdam Prov. | 19.0 | ≥20 | ≥20 | 16.4 | 14.2 | ≥20 | |||||||||||
| Brussels Prov. | 18.9 | ≥20 | ≥20 | 16.1 | 15.0 | ≥20 | |||||||||||
| Luxembourg Prov. | 18.0 | ≥20 | ≥20 | 15.8 | 13.2 | ≥20 | |||||||||||
| Paris Prov. | 16.1 | ≥20 | ≥20 | 14.5 | 13.5 | ≥20 | |||||||||||
| BEV-1 | Modena Prov. | 9.7 | ≥20 | ≥20 | 8.6 | 12.8 | ≥20 | 8.2 | 7.9 | 12.6 | |||||||
| Amsterdam Prov. | 11.1 | ≥20 | ≥20 | 9.7 | 13.9 | ≥20 | 9.0 | 7.5 | 12.0 | ||||||||
| Brussels Prov. | 11.1 | ≥20 | ≥20 | 9.5 | 14.3 | ≥20 | |||||||||||
| Luxembourg Prov. | 10.6 | ≥20 | ≥20 | 9.4 | 13.2 | ≥20 | 8.8 | 7.4 | 11.9 | ||||||||
| Paris Prov. | 9.5 | ≥20 | ≥20 | 8.6 | 12.9 | ≥20 | 8.1 | 7.5 | 12.0 | 8.1 | 5.2 | 9.5 | |||||
| BEV-2 | Modena Prov. | 12.1 | ≥20 | ≥20 | 12.7 | 11.2 | 17.9 | 13.6 | 6.9 | 11.0 | 14.7 | 5 | 8.1 | 16.1 | 3.9 | 6.3 | |
| Amsterdam Prov. | 13.9 | ≥20 | ≥20 | 13.7 | 11.6 | 18.6 | 13.7 | 7.2 | 11.5 | 14.3 | 5.2 | 8.3 | 15.7 | 4.0 | 6.4 | ||
| Brussels Prov. | 13.4 | ≥20 | ≥20 | 13.4 | 13.2 | ≥20 | 14.1 | 7.5 | 12.0 | ||||||||
| Luxembourg Prov. | 13.4 | ≥20 | ≥20 | 13.4 | 11.6 | 18.5 | 13.6 | 7.1 | 11.4 | 14.2 | 5.1 | 8.2 | 14.7 | 4.1 | 6.6 | ||
| Paris Prov. | 12.0 | ≥20 | ≥20 | 12.0 | 11.2 | 17.9 | 12.1 | 7.0 | 11.3 | 12.8 | 5.1 | 8.1 | 14.1 | 3.8 | 6.1 | ||
| Recharge Strategy #2 | BEV-1 | Modena Prov. | 9.3 | ≥20 | ≥20 | 7.9 | 11.7 | 18.7 | 7.1 | 7.1 | 11.4 | 6.6 | 5.1 | 8.1 | 6.2 | 3.7 | 6 |
| Amsterdam Prov. | 11.0 | ≥20 | ≥20 | 9.2 | 13.3 | ≥20 | 8.1 | 7.4 | 11.8 | 7.5 | 5.2 | 8.3 | 7.0 | 4.0 | 6.5 | ||
| Brussels Prov. | 11.0 | ≥20 | ≥20 | 8.9 | 13.2 | ≥20 | 7.9 | 7.1 | 11.4 | 7.4 | 5.1 | 8.2 | |||||
| Luxembourg Prov. | 10.5 | ≥20 | ≥20 | 8.8 | 12.2 | 19.5 | 7.8 | 6.9 | 11.1 | 7.2 | 4.9 | 7.8 | 6.6 | 3.5 | 5.6 | ||
| Paris Prov. | 9.3 | ≥20 | ≥20 | 8.0 | 12.0 | 19.2 | 7.2 | 7.0 | 11.2 | 6.7 | 4.9 | 7.9 | 6.3 | 3.7 | 5.9 | ||
| BEV-2 | Modena Prov. | 11.6 | ≥20 | ≥20 | 11.4 | 11 | 17.7 | 11.3 | 6.8 | 10.8 | 11.2 | 4.8 | 7.7 | 11.2 | 3.4 | 5.4 | |
| Amsterdam Prov. | 13.7 | ≥20 | ≥20 | 13.2 | 11.7 | 18.8 | 13.0 | 7.0 | 11.2 | 12.8 | 4.9 | 7.9 | 12.7 | 3.5 | 5.7 | ||
| Brussels Prov. | 13.2 | ≥20 | ≥20 | 12.8 | 12.8 | ≥20 | 12.7 | 6.9 | 11.0 | 13.1 | 4.8 | 7.7 | 13.2 | 3.7 | 5.9 | ||
| Luxembourg Prov. | 13.2 | ≥20 | ≥20 | 12.8 | 11.7 | 18.6 | 12.6 | 7.0 | 11.2 | 12.5 | 4.9 | 7.9 | 12.5 | 3.4 | 5.5 | ||
| Paris Prov. | 11.8 | ≥20 | ≥20 | 11.5 | 11.3 | 18.0 | 11.4 | 6.8 | 10.9 | 11.3 | 4.8 | 7.7 | 11.4 | 3.0 | 4.8 | ||
| Recharge Strategy #3 | PHEV-1 | Modena Prov. | 16.1 | ≥20 | ≥20 | 14.4 | 12.3 | 19.8 | 13.7 | 7.7 | 12.3 | ||||||
| Amsterdam Prov. | 19.0 | ≥20 | ≥20 | ||||||||||||||
| Brussels Prov. | 18.8 | ≥20 | ≥20 | 16.1 | 14.9 | ≥20 | |||||||||||
| Luxembourg Prov. | 17.8 | ≥20 | ≥20 | ||||||||||||||
| Paris Prov. | 16.1 | ≥20 | ≥20 | 14.4 | 13.6 | ≥20 | |||||||||||
| BEV-1 | Modena Prov. | 9.6 | ≥20 | ≥20 | 8.5 | 11.7 | 18.7 | 8.2 | 7.2 | 11.5 | 8 | 5.2 | 8.4 | ||||
| Amsterdam Prov. | 11.1 | ≥20 | ≥20 | 9.6 | 14.3 | ≥20 | |||||||||||
| Brussels Prov. | 11.0 | ≥20 | ≥20 | 9.6 | 15.2 | ≥20 | |||||||||||
| Luxembourg Prov. | 10.4 | ≥20 | ≥20 | 9.3 | 13.7 | ≥20 | |||||||||||
| Paris Prov. | 9.4 | ≥20 | ≥20 | 8.6 | 13.9 | ≥20 | |||||||||||
| BEV-2 | Modena Prov. | 12.1 | ≥20 | ≥20 | 12.7 | 11.1 | 17.7 | 13.7 | 6.8 | 10.9 | 14.8 | 4.9 | 7.9 | 16 | 4 | 6.4 | |
| Amsterdam Prov. | 13.9 | ≥20 | ≥20 | 13.6 | 11.7 | 18.7 | 13.4 | 7.4 | 11.8 | ||||||||
| Brussels Prov. | 13.2 | ≥20 | ≥20 | 13.0 | 14.6 | ≥20 | |||||||||||
| Luxembourg Prov. | 13.4 | ≥20 | ≥20 | 13.1 | 11.5 | 18.4 | 13.0 | 6.7 | 10.7 | 12.7 | 5.0 | 8.1 | 12.4 | 3.5 | 5.6 | ||
| Paris Prov. | 12.0 | ≥20 | ≥20 | 11.8 | 11.1 | 17.8 | 11.7 | 7.4 | 11.8 | 13.0 | 5.0 | 8.1 | |||||
EoL below 5.0 years (purple); EoL above or equal to 5.0 and below 10.0 years (yellow); EoL above or equal to 10.0 years (green).
Table 7.
EoL in years, years needed to reach 100,000 km and 160,000 km for Modena province area with the environmental temperature of Lisbon. BEV-1 and BEV-2 with Recharge strategy 1 and 2.
Table 7.
EoL in years, years needed to reach 100,000 km and 160,000 km for Modena province area with the environmental temperature of Lisbon. BEV-1 and BEV-2 with Recharge strategy 1 and 2.
| EoL @ 80% Capacity Fade Li-Ion NCM-LMO (2015) Years Driving to Set Threshold Warm Environment Temperature (Lisbon 2017) | Fleet Share | 0–500 km/Month | 500–1000 km/Month | 1000–1500 km/Month | 1500–2000 km/Month | 2000+ km/Month | ||||||||||||
|---|---|---|---|---|---|---|---|---|---|---|---|---|---|---|---|---|---|---|
| Years to EoL | Years to 100,000 km | Years to 160,000 km | Years to EoL | Years to 100,000 km | Years to 160,000 km | Years to EoL | Years to 100,000 km | Years to 160,000 km | Years to EoL | Years to 100,000 km | Years to 160,000 km | Years to EoL | Years to 100,000 km | Years to 160,000 km | ||||
| Recharge Strategy #1 | Modena Prov. | BEV-1 | 9.9% | 7.0 | ≥20 | ≥20 | 6.3 | 13.2 | ≥20 | - | - | - | ||||||
| BEV-2 | 46.4% | 8.5 | ≥20 | ≥20 | 9.2 | 11.3 | 18.0 | 9.9 | 7.0 | 11.3 | 10.8 | 5.2 | 8.3 | 11.9 | 4.1 | 6.5 | ||
| Recharge Strategy #2 | Modena Prov. | BEV-1 | 19.9% | 6.5 | ≥20 | ≥20 | 5.6 | 12.0 | 19.2 | 5.0 | 7.2 | 11.6 | 4.7 | 5.2 | 8.4 | 4.3 | 3.8 | 6.0 |
| BEV-2 | 75.0% | 8.1 | ≥20 | ≥20 | 8.0 | 11.1 | 17.7 | 7.9 | 6.8 | 10.8 | 7.9 | 4.9 | 7.8 | 7.9 | 3.5 | 5.5 | ||
EoL below 5.0 years (purple); EoL above or equal to 5.0 and below 10.0 years (yellow); EoL above or equal to 10.0 years (green).
Publisher’s Note: MDPI stays neutral with regard to jurisdictional claims in published maps and institutional affiliations. |
© 2021 by the authors. Licensee MDPI, Basel, Switzerland. This article is an open access article distributed under the terms and conditions of the Creative Commons Attribution (CC BY) license (http://creativecommons.org/licenses/by/4.0/).
Share and Cite
MDPI and ACS Style
Paffumi, E.; Martini, G. Real-World Mobility and Environmental Data for the Assessment of In-Vehicle Battery Capacity Fade. World Electr. Veh. J. 2021, 12, 48. https://0-doi-org.brum.beds.ac.uk/10.3390/wevj12010048
AMA Style
Paffumi E, Martini G. Real-World Mobility and Environmental Data for the Assessment of In-Vehicle Battery Capacity Fade. World Electric Vehicle Journal. 2021; 12(1):48. https://0-doi-org.brum.beds.ac.uk/10.3390/wevj12010048
Chicago/Turabian StylePaffumi, Elena, and Giorgio Martini. 2021. "Real-World Mobility and Environmental Data for the Assessment of In-Vehicle Battery Capacity Fade" World Electric Vehicle Journal 12, no. 1: 48. https://0-doi-org.brum.beds.ac.uk/10.3390/wevj12010048