
Sun, Wind and Waves: EV Fossil Fuel Use and Emissions on an Isolated, Oil-Dependent Hawaiian Island

Hawaii Natural Energy Institute, University of Hawaii, HIG 433, 2525 Correa Road, Honolulu, HI 96822, USA
World Electr. Veh. J. 2021, 12(2), 87; https://0-doi-org.brum.beds.ac.uk/10.3390/wevj12020087
Submission received: 24 April 2021
/
Revised: 12 June 2021
/
Accepted: 14 June 2021
/
Published: 18 June 2021
(This article belongs to the Special Issue Electric Vehicles—Solution toward Zero Emission from the Transport Sector)
Abstract
:Electric power grids in remote communities around the world tend to be highly oil-dependent, unlike large, interconnected grids. Consequently, self-contained power grids such as the Hawaiian Islands’ have become testbeds for aggressive renewable energy integration (PV, wind, and ocean energy) and transportation electrification. However, there remains a lack of critical analysis for remote communities to determine the benefits of transitioning from internal combustion engine (ICE) vehicles to plug-in electric vehicles (EVs). This case study examines the impacts of this transition to EVs and renewable power generation on fossil fuel use and CO2 emissions on the oil-dependent Island of Oahu, Hawaii. Average passenger EVs were found to consume seven times less fossil fuel (the equivalent of 66 gallons of gasoline (GGe), than their gasoline-powered counterparts (455 gallons) in 2020. Average EVs also cut emissions in half, (2 MTCO2 versus 4 MTCO2). Several renewable power and EV transition scenarios were modeled to assess impacts out to 2050. Fossil fuel use and emissions plummet with more clean power and increasing EV numbers. By 2045, in the most ambitious scenario, all gasoline- and diesel-powered vehicles (passenger and freight) will consume a total of 8.8 billion GGe, and EVs 0.090 billion GGe (1%). ICE CO2 emissions will total 80 MMT, and EVs 4.4 MMT (5.5%). By 2050, the anticipated transition to electric passenger and freight vehicles combined with renewable power will lead to 99% less fossil fuel consumed, and 93% less CO2 emitted.
1. Introduction
Smaller standalone power grids, unlike large, interconnected power systems, continue to be powered by diesel oil. These small power systems are also challenging to integrate high levels of intermittent renewable resources such as solar and wind. This case study examines the Island of Oahu, Hawaii, a testbed for aggressive renewable power generation, and potential hot spot for the transition to plug-in electric vehicles (EVs). The remaining dependence on oil and lack of critical analysis on the fossil fuel consumption and resulting emissions from EVs has led many legislators and public stakeholders to question the value of committing fiscal policy and resources toward electrification of transportation. Coffman et al. [1] included greenhouse gas (GHG) emissions from small passenger EVs (2016), based on the 2014 power grid data. However, power generation in Hawaii has changed considerably in the past six years and there is a gap between the current understanding of EV fossil fuel use and resulting emission for the range of both passenger and freight vehicles compared with their ICE counterparts. In addition, there is a need to investigate future scenarios. This analysis quantifies current impacts of passenger and freight EVs on fossil fuel use and the resulting CO2 emissions. Scenarios were modeled for renewable power projections combined with projections for the transition to EVs over the coming decades. These scenarios are intended as examples to better understand future uncertainties, develop strategies, and inform the development of policy.
Since this case study quantifies the fossil fuel use and emissions for a standalone power system together with a self-contained transportation network, the impacts clear and can be used to help inform similar isolated communities. The Island of Oahu, Hawaii was chosen as an ideal case study, having both an isolated, standalone power system, as well as a geographically self-contained transportation boundary. Larger, interconnected power grids trade power from a variety of resources and regions, and EVs in these areas move from region to region, thus making it difficult to accurately quantify power resources used to charge EVs. Additionally, Oahu was chosen since regional data is available, publicly accessible, and includes distributed, small-scale PV. Thus, this case study provides an example of how fossil fuel use and resulting emissions can be analyzed anywhere that regional data can be collected and assessed.
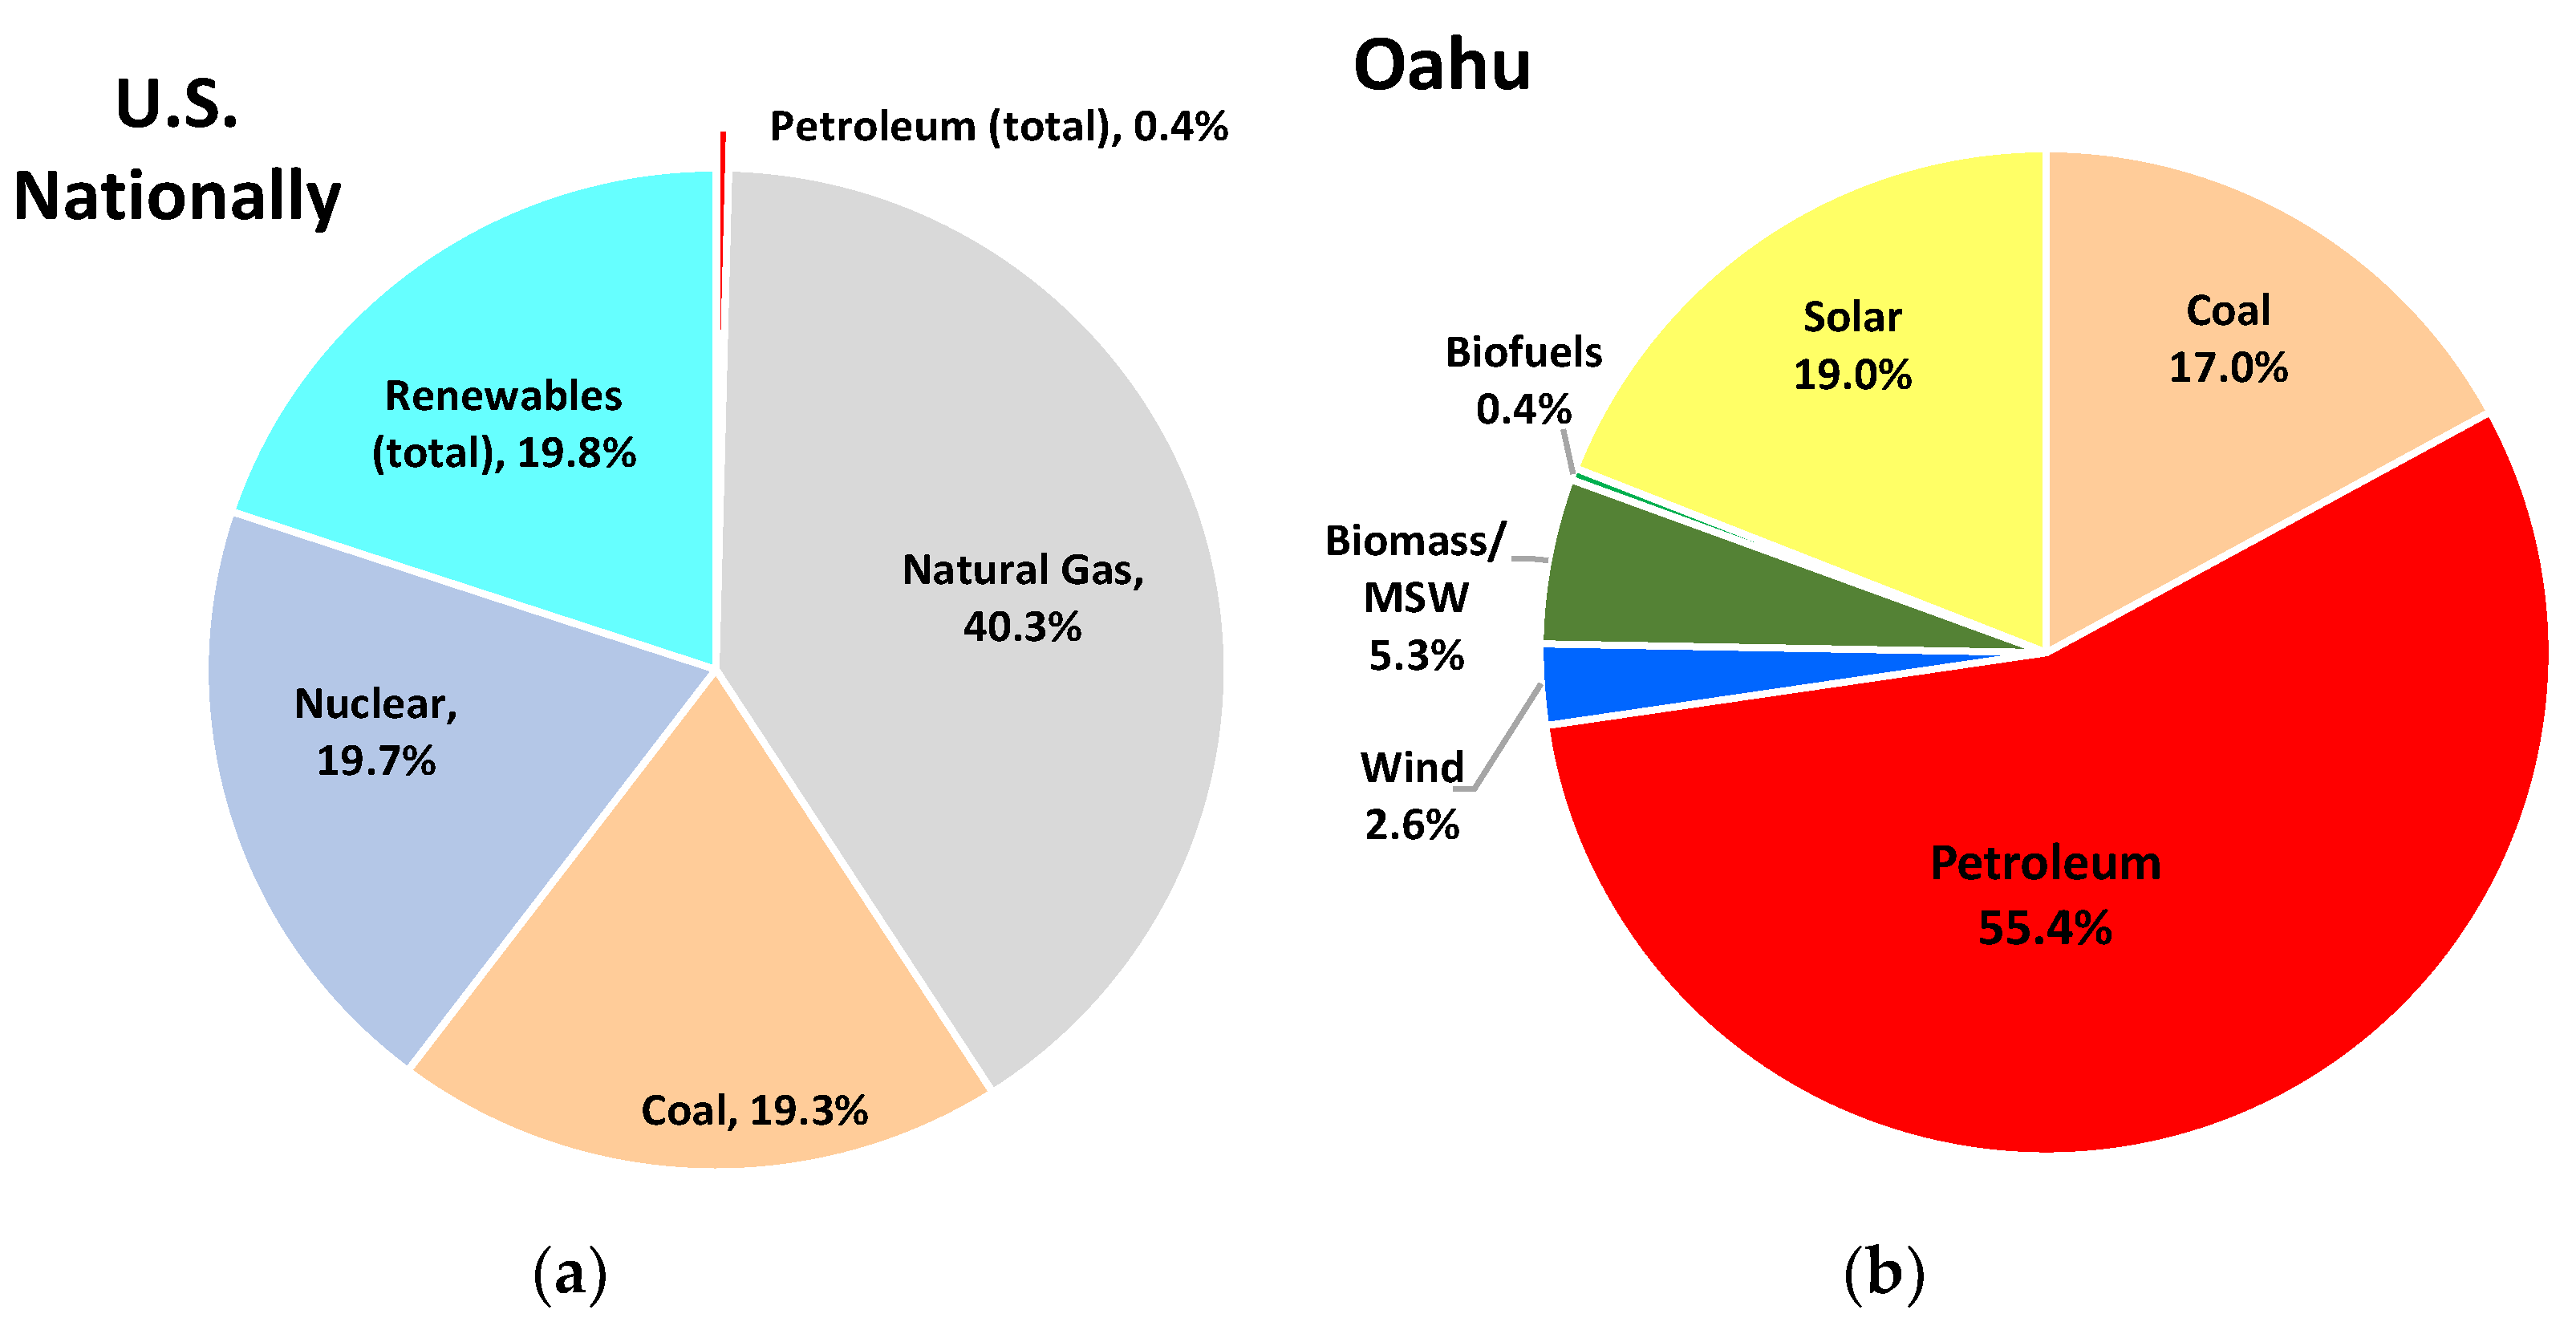
Like many remote communities, Hawaii relies on imported oil for both transportation and electric power in contrast to the rest of the U.S., where less than 1% of electric power is generated from burning oil [2] (Figure 1a). By comparison, on the island of Oahu, Hawaii, 55.4% of the electricity was generated from oil in 2020 [3,4] (Figure 1b). The remaining balance was generated from coal (17%) and renewables (27%). Renewables include solar PV (central and distributed, including residential rooftop), biomass and municipal solid waste (MSW, i.e., waste-to-energy), wind, and biofuel.
As a result of this reliance on imported petroleum, Hawaii’s electric rates vary with the price of oil and are more than double the national average [5]. Gasoline prices are typically the highest in the nation. As result, the state’s total energy expenditure runs as high as 10% of gross domestic product [6]. Hawaii is currently addressing these challenges by integrating solar, wind, and battery storage resources into the electric power mix. An independent economic analysis completed in 2018 found that Hawaii’s most cost-effective scenario would source renewable generation for 58–84% of the electricity by 2030 [7], significantly ahead of the state’s Renewable Portfolio Standard (RPS) of 40% by 2030. The RPS is mandated by law, and further targets 70% by 2040, and 100% by 2045. For ground transportation, electrification has been identified as both an effective and feasible approach for reducing petroleum usage in Hawaii [8] and coincides with Hawaii’s state law to become carbon neutral no later than 2045.
However, as for other isolated communities, reaching these goals is challenging and the focus of much attention from government, NGOs, research institutions, utilities, industry, and other stakeholders. The islands’ power grids are small and not connected island to island, making it more challenging to integrate high levels of intermittent, resources such as solar and wind, while balancing power supply with demand. Understandably, most of the focus on the benefits of EVs is on large regions where power is provided from extensive, interconnected power grids, with a large variety of power generation resources, such as the mainland US and other continents. Simply put, the smaller the power grid, the more challenging it is to integrate intermittent resources power while maintaining a reliable and steady power supply.
This study examines the effects of electrification of transportation and growing mix of renewable power generation on the Hawaiian Island of Oahu. Oahu is the most challenging island, with the highest population and limited renewable resources beyond solar and offshore wind. By contrast, Hawaii Island has geothermal resources, and Kauai hydroelectricity, providing firm power available at all times. Maui has similar challenges to Oahu but greater onshore wind resources, providing some balance to solar power. For this reason, Oahu remains a test bed for renewable energy and associated technologies, hosting some of the most advanced pilot and test demonstration projects. It also provides an ideal test bed for electrification of transportation, charging demonstrations, and integration of the highest possible levels of clean, affordable electricity generation.
Currently the utility has power purchase agreements for solar power plus storage for the Oahu power grid in planning, permitting and installation stages at significantly lower cost per kilowatt-hour (kWh) than for existing electricity supply. However, additional on-shore wind installations are not planned at this stage and off-shore wind installations are possible but face public opposition and considerable permitting challenges. Bioresources were explored at length under the Hawaii Clean Energy Initiative launched in 2008 between the State of Hawaii and the U.S. Department of Energy (DOE), to collaborate on the reduction of Hawaii’s heavy dependence on imported fossil fuels. Over the years, bioresources have been identified as an important source of alternative fuels and an important area of research and development, although limited in scale as an energy resource due to Hawaii’s small land mass suitable for agriculture and the associated costs.
To assist government, regulatory, public, and commercial decision makers and other stakeholders, the focus of this article is to quantify the synergistic impacts of renewables on a small, isolated power grid together with EVs to reduce fossil fuel use and emissions, thus demonstrating what can be achieved, what is at risk, and timeline effects for similar communities across the world.
2. Methods and Assumptions
This study combines data from national and regional sources to quantify fossil fuel use and resulting CO2 emissions for the current and forecast shift from ICE vehicles to EVs combined with fossil fuel to renewable power generation on Oahu. Comparisons were made by fuel type (gasoline, diesel, and electric), and vehicle type (passenger and freight, EV and ICE), for combustion of the fuel either in the vehicle or at the power plant. Power generation data for 2017 through 2020 was used to calculate fossil fuel use and emissions. Projections for growing renewable electric power generation and EV adoption were used to analyze fossil fuel use and emissions through 2050.
2.1. Vehicle Efficiency and Fuel Use
Vehicles in this assessment include EVs running on electricity, and ICE vehicles that use gasoline or diesel on-board to produce power. Passenger vehicles in this article refer to all light-duty vehicles including all on-road cars, SUVs, vans, and pickup trucks registered for highway use. Freight vehicles refer to all medium- and heavy-duty vehicles including all on-road work vehicles, such as delivery vans, buses, and heavy trucks. This assessment does not compare all makes and models, but instead uses an average for each type of vehicle (passenger and freight, EV and ICE) for comparison purposes.
Vehicle fuel efficiency is based on the amount of energy consumed to travel a given distance. According to the U.S. DOE, Office of Energy Efficiency and Renewable Energy, “EVs convert over 77% of the electrical energy from the grid to power at the wheels”, and “Conventional gasoline vehicles only convert 12–30% of the energy stored in gasoline to power at the wheels” [9]. This makes EVs roughly four to six times more efficient than gasoline vehicles. EV efficiency reflects electric motor losses, and losses attributed to charging and discharging the battery [10]. Gasoline-powered ICE vehicles lose most of the energy in gasoline to engine and driveline inefficiencies such as thermal losses [11]. Improvements in vehicle efficiency or changes to the Corporate Average Fuel Economy (CAFÉ) standard are expected to affect all vehicles and are not included in this analysis.
To compare EV fuel efficiency with that of ICE vehicles, the U.S. Environmental Protection Agency (EPA) established ratings for vehicles powered by electricity based on the electric energy consumed to travel 100 miles, in kilowatt-hours per 100 miles (kWh/100 miles) [12]. New vehicles are required to display the EPA label with this and other information.
Drivers in North America, however, are familiar with the EPA ratings for the distance that can be traveled on a gallon of gasoline in Miles per Gallon (MPG), known as the “fuel economy”. The fuel efficiency measure for EVs is essentially the inverse–the energy it takes to travel a given distance (kWh/100 miles). So, unlike MPG where the higher the number the better the fuel economy, with EV fuel efficiency (in kWh/100 miles), the lower the number the better. As an example, a gasoline-powered car that gets 50 MPG uses 2 gallons of gasoline to travel 100 miles. A comparable electric car uses 25 kWh to travel 100 miles.
Therefore, to allow a reasonable comparison between different vehicle technologies and fuels, the EPA also established ratings in Miles Per Gallon Gasoline Equivalent (MPGe) [12]. MPGe represents the number of miles an EV can travel using electrical energy stored in the battery with the same energy content as a gallon of gasoline.
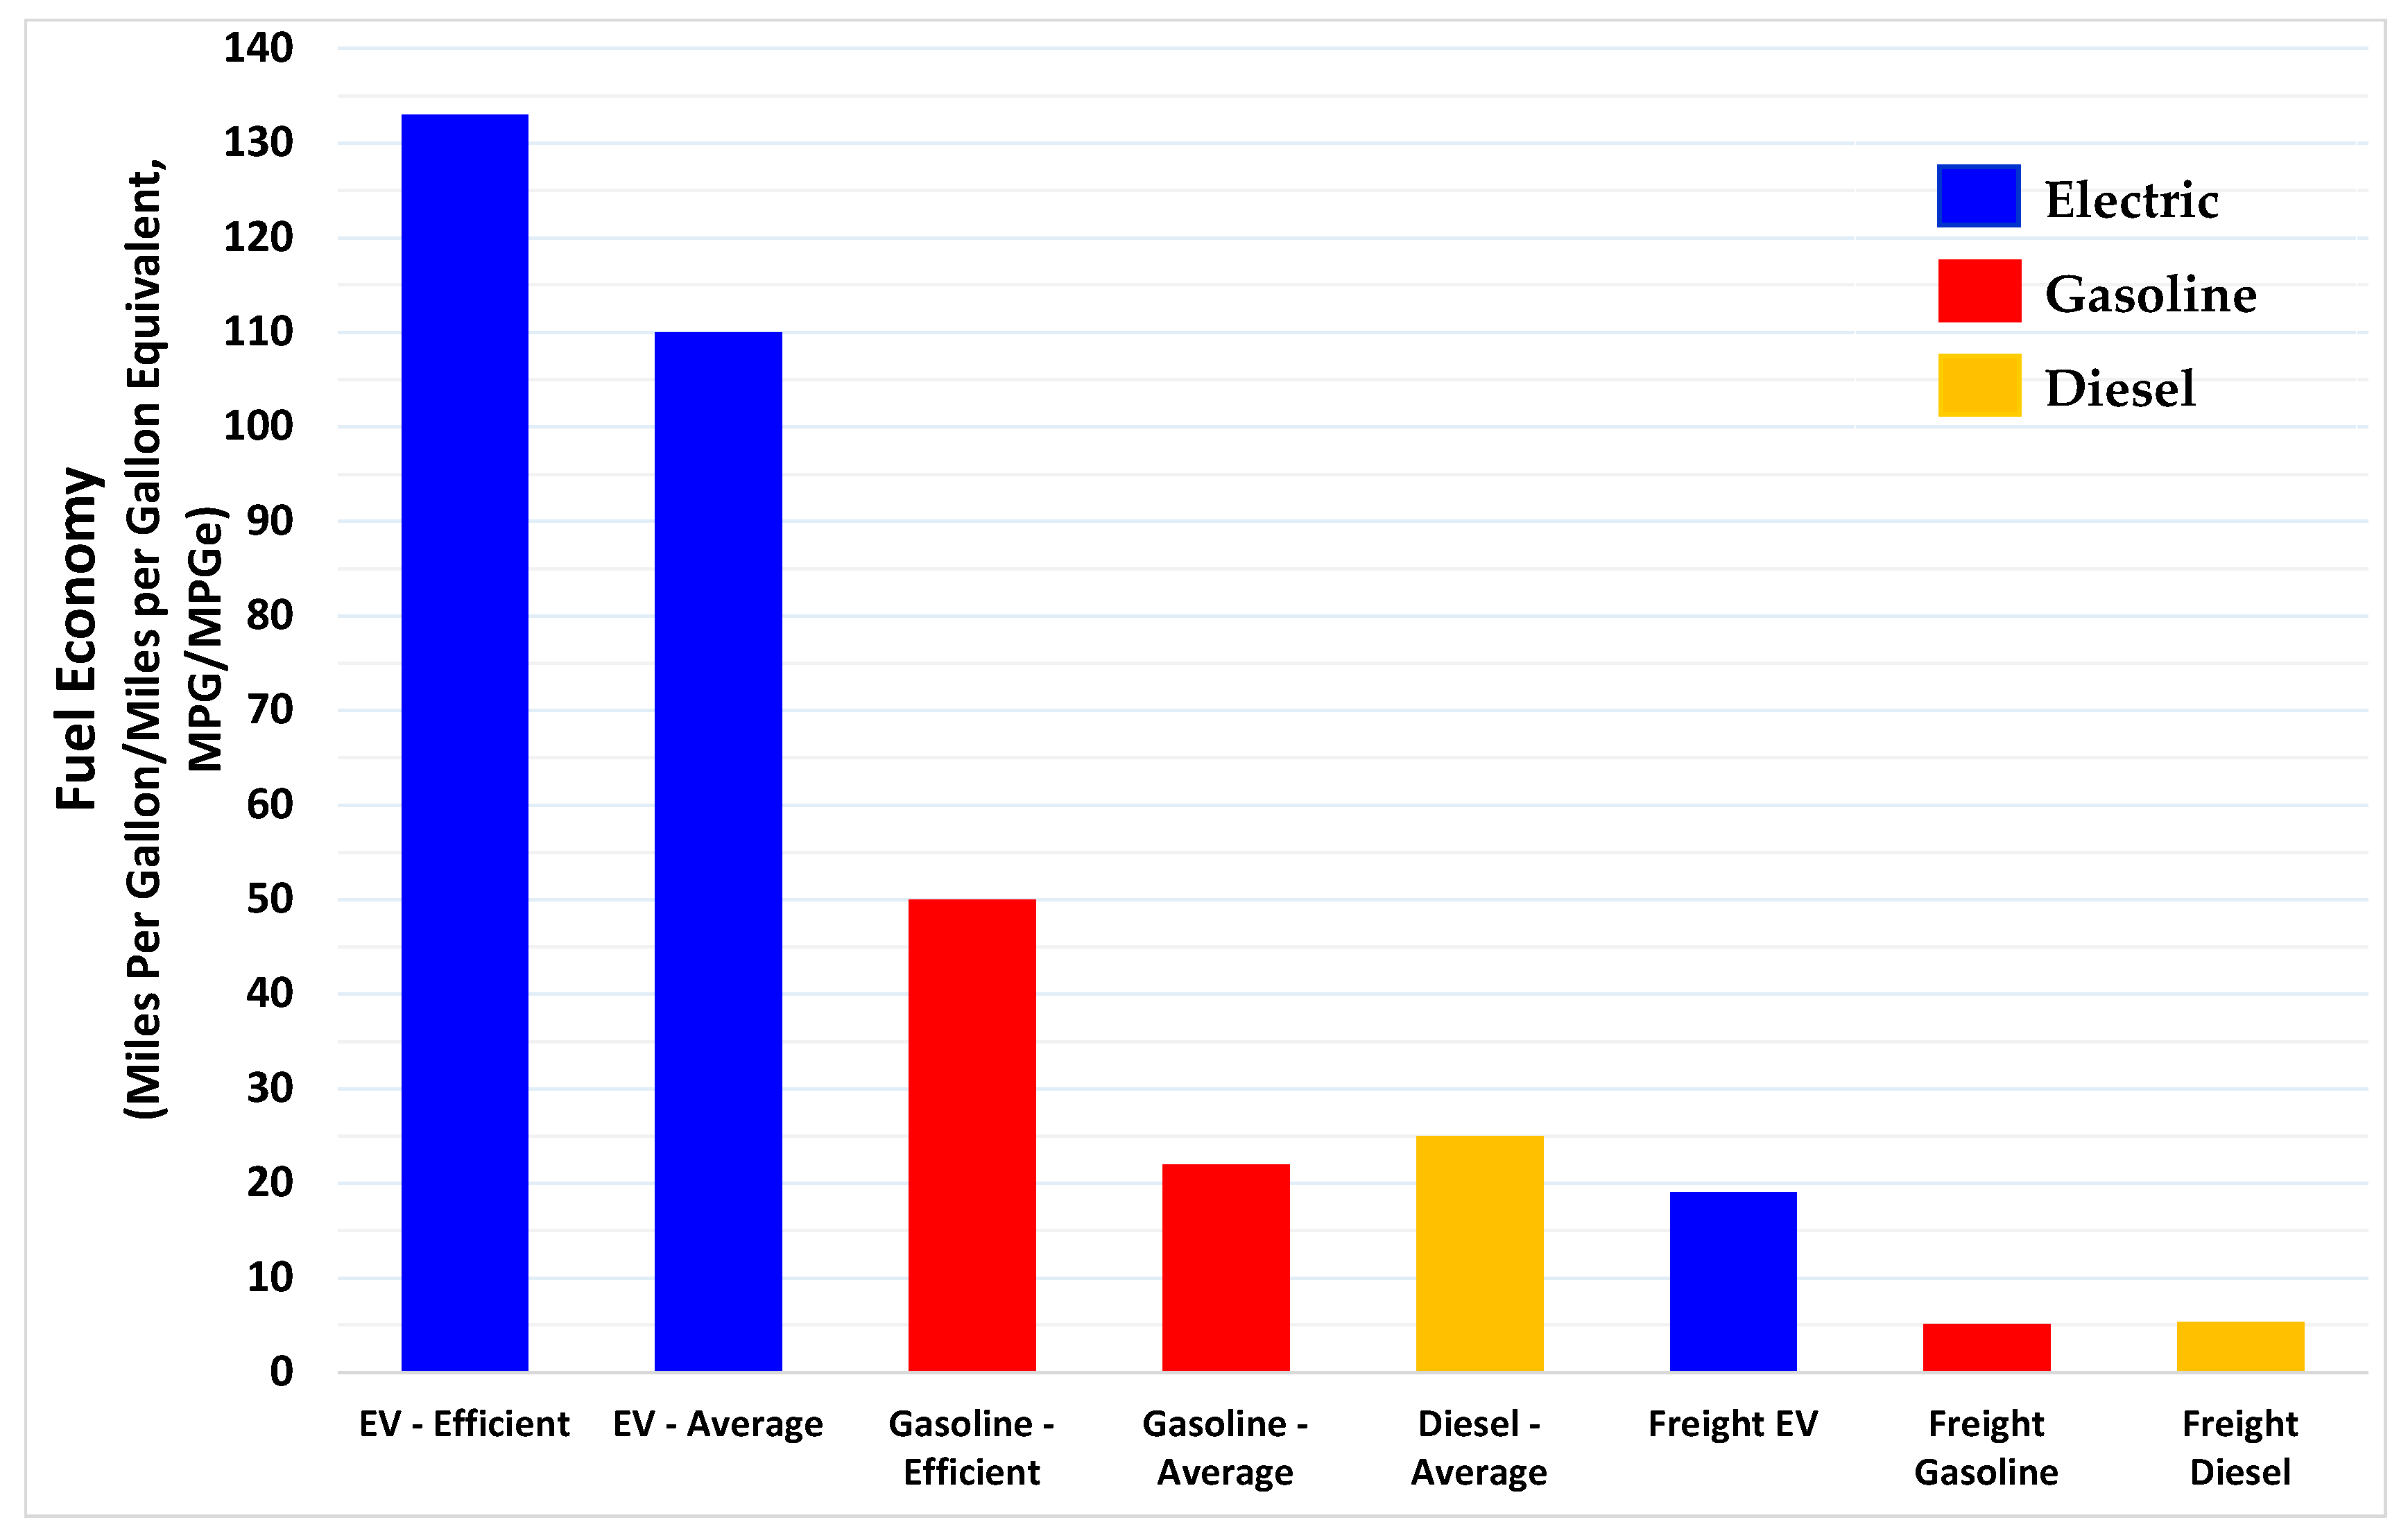
For this analysis, an average passenger vehicle’s fuel economy was based on the most recent data from the U.S. Department of Transportation’s national average of 22 MPG (from 2016, using a sales-weighted harmonic average for light duty vehicles which includes all cars, light trucks/pickup trucks, vans, and SUVs) [13], (Figure 2). An average EV’s fuel economy was based on the top selling EVs in Hawaii [14], with an average of 110 MPGe, or 32 kWh/100 miles (in 2017). For this assessment, we will simplify the unit for fuel efficiency to a per mile basis–in this case 0.32 kWh/mile. To account for the wide range of passenger vehicle models (from small cars to large pickup trucks and SUVs), a closer comparison was performed by examining the fuel use and emissions of efficient gasoline vehicles (typically gasoline-powered hybrids), with efficient EVs. The midpoint of several popular gasoline-powered hybrids (ranging from 42 to 58 MPG) was estimated at 50 MPG, and the midpoint of three popular efficient EVs was estimated at 133 MPGe, or 0.25 kWh/mile.
An average diesel passenger vehicle was assumed to be comparable to an average gasoline passenger vehicle since data is not available on fuel economy of diesel passenger vehicles. However, the additional energy in a gallon of diesel versus gasoline was factored in since diesel has a higher energy content per gallon that gasoline at 129,500 British Thermal Units (Btu) per gallon compared with gasoline at 114,000 Btu per gallon [15]. Using this ratio, the average diesel vehicle was calculated to get 25 MPGe (MPG equivalent to gasoline). The lack of data reported for biodiesel used for ground transportation in Hawaii prevented inclusion in this analysis. This would be an important consideration in any assessment of life cycle emissions since biodiesel qualifies as an Advanced Biofuel, with the EPA analysis showing that it reduces carbon emissions by 57–86% compared with petroleum diesel [16,17].
To assess freight vehicles, the most recent data for average fuel economy of medium- and heavy-duty gasoline and diesel freight vehicles [18] were compared with the average medium- and heavy-duty electric freight vehicles [19,20,21,22]. From the U.S. DOE’s Alternative Fuels Data Center (AFDC) (2016 data) [18], the average fuel economy of gasoline freight vehicles is 5.1 MPG, and the average for diesel is 5.3 MPG (Figure 2). A range of electric freight vehicles are being demonstrated and commercially deployed, ranging from delivery trucks to transit buses to refuse trucks. For this assessment, medium- and heavy-duty electric freight vehicles ranging from 0.5 to 3.2 kWh/mile [22] were considered for an average of 1.85 kWh/mile.
2.2. Electric Power Supply
Electric power generation for Oahu was calculated based on publicly available data from the U.S. Energy Information Administration (EIA). EIA collects data from electric power facilities with a minimum on-site nameplate capacity of one megawatt (MW). EIA’s Generation and Fuel Consumption Time Series Files were used for the years 2017 through 2020 [2,23,24,25]. To calculate the total electric power generated from each type of resource, values for the net generation from each power plant were totaled in megawatt-hours (MWh), as well as energy consumption to produce net electricity in million Btu (MBtu). The resources for Oahu include all petroleum products (distillate fuel oil/diesel, residual fuel oil, and waste oil), coal, wind, solar, biomass, and MSW.
In Hawaii, a significant amount of renewable power is generated by small PV systems which are below the EIA’s minimum nameplate capacity of one MW. Consequently, it was important to obtain regional level data. Hawaiian Electric Industries’ Renewable Portfolio Standard Status Reports, filed with the Hawaii Public Utilities Commission for 2017 through 2020 [3,26,27,28] were used to obtain the total estimated renewable power generation. These data include measured and estimated electric power from customer-sited and distributed solar PV, a significant part of renewable energy generation that contributes to meeting the utilities’ RPS. Solar power generation on Oahu provided 19% of the total power generation in 2020 (but only a small fraction of that is captured in the EIA data). Renewables generation (in MWh) from the RPS reports was scaled to the EIA fuel consumption energy (MBtu) for each renewable fuel.
Electricity consumed to power EVs was calculated on an annual basis, so this analysis assumes a steady or uniform charging rate over the course of the year. Accordingly, fossil fuel consumption per mile and per year reflect the annual average.
2.3. Fossil Fuel Use per Vehicle
Fuel use was calculated as a measure of the annual energy consumed by the vehicle (electricity for EVs, and gasoline or diesel for ICE vehicles). Fuel use was calculated from the distance traveled per year divided by the fuel economy. Passenger vehicles on Oahu travel an average of 10,000 miles per year based on a survey conducted for Oahu [29]. Freight vehicles travel an average of 26,811 miles per year based on the DOE’s AFDC “Average Annual Vehicle Miles Traveled by Major Vehicle Category” [30]. The major freight vehicle categories included are delivery trucks, transit buses, paratransit shuttles, school buses, and refuse trucks. Since interstate freight for Hawaii is conveyed by sea and air, interstate Class 8 trucks were not included in this analysis.
The next step was done to account for the quantity of fossil fuel used to generate electricity, so that fossil fuel use could be compared between EVs and ICE vehicles. The fuel use for EVs was multiplied by the percent of electricity generated from fossil fuels. Fossil fuel use from electric power production for EVs, along with gasoline and diesel use for ICE vehicles was then compared using the equivalent energy content of the fuels.
To estimate the total annual fossil fuel use, the average passenger vehicle’s fossil fuel use was multiplied by the total number of passenger vehicles, for EVs, gasoline- and diesel-powered ICE vehicles on the island (at the end of 2020). Since diesel passenger vehicles comprise only 0.4% of passenger vehicles on Oahu, all ICE passenger vehicles were treated as gasoline-powered (for the sake of simplicity with this assessment). However, diesel freight vehicles comprise 25% of all freight vehicles, so total annual fossil fuel use for both gasoline and diesel freight vehicles was calculated, along with the total for electric freight vehicles.
To help assess the long-term impact of decisions made today, the cumulative fossil fuel use over time was calculated by adding the annual figures as EVs replace ICE vehicles and renewable power generation replaces fossil fuels.
2.4. CO2 Emissions
As a measure GHG emissions produced by EVs, CO2 emissions were estimated from combustion of fuel at the power plants on Oahu. EIA Carbon Dioxide Emissions Coefficients (in kilograms of CO2 emitted per Btu of fossil fuel consumed) [31] were used and converted to kilograms of CO2 per kWh (kg CO2/kWh). Based on the amount of each fuel source’s emissions, an overall emission factor for electricity on Oahu was then calculated from the total CO2 emissions divided by the total electric power produced for 2017 through 2020. The CO2 emission factor was multiplied by vehicle fuel efficiency (kWh/mile) to derive the emissions per mile.
For ICE vehicles, CO2 emissions per mile were estimated from the combustion of gasoline and diesel based on the U.S. EPA [32], which reflects tailpipe emissions from the combustion of the onboard fuel (8.78 kg CO2/gallon gasoline, 10.21 kg CO2/gallon diesel). EPA data over the years indicate that no significant improvement in emissions from a gallon of either fuel can be expected.
Total annual emissions were calculated by multiplying the average per mile emissions by the number of miles traveled per year, then by the total number of vehicles on Oahu at the end of 2020. Cumulative CO2 emissions were also calculated to assess the impact of GHG emissions accumulating over the coming years.
2.5. Projections for Renewable Electricity
Projections were used to quantify and contrast fossil fuel consumption and CO2 emissions as fossil fuel power generation is replaced with renewables, concurrently with EVs replacing gasoline and diesel vehicles on the road. Scenarios modeled in this study include two projections for renewable power replacing fossil fuels. The more ambitious of these two projections is from the electric utility, Hawaii Electric Companies (Honolulu, HI, USA), and the somewhat slower is using the State’s mandated RPS goals. Projections for electric power generation from national databases and methodologies were not used, since Hawaii and Alaska are not included [33,34]. Projections used in this study provide a limited set of data points and are intended as illustrative examples.
Utility projections for renewable power were obtained from Hawaiian Electric press releases [35,36]. According to a recent press release, renewable power generation provided by Hawaiian Electric for the islands of Oahu, Maui County and Hawaii Island combined is projected to reach 60% by 2025, with Hawaii Island at 100% and Maui at 90% [35]. (Electric power for the Island of Kauai is provided by Kauai Island Utility Cooperative (Lihue, HI, USA). Based on this projection and using the share of power generation on each island, approximately 48% renewables are calculated for Oahu’s power grid by 2025. This calculation assumes net electricity generation remains flat. From an earlier press release, the combined renewables for all three islands were projected to reach 72% by 2030, and 100% by 2040, five years earlier than the State’s mandated RPS [36]. For this analysis, it is assumed Hawaii Island and Maui both reach 100% by 2030, and approximately 63% renewables are then calculated for Oahu (based on the share of power generation on each island, and assuming net electricity generation remains flat).
The utility’s projections for renewable electricity generation are in terms of the percentage of electricity sales from renewables (as recorded for the RPS). However, in this assessment, EIA data on the net electricity generation for each power plant on Oahu was used to quantify fossil fuel use and emissions for passenger and freight EVs for 2017 through 2020. For each of these years, the net generation was within 2.9–4.2% of the RPS value. Since the intent of this analysis is to provide a method and illustrative example, the RPS projections are used as an approximation of annual, net electricity generation to achieve a reasonable estimate of the likely impact on fossil fuel use and CO2 emissions.
Renewable power generation projections were modeled from 2020 to 2040 using a three-parameter polynomial fit. The calculated value for 2020 provided a starting point and these utility projections for the interim values for 2025 and 2030 were used, with the final projected 100% renewables by 2040. To illustrate the continuing impacts of renewable electricity beyond 2040, a steady level of renewables is assumed beyond 2040 to 2050.
Since biomass, MSW, and biofuels are expected to contribute to the renewable energy mix going forward, the 2020 CO2 emissions from these sources were used as a baseline emission level once renewables reach 100%. This is not meant as a forecast of expected bioresources, but simply to account for combustion emissions from some renewables. Additional renewables from 2020 through 2040 are assumed to emit no CO2 emissions as is the case for wind and solar, and other potential sources of renewable power in the future, such as wave energy.
In addition to the utility’s projections, a second projection was based on the RPS goals of 40% by 2030, 70% by 2040, and 100% by 2045 for the somewhat slower but mandated integration of renewable power.
2.6. Projections for EV Adoption
The transition to EVs is based on two projections, a relatively fast global EV projection, and a slower, more conservative EV projection from Hawaiian Electric Companies. These projections provide a limited set of data points and are intended as examples. According to the International Energy Agency’s Global EV Outlook 2020, a sustainable scenario for EV adoption leads to 12.25% of vehicles on the road being EVs by 2030 [37]. Using this figure for EV adoption on Oahu, projections were modeled from 2020 to 2050 using a four-parameter polynomial fit. Recorded values from 2020 EV registrations were used as a starting point. For simplicity, it was assumed EVs completely replace ICE vehicles by 2050. The total numbers of passenger and freight vehicles were assumed to remain constant and were represented by the number of register vehicles on Oahu in 2020.
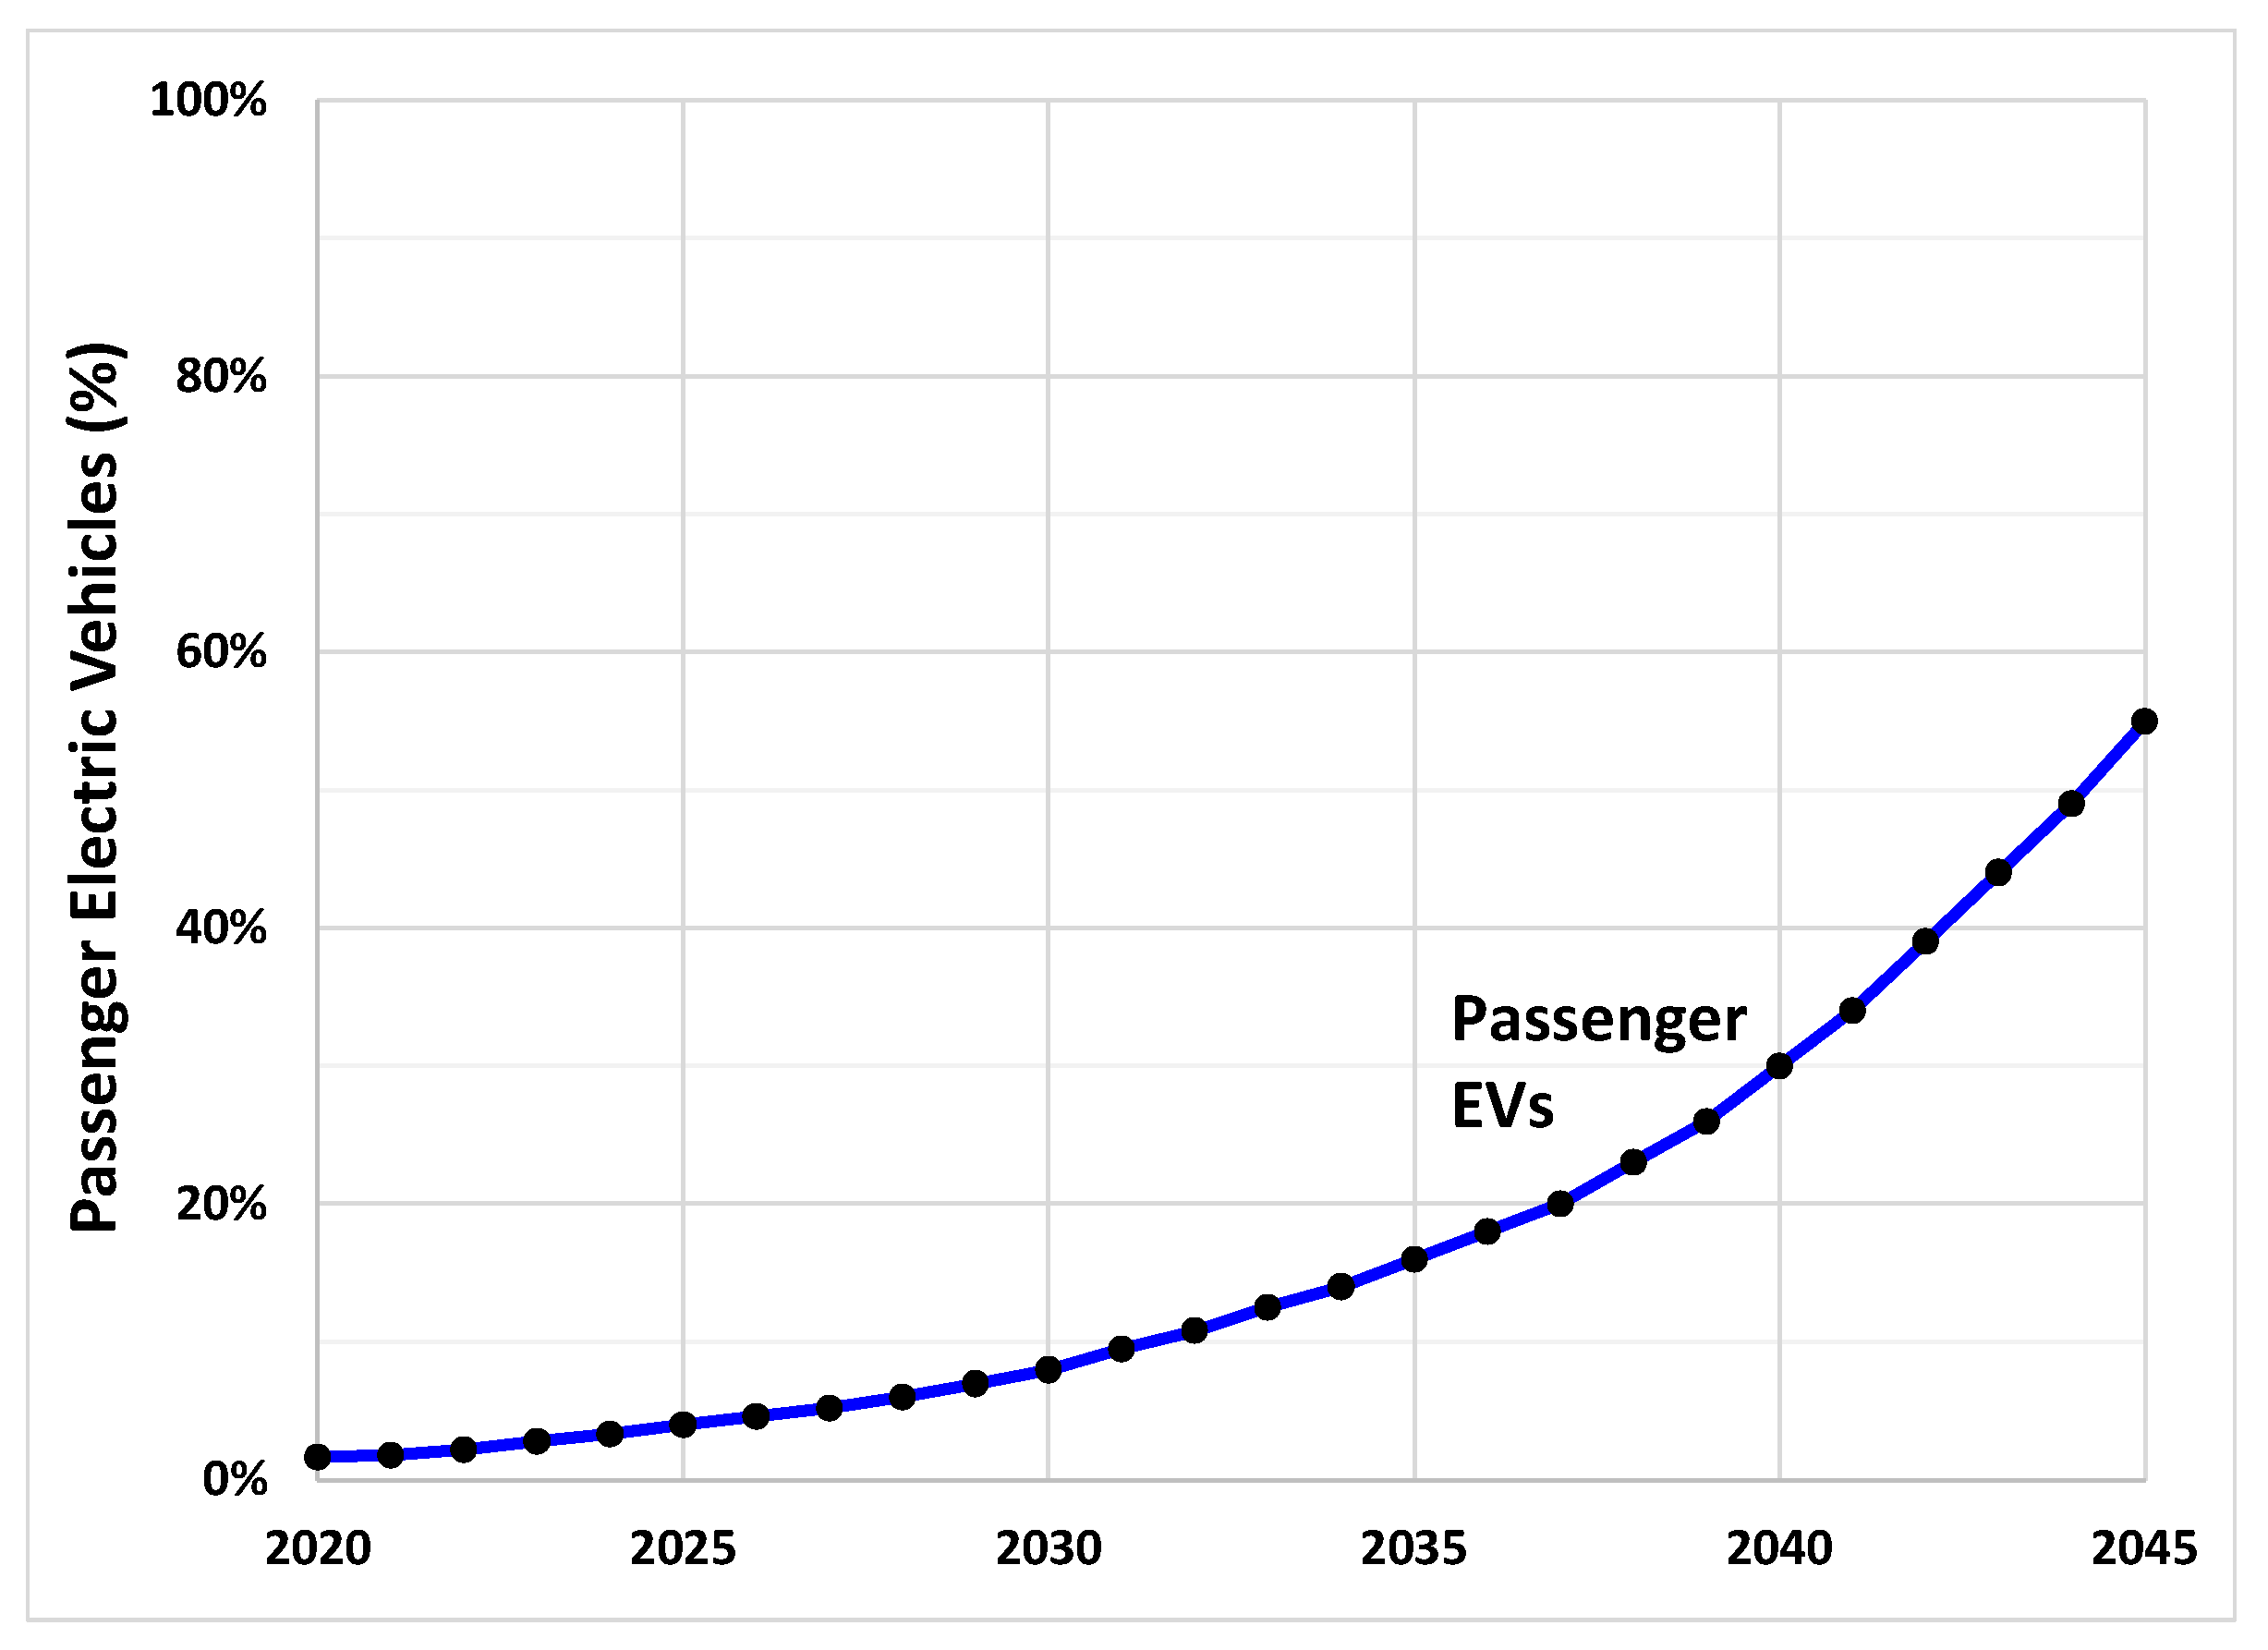
Focusing on passenger vehicles, a more gradual projection for EVs replacing ICE vehicles was included in this analysis, using data approximated from Hawaii Electric Companies’ Electrification of Transportation Roadmap [7]. EVs in this projection reach 55% of all passenger vehicles on Oahu by 2045. Along with the global projection, this utility projection was used to assess the total fossil fuel use and emissions, for both renewable electricity cases (the utility’s projection, and the RPS goals).
2.7. Fossil Fuel Use and CO2 Emissions
Using scenarios with these combined projections for this analysis, the annual fossil fuel use and CO2 emissions were assessed as EVs replace ICE passenger vehicles, and as renewables replace fossil fuel power generation. All passenger ICE vehicles were assumed to be gasoline-powered to simplify inputs (as diesel-powered vehicles constitute 0.4% all passenger vehicles on Oahu). Freight fossil fuel use was also analyzed, but gasoline and diesel fossil fuel consumption and emissions were used to be representative of the significant portion of diesel-powered freight vehicles (at 25% of all freight vehicles).
3. Results
3.1. Electric Power Supply Fossil Fuel Use and Emissions
Oahu currently depends on imported fossil fuels for 72% of its power generation (by net electricity generation, Table 1). Fossil fuel dependency has decreased over the years as solar and wind were added to the power grid. From 2017 through 2019, annual decreases in fossil fuel were just over 1% per year, but from 2019 to 2020 fossil fuel generation fell 6.6%. This was a result of utility scale solar and wind coming online, along with continued additions of residential and distributed solar power. CO2 emissions showed similar declines over the years, from an average of 0.71 kg CO2/kWh in 2017 to 0.63 kg CO2/kWh by 2020 (Table 1).
3.2. Fossil Fuel Use per Vehicle
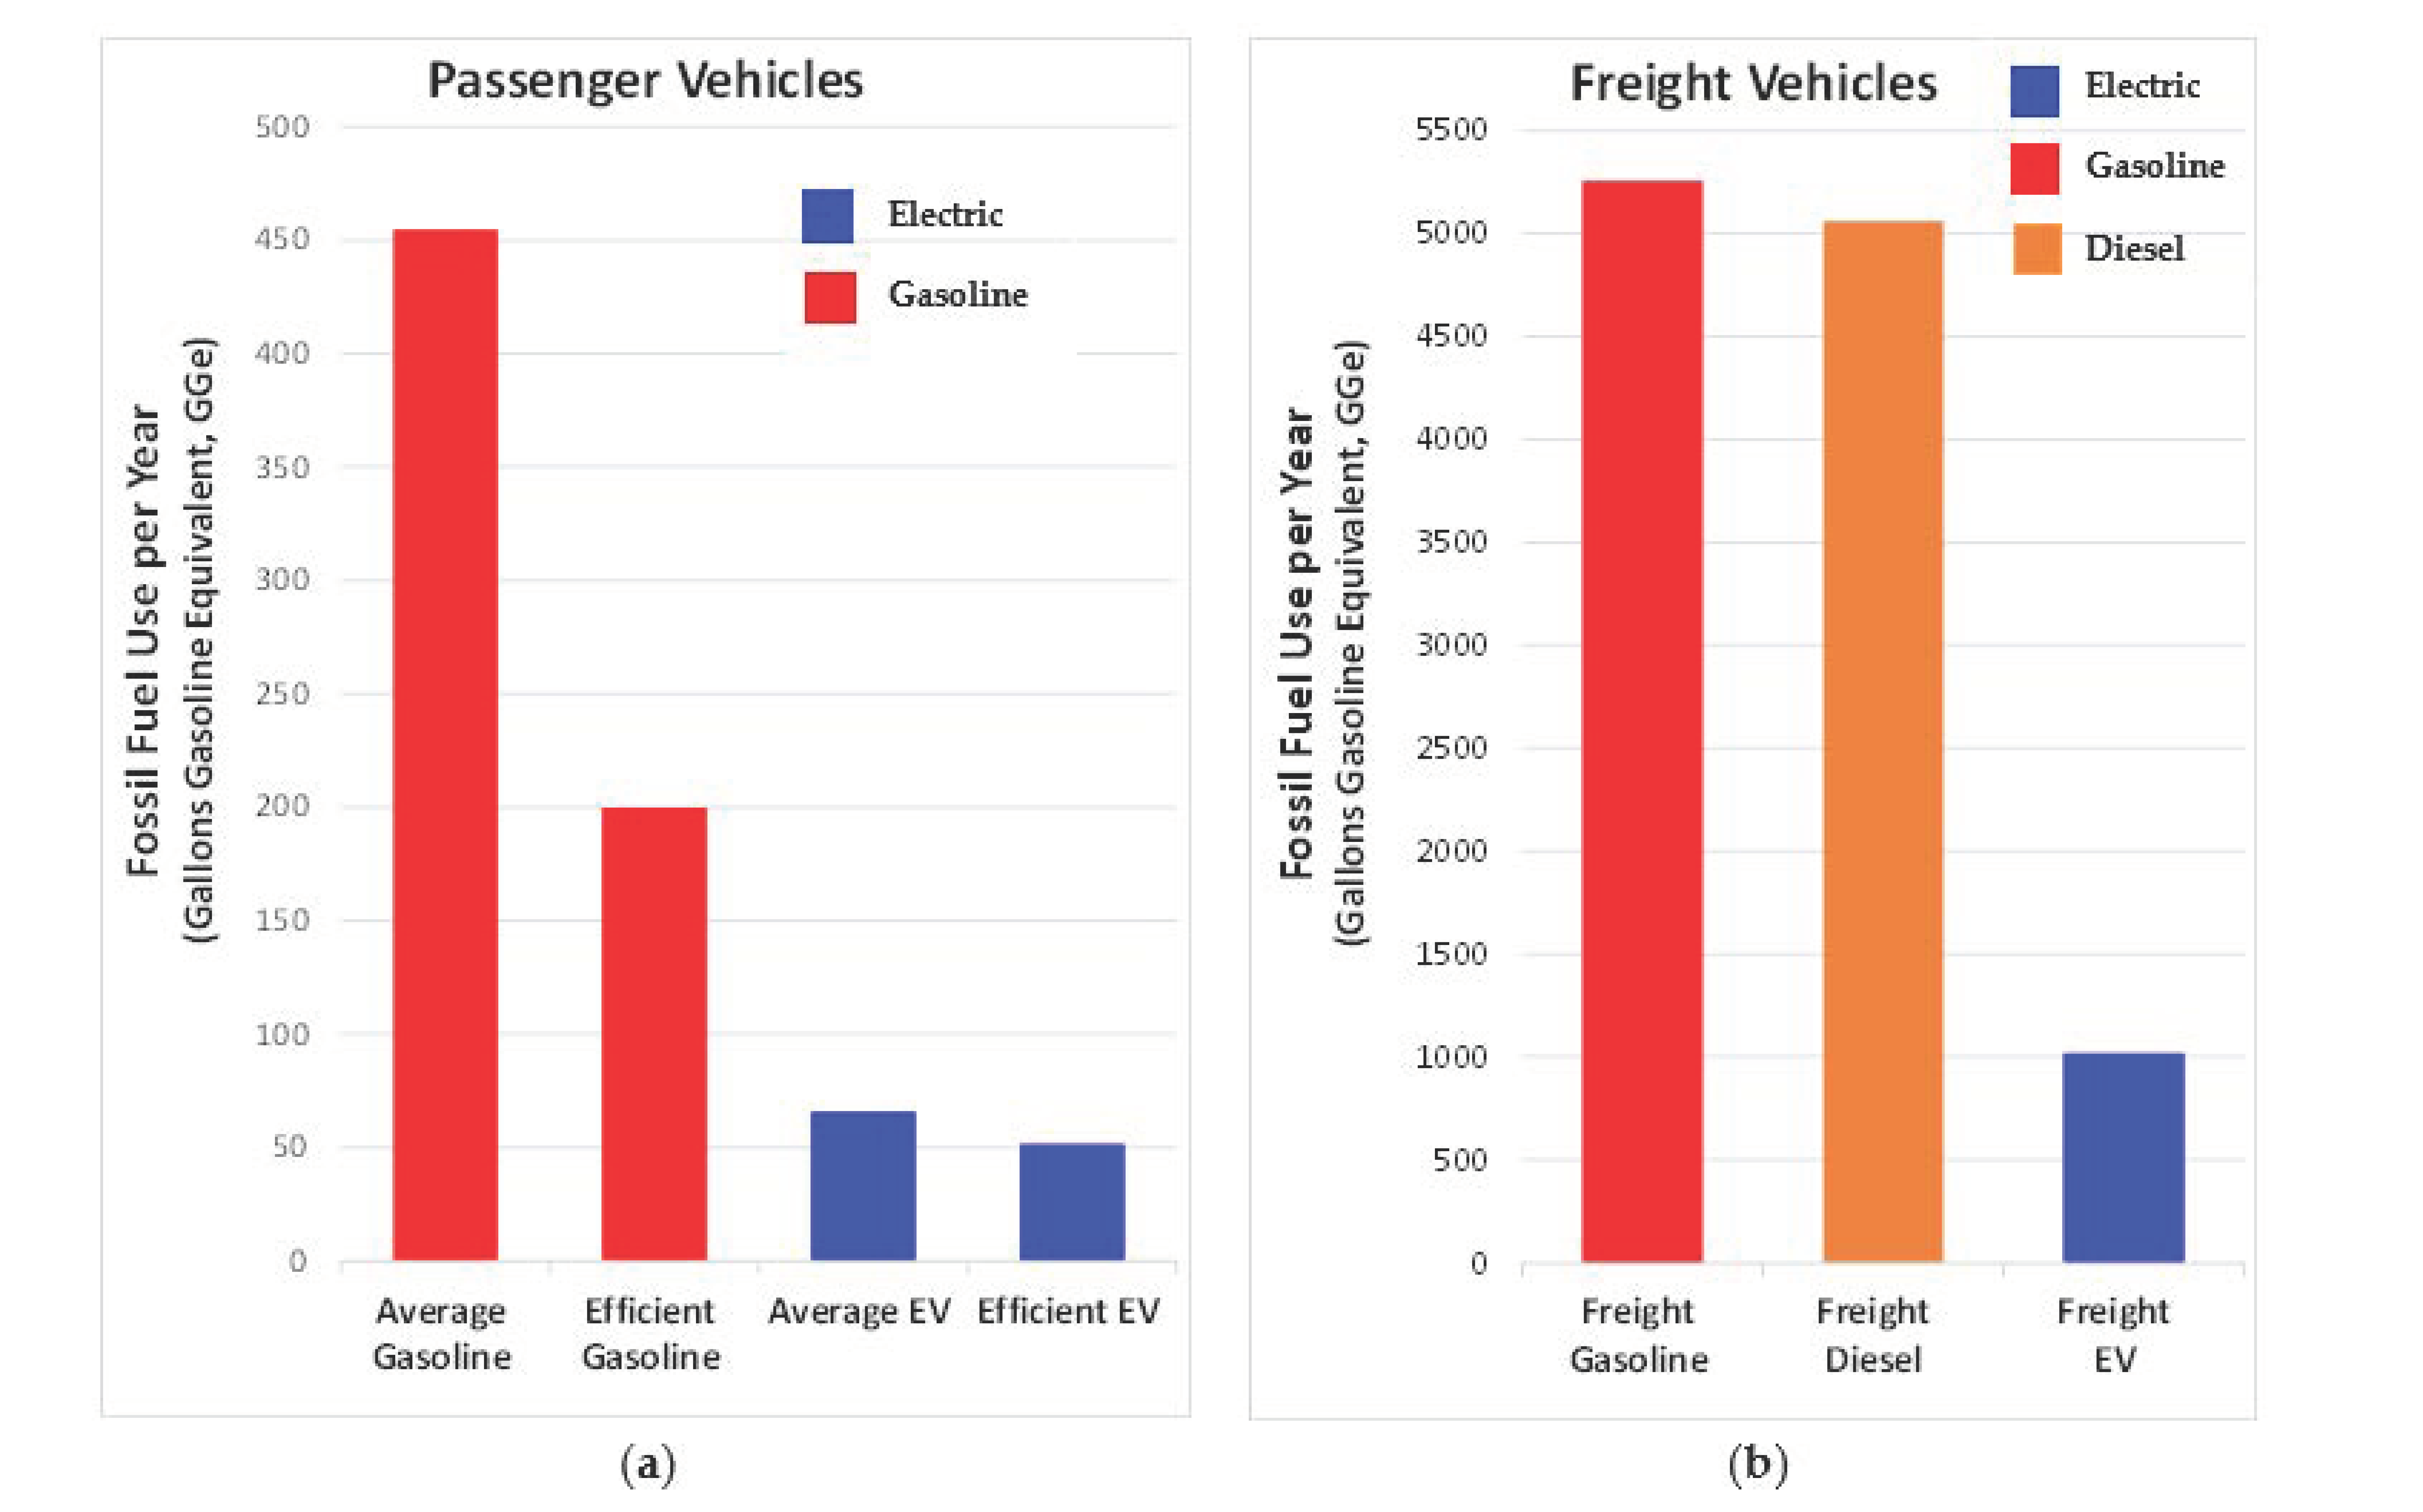
Based on 2020 data, the average passenger EV on Oahu used only 14% of the fossil fuel used by an average gasoline passenger vehicle (Figure 3). As a result, each passenger gasoline vehicle replaced with an EV reduced fossil fuel consumption by the equivalent of 389 gallons of gasoline in 2020. Smaller, more efficient EVs used 26% of the fossil fuel used by smaller and more efficient gasoline passenger vehicles for that same year (the equivalent of about 149 gallons of gasoline). Similarly, the average freight EV used 19% of the fossil fuel consumed by the average freight gasoline vehicle, and 20% compared with diesel. As such, each freight vehicle replaced with a freight EV reduced fossil fuel consumption by more than 4000 gallons of gasoline in 2020.
3.3. Emissions per Vehicle
The average passenger EV powered on Oahu in 2020 emitted half the CO2 emissions per mile compared with an average passenger gasoline or diesel vehicle (Keeping in mind the average diesel passenger vehicle is assumed to have similar fuel efficiency as an average gasoline passenger vehicle.) With increasing solar and wind power generation, emissions from EVs are decreasing each year while ICE vehicle emissions remain relatively constant (Table 2).
Even efficient (hybrid) gasoline-powered passenger vehicles which had slightly lower CO2 emissions than efficient EVs at the beginning of this study (2017) were surpassed by their EV counterparts in 2018. By 2020, efficient EVs emitted 9% less CO2 than efficient gasoline-powered vehicles.
In 2020, the average electric freight vehicle emitted 32% less CO2 emissions per mile versus an average gasoline freight vehicle, and about 40% less than an average diesel freight vehicle (average gasoline and diesel freight vehicle fuel economy was calculated for this study from available data, whereas passenger gasoline and diesel vehicles were assumed to have similar fuel economy because of the lack of data on diesel passenger vehicles).
On an annualized basis, an average passenger EV emitted 2 metric tons (MT) CO2 compared with 4 MTCO2 for an average gasoline-powered passenger vehicle in 2020. An average electric freight vehicle produced 31 MTCO2 compared with 46 MTCO2 from an average gasoline freight vehicle, and 52 MTCO2 for diesel.
3.4. Total Annual Fossil Fuel Use and Emissions
To quantify the impact of all vehicles on the road, fossil fuel use and emissions for each vehicle and fuel type were multiplied by the total numbers on Oahu at the end of 2020. Passenger vehicles comprise the largest share of all vehicles registered on Oahu (93%), far outnumbering freight vehicles (7%) [38]. Although only 1.7% of all passenger vehicles were electric by the end of 2020, the number of EVs increased by 45% in 2020 while the total number of passenger vehicles decreased by 2%. The number of electric freight vehicles was small but increased 57% in 2020, while the overall number of freight vehicles decreased by 1.5%.
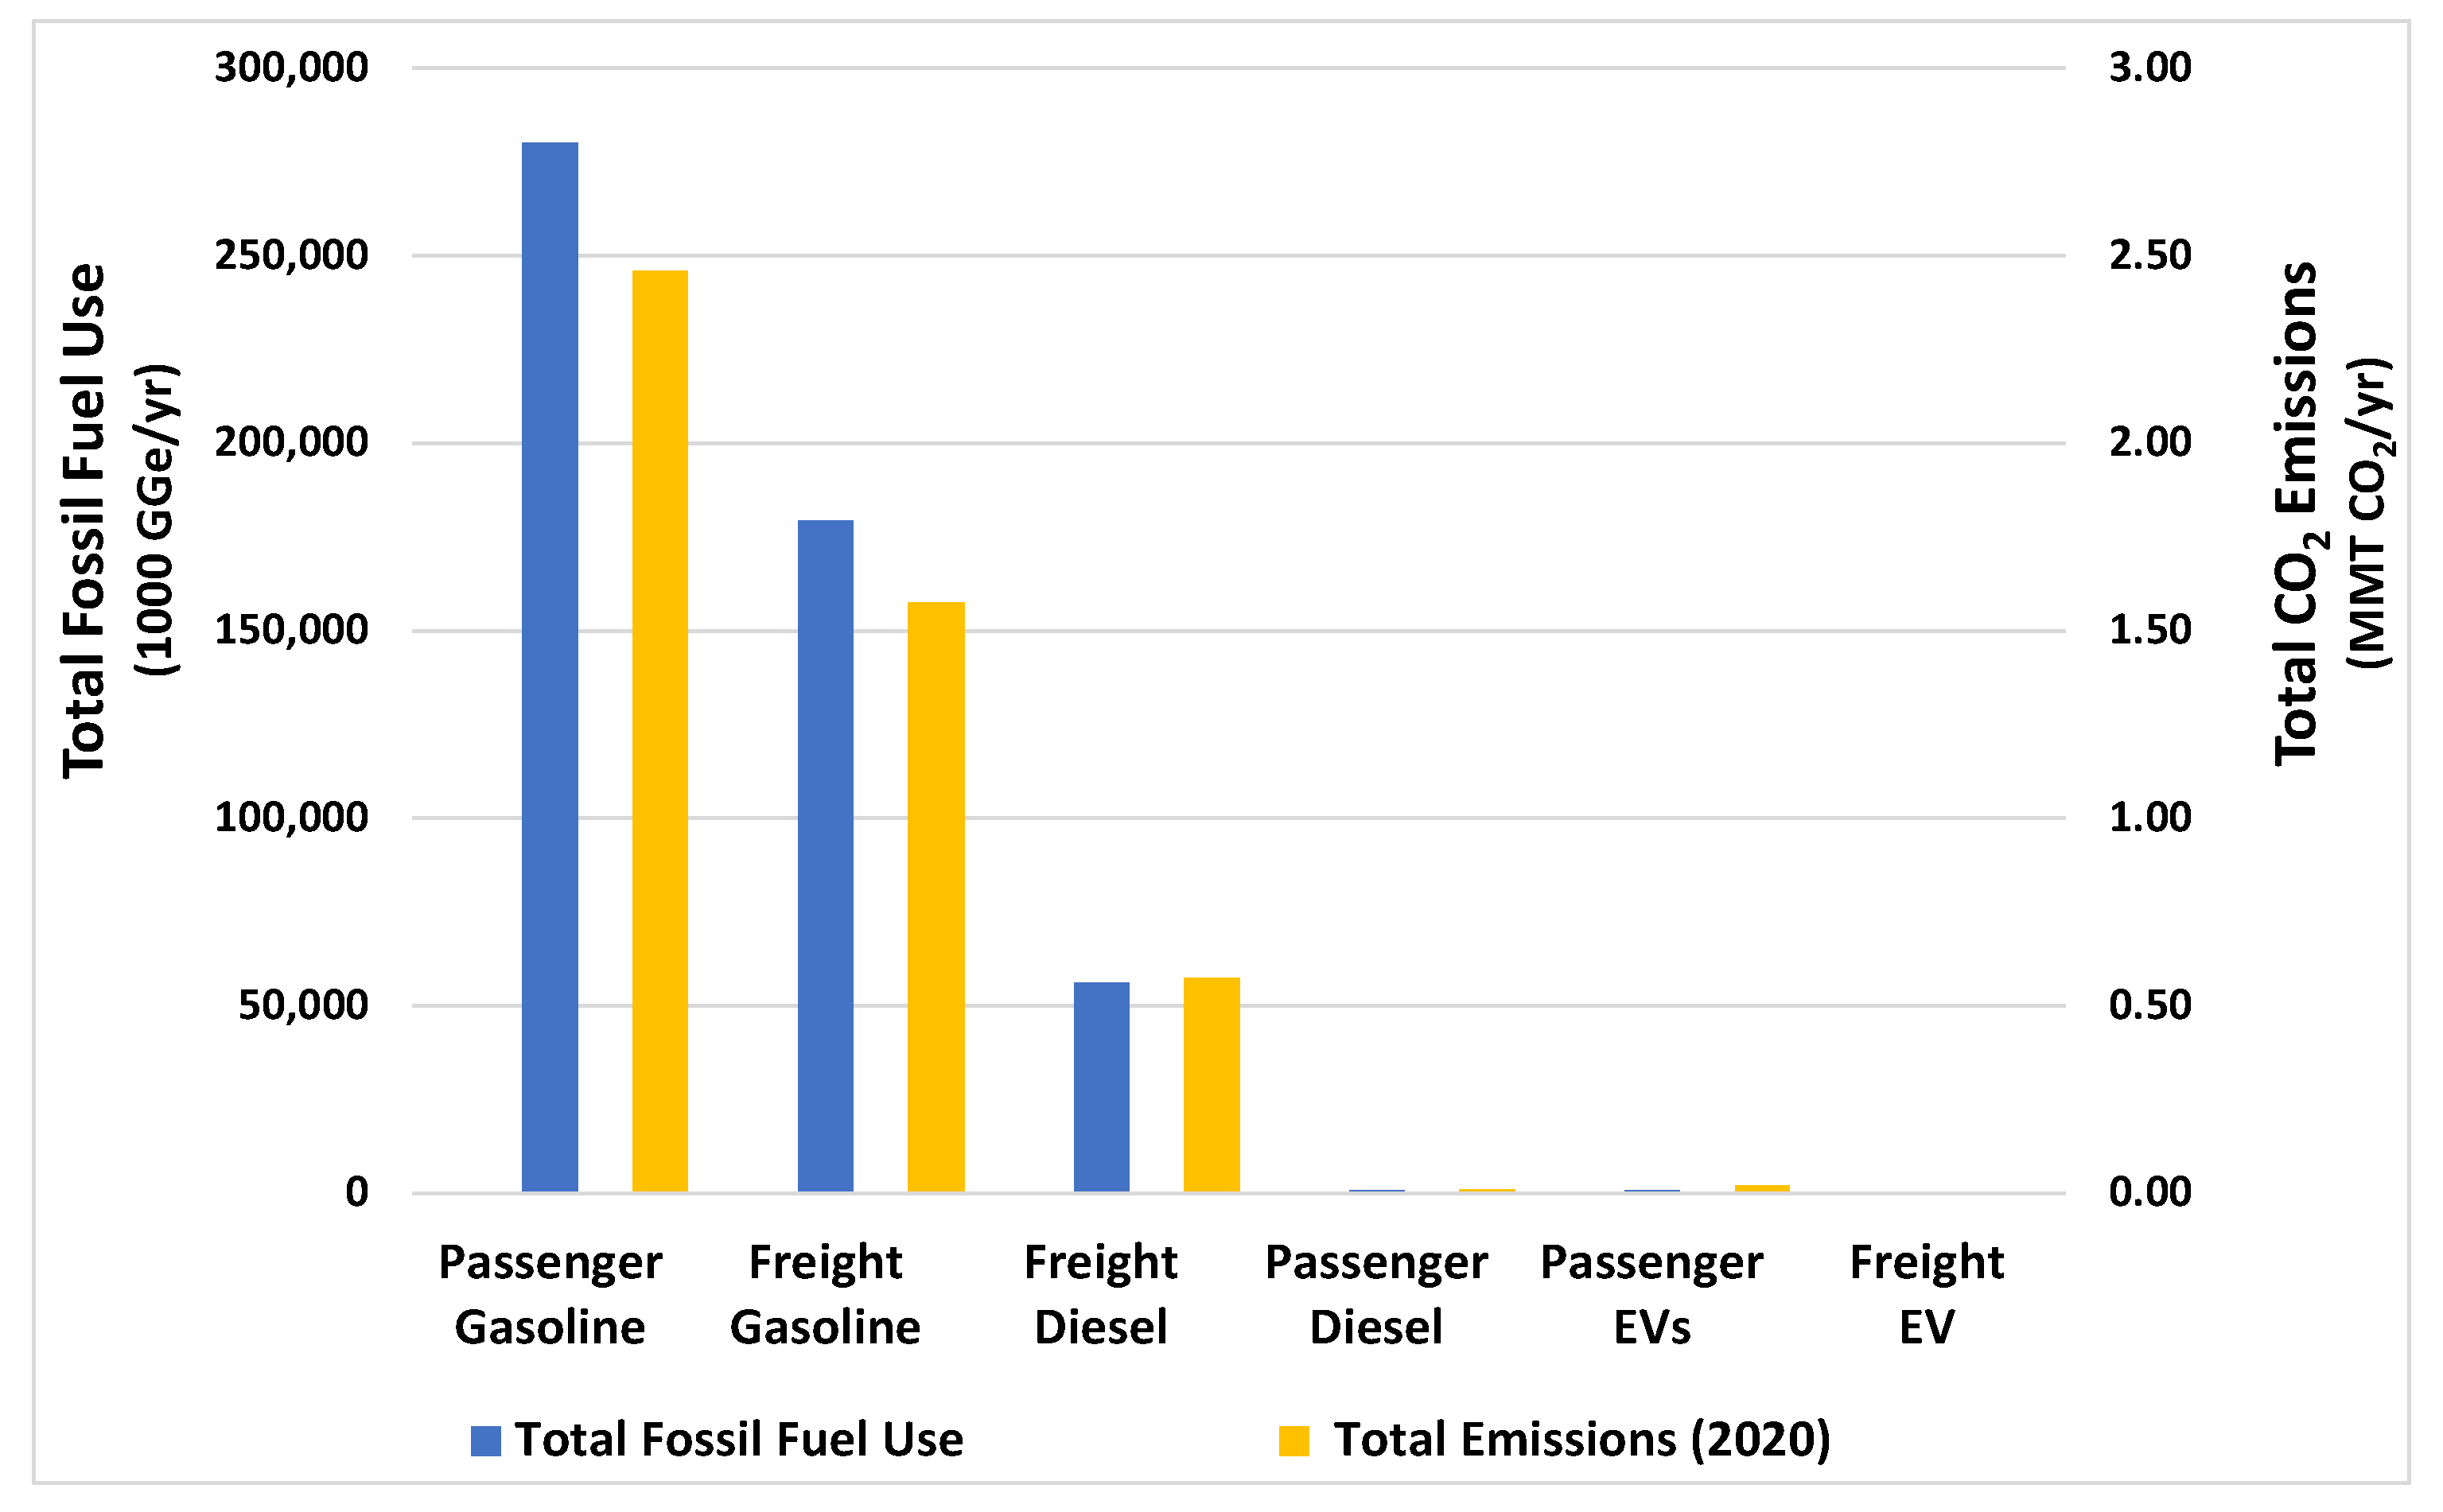
All passenger and freight ICE vehicles on Oahu consumed the equivalent of approximately 517 million gallons of gasoline in 2020 (Figure 4). Due to their sheer numbers, passenger ICE vehicles account for 54% of the total fossil fuel use (281 million equivalent gallons of gasoline), and freight ICE 46% (236 million equivalent gallons). Keeping in mind the small number EVs in 2020, all electric passenger and freight vehicles combined used 0.14% of the total fossil fuel use (0.72 million equivalent gallons).
Similarly in 2020, all passenger and freight ICE vehicles on Oahu produced about 4.6 MMT CO2 emissions, while passenger ICE vehicles accounted for 2.5 MMT CO2 (53%), and freight ICE vehicles 2.1 MMT CO2 (47%). All electric passenger and freight vehicles combined produced 0.01 MMT CO2 (0.02% of the total emissions).
3.5. Renewable Power to 2050
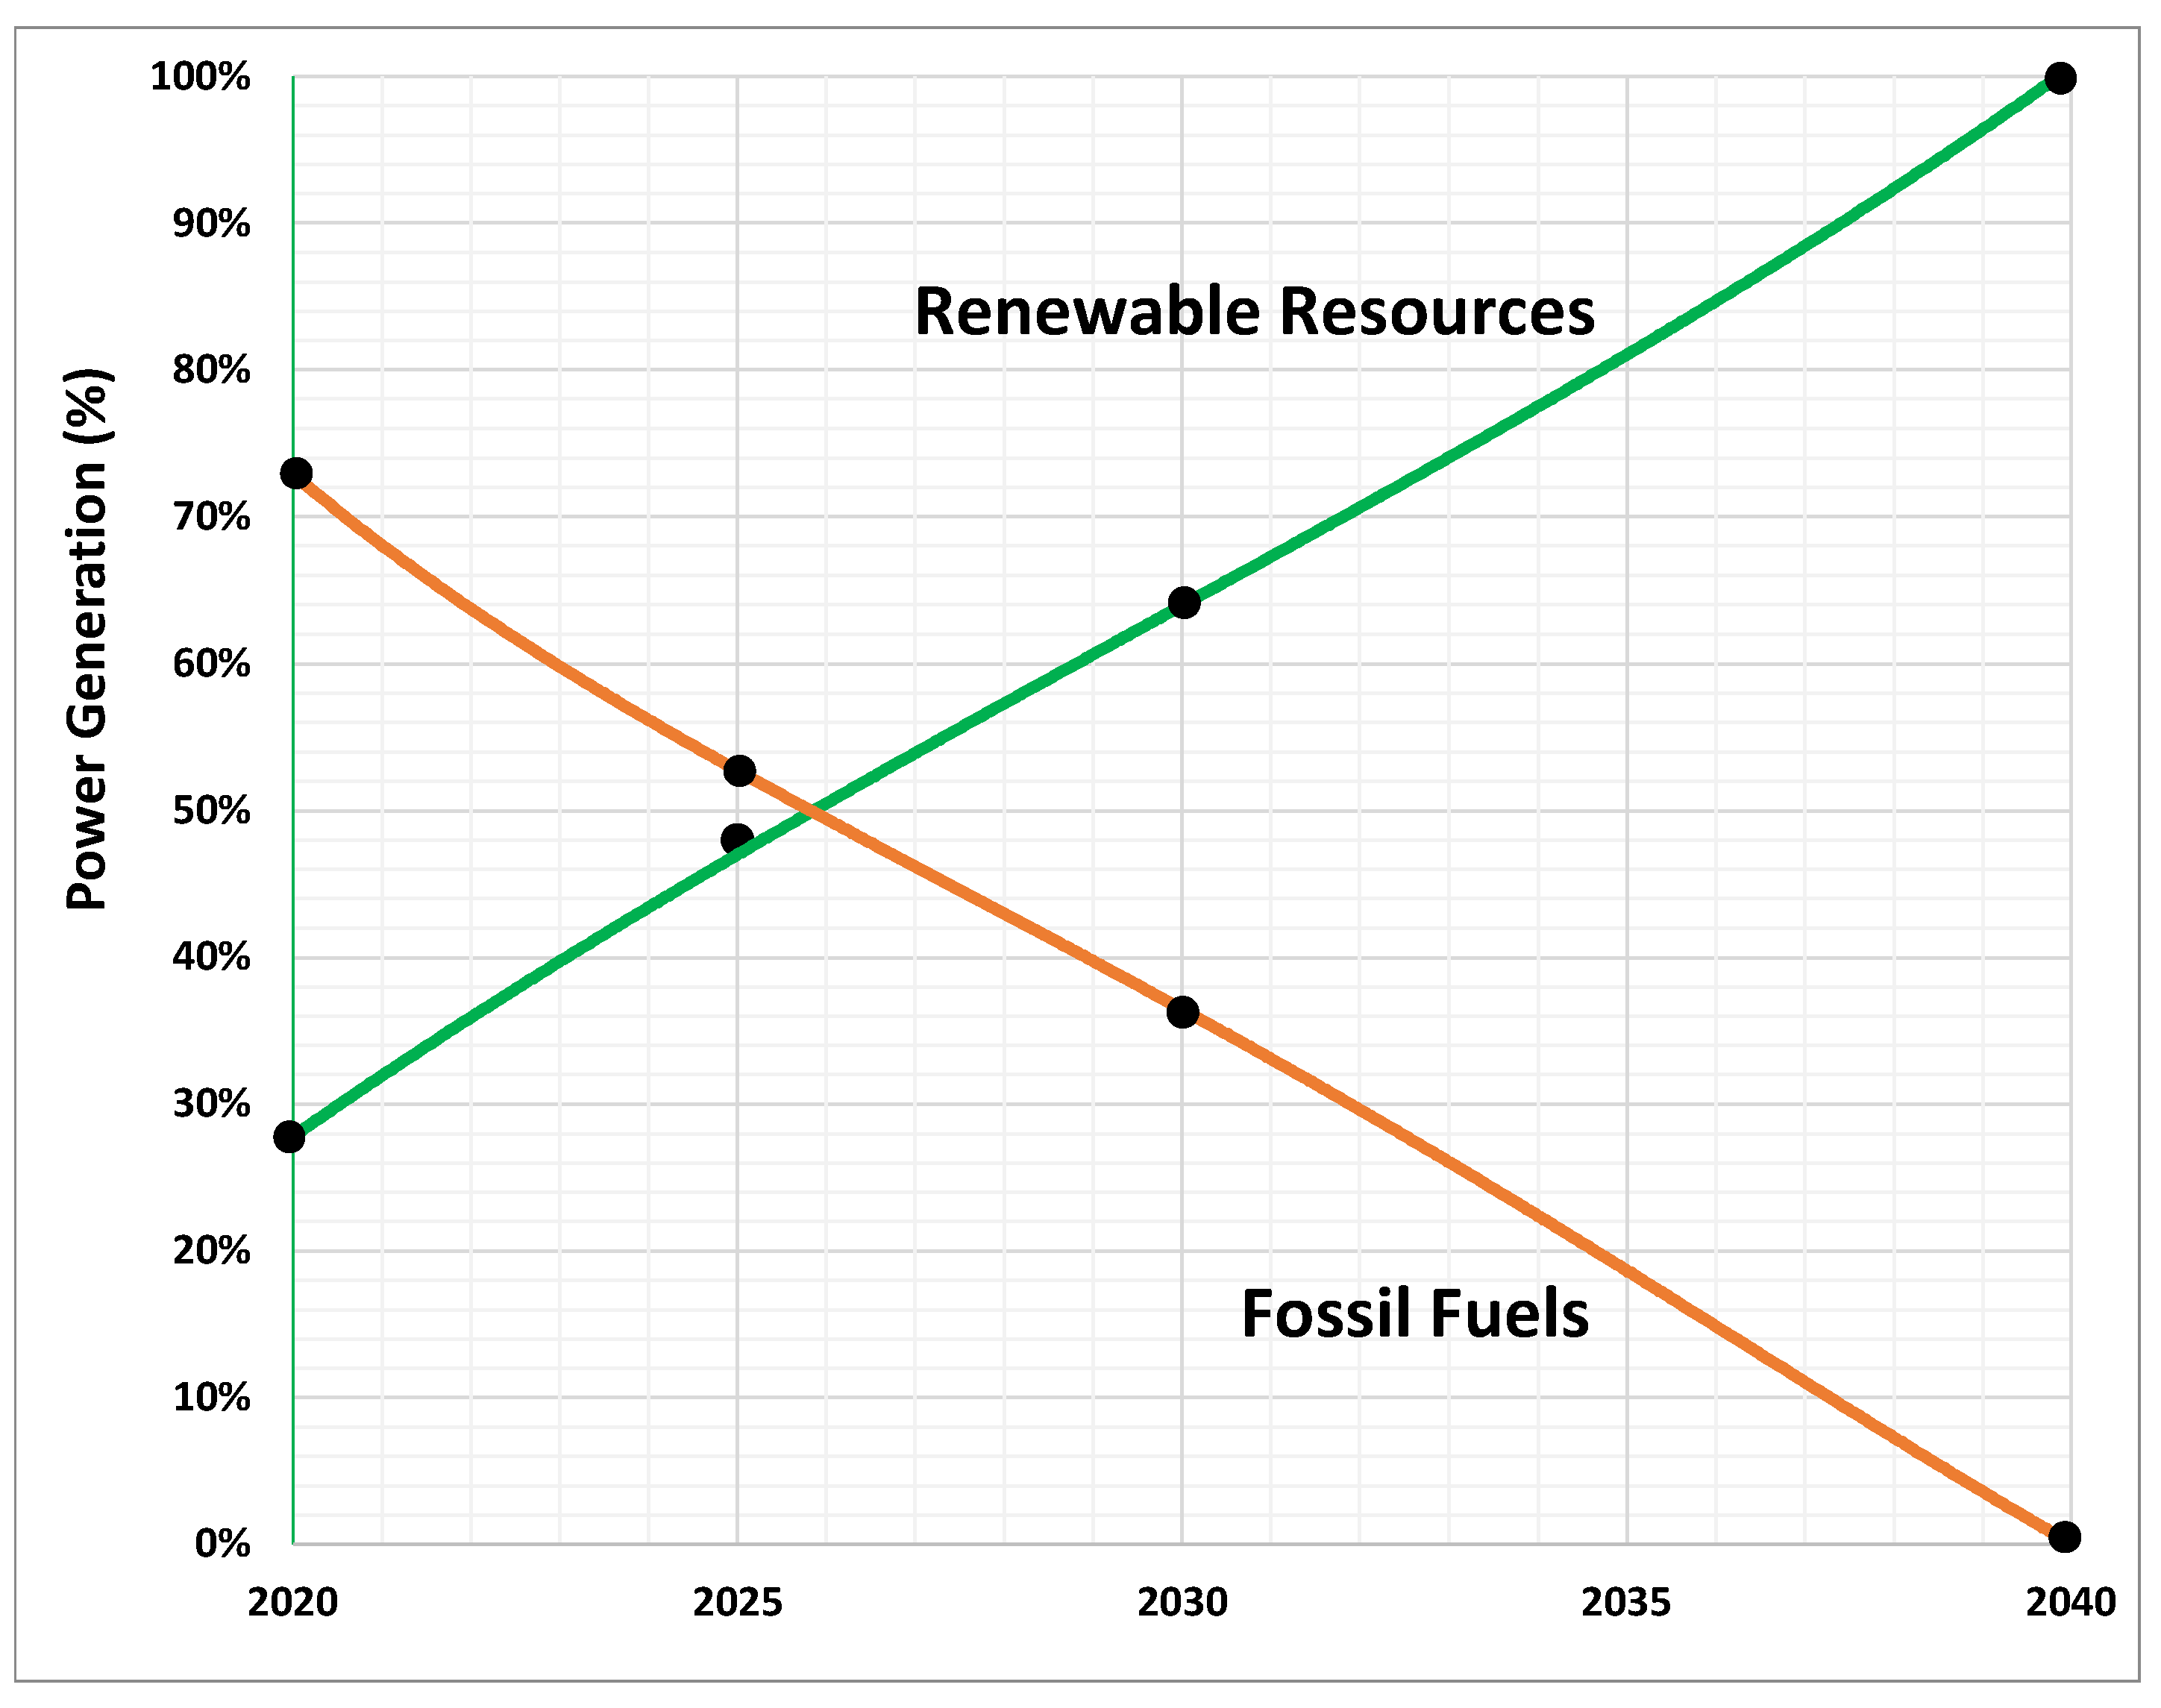
The utility’s projection for the future changing mix of power generation through 2040 was modeled, with the best fit found to be a three-parameter polynomial curve (Figure 5). The results demonstrate a rapid increase in renewable power generation coupled with a rapid decline in fossil fuel use. By 2026, more power will be generated from renewable resources than fossil fuels in this projection. Power generation is assumed to be steady after 2040 at 100% renewables.
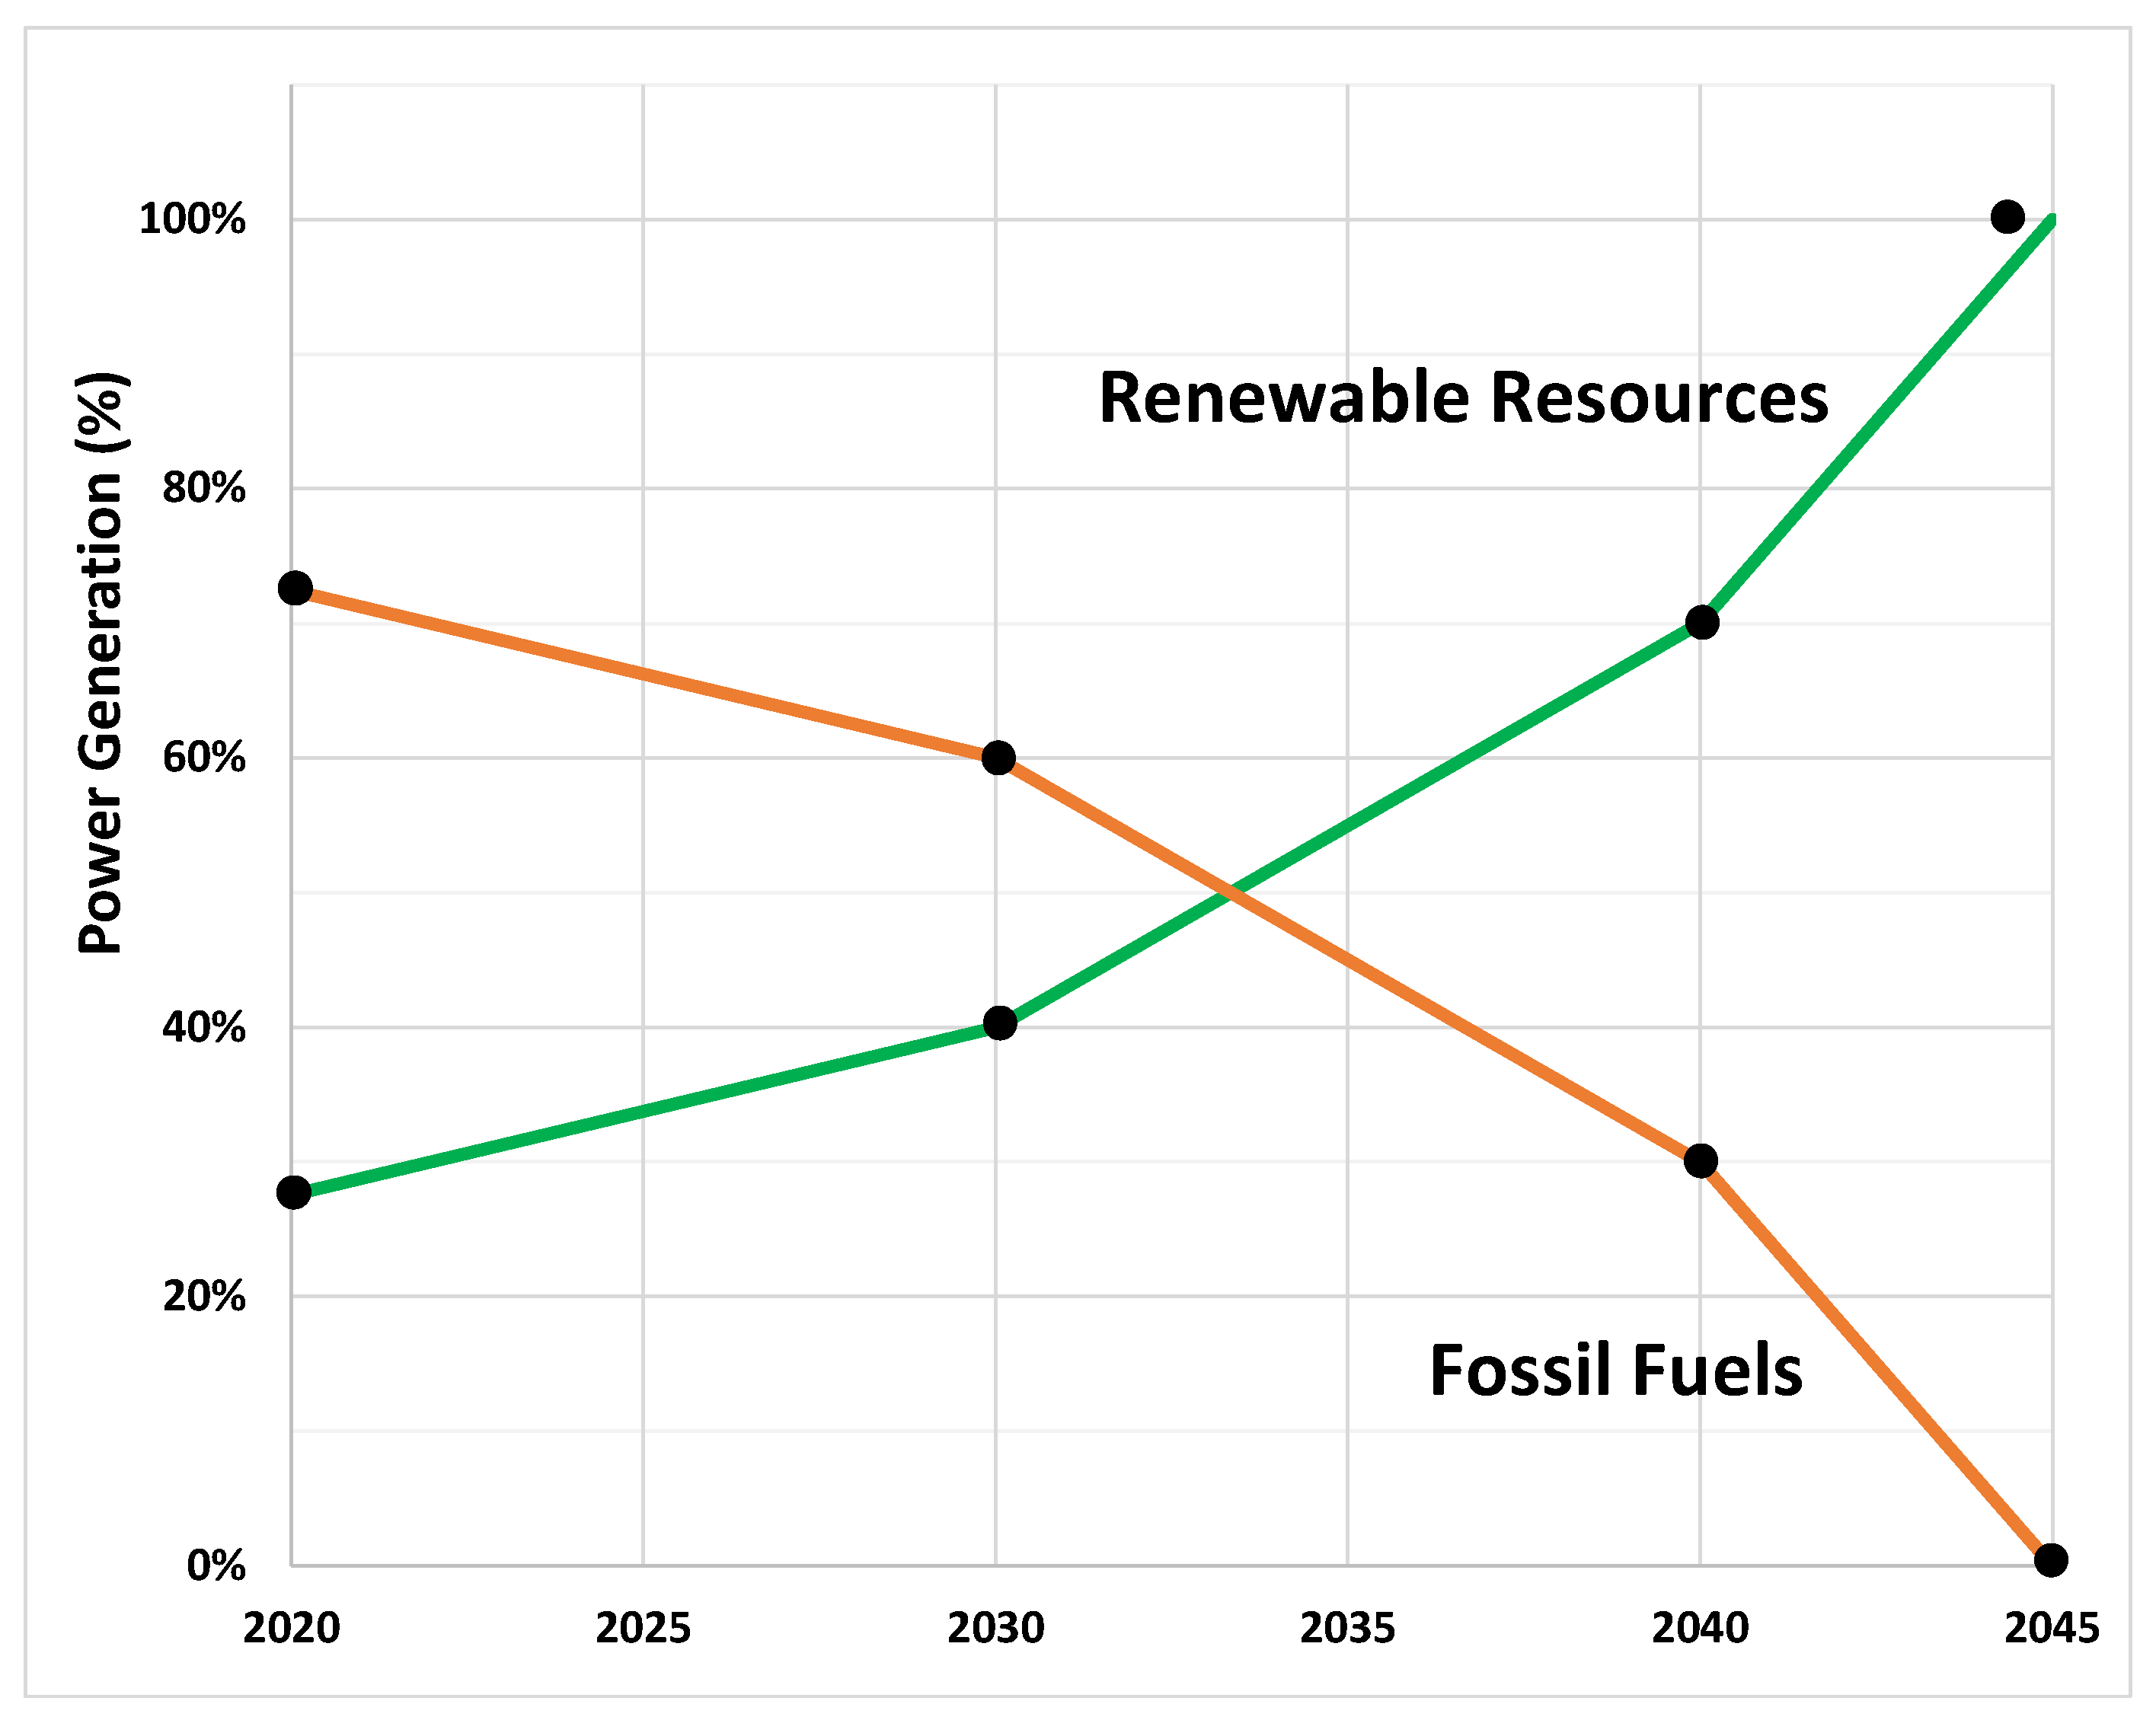
State mandated RPS goals for renewable power generation to 2045 were also plotted (Figure 6, where black markers show the data points) to represent a slower, more moderate projection. Under the RPS projection, renewable power generation exceeds fossil fuels after approximately 2033 in this case (seven years later than the utility’s projection) and 100% renewable power is achieved by 2045, rather than 2040. Once 100% renewable power is achieved in 2045, it is assumed to remain steady thereafter.
Since the utility’s projection was taken from two press releases, and the second projection is based on the RPS goals, the number of data points is limited, with no further data publicly available.
3.6. Fossil Fuel Use by Vehicle to 2050
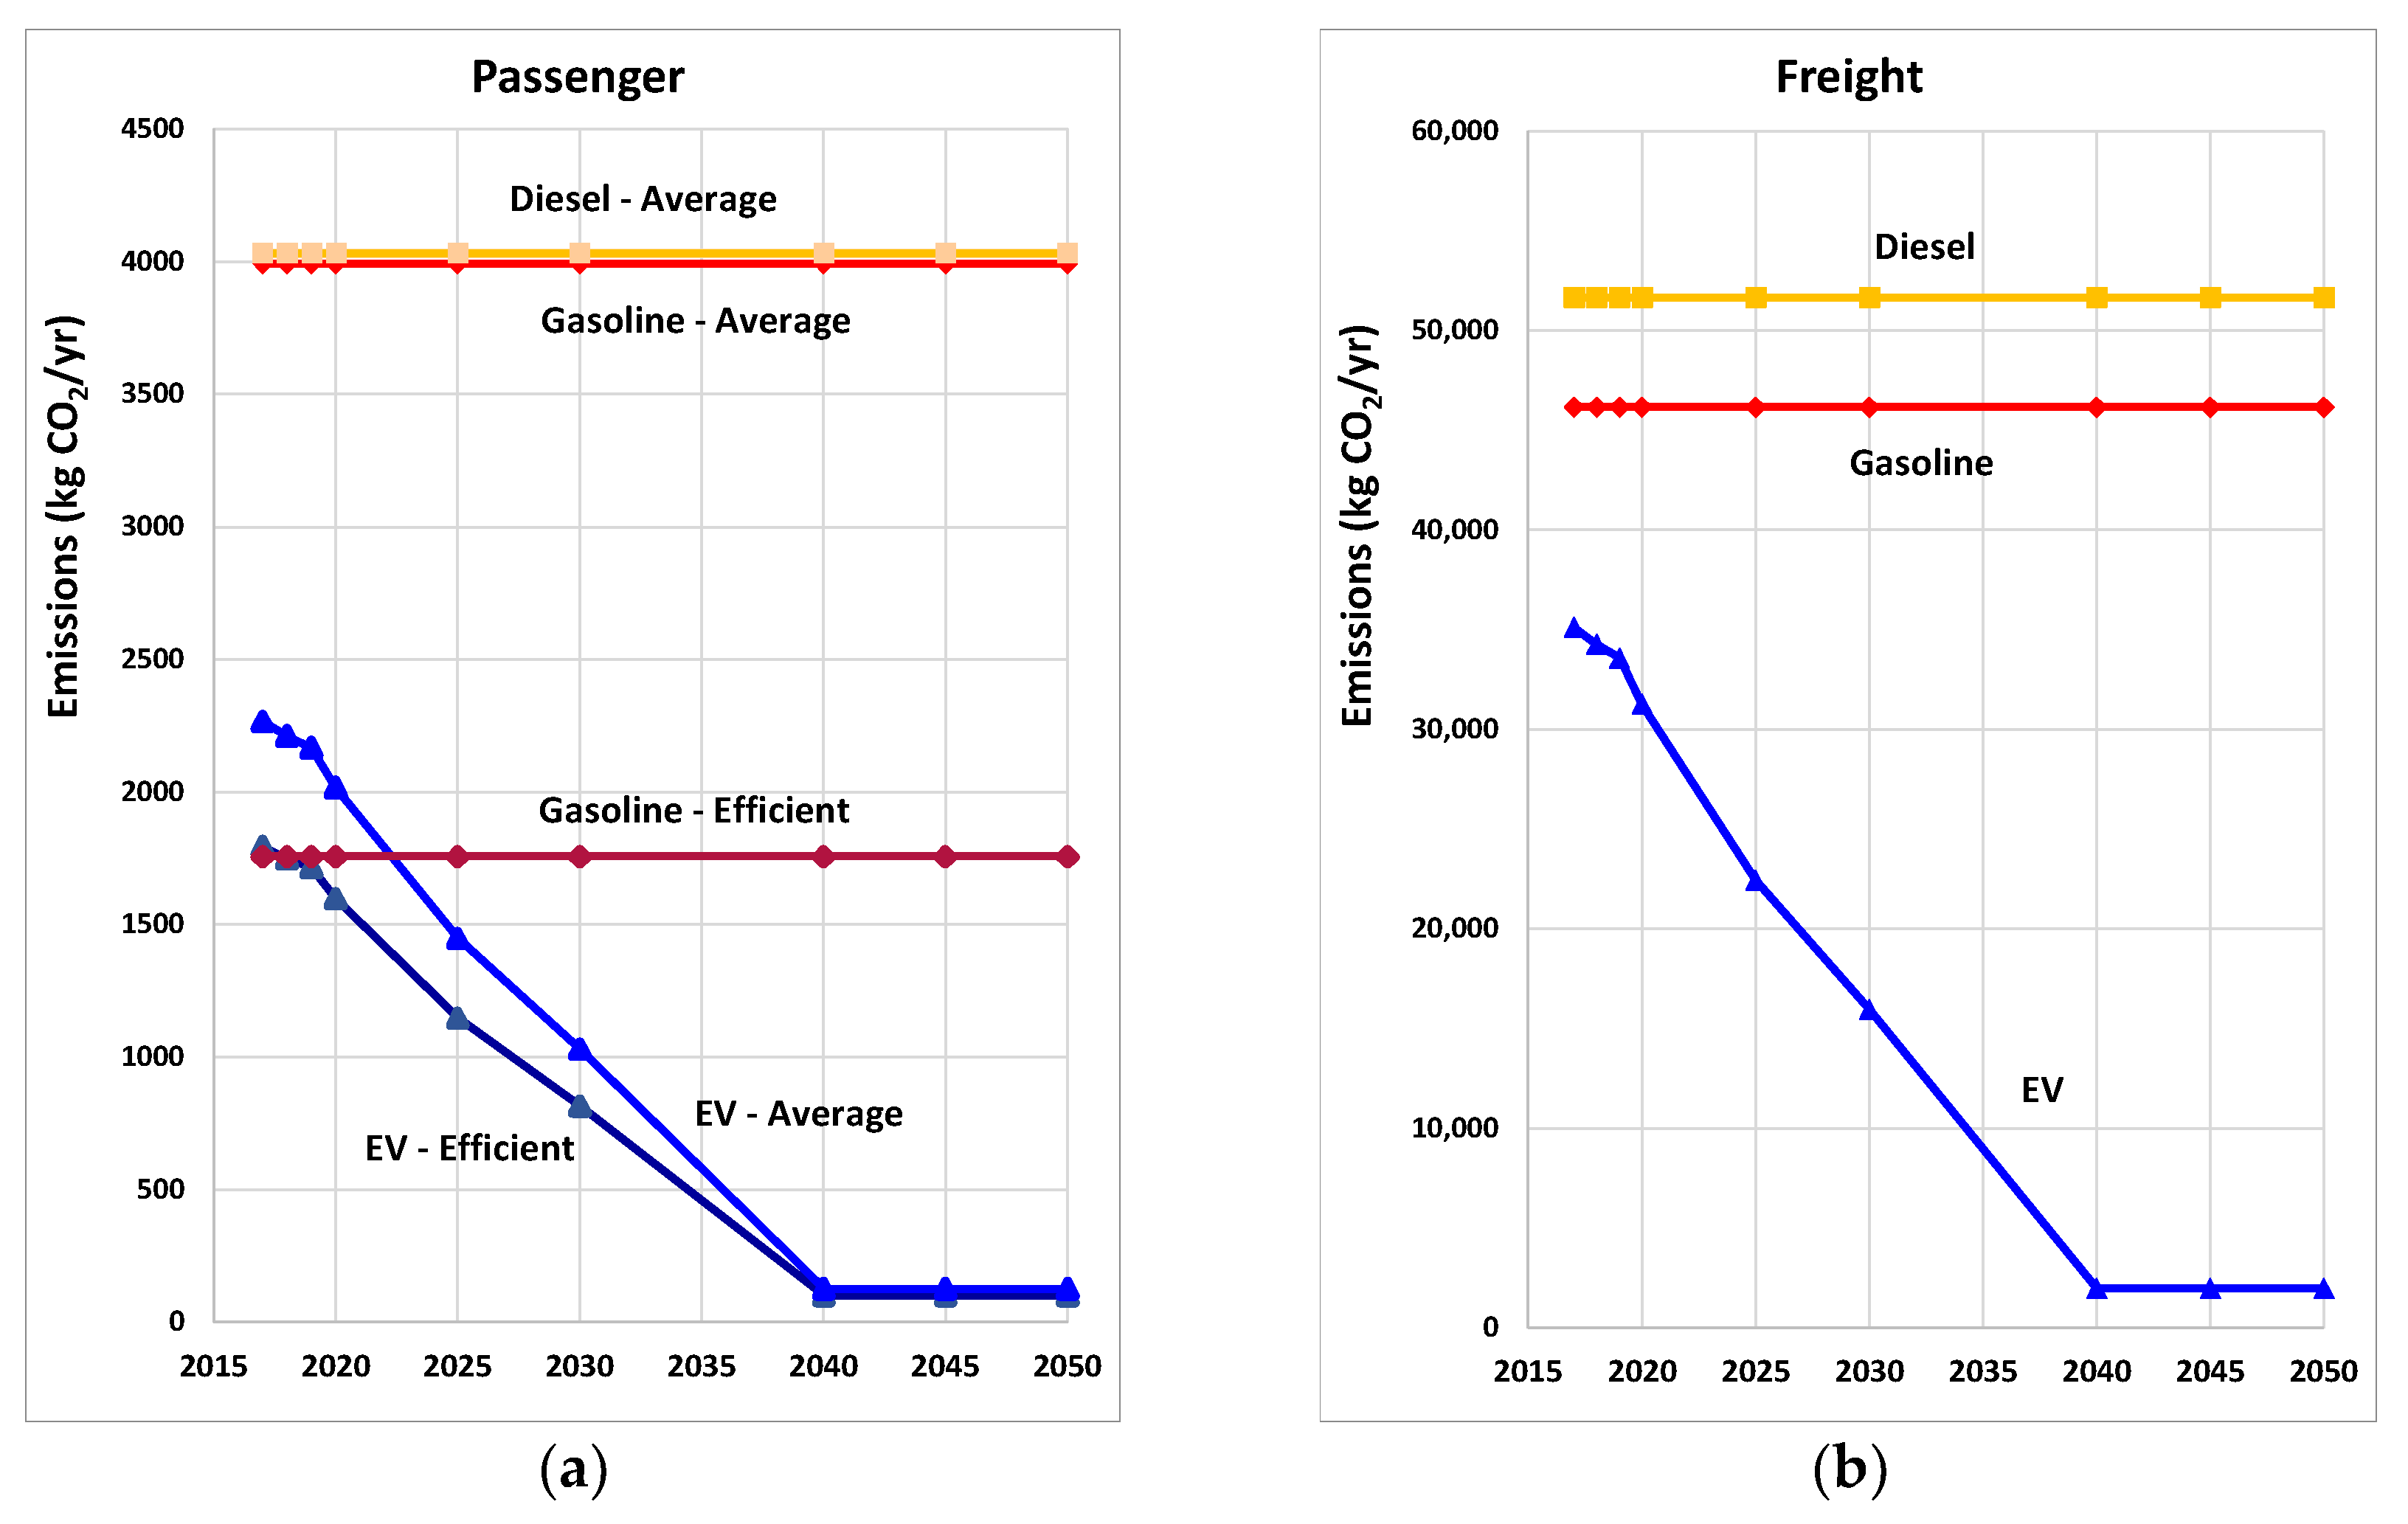
In contrast to ICE vehicle fossil fuel consumption and resultant CO2 emissions, EV fossil fuel consumption and emissions are improving and will continue to improve substantially as solar and wind resources continue to be added to the power grid (Figure 7). With the faster renewable power projection from the utility by 2025 (when renewables reach 48% on Oahu’s power grid), each average passenger EV will use only 10% of the fossil fuels of an average gasoline vehicle, saving the equivalent of 410 gallons of gasoline (Figure 7a). By 2030 (when the power grid reaches 63% renewables), passenger EVs will use merely 7.4% of the fossil fuels of an average gasoline vehicle. When renewables reach 100%, EVs will use no fossil fuels at all.
Likewise, fossil fuel consumption for electric freight vehicles will similarly decline as power generation transitions to renewables (Figure 7b). Electric freight vehicles offer even more fossil fuel savings due to the larger vehicle size and longer distance typically traveled each year. For example, by 2025, an electric freight vehicle will use only 14% of the fossil fuel used by a gasoline-powered freight vehicle and will save the equivalent of 4500 gallons of gasoline.
3.7. Emissions by Vehicle to 2050
Currently, an average passenger EV produces half the CO2 emissions of an average gasoline or diesel passenger vehicle (Figure 8a). Under the faster projection for renewable power, by 2025 each average passenger EV will produce only 36% of the CO2 emissions compared with an average gasoline vehicle. By 2030, EV emissions will be 26%, and by 2040, EV emissions will be 3.2%. Similarly, by 2025, each freight EV will produce only 49% of the CO2 emissions compared with a freight gasoline vehicle, and 43% compared with a freight diesel vehicle (Figure 8b). By 2030, each freight EV will produce only 35% of the CO2 emissions compared with a freight gasoline vehicle, and by 2040, 4.3%.
3.8. Cumulative Fossil Fuel Use
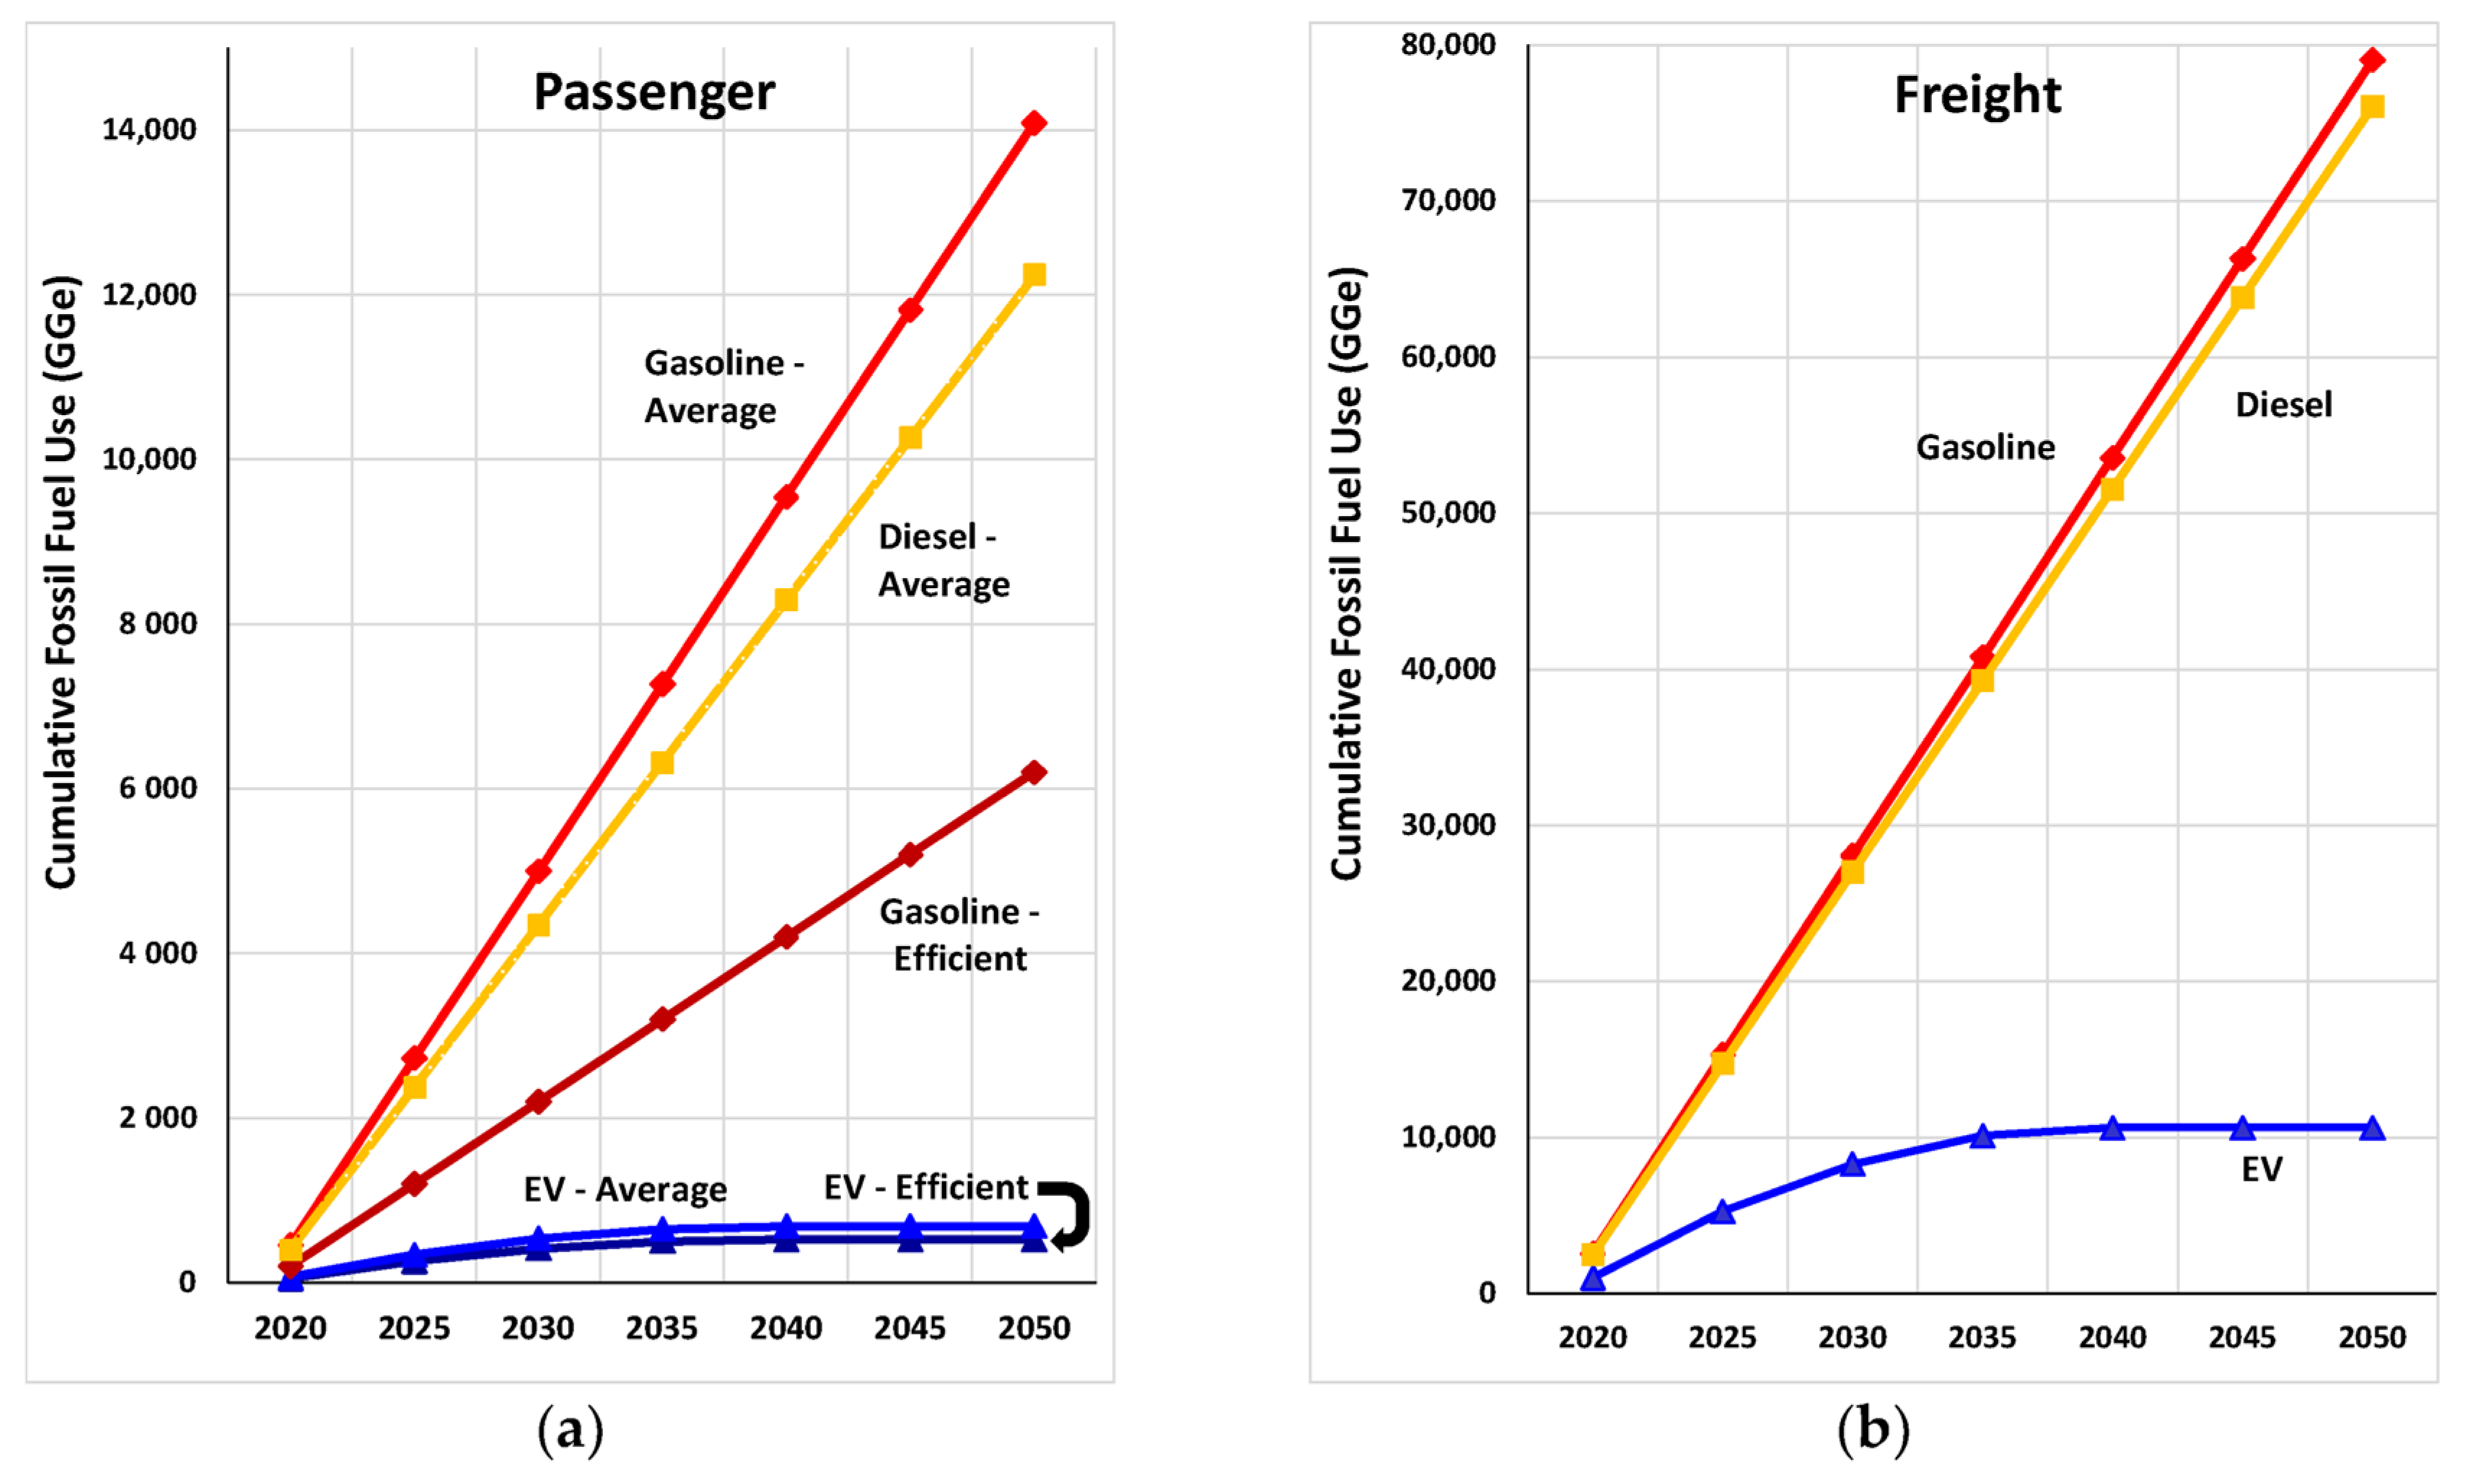
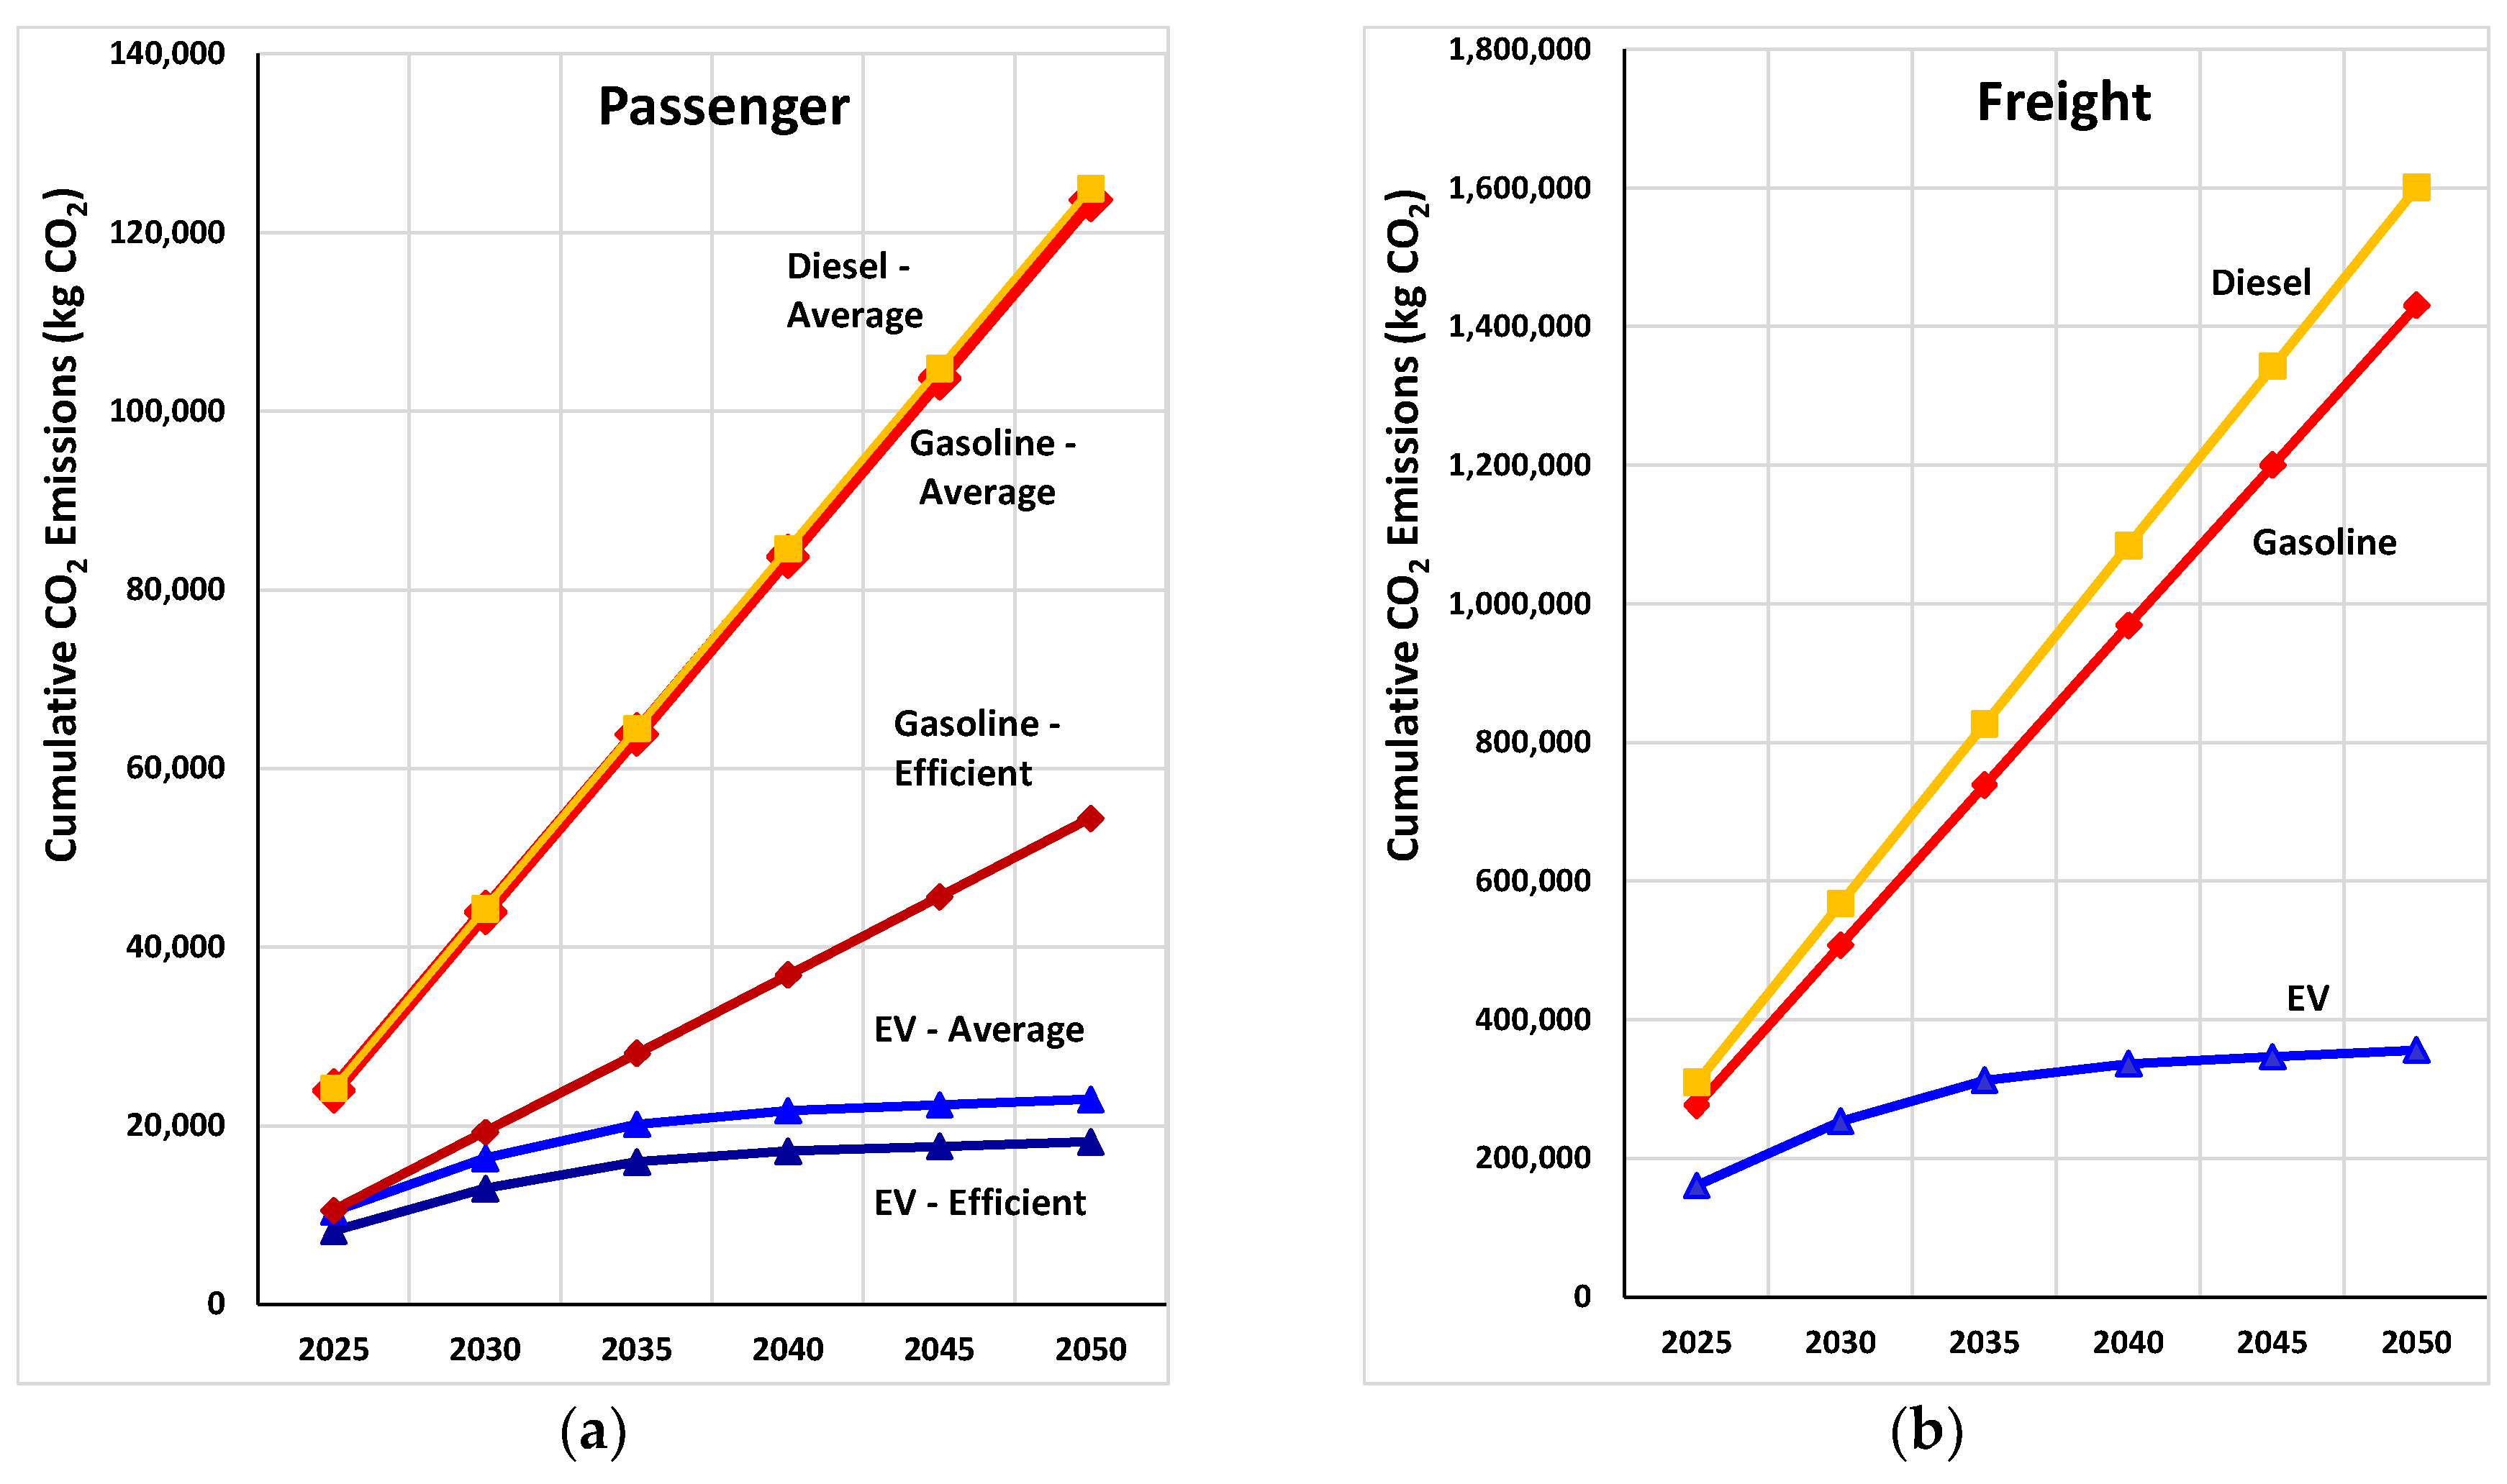
To consider the long-term impacts of purchasing an EV now rather than an ICE vehicle, the cumulative fossil fuel use was estimated (Figure 9). Under the faster renewable power projection, results show that fossil fuel use is dramatically reduced over the years. The average age of passenger vehicles on the road continues to increase and reached 12 years in 2019 [39], and the lifespan of a vehicle purchased today is expected exceed that. By purchasing an average passenger EV today and assuming the life of the vehicle will be 15 years, an EV will consume only 9% of the fossil fuel that would be consumed by a gasoline vehicle. A freight EV will consume about 11% of the fossil fuel that would be consumed by a gasoline-powered freight vehicle. Using this projection, fossil fuel use for electricity generation is phased out by 2040, so EVs from then on are running entirely on renewable sources.
3.9. Cumulative Emissions
The long-term impacts on CO2 emissions from purchasing an EV rather than an ICE vehicle show a significant reduction (using the faster renewable power projection, Figure 10). By purchasing a passenger EV today and assuming a 15-year lifespan, the average EV will emit only 30% of the CO2 compared with its gasoline counterpart, and the efficient EV 55% compared with the efficient gasoline vehicle. Similarly, after 15 years, an average electric freight vehicle would have produced only 40% of the CO2 emissions compared with an average gasoline freight vehicle.
3.10. EV Adoption
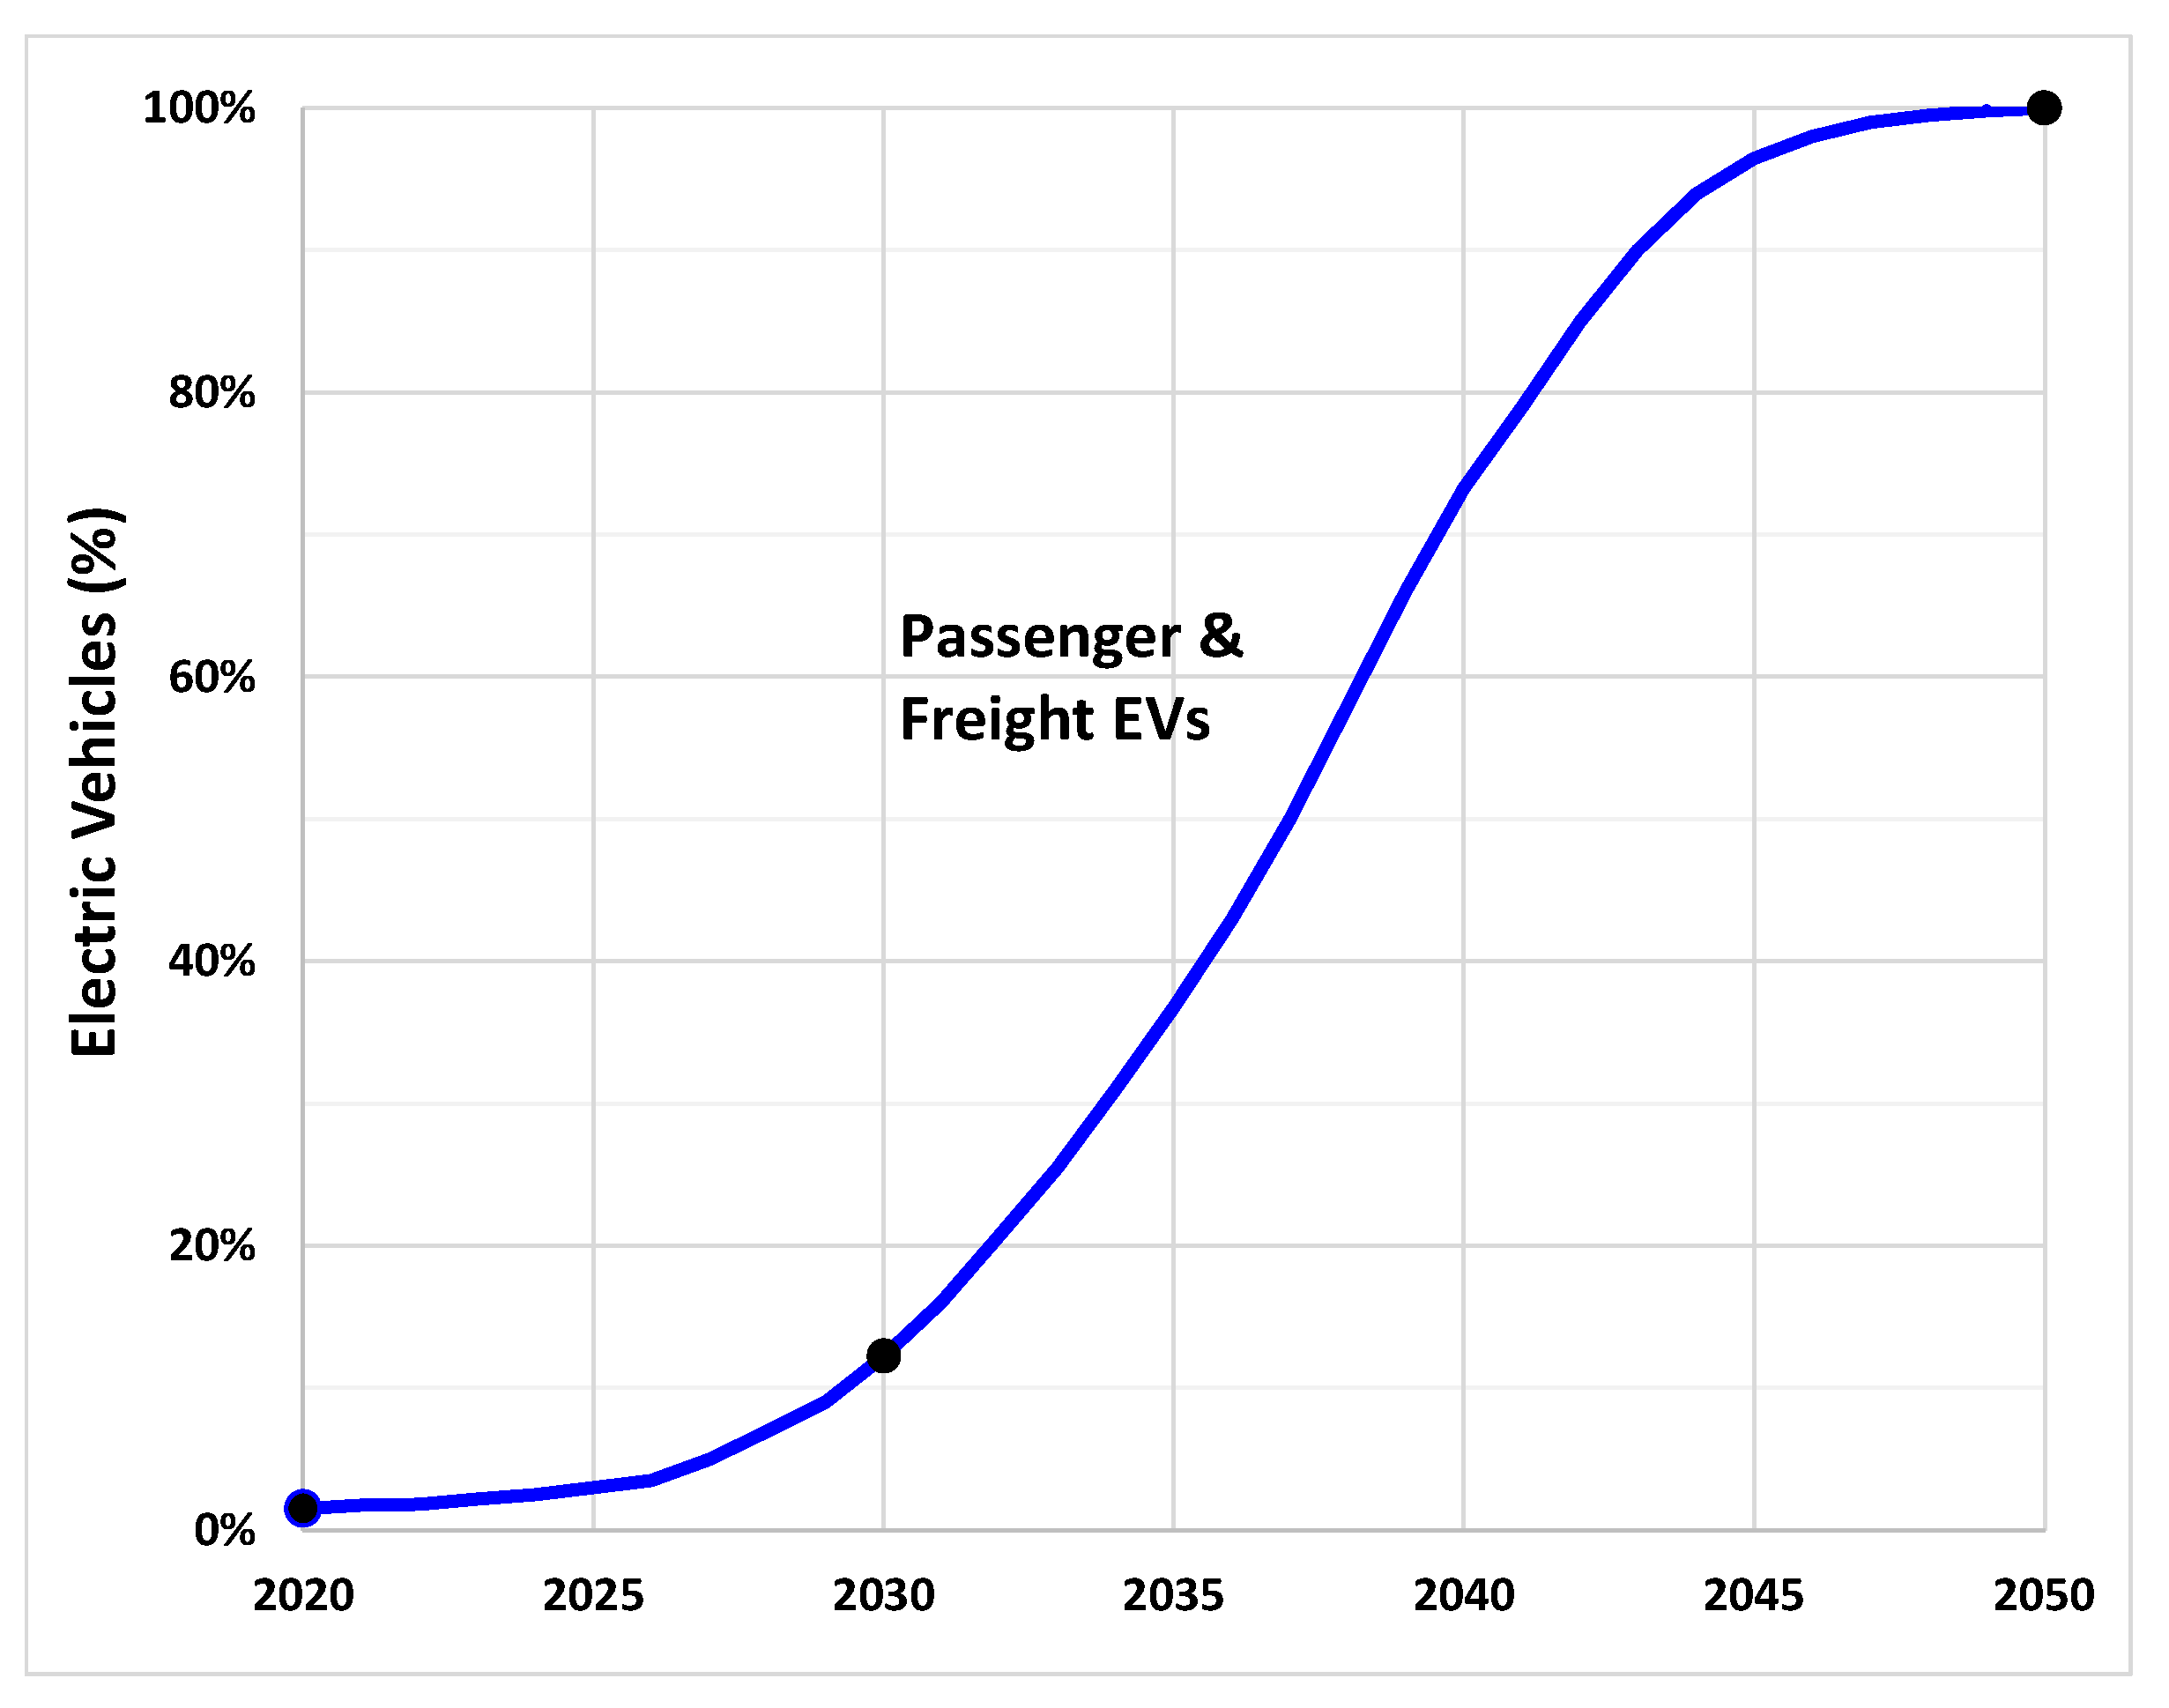
EV adoption is based on two projections, one from a global projection for the faster transition in this study, and the other from a slower, more moderate projection. For the faster EV transition, the modeled EV adoption results (passenger and freight) are based on a recent global EV projection for 12.25% EVs on the road by 2030 [37]. Oahu’s current EV percentages were used as a starting point and 100% EVs was assumed by 2050. A four-parameter polynomial equation was found to be the closest fit (Figure 11, where black markers show the data points used to generate the curve). Using this global EV projection, by 2035, EVs will have replaced 37% of ICE vehicles. By 2040, when the projected renewable power on the grid reaches 100%, EVs will have replaced 73% of ICE vehicles.
3.11. Impact on Fossil Fuel Consumption to 2050
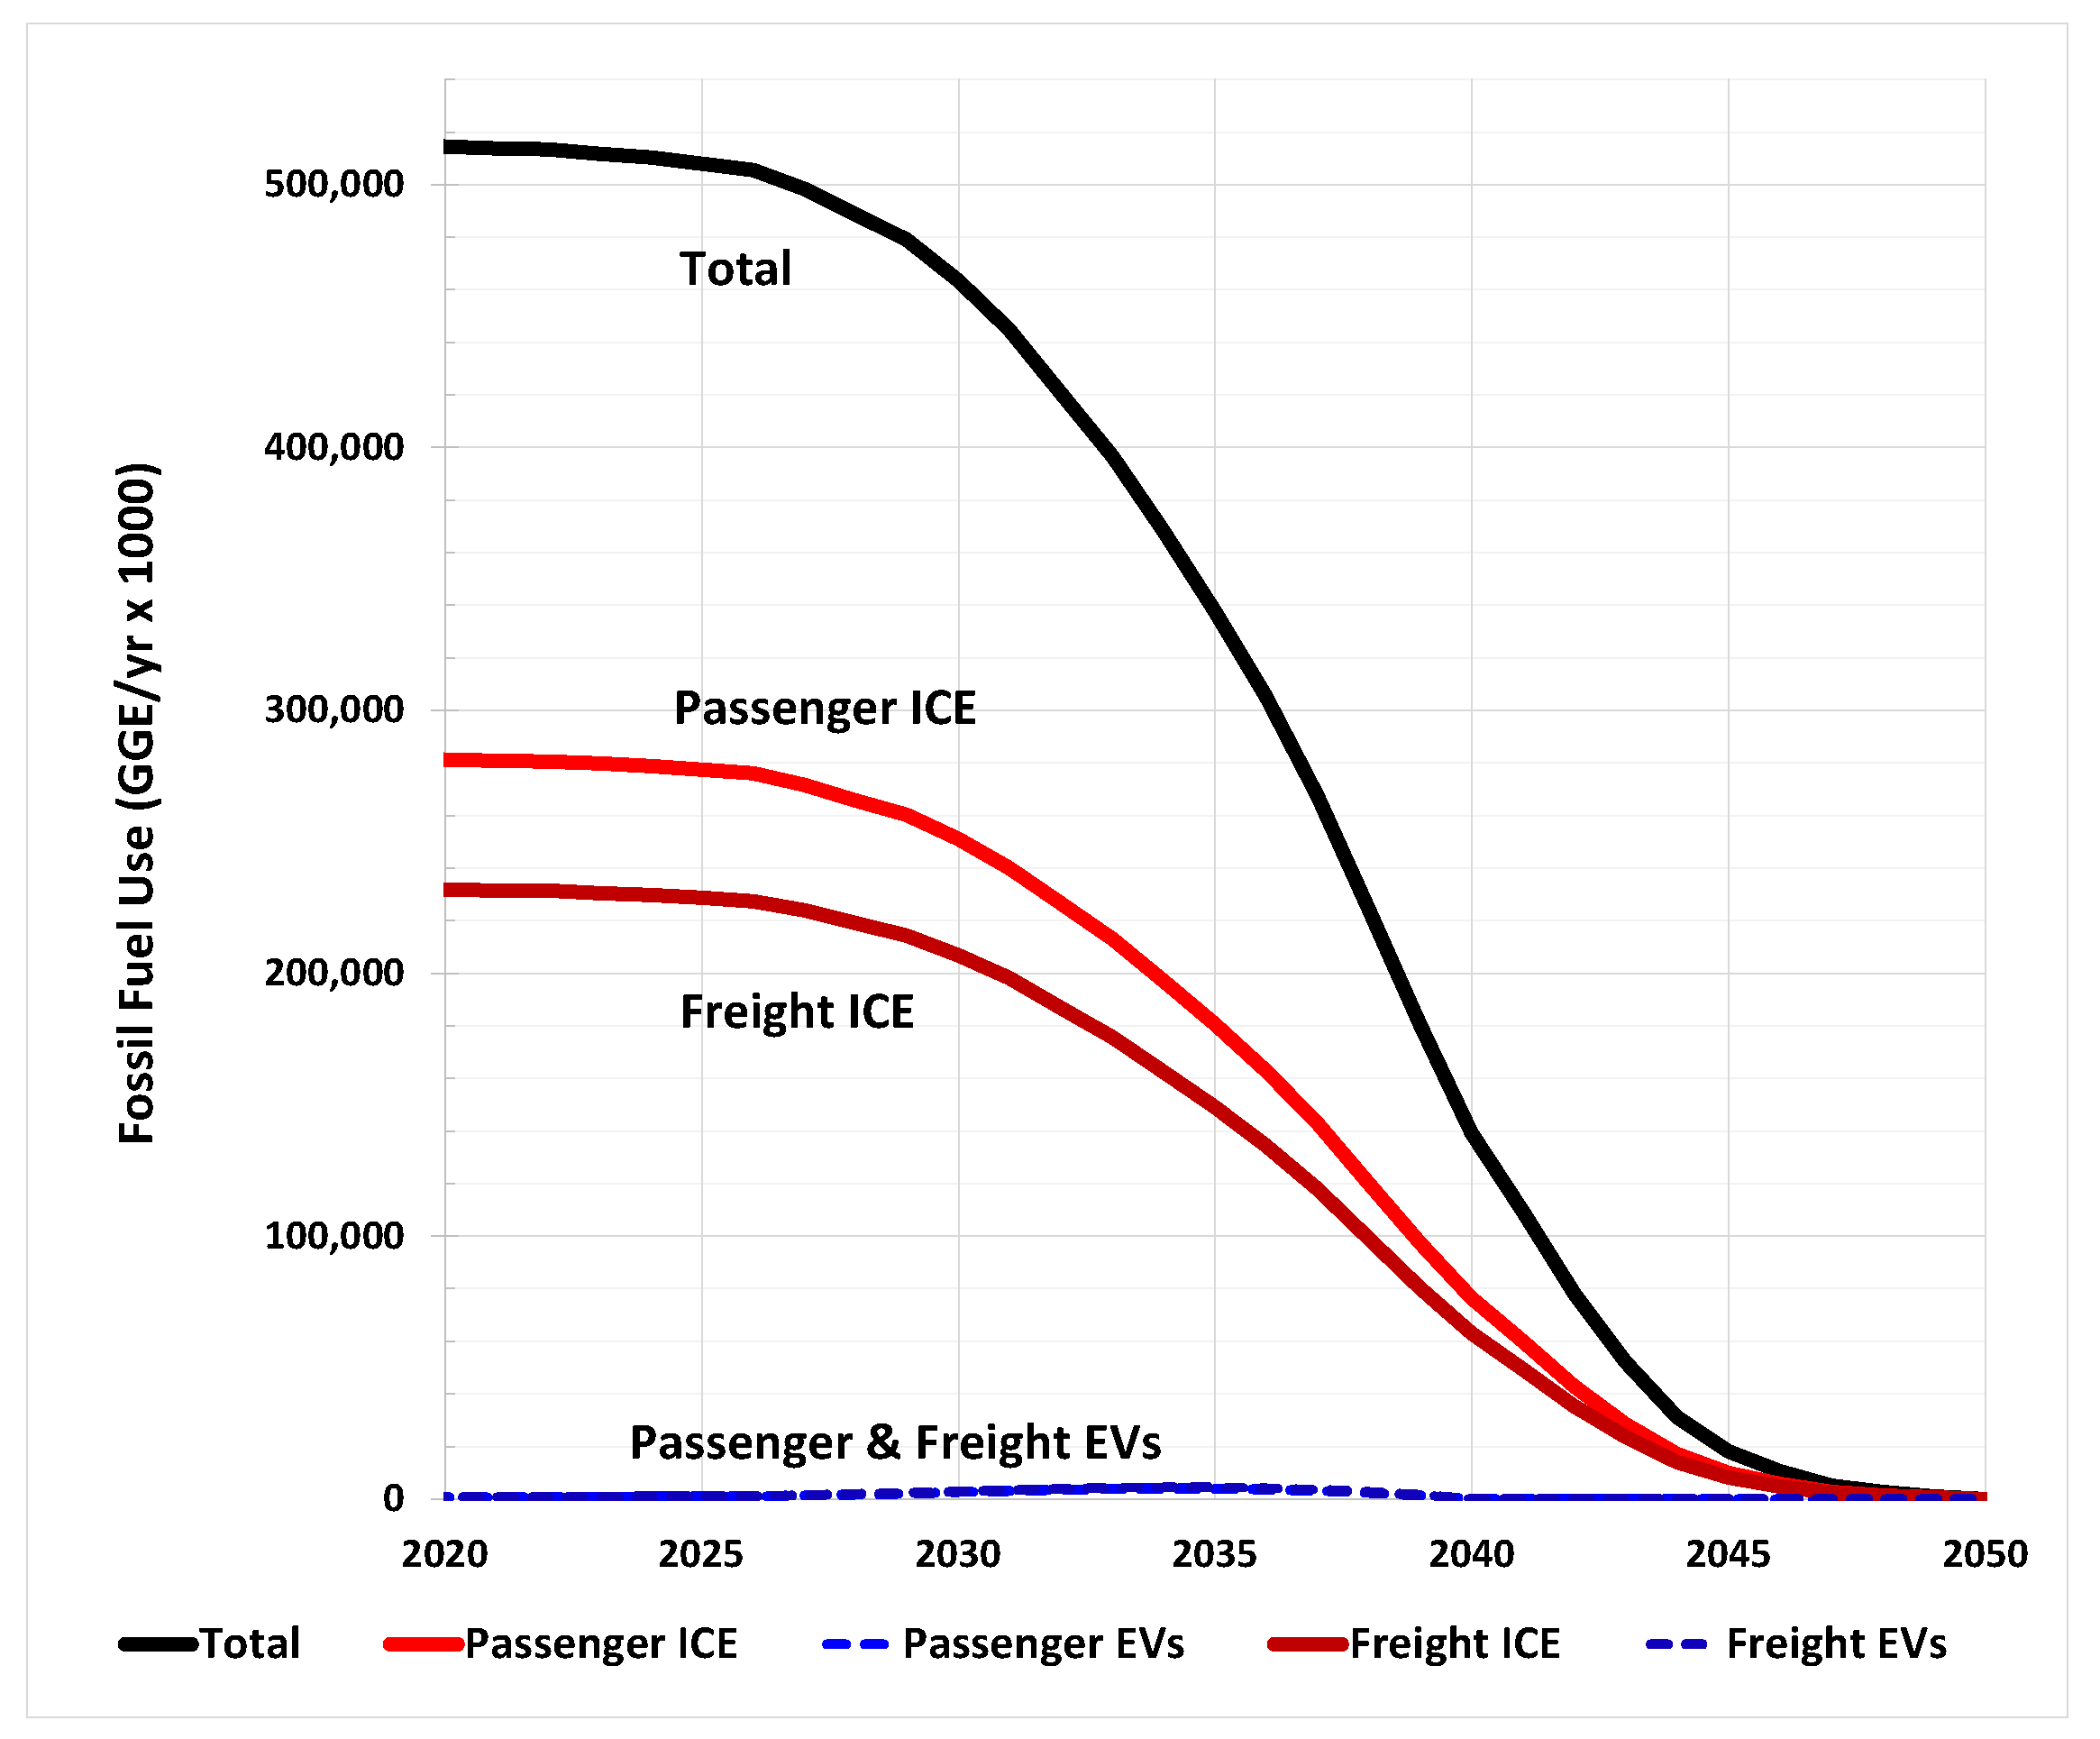
In the most ambitious scenario in this analysis, Scenario #1, the faster EV passenger and freight adoption together with the faster renewable power projection will lead to a large reduction in fossil fuel consumption (Figure 13). Total fossil fuel use is anticipated to plummet after about 2025 and continues a rapid decline to the point where renewable generation reaches the 100% by 2040, and EVs reach 100% by 2050.
By the time EVs become plentiful in Scenario #1, renewable power generation is high, so little fossil fuel is used by EVs, even as EV numbers surpass ICE vehicles on the roads. By the time 50% of the vehicles on the road are EVs (2037) 89% of the power is from renewable resources based on these projections. In contrast, fossil fuel use for ICE vehicles simply declines with the drop in numbers as they are replaced with EVs. Therefore, ICE vehicles continue to account for the vast majority of fossil fuel use until replaced with EVs. Between 2020 and 2035, passenger ICE vehicles as a group on Oahu will consume a total of 4.1 billion GGe and freight ICE 3.3 billion GGe, for a total of 7.4 billion GGe for all ICE vehicles. In contrast all passenger and freight EVs will consume 0.91% of that amount, 0.067 billion GGe of fossil fuel during that period.
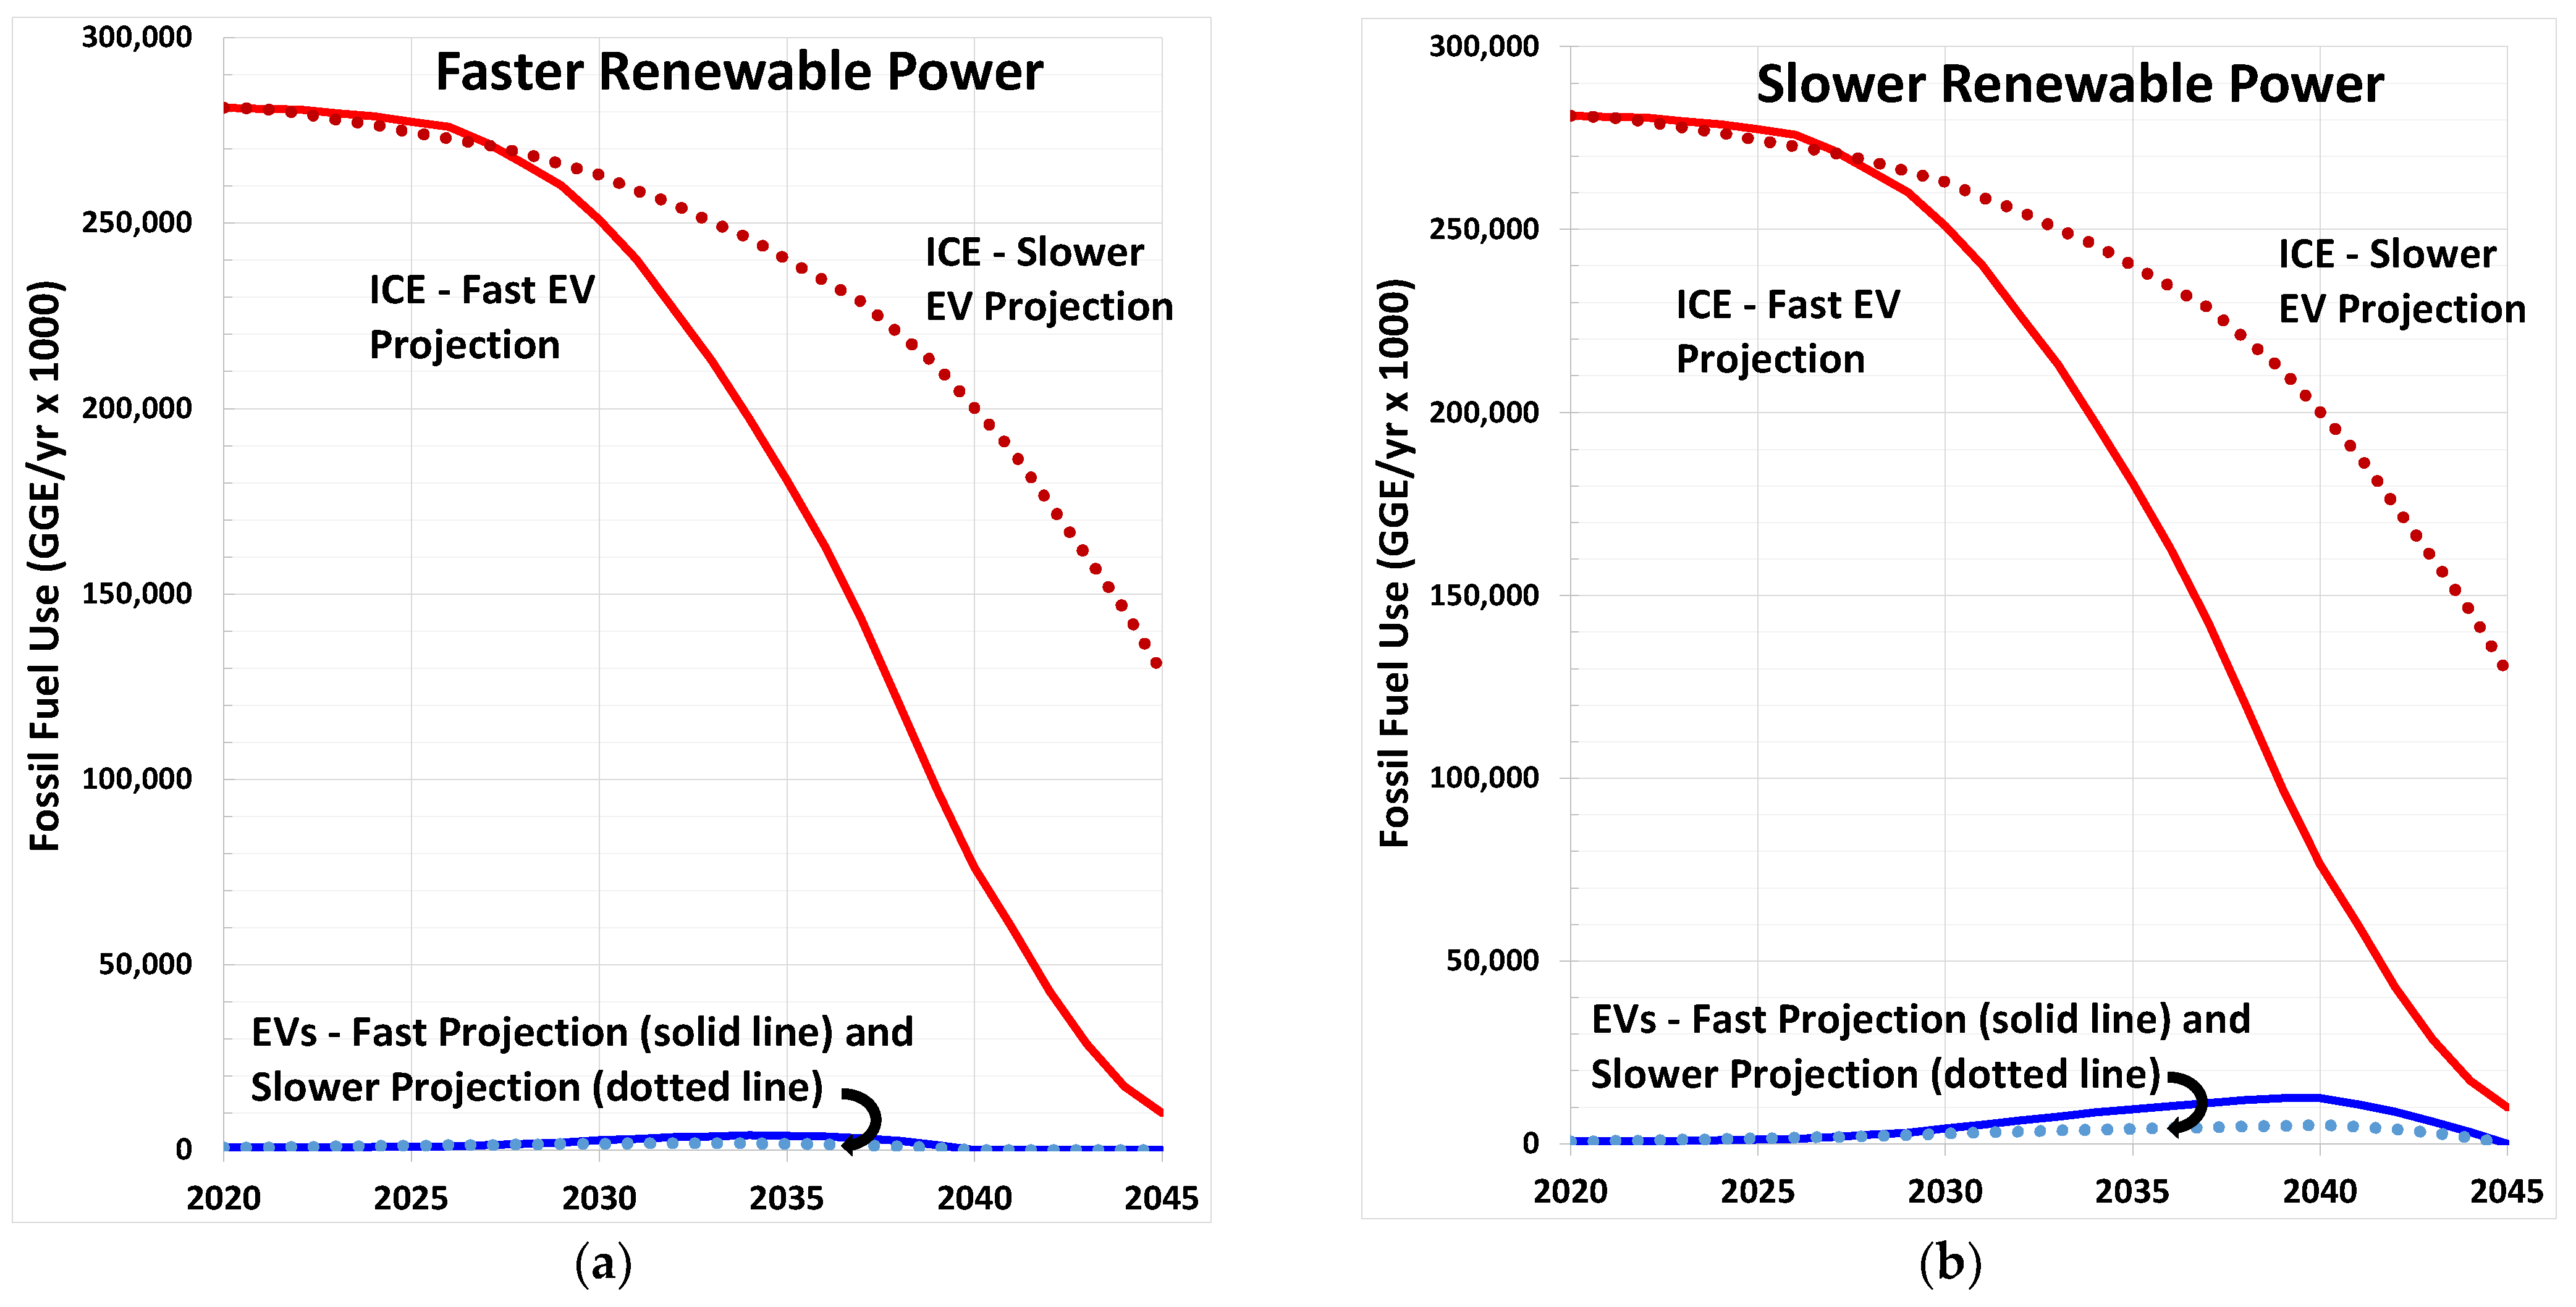
In a less ambitious scenario, the faster renewable power projection is combined with the slower projection for passenger EV adoption, Scenario #2 (Figure 14a, dotted lines). Results show a less dramatic, but still significant reduction in fossil fuel consumption by ICE vehicles, compared with the most ambitious scenario, with both fast renewables and EV projections (Figure 14a, solid lines). In both the moderate and the most conservative scenarios in this analysis, (Scenarios #3 and #4 respectively), the slower renewable power projection (Figure 14b), together with the faster and slower EV projections (solid and dotted lines), show the impact on fossil fuel use. Since renewable power generation only affects EV fossil fuel use, there is no change between in the amount of fossil fuels consumed by ICE vehicles between the faster and slower projections for renewables. However, the impact of a faster rate of EV adoption clearly shows an impact on reducing the fossil fuel use by ICE vehicles, simply by reducing their numbers. This reduction in fossil fuel use from replacing ICE vehicles with EVs far outweighs the EV fossil fuel use.
Under the conservative Scenario #4 with both the slower passenger EV projection and slower renewable power projection, fossil fuel use from ICE vehicles will persist consuming billions more gallons of gasoline (Figure 14b, dotted lines). By 2045, passenger ICE vehicles will consume a total of 6.2 billion GGe with the slow EV projection, versus 4.8 billion with the fast EV projection (Table 3). By contrast, EV fossil fuel use depends on both projections for renewables and EV adoption. The key take away is that, even with the fastest rate of passenger EV adoption and slowest renewable power transition in this study, EVs consume merely 3.0% of the fossil fuels consumed by ICE vehicles, (Scenario #3).
3.12. Impact on Emissions to 2050
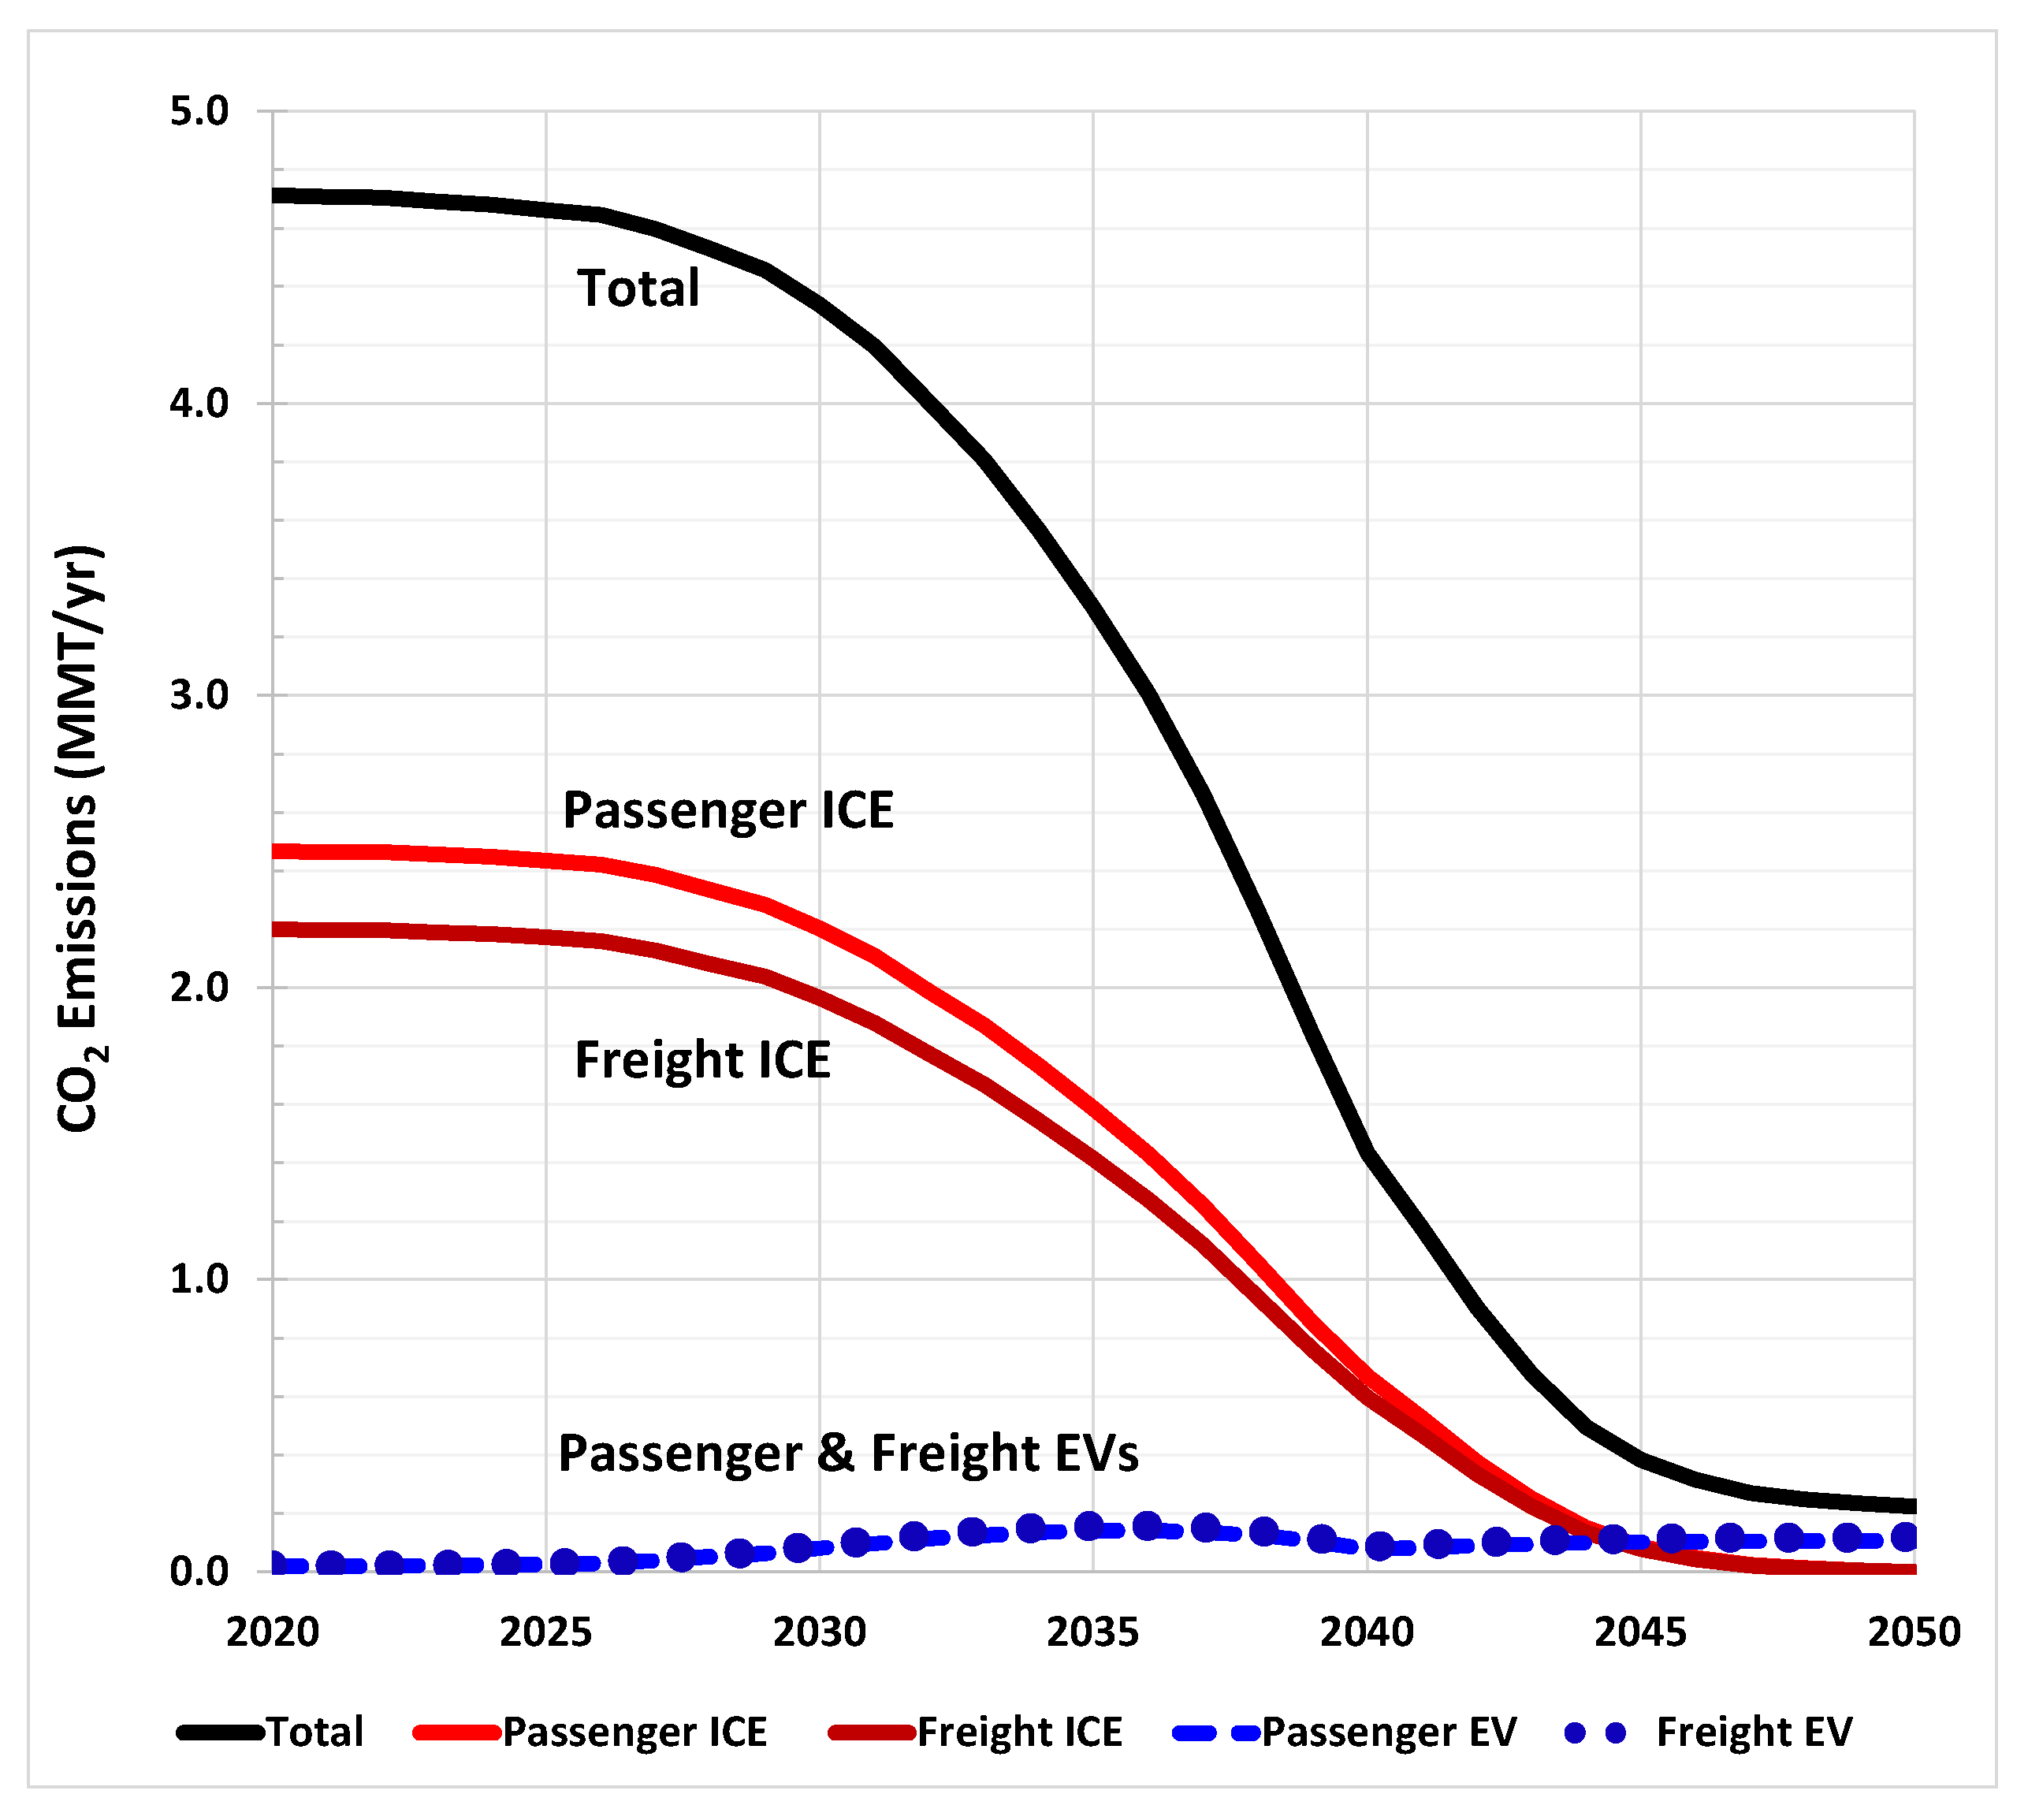
Under the ambitious Scenario #1 in this analysis, CO2 emissions show a striking reduction as passenger and freight EVs replace ICE vehicles with the faster EV projection, and renewables replace fossil fuel with the faster projection for power generation (Figure 15). Total CO2 emissions drop rapidly after about 2025 and continue a precipitous decline to the point where renewable generation reaches 100% by 2040, and EVs reach 100% by 2050. The total ICE emissions decline only because of the decline in vehicle numbers. However, as EV numbers increase, the total emissions remain extremely low by comparison, due to increasing renewable generation. Between 2020 and 2035, CO2 emissions from all ICE vehicles will add up to 67 MMT CO2. All EV emissions during that period will amount to 2.1 MMT CO2, (3.2% of that). EV emissions increase slightly until 2035 as more EVs replace ICE vehicles, but then decrease until 2040 when 100% renewables are achieved in this scenario. After that, the only remaining emissions are from biomass, MSW, and biofuels. By 2045, CO2 emissions from all ICE vehicles will add up to 80 MMT, and EVs 4.4 MMT (5.5%). By 2050, EVs will completely replace ICE vehicles in this ambitious scenario.
In the less ambitious scenario with the rapid renewable power projection but slower passenger EV adoption, Scenario #2, a less dramatic but still significant reduction in CO2 emissions by ICE vehicles can be seen, compared with the most ambitious Scenario #1 with both fast renewable and EV projections (Figure 16a, dotted and solid lines respectively). Reduction in ICE vehicle emissions is not influenced by the changing mix of power generation and is a result of reducing numbers as EVs replace ICE vehicles. To assess a slower rate of renewable power generation, the moderate Scenario #3 combines the slower projection for renewables with the faster EV projection (Figure 16b, solid lines), and shows EV CO2 emissions climb to somewhat higher levels until 2040, and then decline as renewables completely replace fossil fuel power generation by 2045, and EVs replace ICE vehicles by 2050. This reduction in fossil fuel use from replacing ICE vehicles with EVs far outweighs the EV fossil fuel use.
Under the scenarios with the slower projection for passenger EV adoption (Scenarios 2 and 4), CO2 emissions from ICE vehicles will persist, producing millions more tons of CO2 (Table 4). By 2045, passenger ICE vehicles will emit a total of 54 MMT with the slower EV projection, versus 42 MMT with the faster EV projection. By contrast, EV CO2 emissions depend on both projections for renewables and EV adoption, and remains a small fraction of the emissions produced by ICE vehicles. Even with the fastest passenger EV projection and slowest renewable power projection, EVs emit only 11% of the CO2 produced by ICE vehicles (Scenario #3).
4. Conclusions and Discussion
The transition to EVs offers a momentous and immediate advantage to reduce fossil fuel consumption and resulting emissions for ground transportation in Hawaii and similar regions, despite the current high dependence on oil for power generation. Scenario results clearly show the importance of purchasing an EV instead of a gasoline or diesel vehicle today, since fossil fuel use and emissions are markedly reduced over the life of the vehicle because of EV efficiency and the increasingly clean mix of power generation in coming years. As renewables, especially solar and wind, replace fossil fuels for power generation, escalating benefits are achieved with electric transportation in contrast to ICE vehicles. Accelerating both EV adoption and grid renewables will have striking cumulative benefits over the years, steeply reducing both fossil fuel use and emissions.
In this analysis, current fossil fuel use and resulting emissions were quantified for passenger and freight EVs versus ICE vehicles. Since EVs are 4–7 times more efficient than their ICE counterparts, they consume considerably less energy to travel a given distance. Projecting forward, four scenarios were modeled to assess important trends in growing renewable power generation together with EVs replacing ICE vehicles.
4.1. Current Results
In 2020, an average passenger EV operating on Oahu used only a small fraction (14%) of the fossil fuel used by an average gasoline vehicle and cut CO2 emissions in half. Similarly, an electric freight vehicle used 19% of the fossil fuel compared with a gasoline freight vehicle, and 20% compared with a diesel freight vehicle. Similarly, an electric freight vehicle cut emissions by 32–39% compared with gasoline and diesel freight vehicles, respectively. Consequently, each freight ICE vehicle replaced with a freight EV reduced fossil fuel consumption by the equivalent of more than 4000 gallons of gasoline in 2020, enough to fuel nine average gasoline passenger vehicles or 64 average passenger EVs that year.
4.2. Projected Results
Scenarios modeled in this study include two projections for the rate of EVs replacing ICE vehicles, and two projections for renewable power generation replacing fossil fuels. In all four scenarios the immense contrast between EV and ICE vehicle fossil fuel use and emissions is distinct. The reduction of ICE fossil fuel use and emissions simply declines with the drop in numbers as they are replaced with EVs. EV fossil fuel use and emissions are miniscule compared with that of ICE vehicles, even when EVs completely replace ICE vehicles. Additionally, all scenarios demonstrate the accelerating benefits of electric transportation and renewable power to vastly reduce fossil fuel consumption and resulting emissions. Under the most ambitious scenario with the faster rate of EV adoption together with the faster projection for renewable power generation, 99% less fossil fuel is consumed for all passenger and freight vehicles, and 93% less CO2 is emitted between 2020 and 2050. However, with the slower projection for EV adoption, fossil fuel use and emissions from ICE vehicles will persist, consuming billions more gallons of gasoline and emitting tens of millions more tons of CO2 emissions.
4.3. Scenario Evaluation
Results in these scenarios for the impact of passenger EV adoption on Oahu may be conservative in the near term, since the fast EV projection in this analysis is based on a global projection of 12.25% of vehicles on the road being electric by 2030, but the numbers of passenger EVs registered on Oahu grew by 45% from December 2019 to December 2020 [37,38]. Consideration could also be given to the impacts of changing vehicle efficiency (such as an increased Corporate Average Fuel Economy (CAFÉ) standard). Future work could include analyzing various projections for renewable power generation, such as increasing amounts of bioresources or other renewables that produce GHG emissions, and analyzing life cycle emissions. It is important to note that renewable resources added to the power grid in these scenarios do not add to CO2 emissions, in line with the near-term utility power purchase agreements for solar plus storage, and the long-term carbon neutral goal for the State.
4.4. Implications and Policy
This analysis demonstrates the extensive benefits of EVs even powered on a small, oil-dependent power grid, and is meant to provide credible regional information to help inform policy and future planning to overcome obstacles to widespread EV deployment. The method developed in this assessment may be useful for other remote regions where small power plant data and projections are not included in national databases and methodologies. This analysis is intended to assist government policy makers, regulatory agencies and the public in Hawaii and other remote, isolated power grid regions by visualizing and considering a variety of scenarios on potential benefits of renewable power generation together with electrification of ground transportation. For instance, for regions with high levels of power generation from fossil fuels, carbon pricing is significant as it can incentivize both transportation electrification and renewable power generation [40,41]. Vehicle emission policies have been used successfully to increase market share of EVs [42]. As an example, the State of Hawaii may use results of this analysis to help inform development of policies such as carbon pricing, vehicle emission regulations, EV and PV system incentives, workplace charging, and other supportive measures to drive a more rapid switch away from ICE vehicles to EVs and to maintain or increase the transition to renewable power generation. Additionally, much focus now lies on using renewable energy and transportation electrification to address societal inequities, such as removing transportation emissions by supporting the electrification of school and transit buses, or incentivizing a shift away from inefficient “gas guzzlers” to more efficient “high mileage” vehicles, (as was done at the federal level with the Cash for Clunkers program).
When considering the importance of transportation as a critical component of reaching net zero emissions, this analysis provides a significant contribution in demonstrating a method to account for the changing mix of power generation as EVs replace ICE vehicles on an isolated, fossil fuel dependent power grid. In this analysis, EV fossil fuel use and CO2 emissions varied with the projections for renewable power and EV adoption. However, due to the relatively large impacts of (1) the fuel efficiency of EVs over that of ICE vehicles, and (2) the scheduled, planned, and expected solar power generation in coming years and long-term carbon neutral state goals, the overall trends are clear. Results from this analysis demonstrate the underlying need to accelerate replacement of ICE vehicles with EVs to avoid importing oil and to reduce GHG emissions.
This examination of a small, isolated power system and transportation network provides a powerful assessment to help visualize the benefit and synergies of both renewable power and transportation electrification. Quantifying the immense reductions in fossil fuel consumption and CO2 emissions brings into sharp focus the need for further policy and regulatory measures to accelerate these transitions.
Funding
This work was supported by an award from the Office of Naval Research (ONR) Asia Pacific Research Initiative for Sustainable Energy Systems (APRISES), award number N00014-17-1-2206 to Richard Rocheleau, Director of the Hawaii Natural Energy Institute.
Data Availability Statement
Publicly archived datasets were analyzed in this study, and can be found at the following: Generation and Fuel Consumption Time Series File, 2017 Final, EIA-923 Reports. U.S. Energy Information Administration, (EIA), https://www.eia.gov/electricity/data/eia92, (accessed on 5 August 2019). Generation and Fuel Consumption Time Series File, 2018 Early Release, EIA-923 Reports. EIA, https://www.eia.gov/electricity/data/eia923/, (accessed on 6 August 2019). Generation and Fuel Consumption Time Series File, 2019 Early Release Data, EIA-923. EIA, https://www.eia.gov/electricity/data/eia923/, (accessed on 21 April 2020). Generation and Fuel Consumption Time Series File, 2020 Preliminary, EIA-923. EIA, https://www.eia.gov/electricity/data/eia923/, (accessed on 1 June 2021). Average Price of Electricity to Ultimate Customers by End-Use Sector, EIA, https://www.eia.gov/electricity/monthly/epm_table_grapher.php?t=epmt_5_06_b, (accessed on 9 July 2020). Energy Data and Trends 2017, State of Hawaii, Department of Business, Economic Development and Tourism (DBEDT), http://files.hawaii.gov/dbedt/economic/data_reports/reports-studies/energy-data-trend-2017.pdf, (accessed on 8 January 2020). All-Electric Vehicles, DOE, Office of Energy Efficiency and Renewable Energy, https://www.fueleconomy.gov/feg/evtech.shtml, (accessed on 3 September 2020). Average Fuel Efficiency of U.S. Light Duty Vehicles, U.S. Department of Transportation (DOT), Bureau of Transportation Statistics, https://www.bts.gov/content/average-fuel-efficiency-us-light-duty-vehicles, (accessed on 6 August 2019). Fuel Properties Comparison (Table), U.S. DOE, Alternative Fuels Data Center, (AFDC) https://afdc.energy.gov/fuels/fuel_comparison_chart.pdf, (accessed on 6 August 2019). Average Fuel Economy of Major Vehicle Categories 2016, U.S. DOE, AFDC, https://afdc.energy.gov/data/10310, (accessed on 1 December 2020). Renewable Portfolio Standard Status Report 2017, Hawaiian Electric Companies, https://puc.hawaii.gov/wp-content/uploads/2018/02/RPS-HECO-2017.pdf, (accessed on 28 May 2019). Renewable Portfolio Standard Status Report 2018, Hawaiian Electric Companies, https://www.hawaiianelectric.com/documents/clean_energy_hawaii/rps_report_2018.pdf, (accessed on 27 May 2019). Renewable Portfolio Standard Status Report 2019, Hawaiian Electric Companies, https://www.hawaiianelectric.com/documents/clean_energy_hawaii/rps_report_2019.pdf, (accessed on 10 April 2020). Renewable Portfolio Standard Status Report 2020, Hawaiian Electric Companies, https://www.hawaiianelectric.com/clean-energy-hawaii/our-clean-energy-portfolio, (accessed on 1 June 2021). Emission Factors for Greenhouse Gas Inventories, Mobile Combustion CO2 (Table 2), U.S. Environmental Protection Agency (EPA), March 2018, https://www.epa.gov/sites/production/files/2018-03/documents/emission-factors_mar_2018_0.pdf, (accessed on 14 February 2020). DOE AFDC, 2018, https://afdc.energy.gov/data/10309, (accessed on 1 October 2020). Renewable Fuel Standard (RFS), EPA, 2010. Monthly Energy Trends: Historical data from January 2006 to February 2021, State of Hawaii, DBEDT, https://dbedt.hawaii.gov/economic/energy-trends-2/, (accessed on 4 June 2021).
Acknowledgments
The author is grateful for suggestions from Anukriti Hittle at the State of Hawaii’s Climate Change Mitigation and Adaptation Commission, and from Charles Laidley.
Conflicts of Interest
The author declares no conflict of interest.
References
- Coffman, M.; Bernstein, P.; Wee, S. Integrating electric vehicles and residential solar PV. Transp. Policy 2017, 53, 30–38. [Google Scholar] [CrossRef]
- What Is U.S. Electricity Generation by Energy Source? U.S. Energy Information Administration, (EIA). Available online: https://www.eia.gov/tools/faqs/faq.php?id=427&t=3#:~:text=In%202019%2C%20about%204%2C118%20billion,facilities%20in%20the%20United%20States.&text=About%2063%25%20of%20this%20electricity,%2C%20petroleum%2C%20and%20other%20gases (accessed on 1 June 2021).
- Generation and Fuel Consumption Time Series File, 2020 Preliminary, EIA-923. EIA. Available online: https://www.eia.gov/electricity/data/eia923/ (accessed on 1 June 2021).
- Renewable Portfolio Standard Status Report, 2020, Hawaiian Electric Companies. Available online: https://www.hawaiianelectric.com/clean-energy-hawaii/our-clean-energy-portfolio (accessed on 1 June 2021).
- Average Price of Electricity to Ultimate Customers by End-Use Sector. U.S. Department of Energy (DOE), Energy Information Administration (EIA). Available online: https://www.eia.gov/electricity/monthly/epm_table_grapher.php?t=epmt_5_06_b (accessed on 9 July 2020).
- Energy Data and Trends 2017. State of Hawaii, Department of Business, Economic Development and Tourism (DBEDT). Available online: http://files.hawaii.gov/dbedt/economic/data_reports/reports-studies/energy-data-trend-2017.pdf (accessed on 8 January 2020).
- Larsen, J.; Shashank, M.; Herndon, W.; Marsters, P.; Pitt, H. Transcending Oil: Hawaii’s Path to a Clean Energy Economy. (2018) Rhodium Group, LLC. 5 Columbus Circle, New York, NY, USA, 10019. Available online: https://elementalexcelerator.com/transcending-oil/#:~:text=In%20April%202018%2C%20we%20released,the%20more%20jobs%20we%20create (accessed on 6 August 2019).
- Electrification of Transportation (EoT) Roadmap. Hawaiian Electric Companies. 29 March 2018. Available online: https://www.hawaiianelectric.com/clean-energy-hawaii/electrification-of-transportation (accessed on 9 January 2020).
- All-Electric Vehicles, DOE, Office of Energy Efficiency and Renewable Energy (EERE). Available online: https://www.fueleconomy.gov/feg/evtech.shtml (accessed on 3 September 2020).
- Where the Energy Goes: Electric Cars, DOE, EERE. Available online: https://www.fueleconomy.gov/feg/atv-ev.shtml (accessed on 3 September 2020).
- Where the Energy Goes: Gasoline Vehicles, DOE, EERE. Available online: https://www.fueleconomy.gov/feg/atv.shtml (accessed on 3 September 2020).
- Interactive Version of the Electric Vehicle Label, U.S. Environmental Protection Agency (EPA). Available online: https://www.epa.gov/fueleconomy/interactive-version-electric-vehicle-label (accessed on 7 August 2018).
- Average Fuel Efficiency of U.S. Light Duty Vehicles, U.S. Department of Transportation (DOT), Bureau of Transportation Statistics. Available online: https://www.bts.gov/content/average-fuel-efficiency-us-light-duty-vehicles (accessed on 6 August 2019).
- Cars are Connected; Hawaii Dealer. 2018 First Quarter Edition, (New Retail Hybrid and Electric Vehicle Registrations, 2017; Hawaii Automobile Dealers Association: Honolulu, HI, USA, 2018. [Google Scholar]
- Fuel Properties Comparison (Table), U.S. DOE, Alternative Fuels Data Center, (AFDC). Available online: https://afdc.energy.gov/fuels/fuel_comparison_chart.pdf (accessed on 6 August 2019).
- EPA. Renewable Fuel Standard (RFS); EPA: Washington, DC, USA, 2010.
- Nation’s Strictest Regulatory Board Affirms Biodiesel as Lowest-Carbon Fuel, National Biodiesel Board, September 2015. Available online: https://www.prnewswire.com/news-releases/nations-strictest-regulatory-board-affirms-biodiesel-as-lowest-carbon-fuel-300149690.html (accessed on 1 December 2020).
- Average Fuel Economy of Major Vehicle Categories 2016, U.S. DOE, AFDC. Available online: https://afdc.energy.gov/data/10310 (accessed on 1 December 2020).
- California Hybrid, Efficient and Advanced Truck Research Center, CALSTART. Battery Electric Parcel Delivery Truck Testing and Demonstration; California Hybrid, Efficient and Advanced Truck Research Center, CALSTART: Pasadena, CA, USA, 2013. [Google Scholar]
- State of California Air Resources Board. Medium- and Heavy-duty Battery Electric Trucks and Buses (Draft); State of California Air Resources Board: Sacramento, CA, USA, 2015.
- Liimatainena, H.; van Vlietb, O.; Aplynb, D. The potential of electric trucks—An international commodity-level analysis. Appl. Energy 2019, 236, 804–814. [Google Scholar] [CrossRef]
- Oak Ridge National Laboratory, National Renewable Energy Laboratory. Medium- and Heavy-Duty Vehicle Electrification: An Assessment of Technology and Knowledge Gaps; Oak Ridge National Laboratory, National Renewable Energy Laboratory: Oak Ridge, TN, USA, 2019. [Google Scholar]
- Generation and Fuel Consumption Time Series File, 2017 Final, EIA-923 Reports. EIA. Available online: https://www.eia.gov/electricity/data/eia92, (accessed on 5 August 2019).
- Generation and Fuel Consumption Time Series File, 2018 Early Release, EIA-923 Reports. EIA. Available online: https://www.eia.gov/electricity/data/eia923/ (accessed on 6 August 2019).
- Generation and Fuel Consumption Time Series File, 2019 Early Release Data, EIA-923. EIA. Available online: https://www.eia.gov/electricity/data/eia923/ (accessed on 21 April 2020).
- Renewable Portfolio Standard Status Report, 2017 Final Data, Hawaiian Electric Companies. Available online: https://puc.hawaii.gov/wp-content/uploads/2018/02/RPS-HECO-2017.pdf (accessed on 28 May 2019).
- Renewable Portfolio Standard Status Report, 2018 Early Release Data, Hawaiian Electric Companies. Available online: https://www.hawaiianelectric.com/documents/clean_energy_hawaii/rps_report_2018.pdf (accessed on 27 May 2019).
- Renewable Portfolio Standard Status Report, 2019, Hawaiian Electric Companies. Available online: https://www.hawaiianelectric.com/documents/clean_energy_hawaii/rps_report_2019.pdf (accessed on 10 April 2020).
- Market Trends Pacific Inc. Strategies for Energy Efficiencies in Transportation, Hawaii Energy Policy Forum; Market Trends Pacific Inc.: Honolulu, HI, USA, 2010. [Google Scholar]
- Average Annual Vehicle Miles Traveled by Major Vehicle Category, DOE AFDC. 2018. Available online: https://afdc.energy.gov/data/10309 (accessed on 1 October 2020).
- Carbon Dioxide Emissions Coefficients by Fuel, Release Date: 2 February 2016, EIA. Available online: https://www.eia.gov/environment/emissions/co2_vol_mass.php (accessed on 8 April 2018).
- Emission Factors for Greenhouse Gas Inventories, Mobile Combustion CO2 (Table 2). March 2018, EPA. Available online: https://www.epa.gov/sites/production/files/2018-03/documents/emission-factors_mar_2018_0.pdf (accessed on 14 February 2020).
- Summary of Expansions and Updates in GREET® 2020, October 2020, Page 24, and Summary of Expansions and Updates in GREET® 2019, October 2019, page 5, Argonne National Laboratory. Available online: https://greet.es.anl.gov/ (accessed on 3 September 2020).
- Vehicle Cost Calculator Assumptions and Methodology, Data Sources and Values, DOE, AFDC. Available online: https://afdc.energy.gov/calc/cost_calculator_methodology.html (accessed on 3 September 2020).
- 29 planned renewable projects represent $3.5–$4 billion clean energy investment in Hawaii”, Hawaiian Electric Companies, Press Release, July 1, 2020. Available online: https://www.hawaiianelectric.com/29-planned-renewable-projects-represent-35-4-billion-clean-energy-investment-in-hawaii (accessed on 7 July 2020).
- Regulators accept Hawaiian Electric Companies’ plan to reach 100% renewable energy, Hawaiian Electric Companies, Press Release 17 July 2017. Available online: https://www.hawaiianelectric.com/regulators-accept-hawaiian-electric-companies-plan-to-reach-100-renewable-energy, (accessed on 7 July 2020).
- Global EV Outlook 2020, International Energy Agency (IEA), Division of the Directorate of Sustainability, Technology and Outlooks (STO), Energy Technology Policy (ETP). Available online: https://www.iea.org/reports/global-ev-outlook-2020 (accessed on 22 December 2020).
- Monthly Energy Trends: Historical data from January 2006 to February 2021. DBEDT. Available online: https://dbedt.hawaii.gov/economic/energy-trends-2/ (accessed on 4 June 2021).
- Average Age of Automobiles and Trucks in Operation in the United States, U.S. Bureau of Transportation Statistics. Available online: https://www.bts.gov/content/average-age-automobiles-and-trucks-operation-united-states (accessed on 28 March 2021).
- Joselow, M. National Carbon Tax Upheld by Canada’s Supreme Court, Scientific American. 2021. Available online: https://www.scientificamerican.com/article/national-carbon-tax-upheld-by-canadas-supreme-court/#:~:text=The%20Parliament%20of%20Canada%20passed(%2423.88)%20per%20metric%20ton (accessed on 3 June 2021).
- Carbon Pricing Dashboard, the World Bank. Available online: https://carbonpricingdashboard.worldbank.org/what-carbon-pricing (accessed on 3 June 2021).
- Cattaneo, L. Plug-In Electric Vehicle Policy: Evaluating the Effectiveness of State Policies for Increasing Deployment. Center for American Progress. 2018. Available online: https://www.americanprogress.org/issues/green/reports/2018/06/07/451722/plug-electric-vehicle-policy/ (accessed on 3 June 2021).
Figure 1.
Electricity generation by fuel source, showing the contrast in petroleum oil as a fuel source (as a percentage of net generation in 2020): (a) Nationally, 0.4% of electricity was generated from oil and; (b) Oahu, Hawaii, 55.4% of electricity was generated from oil.
Figure 1.
Electricity generation by fuel source, showing the contrast in petroleum oil as a fuel source (as a percentage of net generation in 2020): (a) Nationally, 0.4% of electricity was generated from oil and; (b) Oahu, Hawaii, 55.4% of electricity was generated from oil.

Figure 2.
Average fuel economy for passenger and freight vehicles included in this analysis by vehicle type and by fuel (in Miles Per Gallon Gasoline Equivalent (MPGe) and MPG). For passenger vehicles, both average and efficient plug-in Electric Vehicles (EVs) (blue bars) were compared with average and efficient gasoline (red bars), as well as average diesel vehicles (yellow bars). Average freight EVs, gasoline and diesel were also compared.

Figure 3.
Comparison of fossil fuel consumption on Oahu in 2020, for Internal Combustion Engine (ICE) vehicles and EVs (gallons of gasoline equivalent, GGe): (a) Average and efficient passenger vehicles; (b) Average freight vehicles.
Figure 3.
Comparison of fossil fuel consumption on Oahu in 2020, for Internal Combustion Engine (ICE) vehicles and EVs (gallons of gasoline equivalent, GGe): (a) Average and efficient passenger vehicles; (b) Average freight vehicles.

Figure 4.
Total annual fossil fuel use by all vehicles on Oahu in 2020 (blue bars, left axis), and total annual CO2 emissions (yellow bars, right axis).
Figure 4.
Total annual fossil fuel use by all vehicles on Oahu in 2020 (blue bars, left axis), and total annual CO2 emissions (yellow bars, right axis).

Figure 5.
Renewable power generation (green) based on the utility’s projection to replace fossil fuel (orange) through 2040. (Black markers show the data points used to generate the curve.).
Figure 5.
Renewable power generation (green) based on the utility’s projection to replace fossil fuel (orange) through 2040. (Black markers show the data points used to generate the curve.).

Figure 6.
Renewable power generation (green) based on the State’s Renewable Portfolio Standard (RPS) to replace fossil fuel (orange) through 2045. (Black markers show the data points used to generate the curve.).
Figure 6.
Renewable power generation (green) based on the State’s Renewable Portfolio Standard (RPS) to replace fossil fuel (orange) through 2045. (Black markers show the data points used to generate the curve.).

Figure 7.
Annual fossil fuel consumption for vehicles on Oahu for 2017 through 2020 and projected out to 2050 under the faster renewable power projection: (a) Passenger; (b) Freight.
Figure 7.
Annual fossil fuel consumption for vehicles on Oahu for 2017 through 2020 and projected out to 2050 under the faster renewable power projection: (a) Passenger; (b) Freight.

Figure 8.
Annual CO2 emissions for vehicles on Oahu from 2017 through 2020 and projected to 2050 under the faster renewable power projection: (a) Passenger; (b) Freight.
Figure 8.
Annual CO2 emissions for vehicles on Oahu from 2017 through 2020 and projected to 2050 under the faster renewable power projection: (a) Passenger; (b) Freight.

Figure 9.
Cumulative vehicle fossil fuel use from 2020 to 2050 on Oahu under the faster renewable power projection: (a) Passenger; (b) Freight.
Figure 9.
Cumulative vehicle fossil fuel use from 2020 to 2050 on Oahu under the faster renewable power projection: (a) Passenger; (b) Freight.

Figure 10.
Cumulative vehicle CO2 emissions from 2020 through 2050 on Oahu in the faster renewable power projection: (a) Passenger; (b) Freight.
Figure 10.
Cumulative vehicle CO2 emissions from 2020 through 2050 on Oahu in the faster renewable power projection: (a) Passenger; (b) Freight.

Figure 11.
Modeled EV adoption for passenger and freight vehicles based on a global projection to reach 12.25% EVs on the road by 2030, and continuing that trend for Oahu to reach 100% by 2050.
Figure 11.
Modeled EV adoption for passenger and freight vehicles based on a global projection to reach 12.25% EVs on the road by 2030, and continuing that trend for Oahu to reach 100% by 2050.

Figure 12.
Passenger EV adoption based on Hawaiian Electric Companies’ projection to gradually reach 55% passenger EVs on the road by 2045.
Figure 12.
Passenger EV adoption based on Hawaiian Electric Companies’ projection to gradually reach 55% passenger EVs on the road by 2045.

Figure 13.
With the most ambitious scenario in this analysis, Scenario #1, total fossil fuel use for passenger ICE vehicles powered by gasoline, and freight ICE vehicles powered by gasoline and diesel, contrasted with passenger and freight EVs powered on Oahu as EVs replace ICE vehicles and renewables replace fossil fuels for power generation.

Figure 14.
Total Passenger vehicle fossil fuel use showing the impact of the faster EV projection (solid lines), and slower EV projection (dotted lines): (a) Fast renewable power projection; (b) Slower renewable power projection.
Figure 14.
Total Passenger vehicle fossil fuel use showing the impact of the faster EV projection (solid lines), and slower EV projection (dotted lines): (a) Fast renewable power projection; (b) Slower renewable power projection.

Figure 15.
Total CO2 emissions for passenger and freight vehicles powered on Oahu under the ambitious scenario in this analysis, Scenario #1, with the faster renewable power and EV projections (in million of metric tons per year, MMT/yr).
Figure 15.
Total CO2 emissions for passenger and freight vehicles powered on Oahu under the ambitious scenario in this analysis, Scenario #1, with the faster renewable power and EV projections (in million of metric tons per year, MMT/yr).

Figure 16.
Total passenger vehicle CO2 emissions showing the impact of the faster EV projection (solid lines), and slower EV projection (dotted lines): (a) Faster renewable power projection; (b) Slower renewable power projection.
Figure 16.
Total passenger vehicle CO2 emissions showing the impact of the faster EV projection (solid lines), and slower EV projection (dotted lines): (a) Faster renewable power projection; (b) Slower renewable power projection.


Table 1.
Fossil fuel dependency (% fossil fuel) and CO2 emission factor (kg CO2/kWh) for the Oahu electric power system from 2017 through 2020.
Table 1.
Fossil fuel dependency (% fossil fuel) and CO2 emission factor (kg CO2/kWh) for the Oahu electric power system from 2017 through 2020.
| Year | Fossil Fuel (%) | CO2 Emission Factor (kg CO2/kWh) |
|---|---|---|
| 2017 | 82.4% | 0.708 |
| 2018 | 81.4% | 0.691 |
| 2019 | 79.0% | 0.677 |
| 2020 | 72.4% | 0.630 |
Table 2.
CO2 emissions per mile by vehicle and fuel type from 2017 through 2020 (kg CO2/mile).
| Vehicle (Passenger and Freight) | 2017 (kg CO2/mile) | 2018 (kg CO2/mile) | 2019 (kg CO2/mile) | 2020 (kg CO2/mile) |
|---|---|---|---|---|
| Passenger EV—Efficient (0.25 kWh/mile, 133 MPGe) | 0.179 | 0.175 | 0.172 | 0.160 |
| Passenger EV—Average (0.32 kWh/mile, 110 MPGe) | 0.227 | 0.221 | 0.217 | 0.202 |
| Passenger Gasoline—Efficient (50 MPG) | 0.176 | 0.176 | 0.176 | 0.176 |
| Passenger Diesel—Average (25 MPGe) | 0.403 | 0.403 | 0.403 | 0.403 |
| Passenger Gasoline—Average (22 MPG) | 0.399 | 0.399 | 0.399 | 0.399 |
| Freight EV (1.85 kWh/mi, 18.2 MPGe) | 1.31 | 1.28 | 1.25 | 1.17 |
| Freight Gasoline (5.1 MPG) | 1.72 | 1.72 | 1.72 | 1.72 |
| Freight Diesel (5.3 MPGe) | 1.93 | 1.93 | 1.93 | 1.93 |
Table 3.
Total cumulative passenger vehicle fossil fuel consumption from 2020 to 2045 on Oahu by Scenario, (based on faster and slower projections for both the renewable resources on the power grid, and for the rate of EV adoption, billion GGe).
Table 3.
Total cumulative passenger vehicle fossil fuel consumption from 2020 to 2045 on Oahu by Scenario, (based on faster and slower projections for both the renewable resources on the power grid, and for the rate of EV adoption, billion GGe).
| Scenario 1 | Scenario 2 | Scenario 3 | Scenario 4 | |
|---|---|---|---|---|
| (Fast Power/Fast EV) | (Fast Power/Slow EV) | (Slow Power/Fast EV) | (Slow Power/Slow EV) | |
| ICE vehicles | 4.8 | 6.2 | 4.8 | 6.2 |
| EVs | 0.42 | 0.026 | 0.14 | 0.072 |
Table 4.
Total cumulative passenger vehicle CO2 emissions from 2020 to 2045 on Oahu by Scenario, (based on faster and slower projections for both the renewable resources on the power grid, and for the rate of EV adoption, MMT).
Table 4.
Total cumulative passenger vehicle CO2 emissions from 2020 to 2045 on Oahu by Scenario, (based on faster and slower projections for both the renewable resources on the power grid, and for the rate of EV adoption, MMT).
| Scenario 1 | Scenario 2 | Scenario 3 | Scenario 4 | |
|---|---|---|---|---|
| (Fast Power/Fast EV) | (Fast Power/Slow EV) | (Slow Power/Fast EV) | (Slow Power/Slow EV) | |
| ICE vehicles | 42 | 54 | 42 | 54 |
| EVs | 2.1 | 1.2 | 4.7 | 2.4 |
Publisher’s Note: MDPI stays neutral with regard to jurisdictional claims in published maps and institutional affiliations. |
© 2021 by the author. Licensee MDPI, Basel, Switzerland. This article is an open access article distributed under the terms and conditions of the Creative Commons Attribution (CC BY) license (https://creativecommons.org/licenses/by/4.0/).
Share and Cite
MDPI and ACS Style
McKenzie, K.A. Sun, Wind and Waves: EV Fossil Fuel Use and Emissions on an Isolated, Oil-Dependent Hawaiian Island. World Electr. Veh. J. 2021, 12, 87. https://0-doi-org.brum.beds.ac.uk/10.3390/wevj12020087
AMA Style
McKenzie KA. Sun, Wind and Waves: EV Fossil Fuel Use and Emissions on an Isolated, Oil-Dependent Hawaiian Island. World Electric Vehicle Journal. 2021; 12(2):87. https://0-doi-org.brum.beds.ac.uk/10.3390/wevj12020087
Chicago/Turabian StyleMcKenzie, Katherine A. 2021. "Sun, Wind and Waves: EV Fossil Fuel Use and Emissions on an Isolated, Oil-Dependent Hawaiian Island" World Electric Vehicle Journal 12, no. 2: 87. https://0-doi-org.brum.beds.ac.uk/10.3390/wevj12020087