
Future Battery Material Demand Analysis Based on U.S. Department of Energy R&D Targets †


Argonne National Laboratory, 9700 South Cass Avenue, Lemont, IL 60439, USA
*
Author to whom correspondence should be addressed.
†
This paper is an adaptation of the paper presented at the 33rd International Electric Vehicles Symposium and Exhibition, Portland, OR 97232, USA, 14–17 June 2020.
World Electr. Veh. J. 2021, 12(3), 90; https://0-doi-org.brum.beds.ac.uk/10.3390/wevj12030090
Submission received: 26 April 2021
/
Revised: 8 June 2021
/
Accepted: 17 June 2021
/
Published: 25 June 2021
(This article belongs to the Special Issue Selected Papers from The 33rd International Electric Vehicles Symposium and Exhibition (Portland, Oregon, USA))
Abstract
:The U.S. Department of Energy’s Vehicle Technologies Office (VTO) supports research, development, and deployment of efficient, sustainable transportation technologies that will improve energy efficiency and fuel economy, and enable America to use less petroleum. To accelerate the development and adoption of new technologies, VTO has developed specific targets for a wide range of powertrain components, including the energy storage system. In this study, we use Autonomie, Argonne National Laboratory’s (Argonne’s) vehicle system simulation tool to evaluate future energy storage requirements (power, energy, etc.) for different vehicle classes, powertrains, component technologies and timeframes. BatPac, Argonne’s tool dedicated to energy storage pack design and costs, is then used to quantify the materials required for each pack. Market penetrations are then used to estimate the overall material demand worldwide and in the United States, with or without recycling. The results demonstrate that the positive impact of VTO research and development will lead to significant reduction in material compared to business-as-usual due to new anode and cathode designs, along with acceleration in battery cell chemistry penetrations. In terms of material demands, it is observed that lithium demand reaches about 80,000 tons (by a factor of 42–45), nickel demand reaches about 500,000 tons (by a factor of 47–56), manganese demand reaches about 30,000–50,000 tons (by a factor of 20–34), and cobalt demand reaches about 30,000 tons (by a factor of 13–28) in the future by 2050. The individual material demand per unit energy, however, decreases significantly in the future due to advances in VTO research and development activities. The increase in battery material demands is mostly driven by increased electrified vehicle fleet penetration in the markets.
1. Introduction
Since the early 2000s, the yearly sales of plug-in hybrid electric vehicles (PHEVs) and battery electric vehicles (BEVs) in the United States have increased significantly. The year-to-year increase is on the order of a few magnitudes, and a significant share consists of BEVs [1]. Along with the increase in the PHEV market share observed in the United States, the market share held by PHEV sales has also increased in China and Europe [2]. As the number of electrified vehicle sales rises, the demands for lithium-ion cell batteries are also increasing. Between the cathode and anode of the battery cells, the percent share of lithium, nickel, manganese, and cobalt materials are the most significant in the cathode [3].
The U.S. Department of Energy’s (DOE’s) Vehicle Technologies Office (VTO) relies on different market penetration tools to evaluate material demands and supplies of different materials in the United States and globally. However, current methods of evaluating the market demand for battery materials do not apply individual VTO component targets, such as battery energy density, lightweighting, and so forth to estimate the overall impact of VTO research and development (R&D). Therefore, the evolution of current and future battery material demand relies on data that do not reflect the VTO technology target goals.
A large-scale study is being run as part of DOE’s Benefits and Scenario Analysis (BaSce). Using the vehicles modeled as part of this study, further analysis has been conducted to estimate the battery material demand for different analysis years and the impact of recycling. It provides the range of estimates for business-as-usual (low technology progress) and VTO target goal impacts (high technology progress).
There are various studies that are ongoing to evaluate future material demands for lithium-ion batteries for the United States [4,5], as well as the global demand [6]. However, these models do not investigate the influence of battery chemistry evolution along with vehicle fleet penetrations. The study presented in this paper, however, presents an approach to quantify the impact of the DOE-VTO target goals for different technology advancements in evaluating potential future material demands from lithium-ion batteries. The study presented in this paper also takes into account different vehicle fleet penetrations to evaluate the total demand for both the U.S. market as well as at the global scale.
2. Large-Scale Simulation Process
The U.S. Department of Energy, Vehicle Technologies Office (U.S. DOE-VTO) generates the targets for advancements in technology and improvements in costs for engines, transmissions, batteries, fuel cell technologies, vehicle electrification, lightweighting, and so forth, over a given time frame. We use the different vehicle technology targets (battery energy density, battery energy specific cost, lightweighting, etc.) set by DOE-VTO to build the assumptions we evaluate over a range of time frames [7]. This paper will cover the results from 2015, 2020, 2025, 2030, and 2045 “laboratory years”, which corresponds to the “model year minus 5 years”. For example, a laboratory-year 2015 vehicle would reflect a vehicle that is available in the market in 2020, and similarly, a 2045 laboratory-year vehicle would be available in the market in 2050.
To implement uncertainties in the assumptions, two different set of targets have been implemented for all years: current/low technology progress (business as usual), and high technology progress (U.S. DOE-VTO targets).
The vehicle system simulation tool Autonomie [8] performs simulation on vehicle models that incorporate these vehicle technology targets. The vehicle models used for the simulation include power-split hybrid (split HEV), split plug-in hybrid (PHEVs), extended-range electric vehicles (EREVs), and battery-electric vehicles (BEVs) of different all-electric ranges (AERs) in miles: BEV200, BEV300, and BEV400. These vehicle models are modeled across five different vehicle classes—compact, midsize, small sports utility vehicle (SUV), midsize SUV, and pickup. The Argonne Battery Performance and Cost (BatPaC) modeling tool [9] estimates the active material content of the different chemistries across the different analysis years.
Figure 1 shows the detailed steps of the large-scale simulation process used to quantify the battery material demand using Autonomie and BatPaC.
2.1. Autonomie
Argonne’s Autonomie tool is used to simulate the vehicles over the defined timeframe. The vehicles are sized for the given timeframe according to the component assumptions described earlier. A large-scale simulation approach is undertaken to evaluate the high volume of vehicle uncertainties. We use a distributed computing method that accelerates and facilitates the simulation runs [10].
2.2. BatPaC
BatPaC is a software modeling tool designed for policymakers and researchers who are interested in estimating the cost of lithium-ion batteries after they have reached a mature state of development and are being manufactured at high volumes. The tool captures the interplay between the design and the cost of these batteries for transportation applications. BatPaC comes with a library of several lithium-ion battery chemistries and default inputs for all the parameters specified in different manufacturing areas of a factory.
2.3. Vehicle Sizing Process
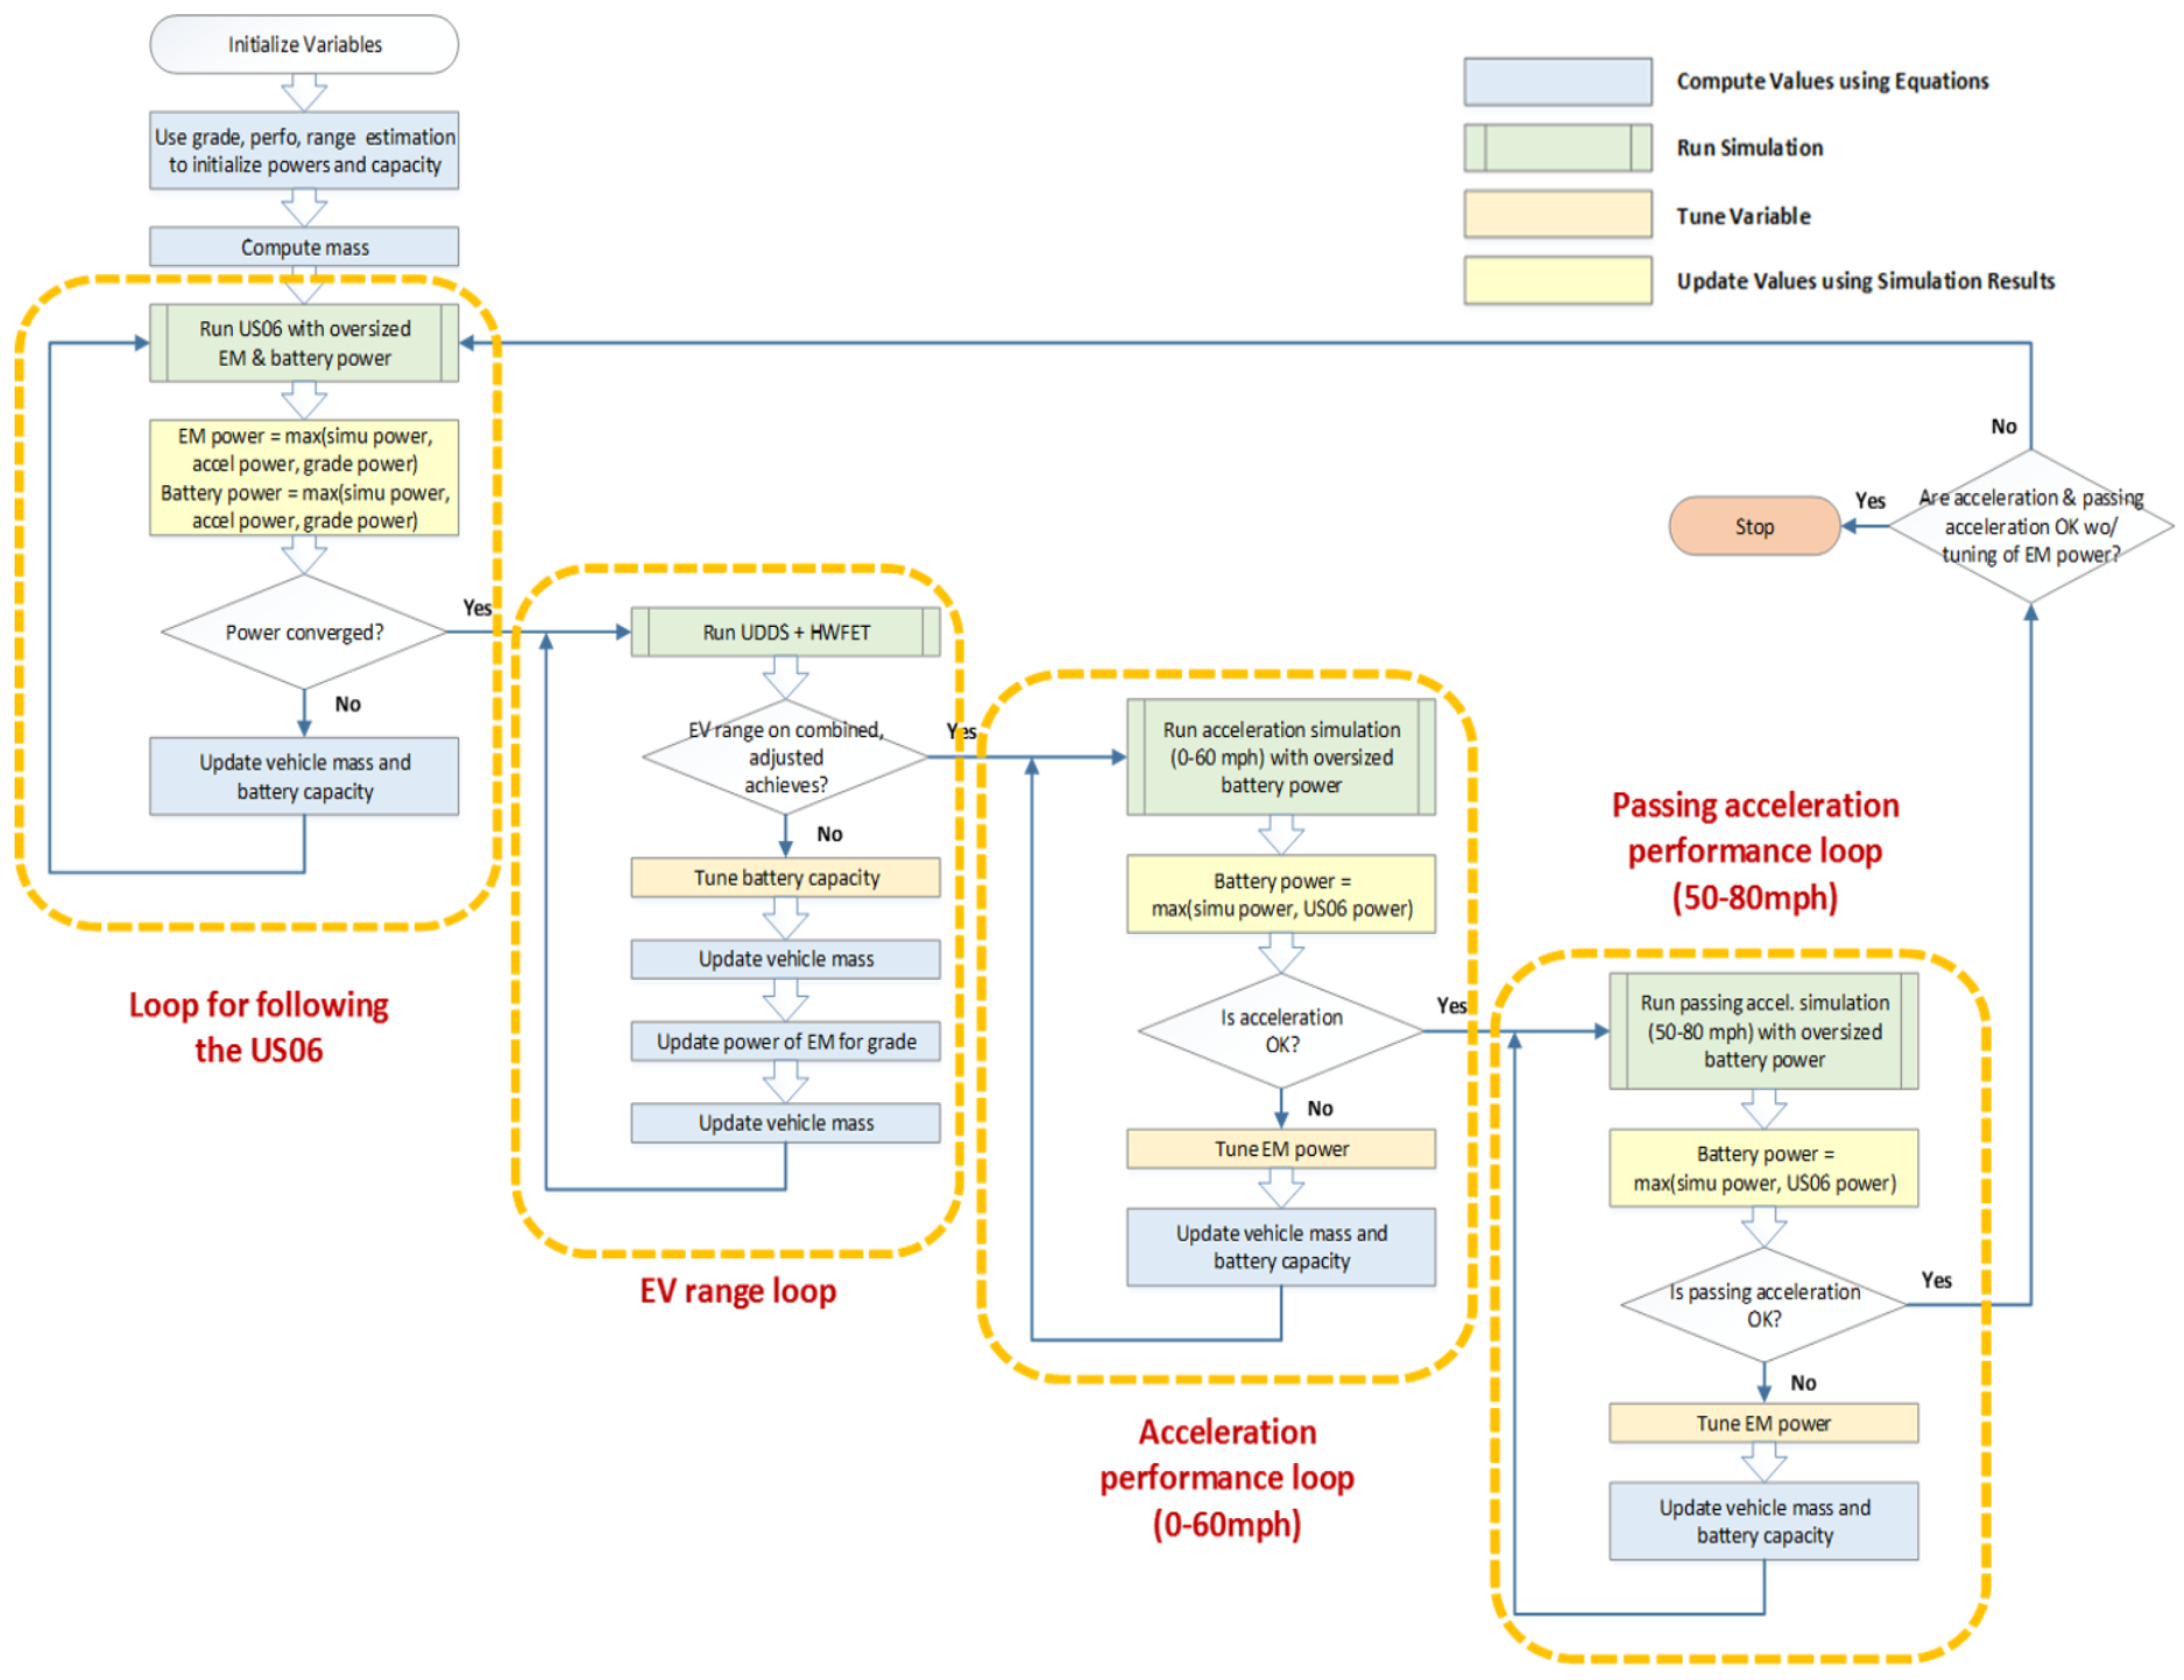
Autonomie uses different vehicle sizing processes for different vehicle powertrains. For example, Figure 2 shows the detailed steps of the BEV sizing algorithm. We used the algorithm for the various BEV AERs (BEV 200/300/400 AERs).
The main sizing algorithm for BEV sizing is as follows:
- Battery and electric machine (EM) powers are sized to be able to follow the US06 cycle at low state-of-charge (beginning of charge sustaining mode) at 10% state-of-charge or to meet the requirement of acceleration performance.
- The battery energy is sized to achieve the specified AER on the combined driving cycle, on the basis of adjusted energy values.
- The vehicle weight is adjusted accordingly from updated electric-machine (EM) and battery weights, which are functions of the electric-machine peak power and battery energy.
The full vehicle sizing processes for the other electrified powertrains are specified in detail in the full report [10].
3. Study Assumptions
3.1. Battery Chemistry Assumptions
The battery cell chemistries analyzed in the study are:
- Nickel-Cobalt Aluminum Oxide cathode with Graphite anode(NCA-G);
- Nickel-Manganese-Cobalt (60:20:20) cathode with Graphite anode (NMC622-G);
- Nickel-Manganese-Cobalt (80:10:10) cathode with Graphite anode (NMC811-G);
- Nickel-Manganese-Cobalt (90:5:5) cathode with Graphite anode (NMC955-G);
- Nickel-Cobalt-Aluminum Oxide & 10% Cobalt cathode with Graphite anode (NCA-G 10% Co).
Table 1 details the different assumptions related to the material contents for the different battery chemistries considered in this study.
3.2. Vehicle and Component Assumptions
This section details the different vehicle classifications and some of the major vehicle attribute selection used in the study. Table 2 details the different vehicle classifications defined for various performance times (0–60 mph time) in seconds, as well as corresponding vehicle attributes. The latest report from Argonne [10] details the assumptions and procedure involved behind the vehicle modeling and simulation efforts.
Table 3 summarizes the main DOE-VTO battery target assumptions associated with the different technologies over time. The different vehicles modeled in this study represent the laboratory years 2015, 2020, 2025, 2030, and 2045.
3.3. Market Penetration Assessment
Table 4 details the assumption of different battery chemistry penetrations across the fleet for different analysis years.
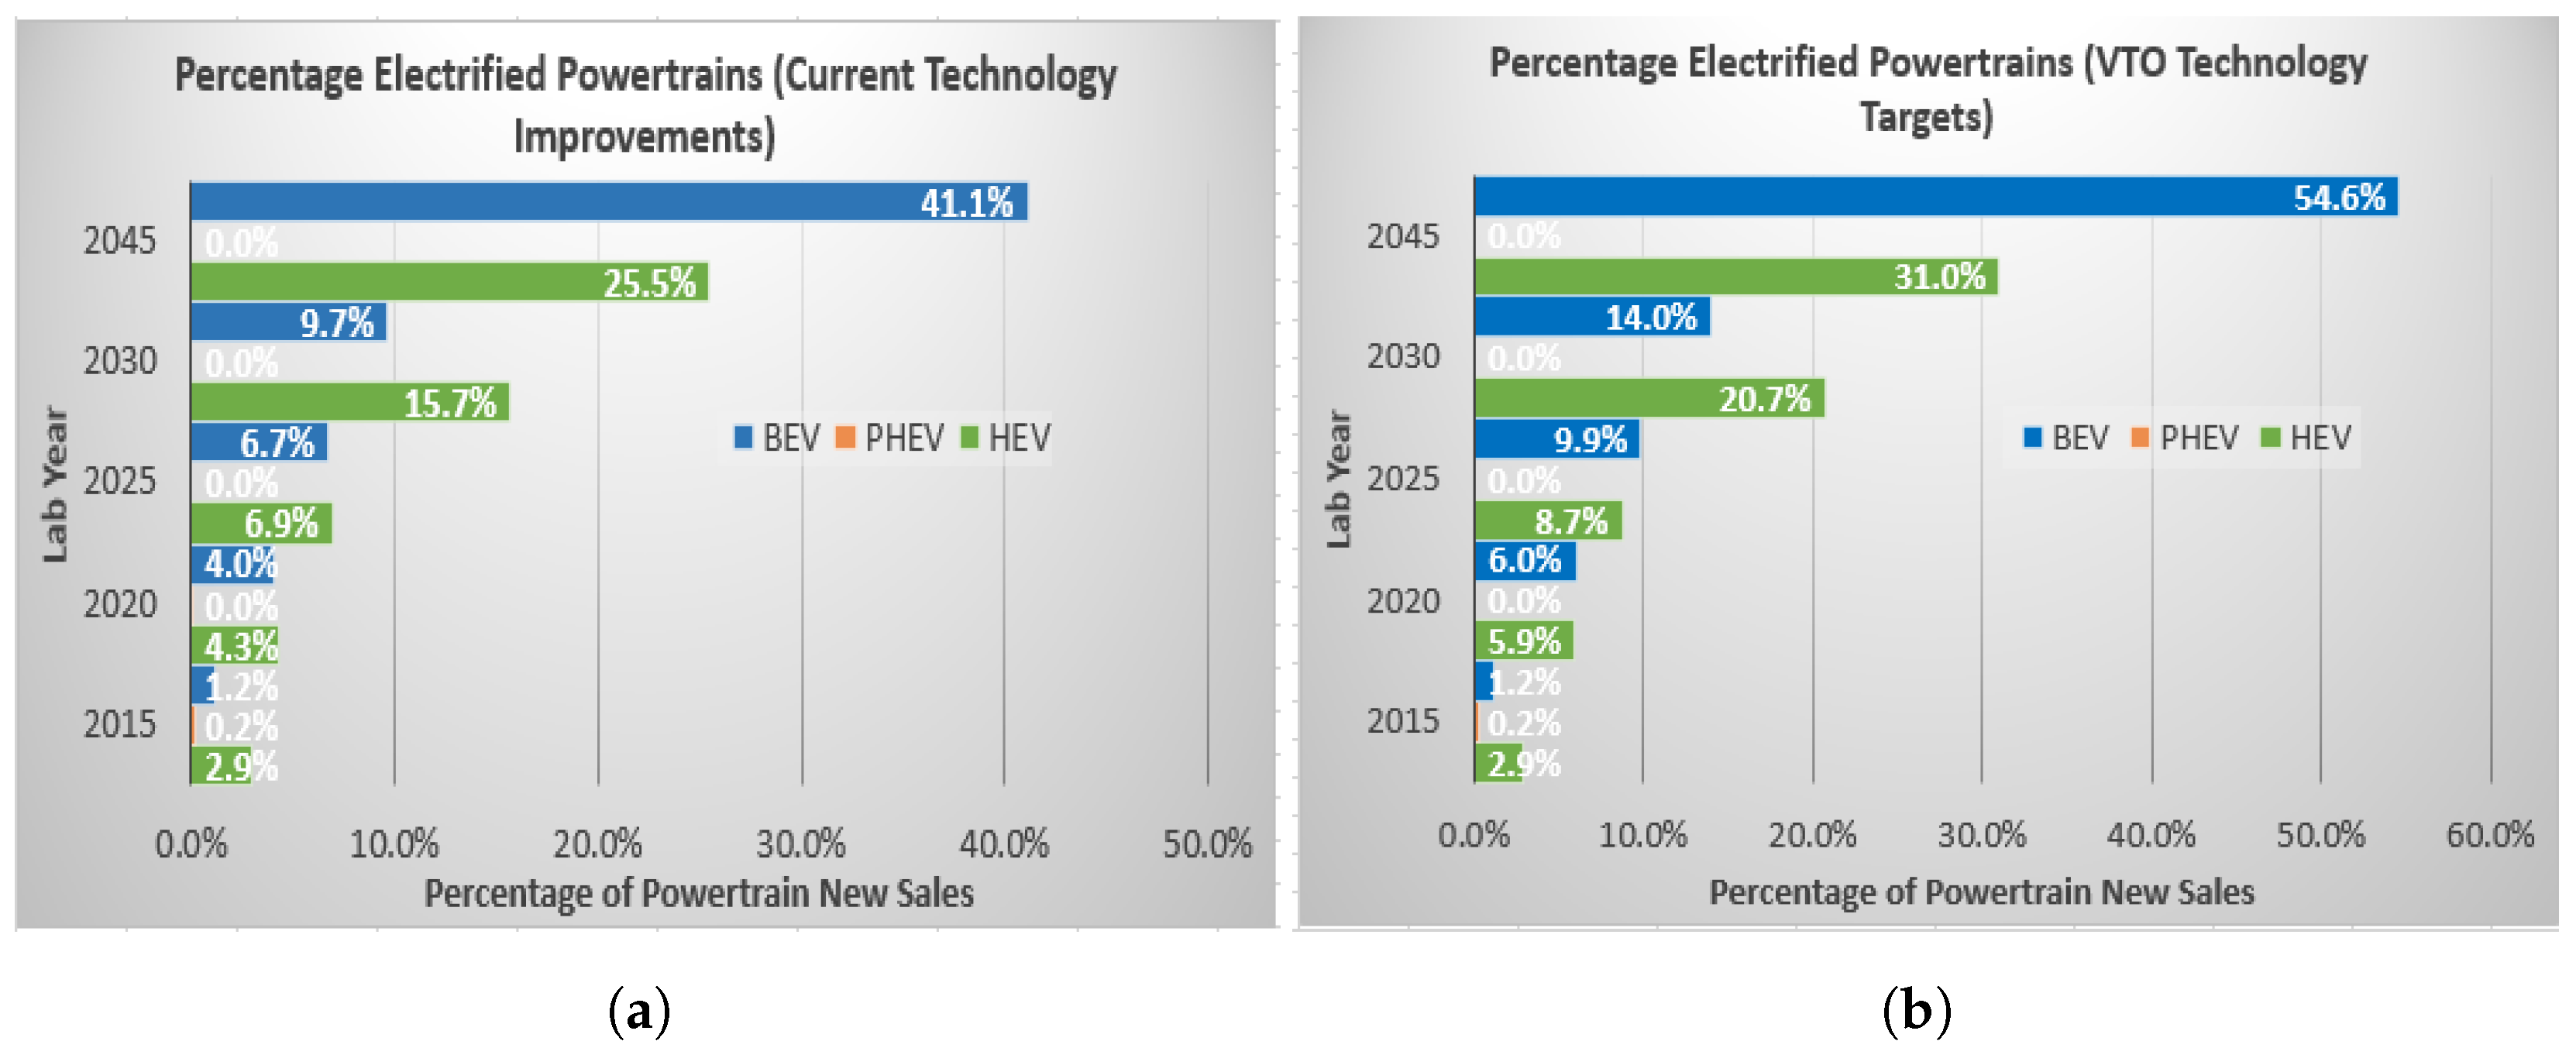
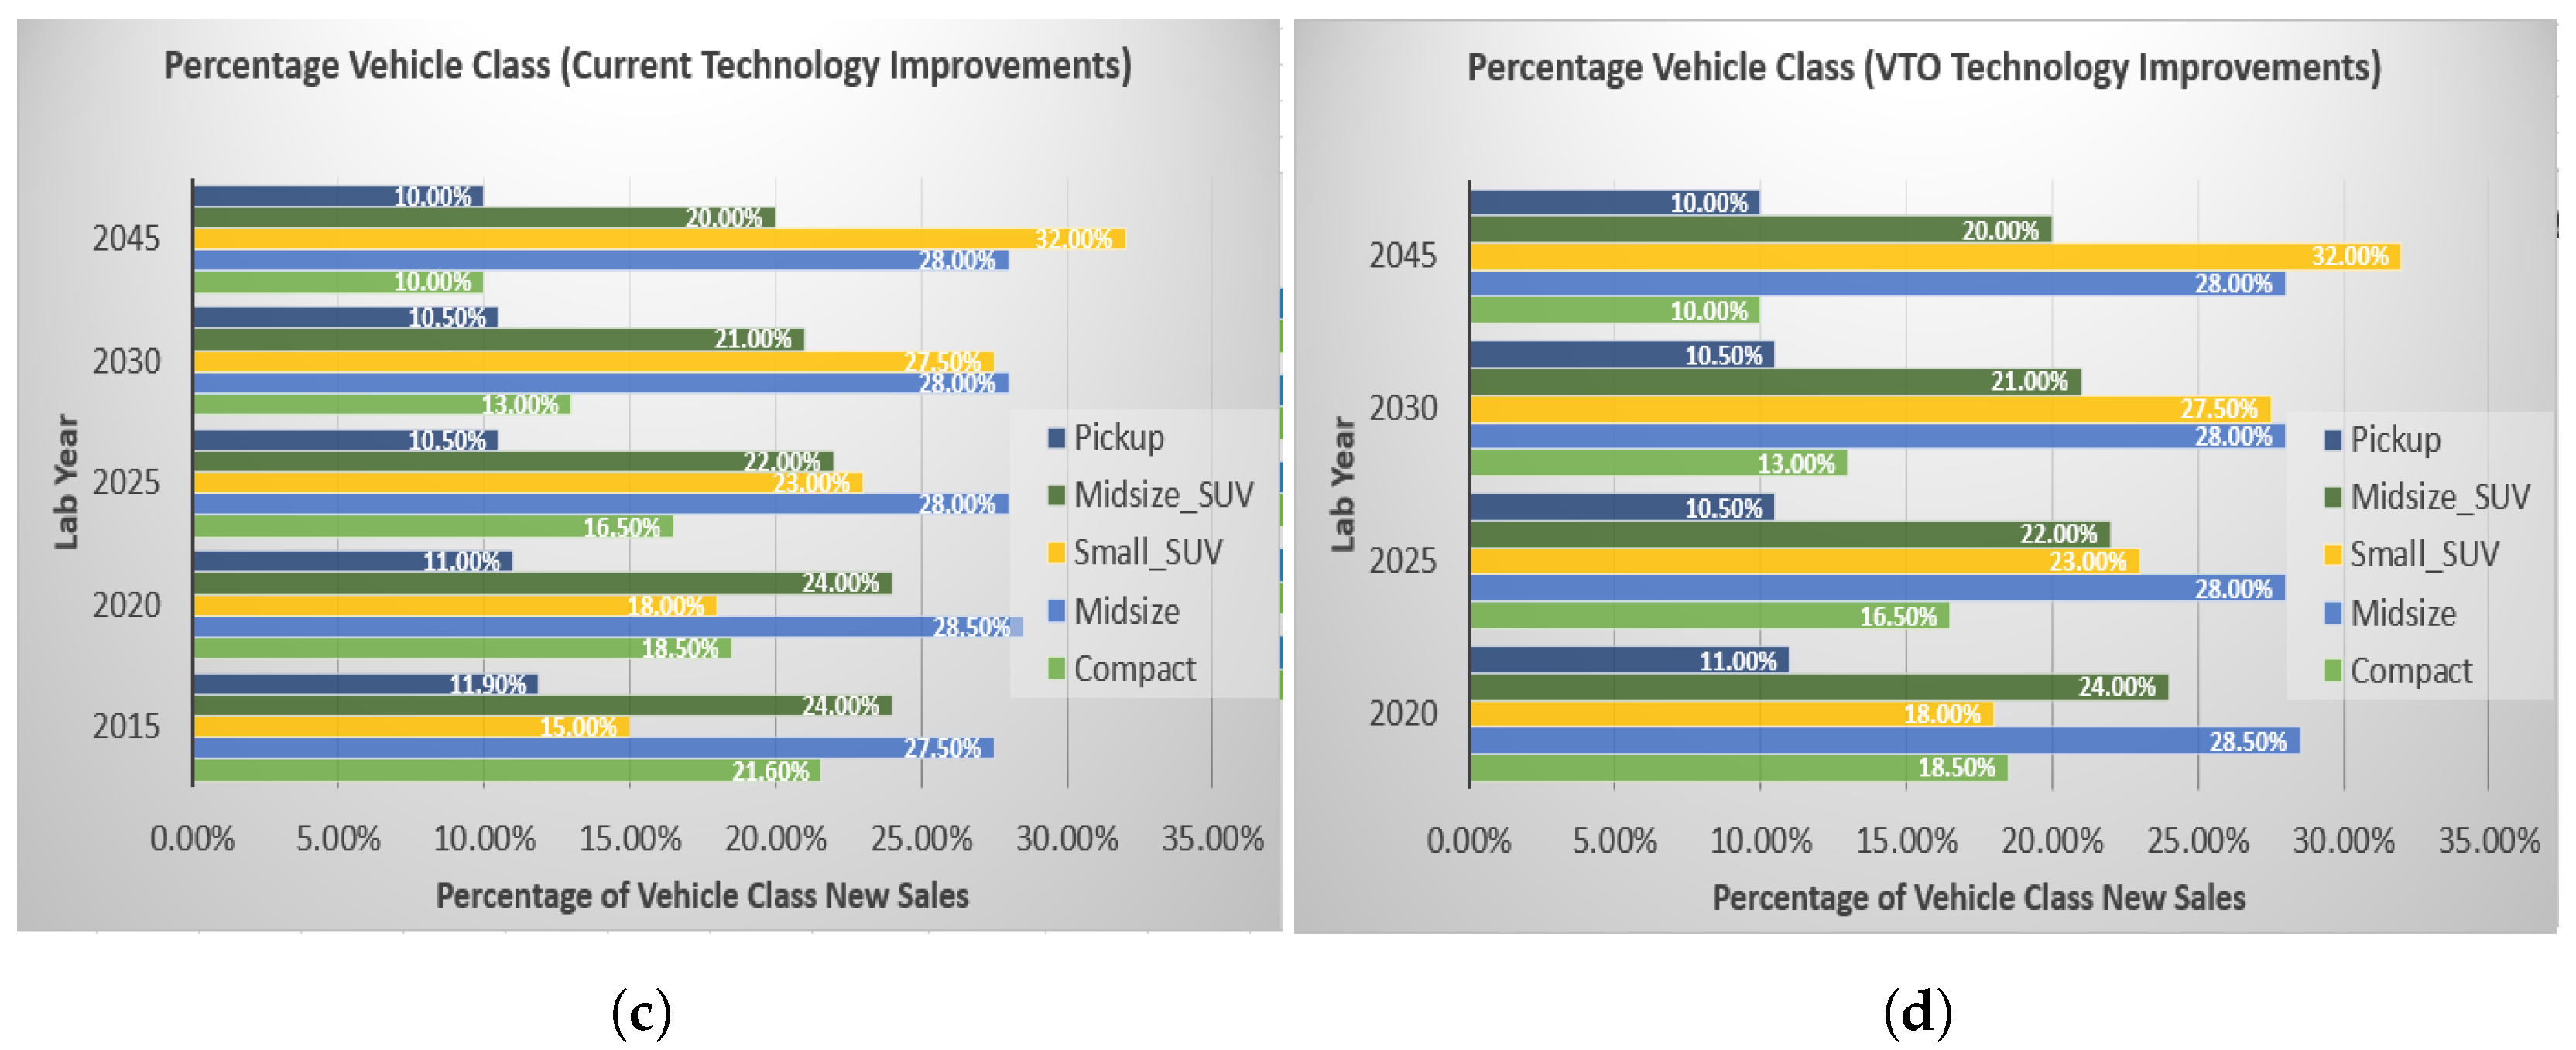
U.S. DOE-VTO relies on various vehicle market penetration tools to evaluate the fleet penetrations in the future based on different scenarios. The MA3T model is one such market penetration tool that can be used to evaluate the market penetrations of vehicle classes and powertrains in the future [11]. Figure 3 details the market penetration of different electrified powertrains, as well as vehicle classes for different laboratory years.
Figure 4 details the market penetration across the different electrified powertrains and vehicle classes for the different analysis years and technology progresses.
3.4. Battery Material Recycling Assumptions
Some existing publications evaluate different battery recycling methods, with various and detailed modeling of the recycling processes. These studies detail different recycling methods, including hydro and pyro recycling methods [12,13]. In this study, we assume that 100% of the available battery energy is recyclable, assuming a 10-year end-of-life period for the batteries [14].
4. Results & Observation
4.1. Weight Analyses
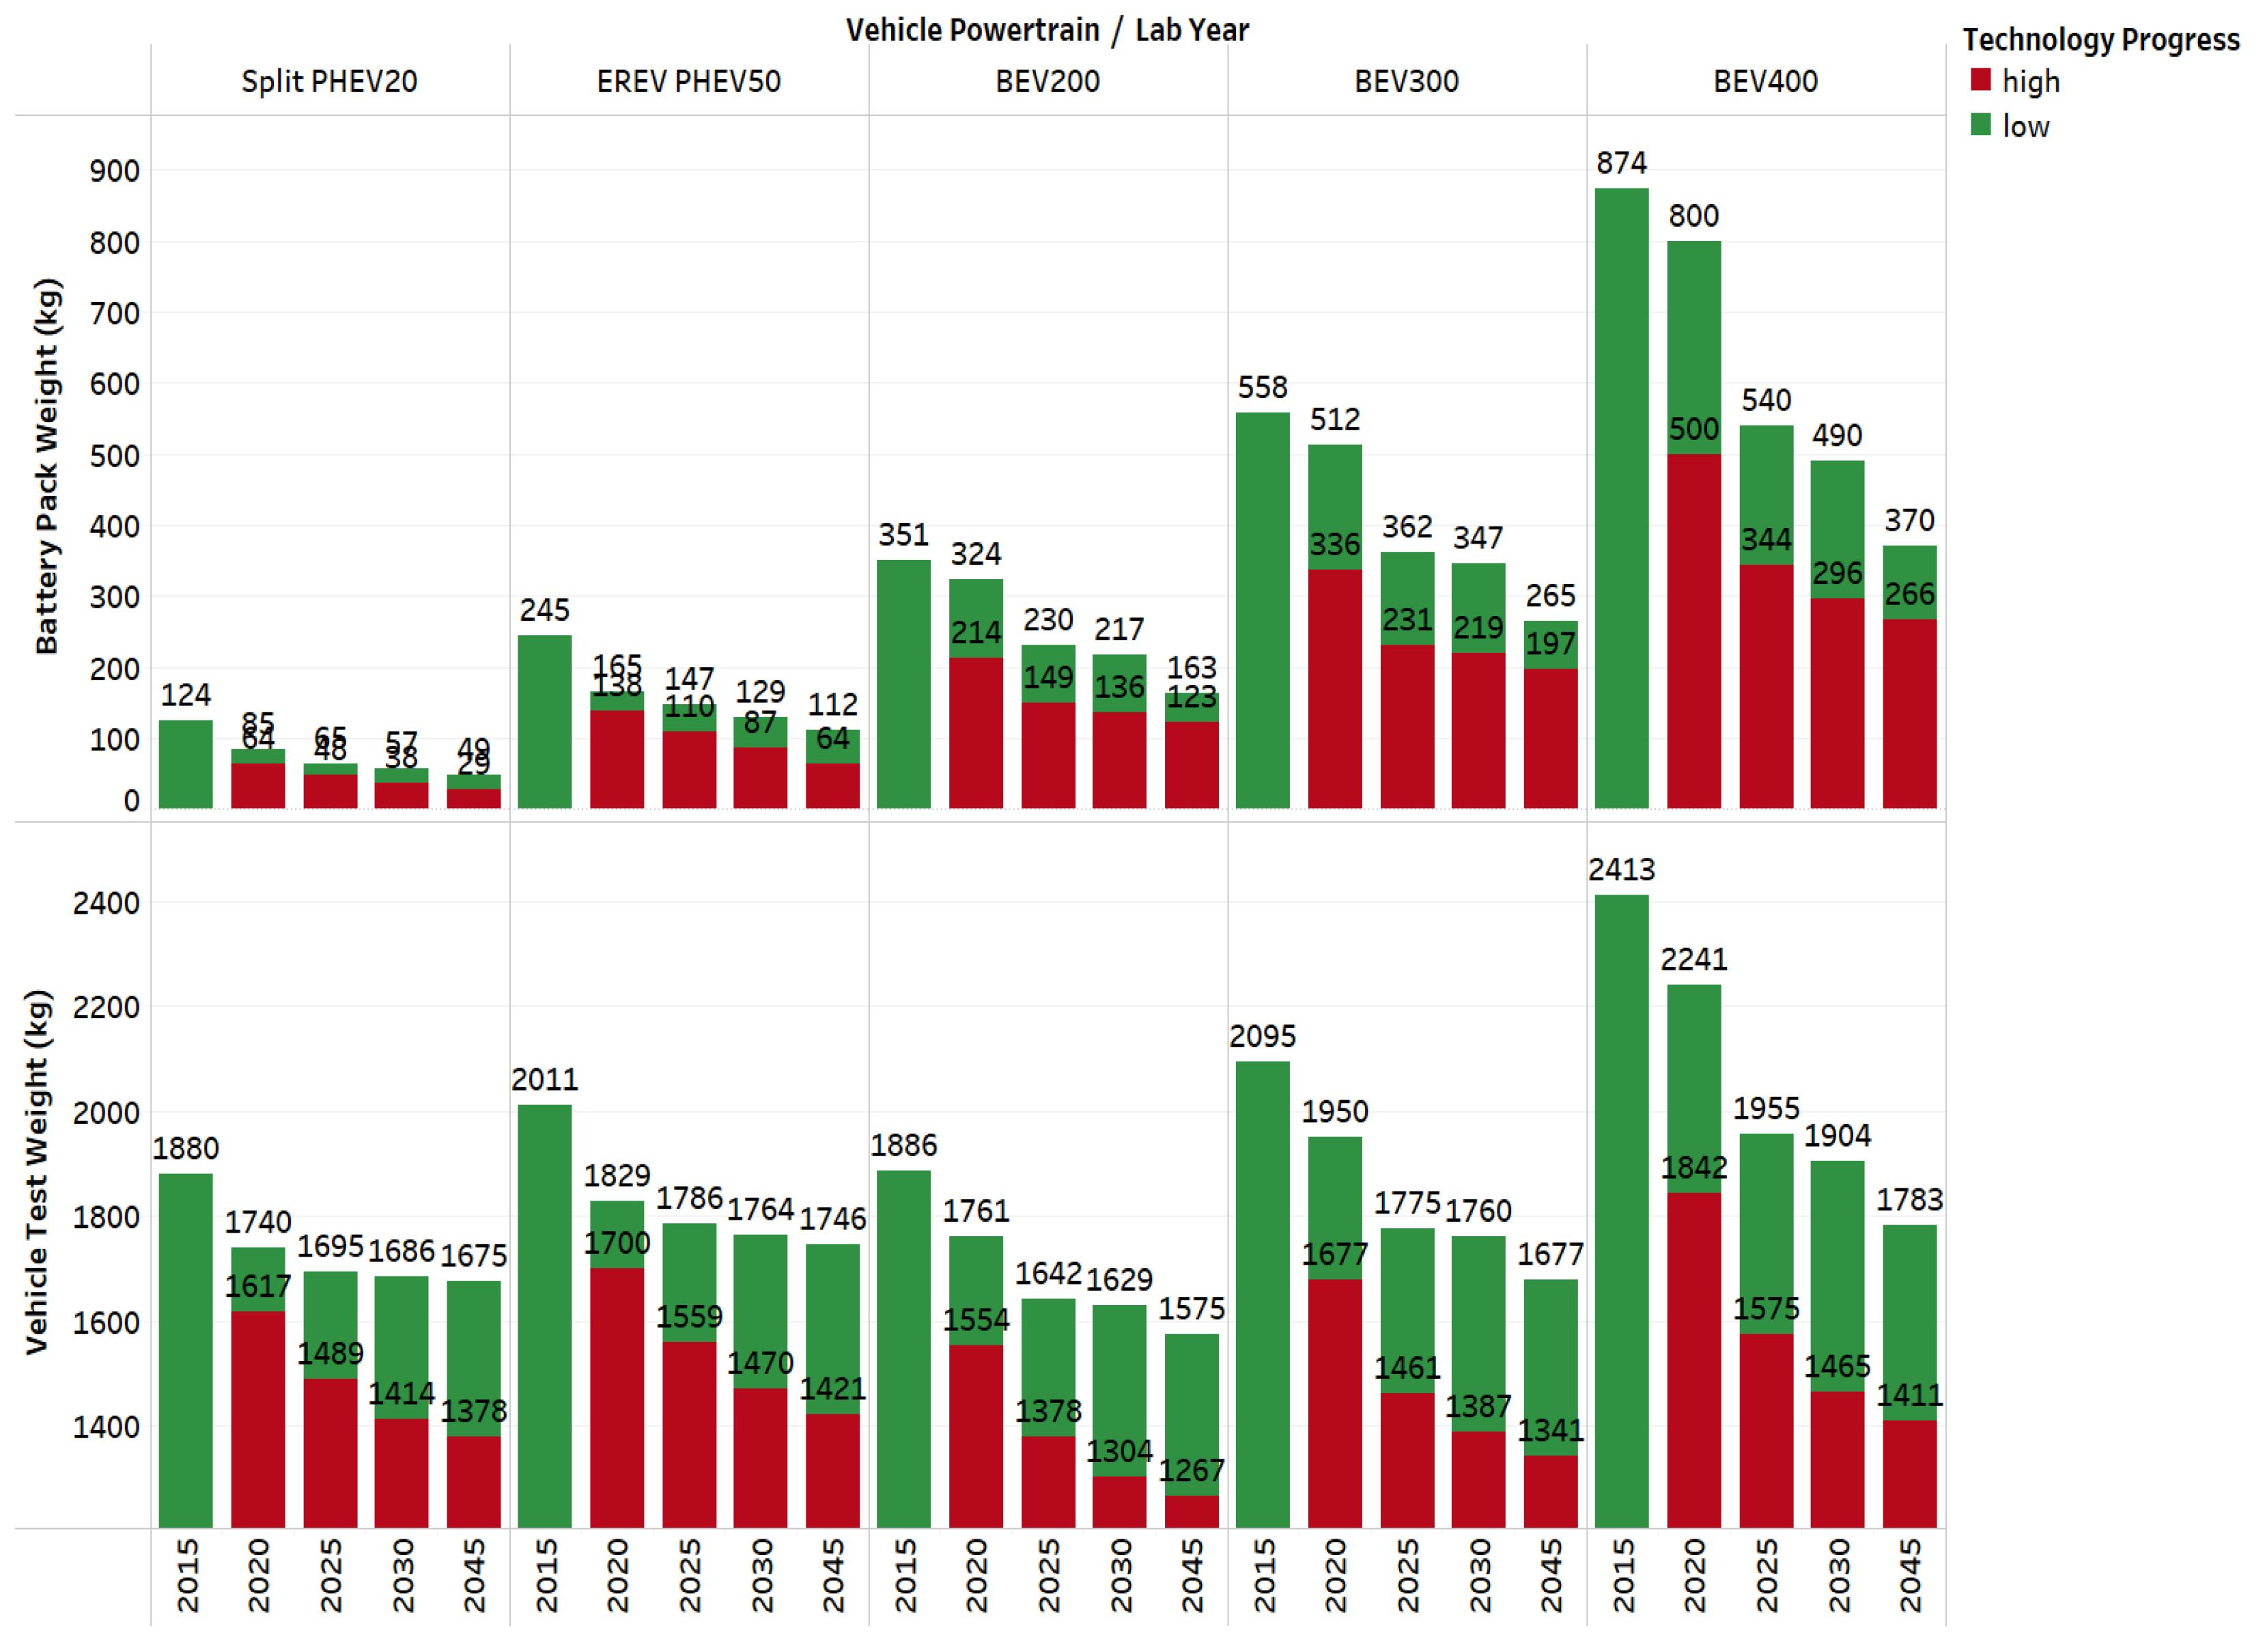
Figure 5 shows the battery and vehicle weights of midsize vehicles across the different electrified powertrains.
We can see that the battery pack weight decreases by almost 77% for split PHEV20s, 74% for EREV PHEV50s, and 65–70% for BEV 200/300/400 midsize vehicles. Vehicle weight is expected to decrease 26–42% across the different electrified vehicles. Due to advances in battery energy density, and other technology advances, we expect that the battery pack and the vehicle weights of the electrified vehicles will significantly decrease over time. With increasing battery energy density and vehicle lightweighting over time, the vehicle components results in smaller component sizes and weights and the compounding effects is observed in vehicle test weight reductions.
4.2. Battery Energy
Figure 6 shows the battery total energy for midsize vehicles across the different electrified powertrains.
We observed that the battery total energy requirement decreases significantly over time. For PHEVs, the battery pack total energy decreases by 33–50% for the 2045 laboratory year compared to the 2015 laboratory year. For BEV200s, the battery pack total energy decreases by 57% for 2045 laboratory year compared to the 2015 laboratory year. The decrease for the BEV400s approaches an 80% reduction in total battery pack energy. For high-range BEVs, the reduction is much greater due to the combined effects of advances in vehicle technology. The explanation for such observation is that, as different vehicle components improve over time, the different performance requirements (EV range, etc.) results in lower component sizes (battery energy, etc.).
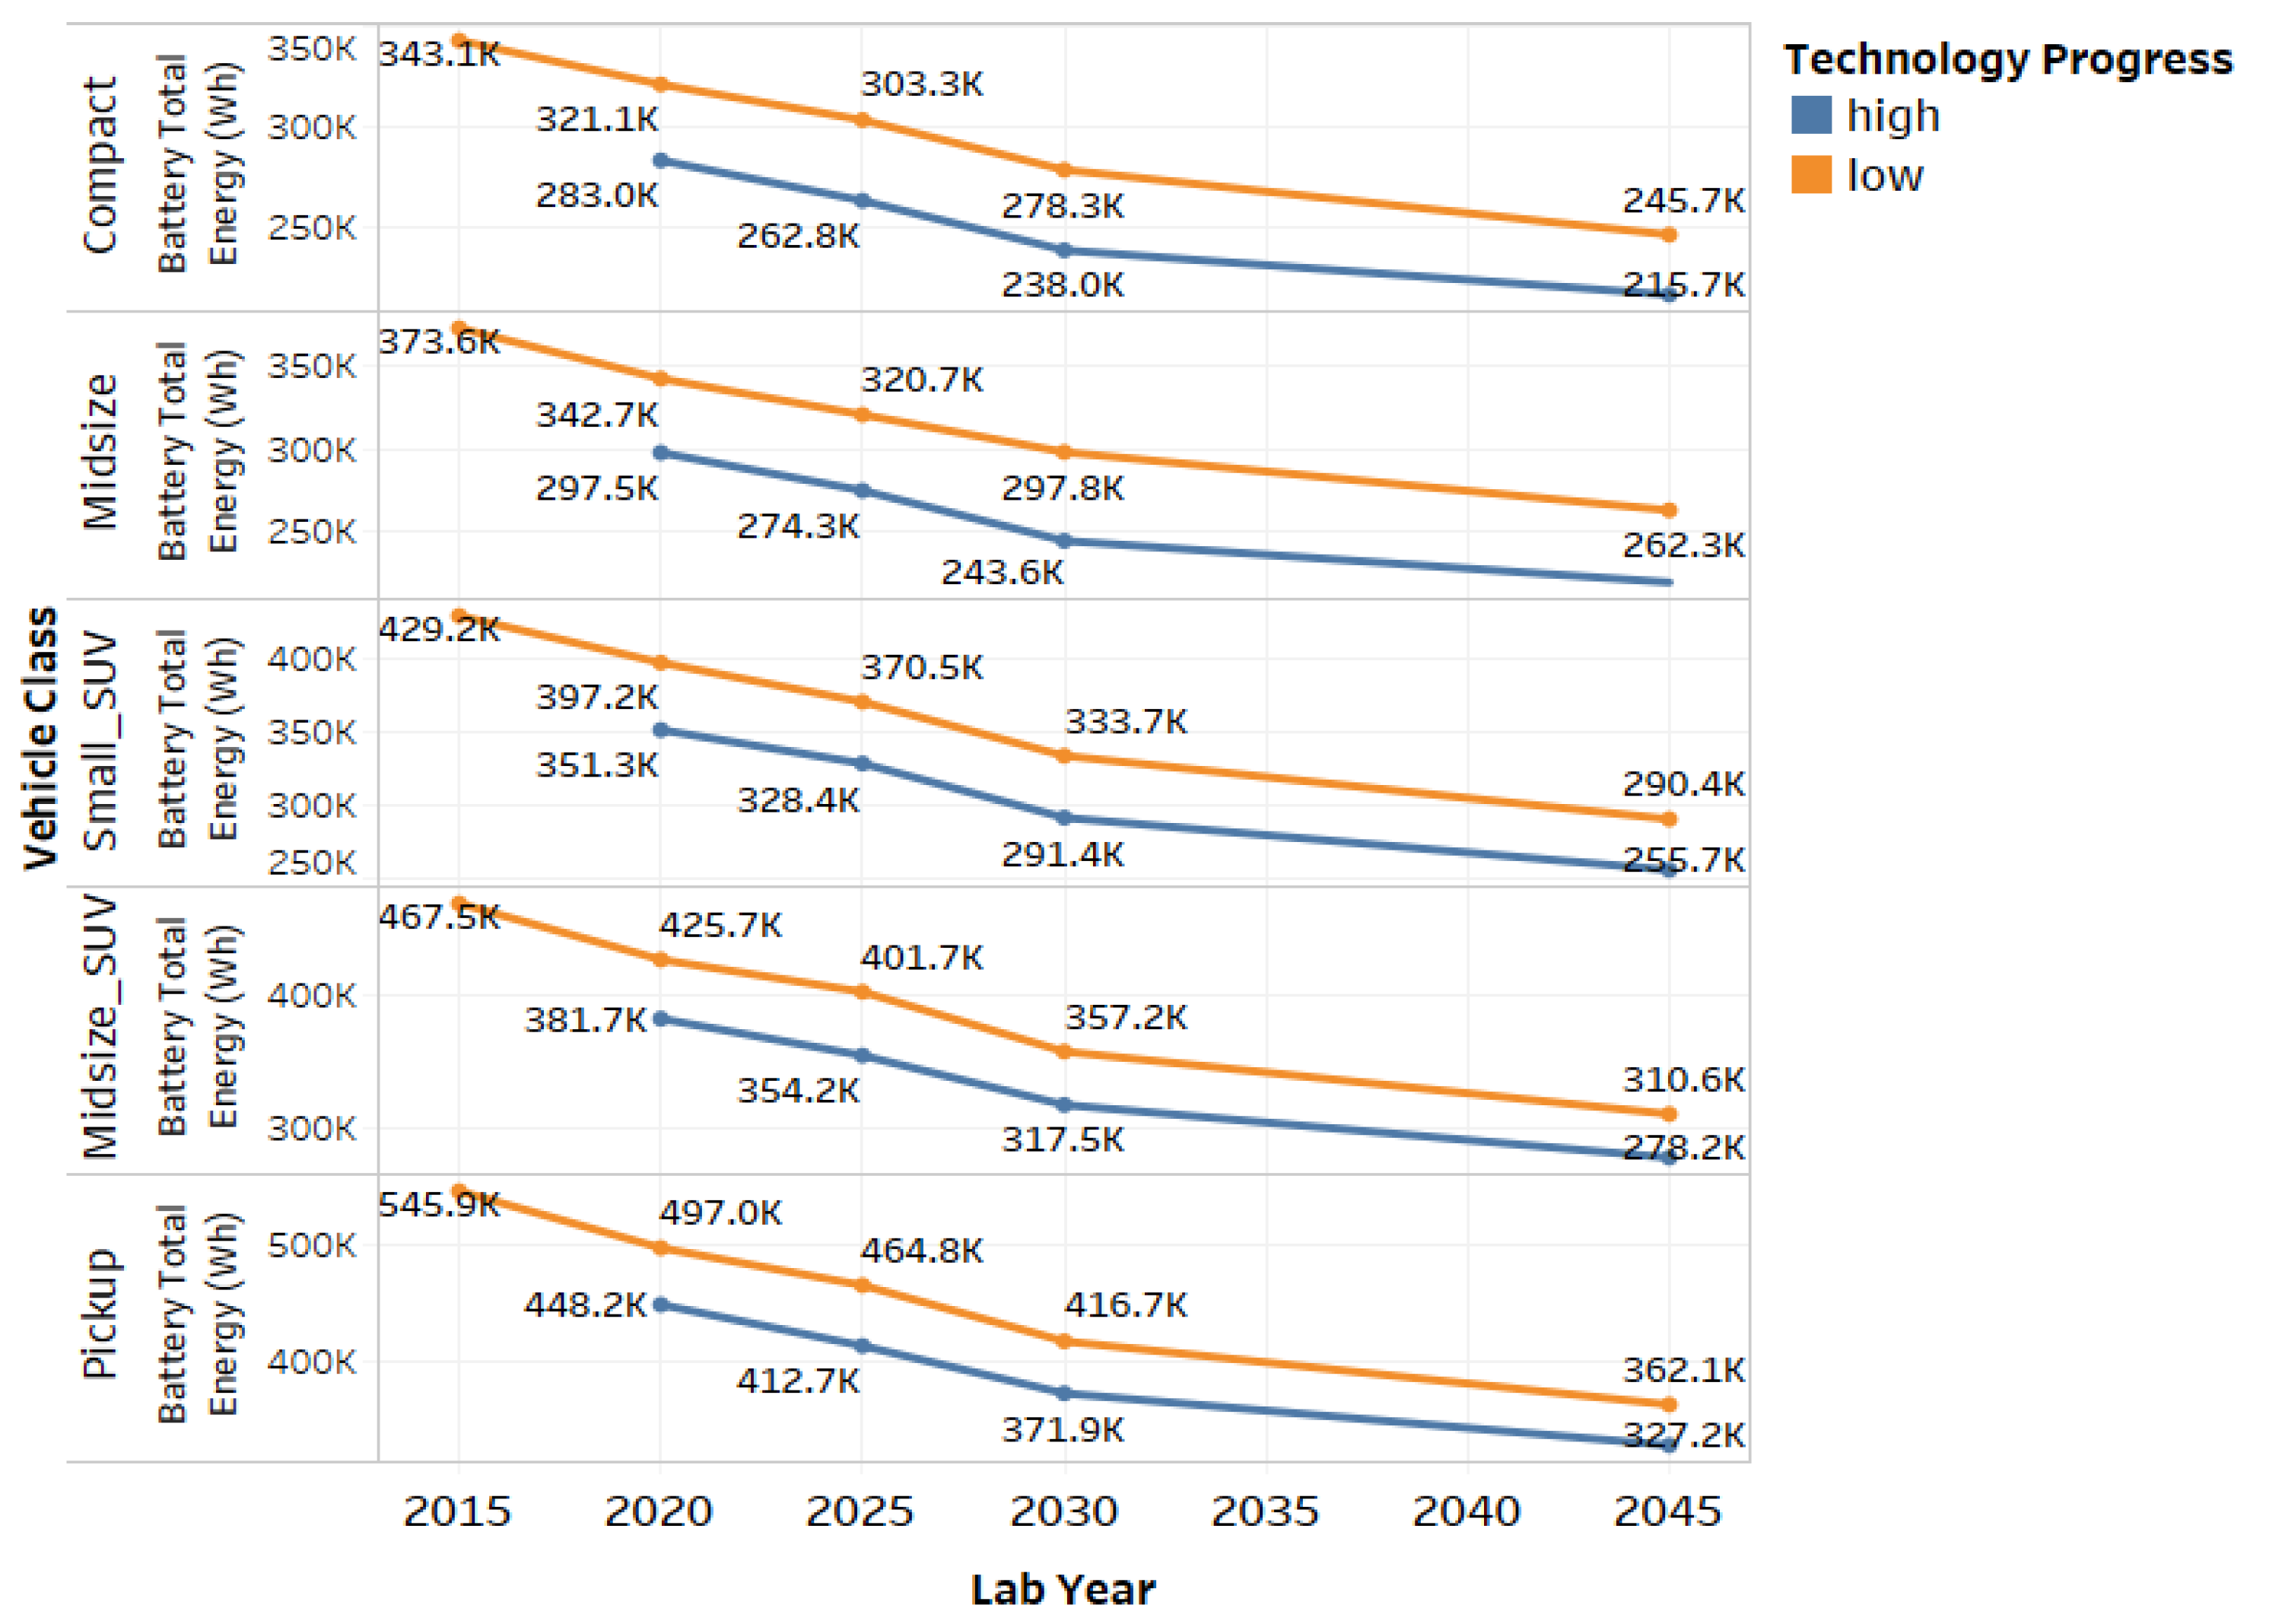
Figure 7 shows the impact of the sum of the total battery energy for the different electrified powertrains and vehicle classes modeled. The analysis is shown across the different laboratory years and technology progresses.
The Figure shows the impact of advanced VTO targets on reducing the total battery energy requirements across the different vehicle classes, and is consistent with the observation from a midsize vehicle class. Across vehicle classes, the different vehicle parameters varies but the impact of vehicle lightweighting, advances in battery energy density, etc. are consistent across vehicle classes.
4.3. Battery Material Contents
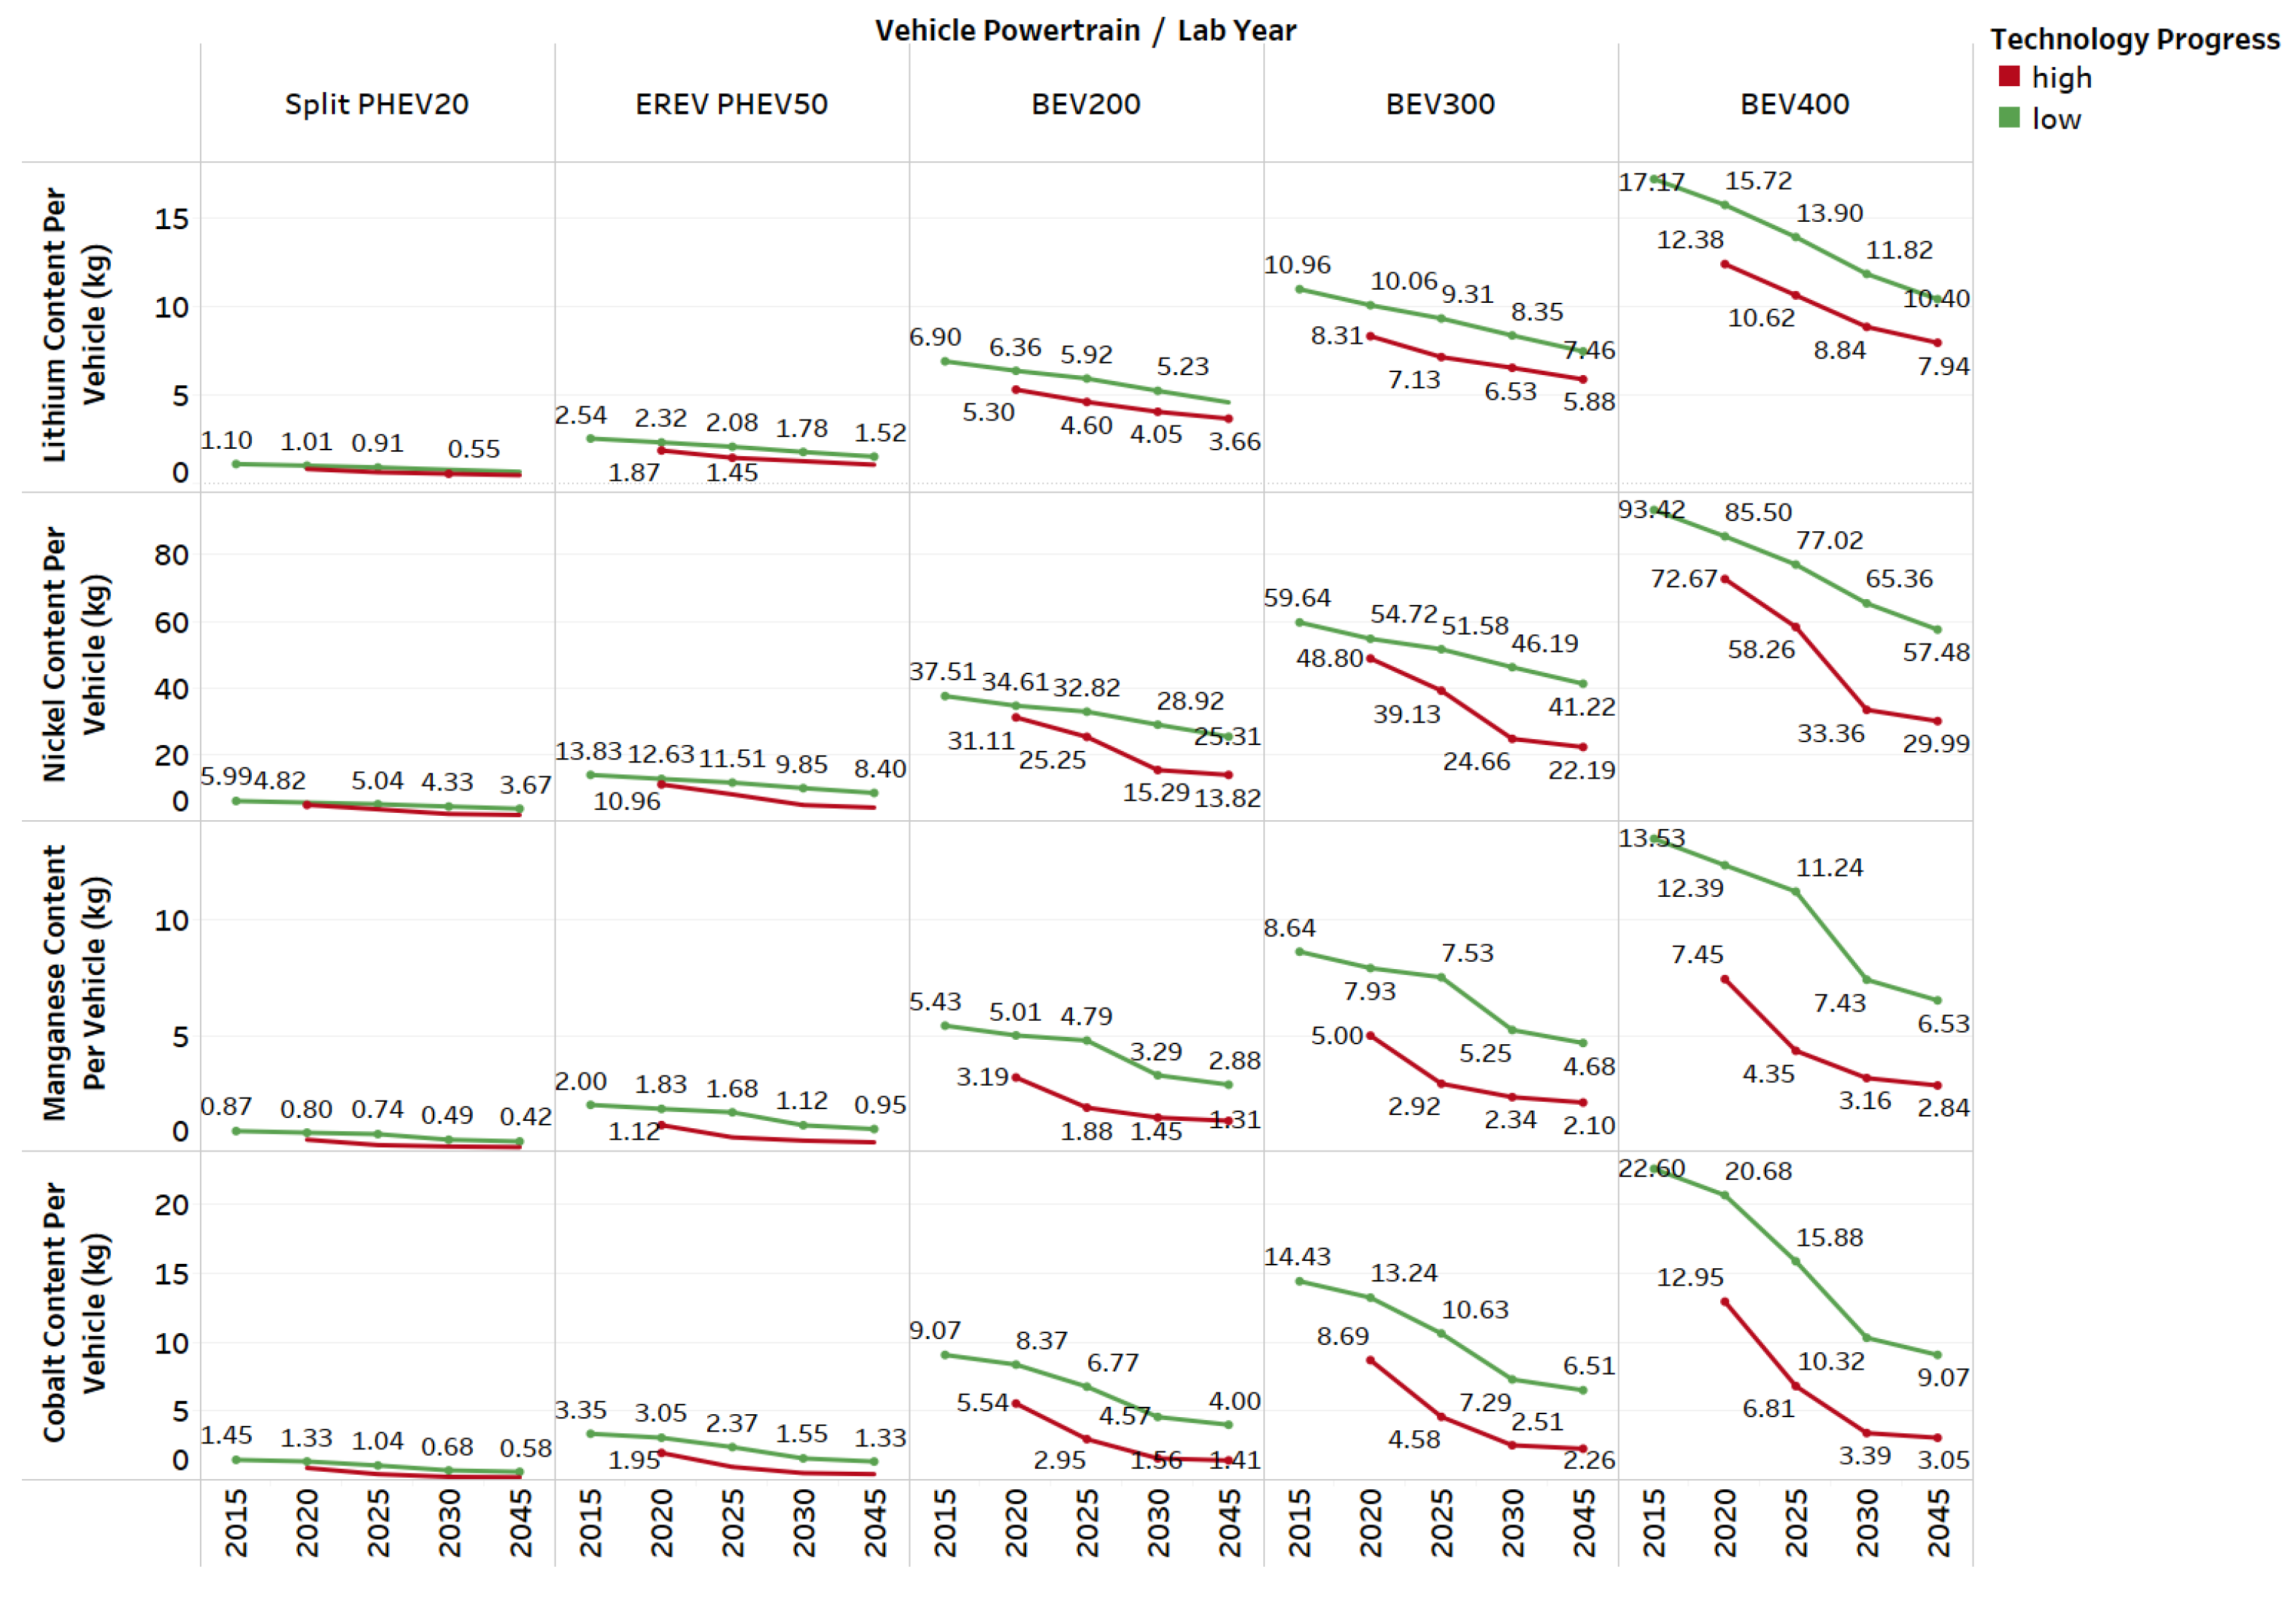
Figure 8 illustrates the different battery material content per vehicle across the different electrified powertrains of a midsize vehicle class.
We can see that, because the advancement of technologies leading to reduced battery energy requirements over time and because of the advanced penetration of battery chemistries, the various material contents decrease over time across the different powertrains.
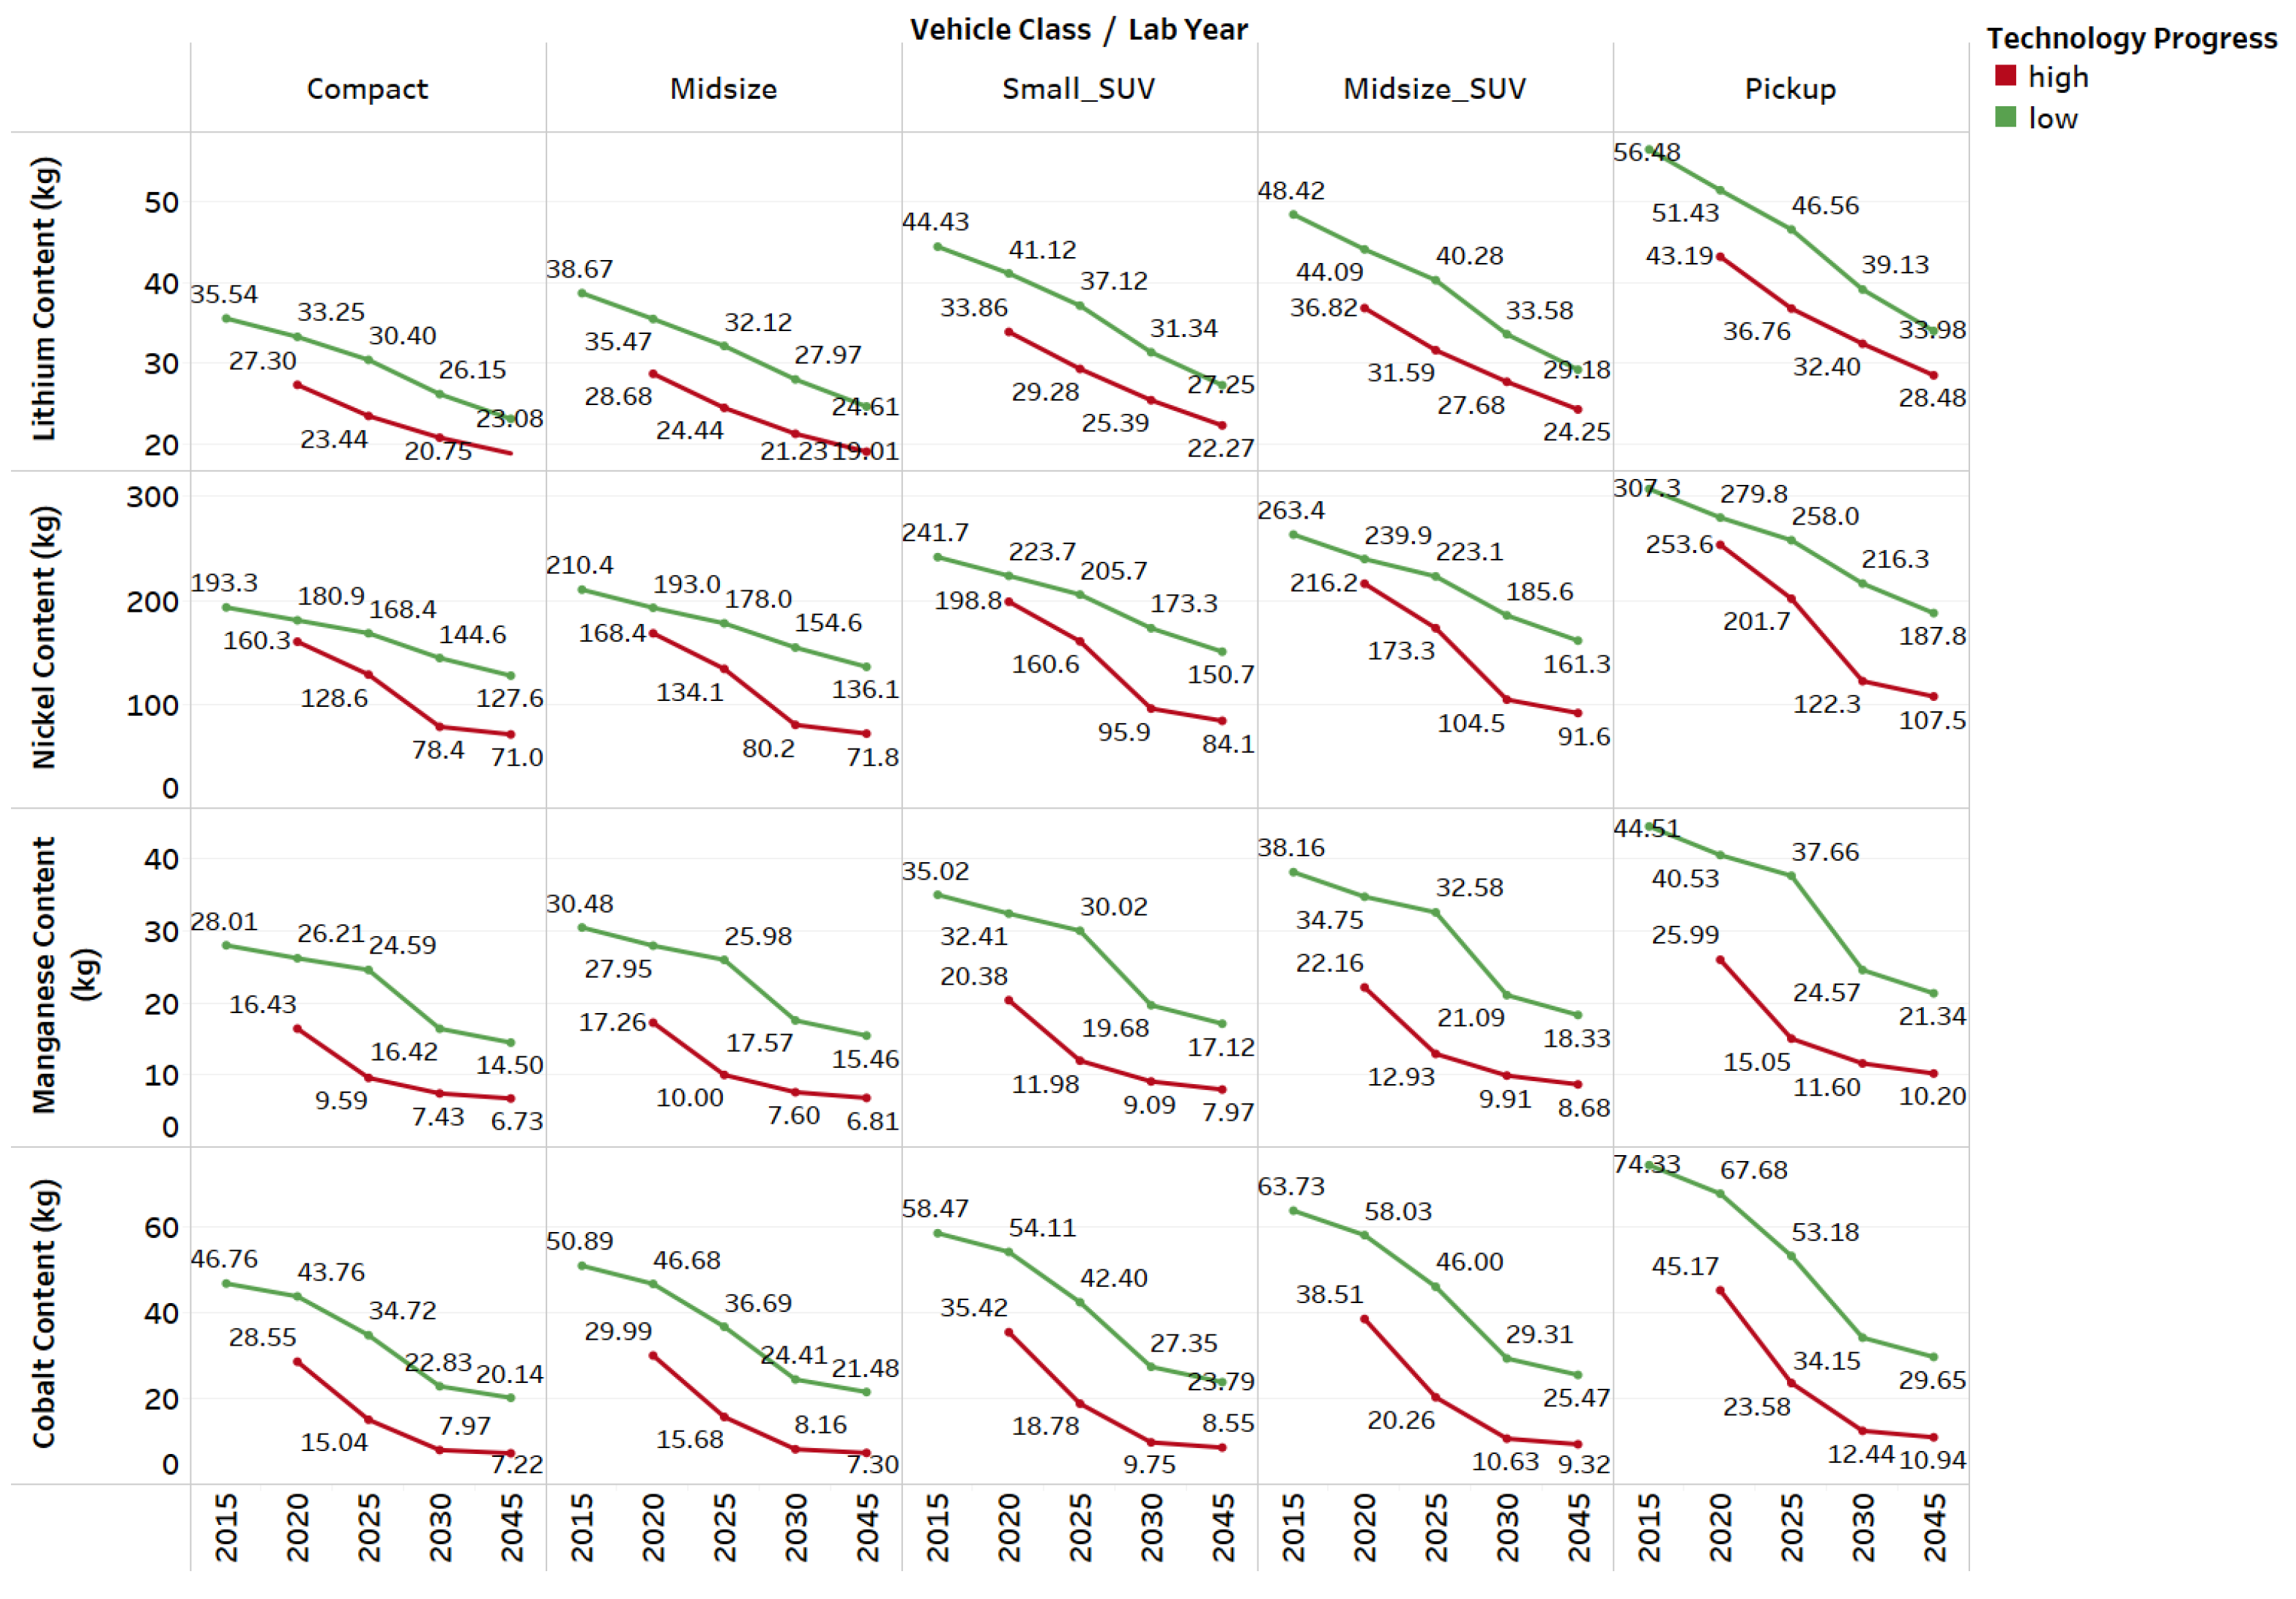
Figure 9 illustrates the sum of different battery material contents across the different vehicle classes. It shows that similar effects are also observed when performing the analysis across vehicle classes.
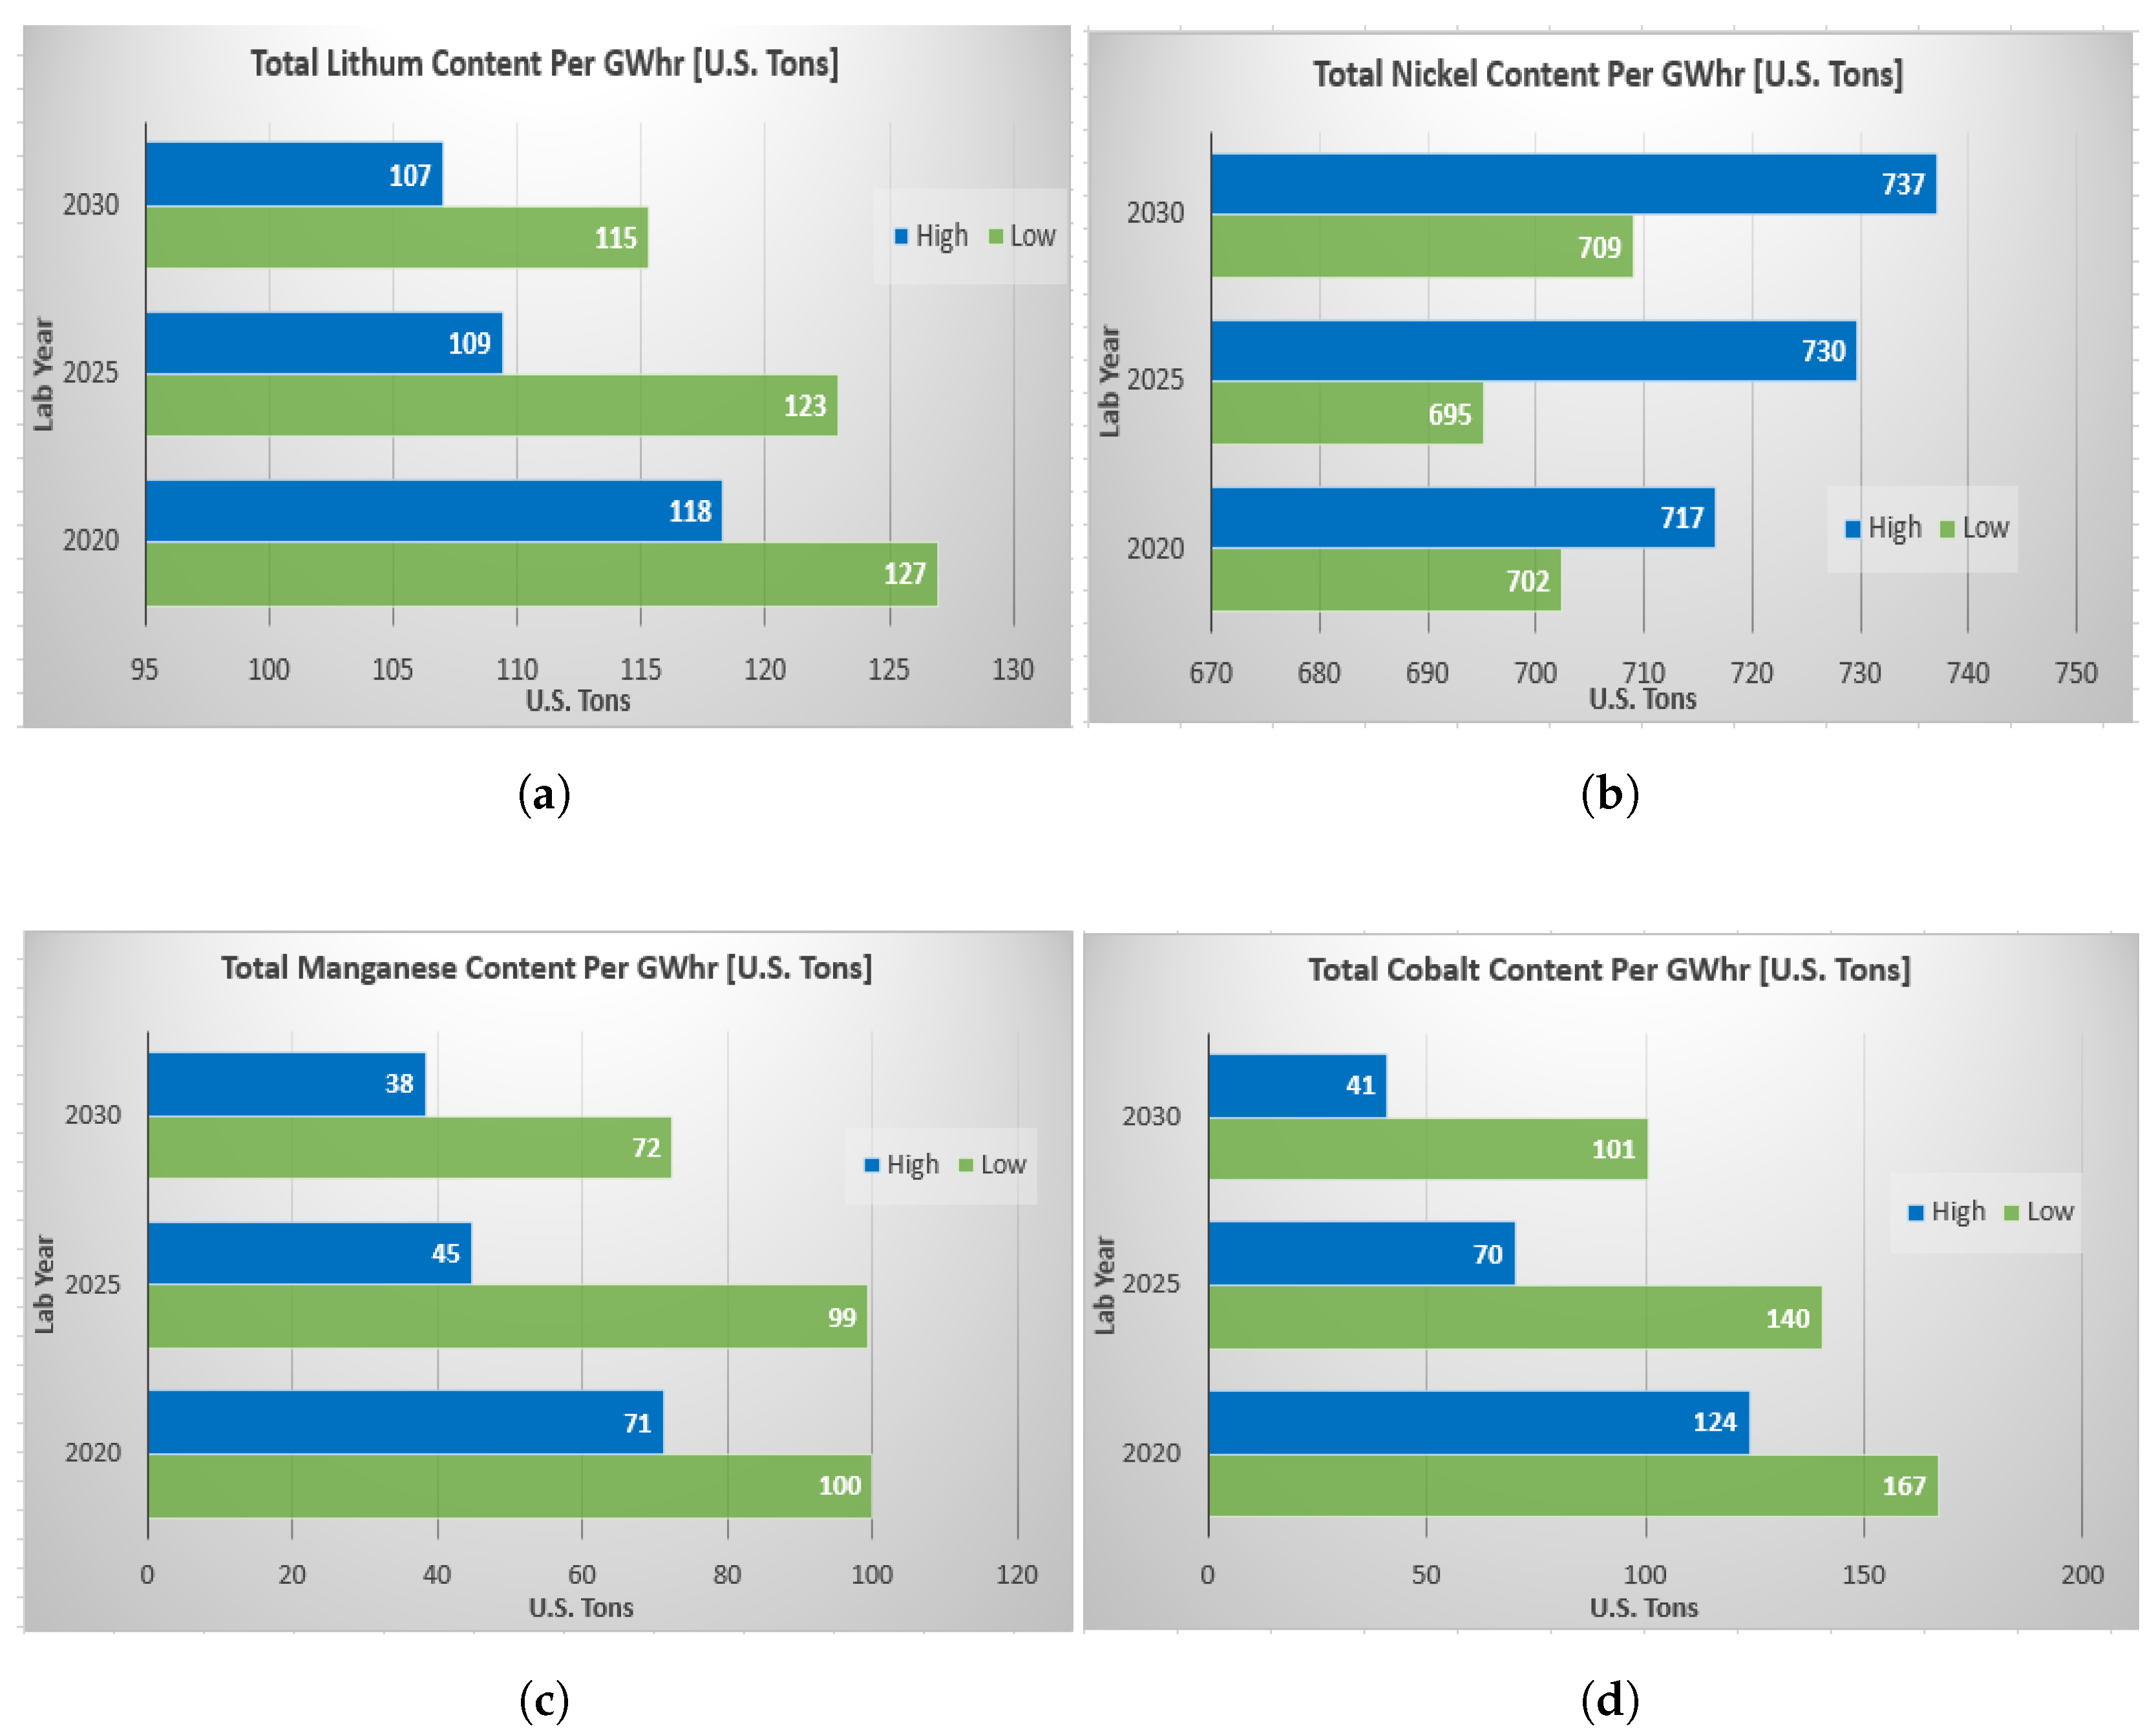
Using the assumed penetrations of the different battery cell chemistries across different laboratory years, when the sum of material contents is scaled to a total energy requirement of per GWh, Figure 10 shows the impact of VTO battery technology advances for different material demands per GWh.
It can be observed that the per-GWh contents of lithium, nickel, manganese, and cobalt contents decreases significantly over time, due to advances in battery technologies and penetration of advanced cell cathode chemistries.
4.4. United States Demand
Assuming there are 17 million new vehicle sales in the U.S. market every year [15], the appropriate market penetrations described in Chapter 3.3 have been adopted for the different vehicle powertrains and classes.
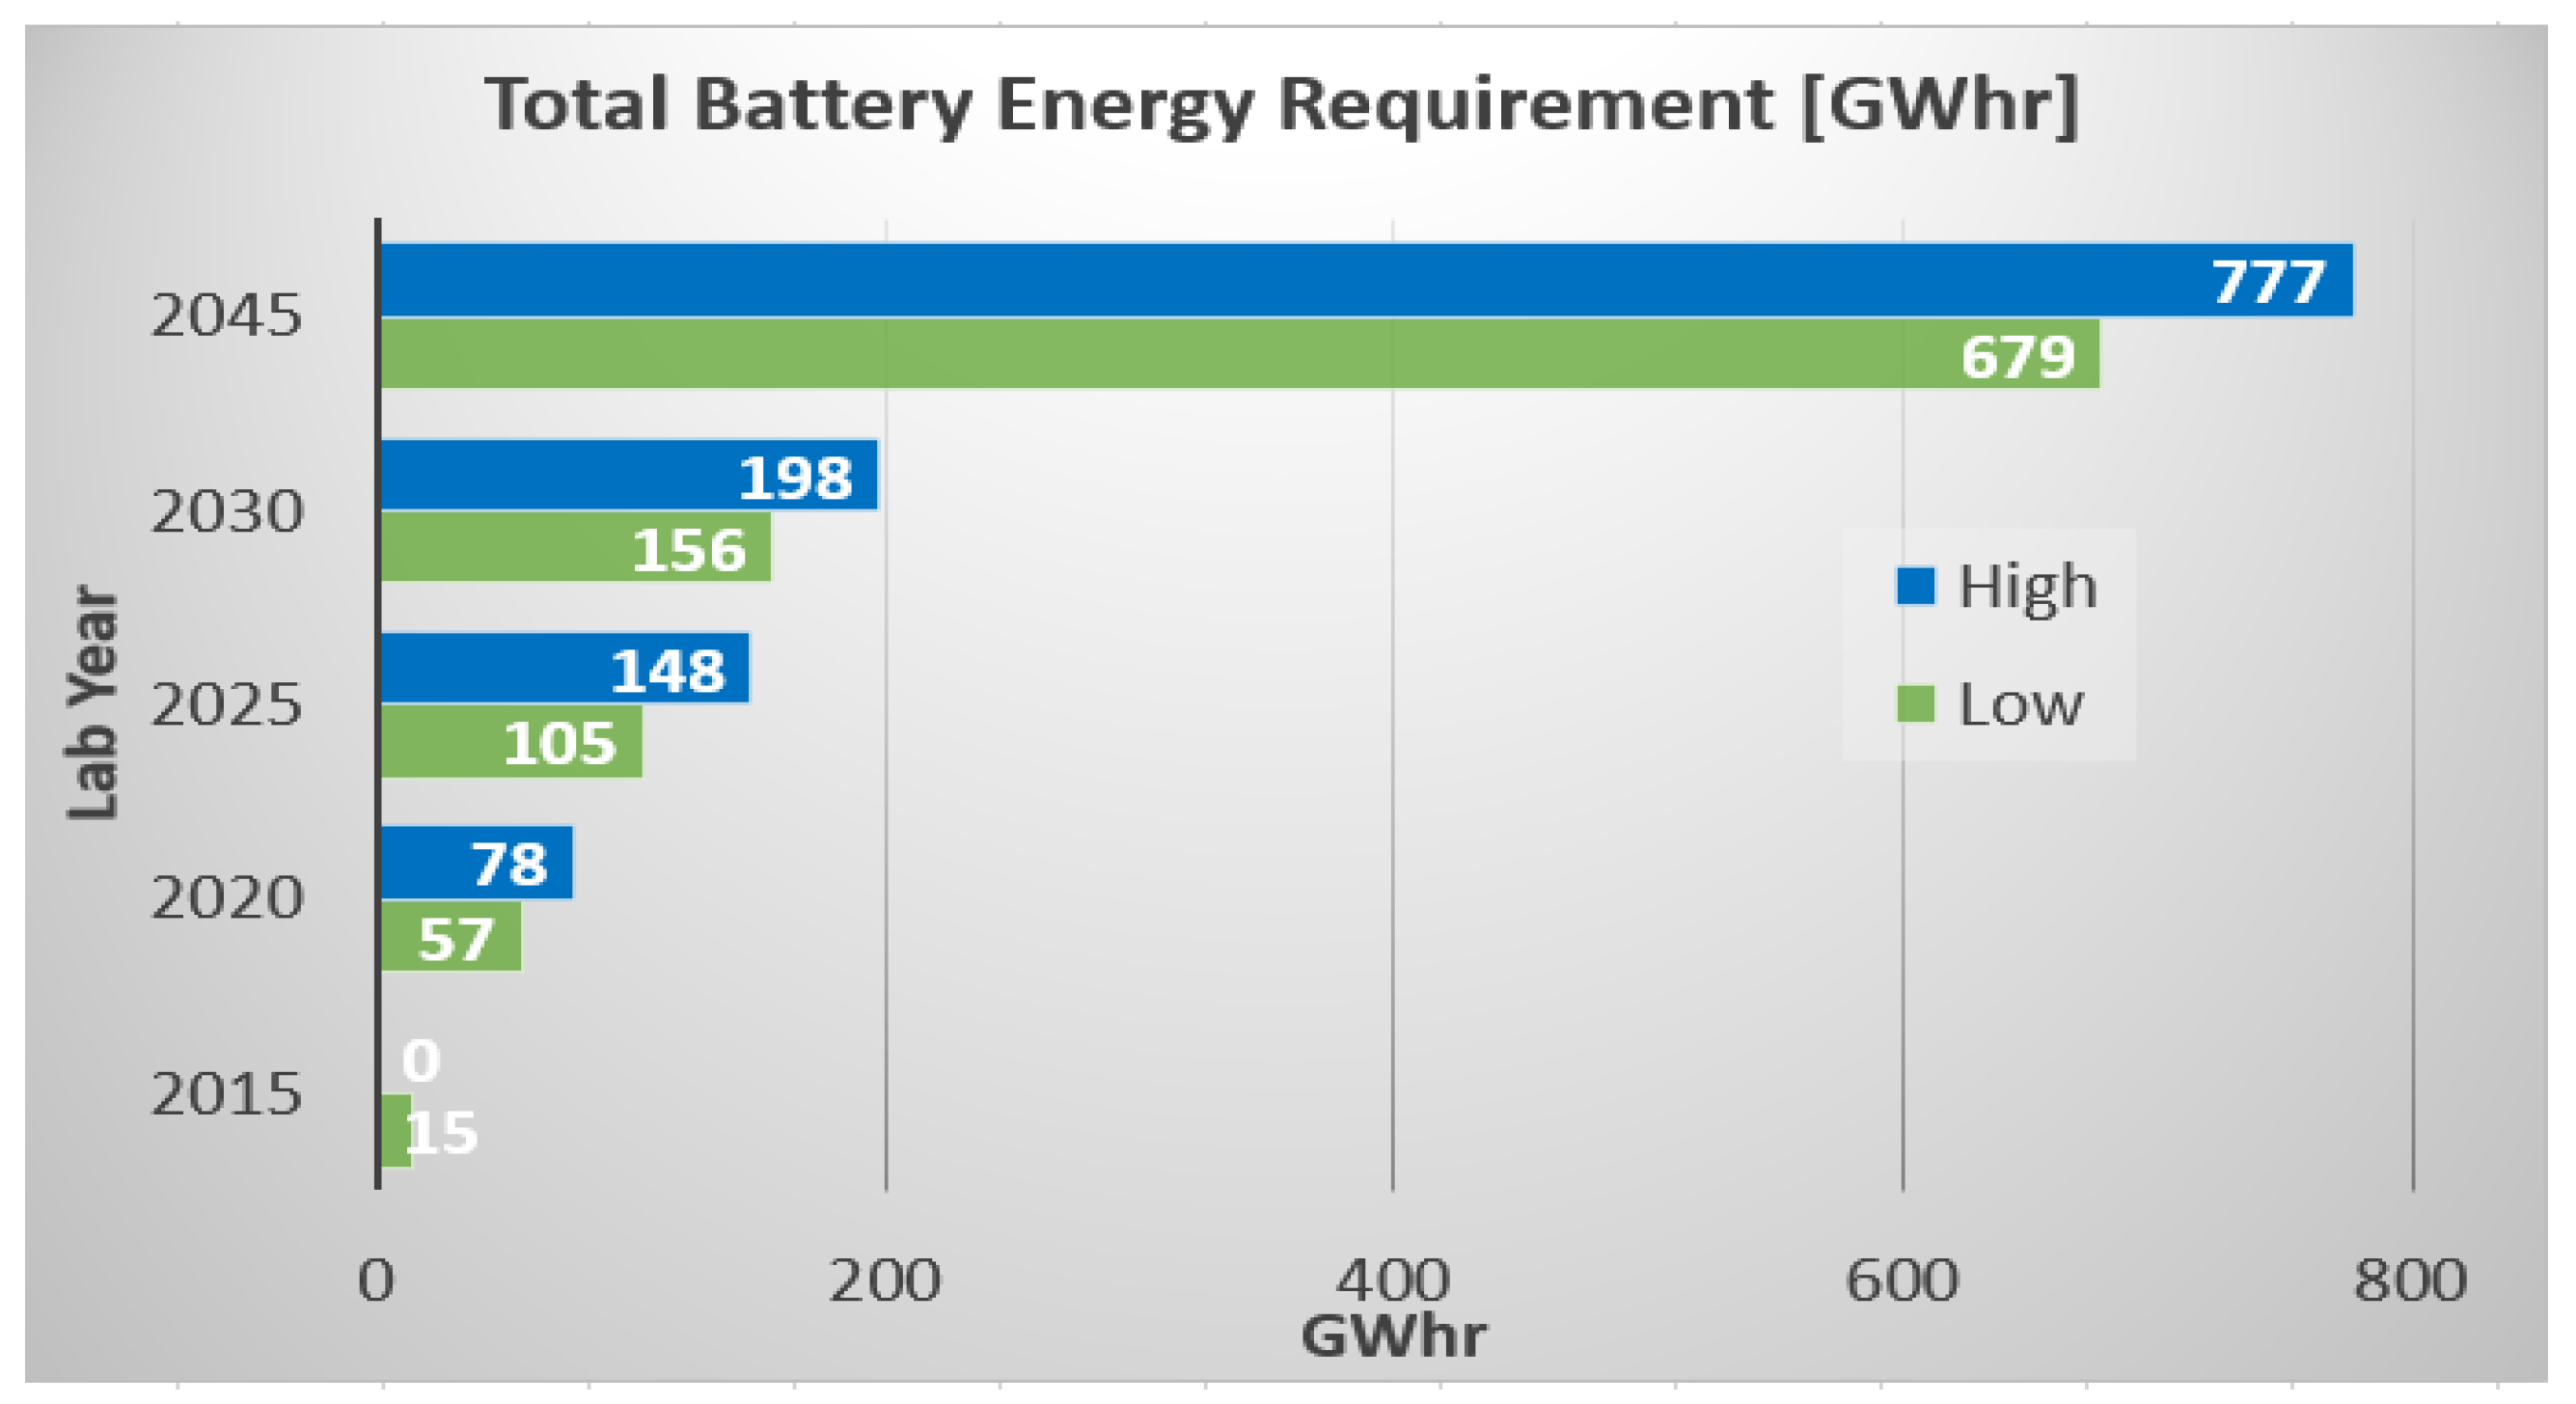
Figure 11 illustrates the total battery energy requirement across the different years using our market penetration assumptions.
The Figure shows that over time, we expect total battery energy requirements to increase significantly, due to the high penetration of electrified vehicles in the future. The current total battery requirements from this analysis align well with the status of today’s market [16].
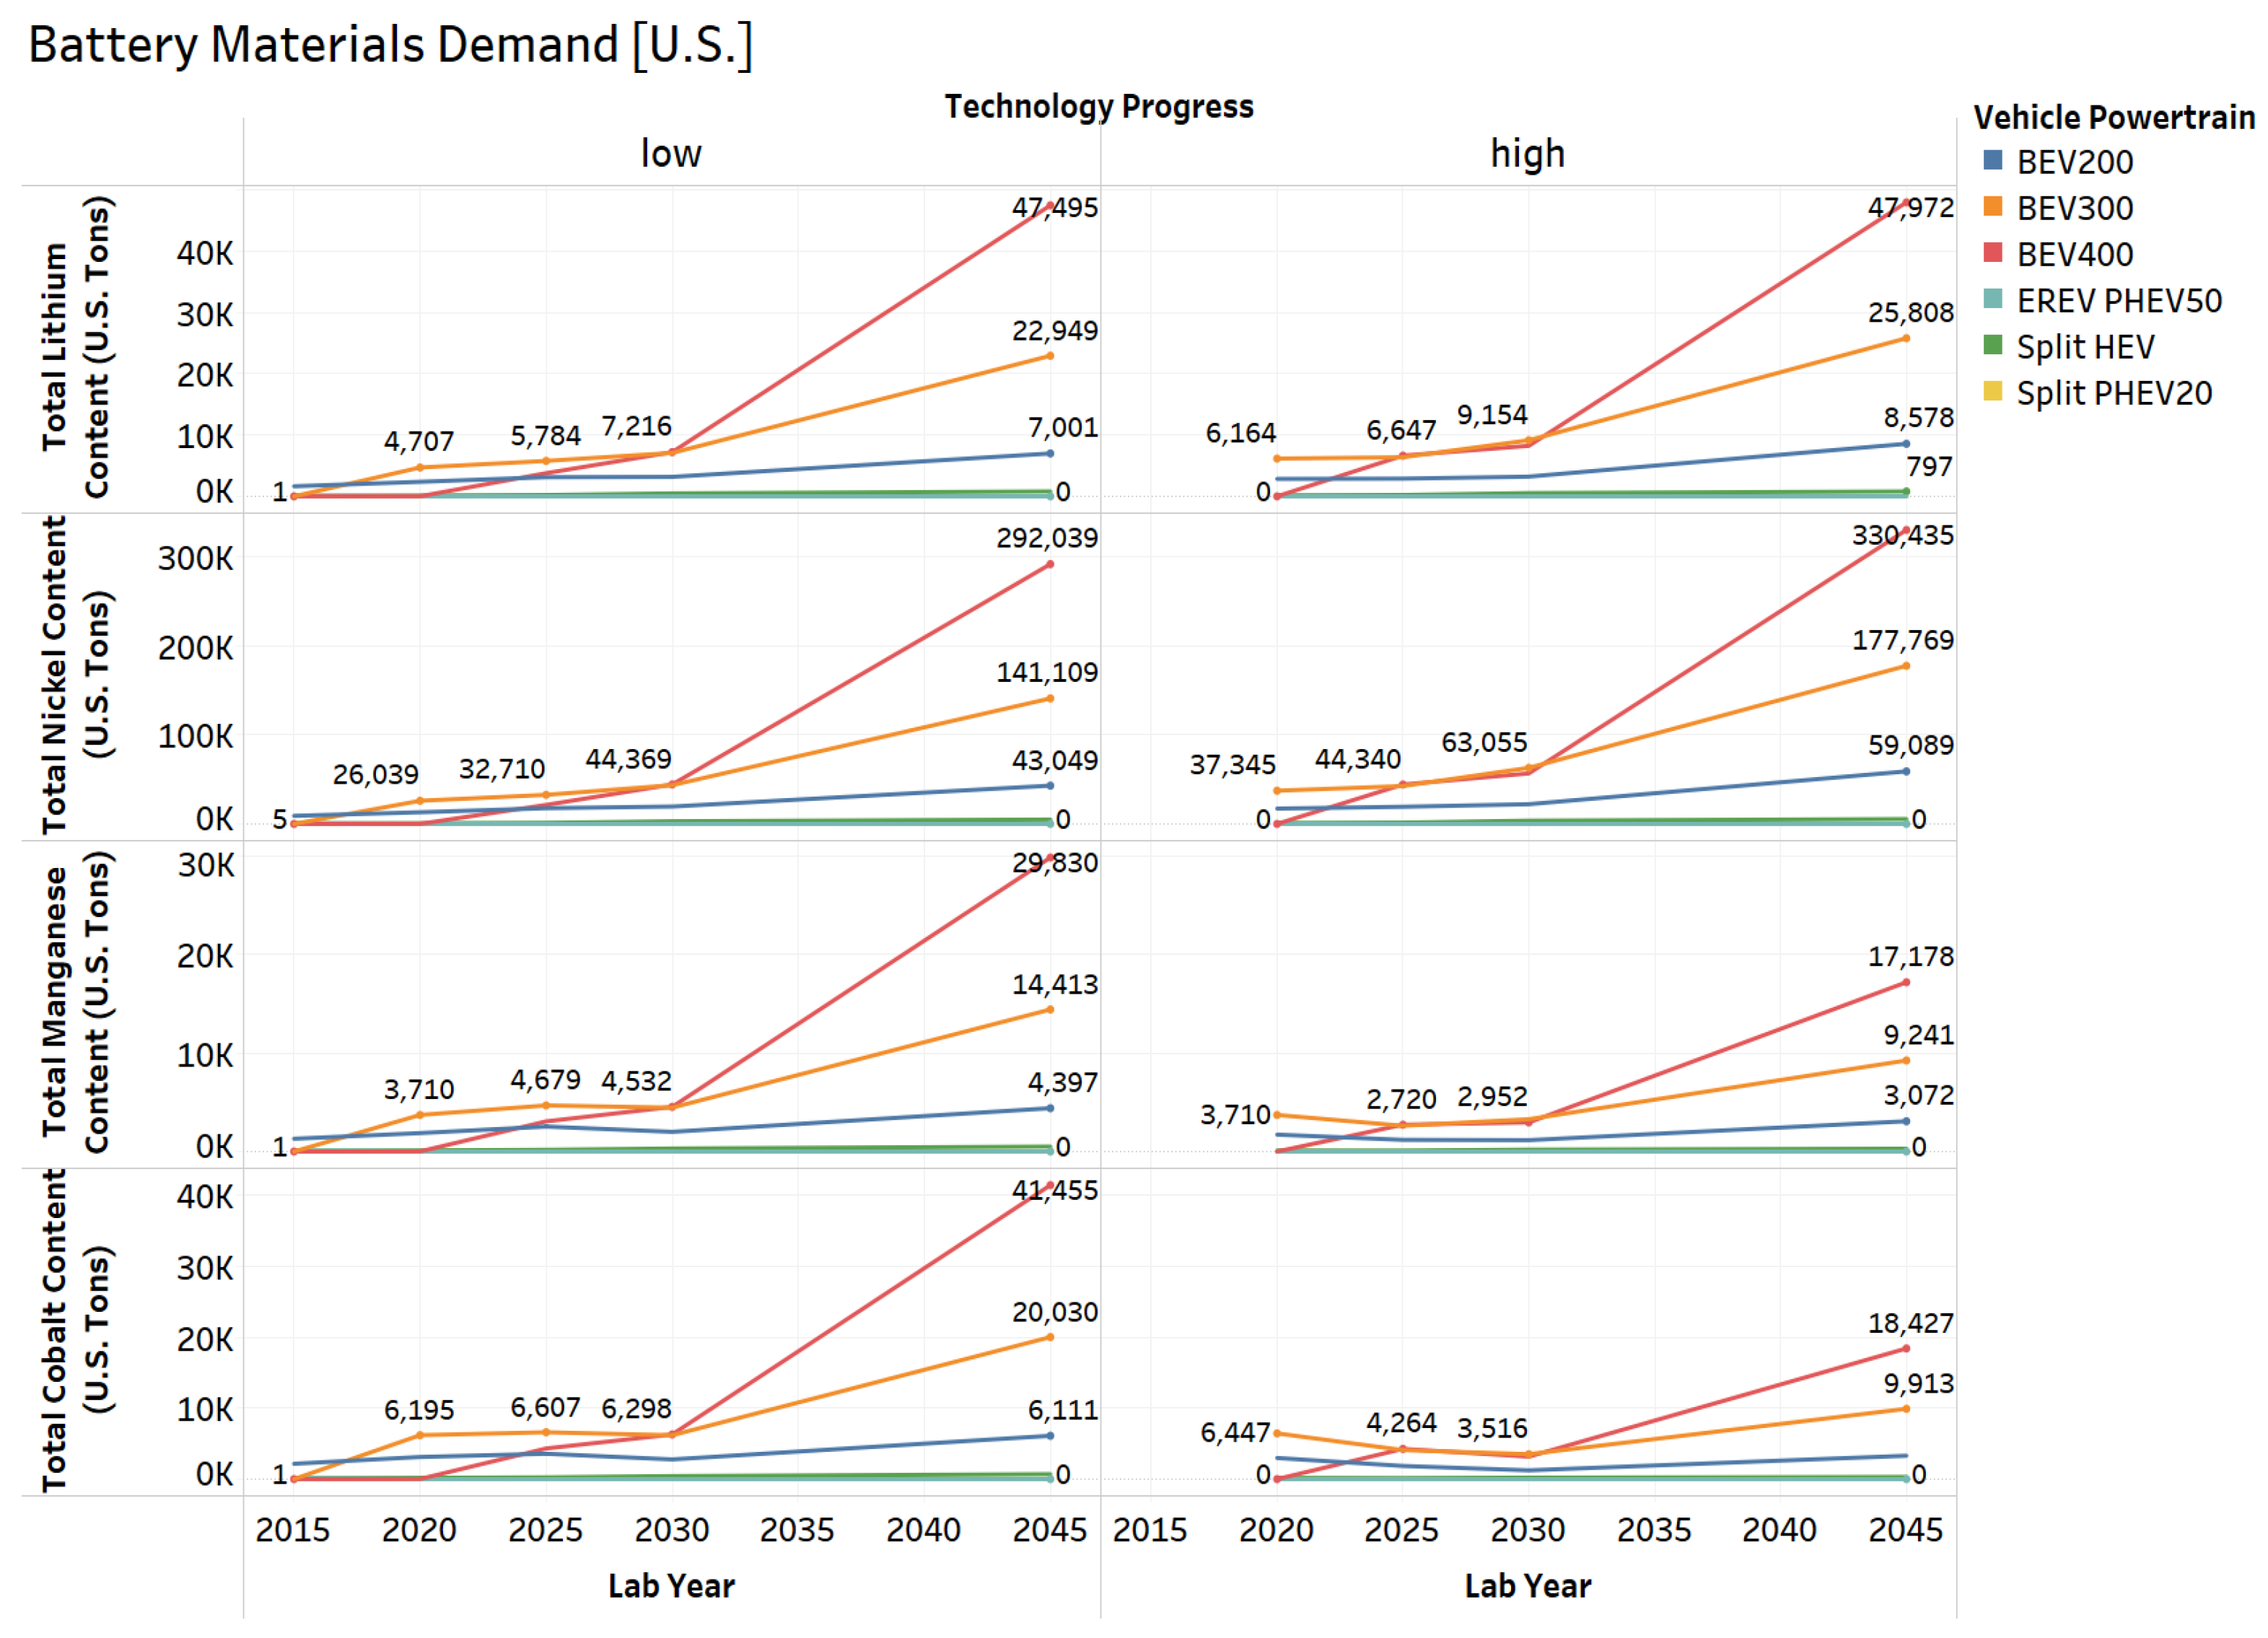
Figure 12 illustrates the total annual demand of different battery materials for U.S. across the vehicle powertrains modeled.
We observe that there is an increase in the various material contents by laboratory year 2045. This is driven by the increased penetration of electrified vehicles across laboratory years, even though the battery energy requirements decrease due to technology advancements. We further observe that with increasing AERs, the demand for material increases due to higher energy requirements.
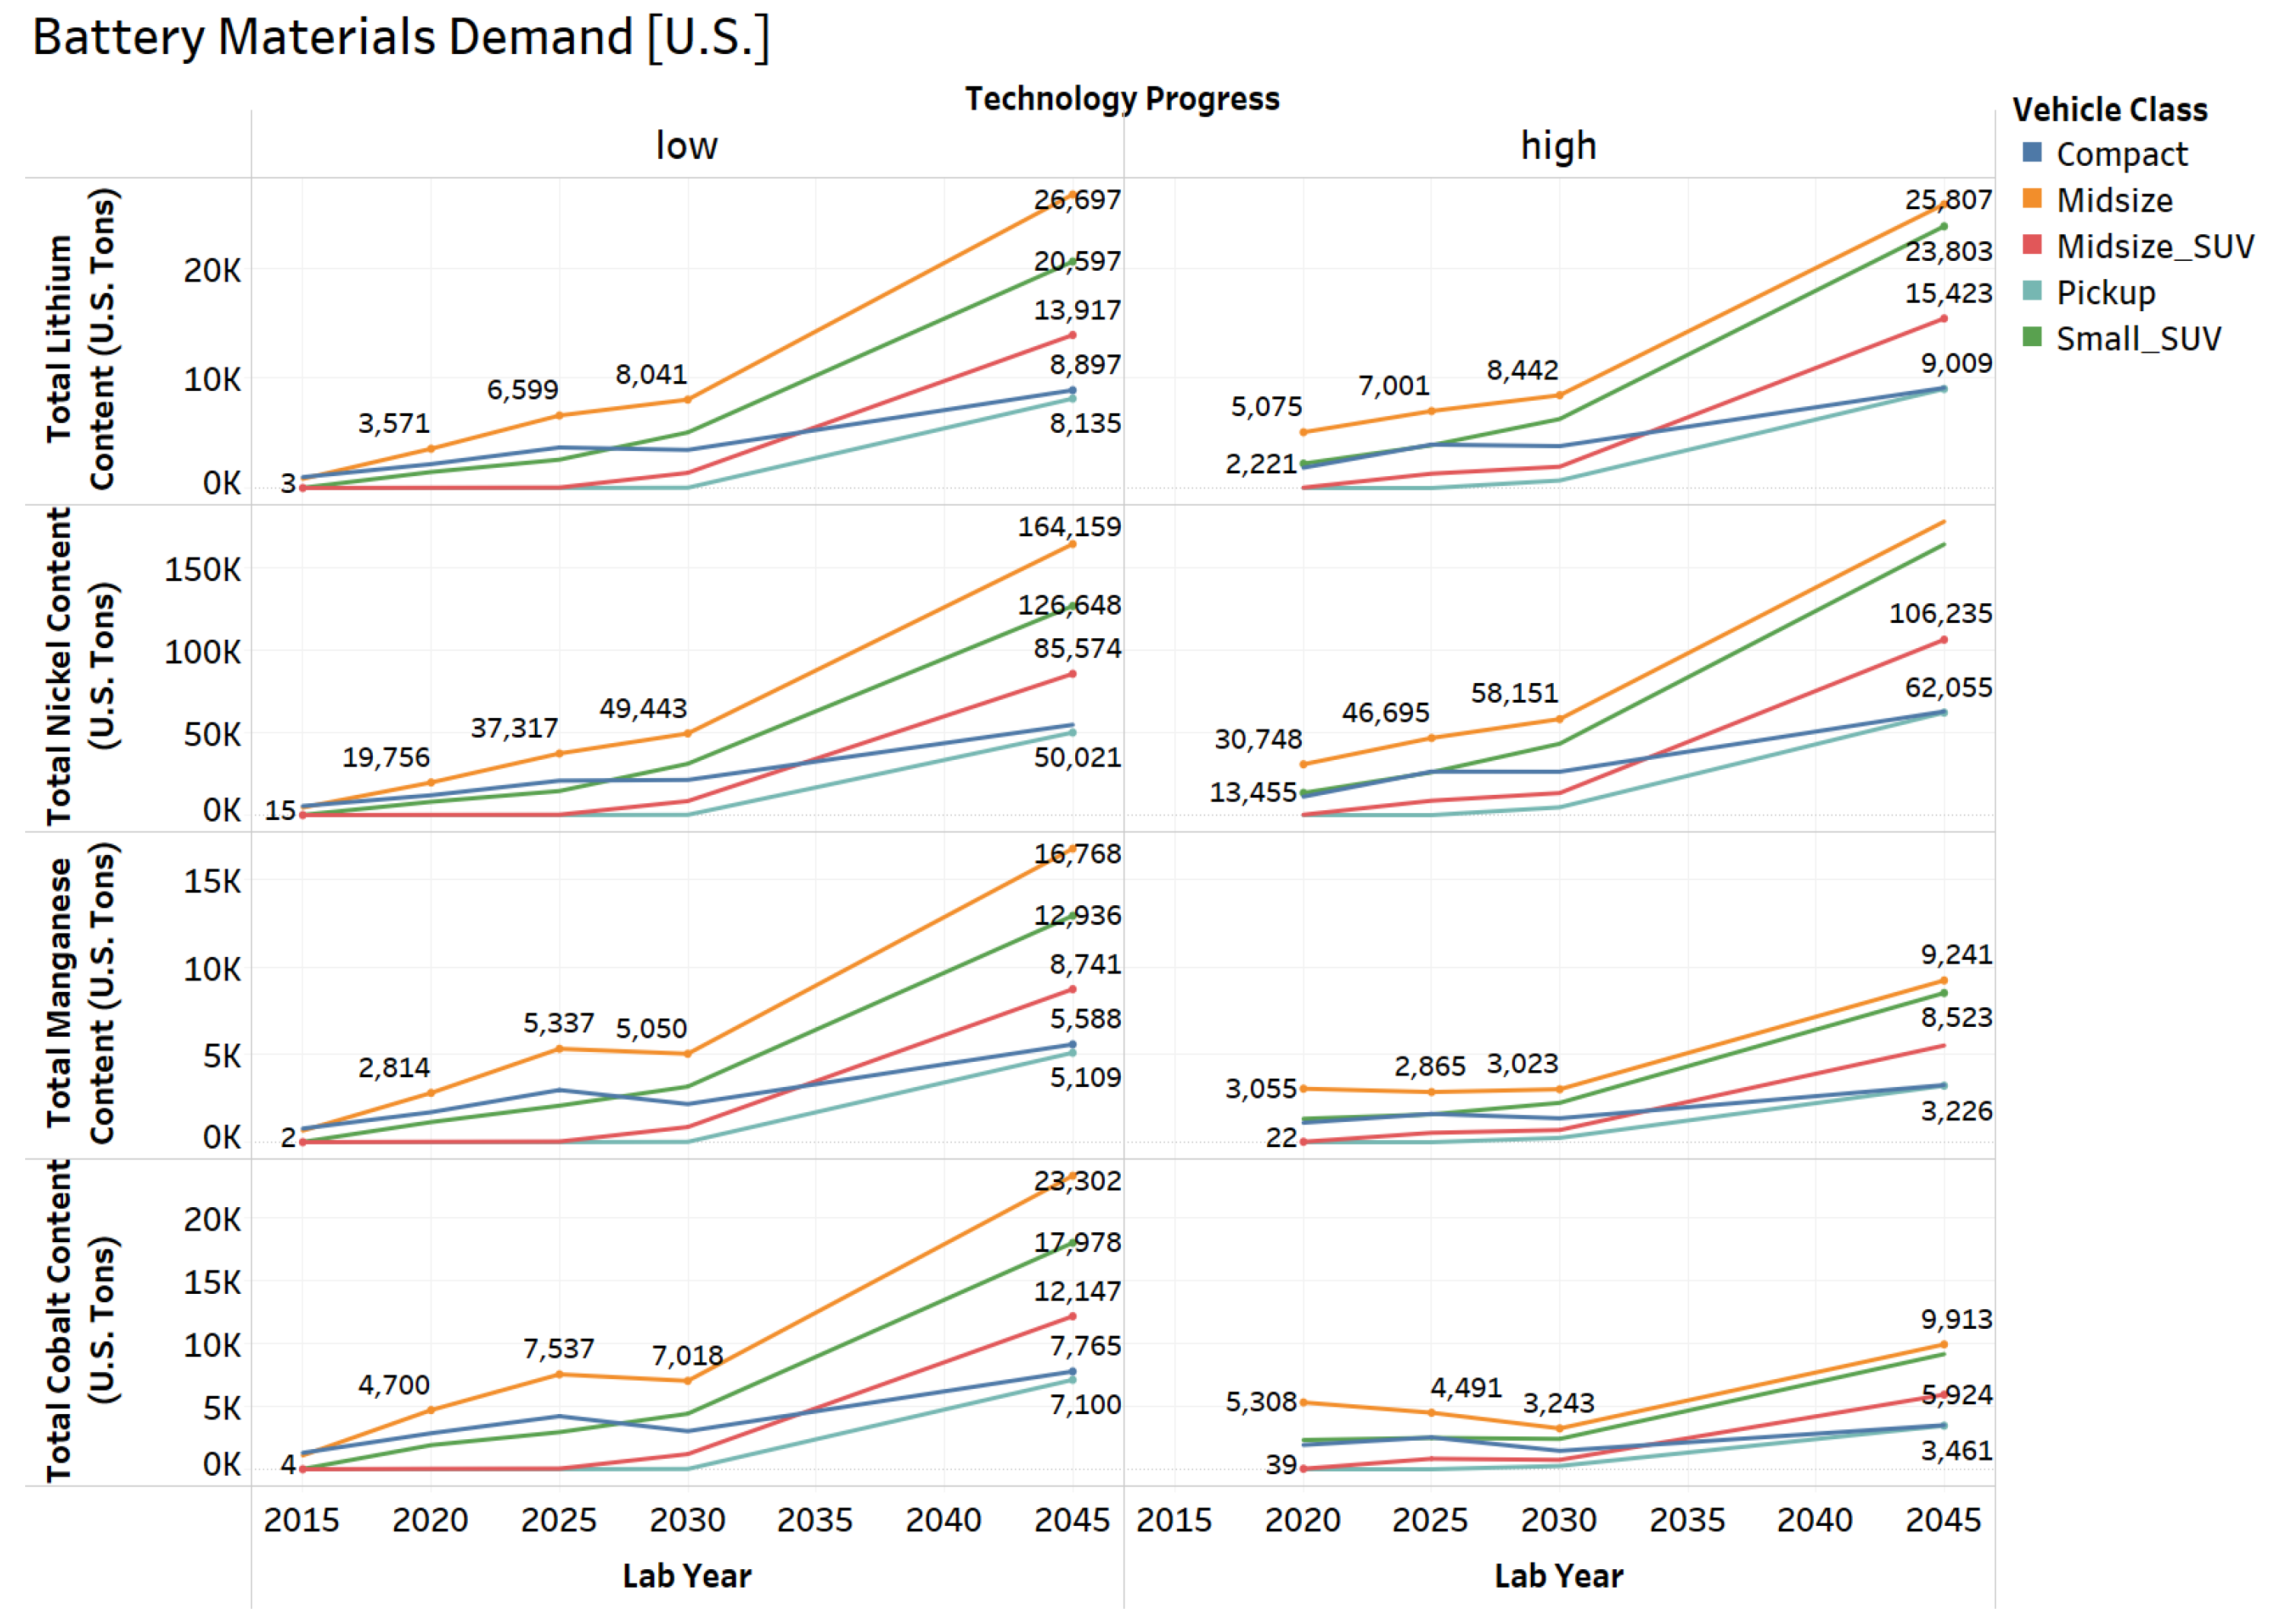
Figure 13 illustrates the total annual demand of different battery materials for U.S. across the vehicle classes modeled.
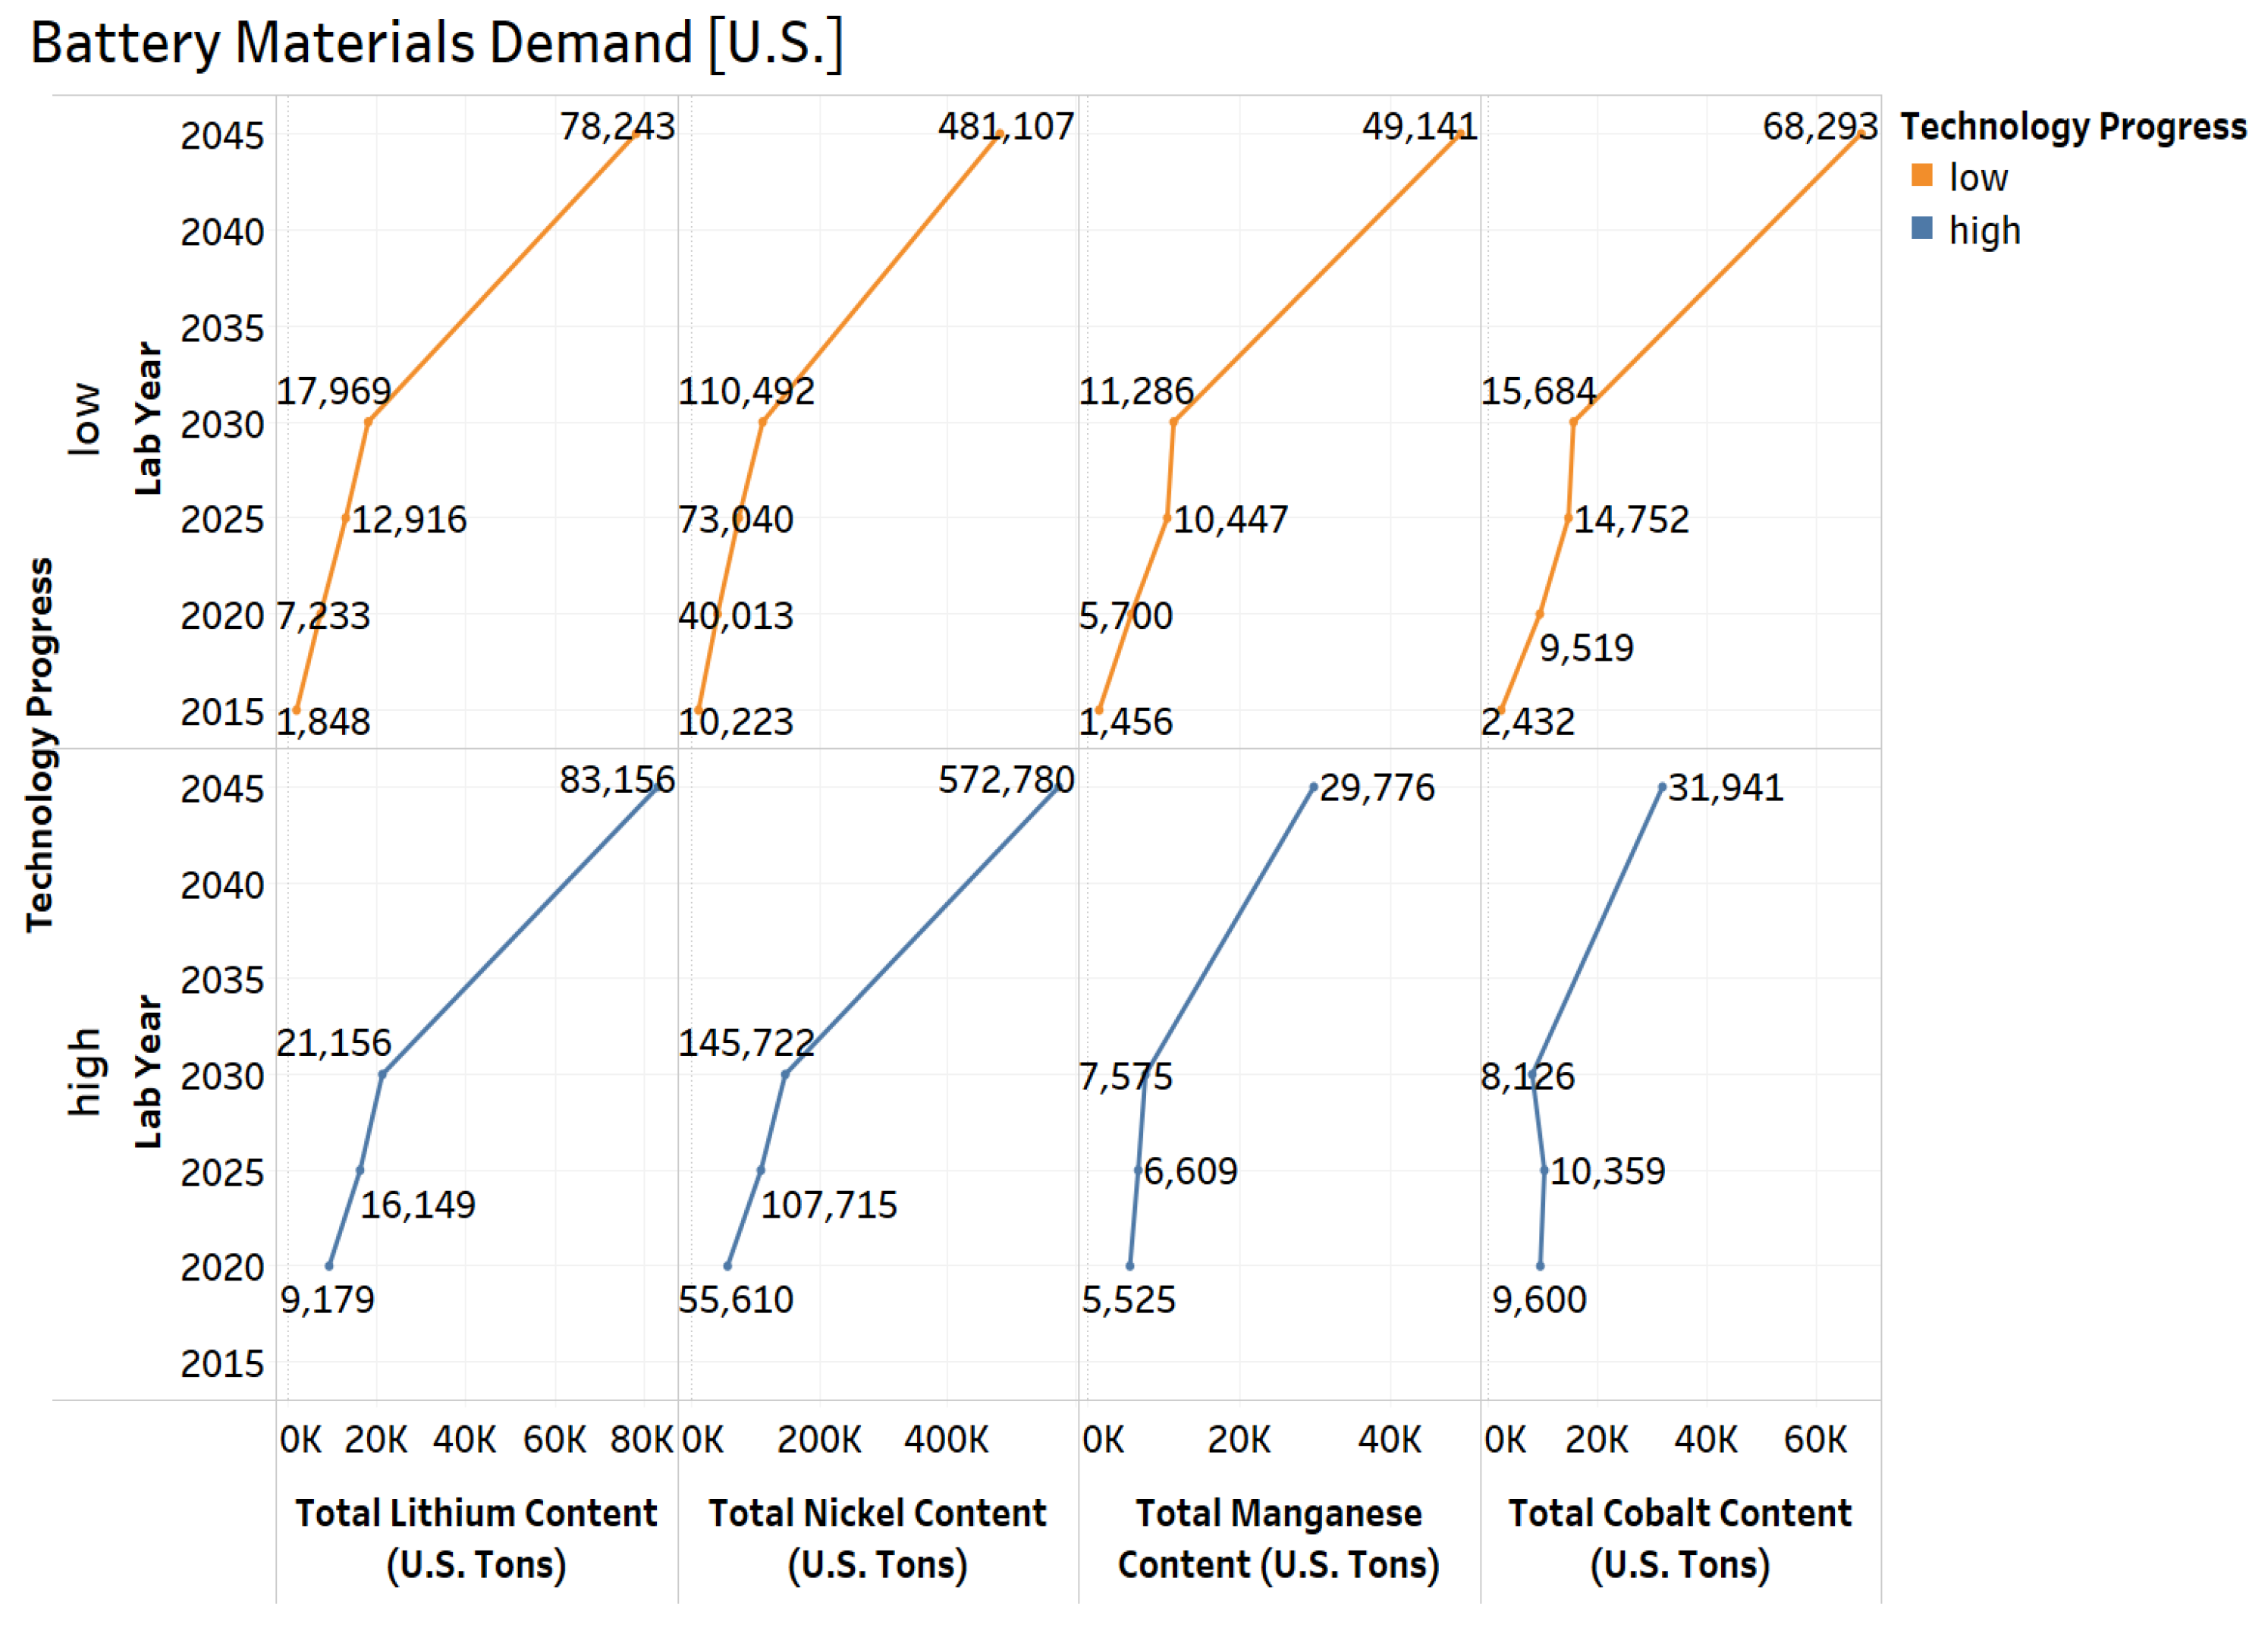
Across the vehicle classes, we see that market penetration has a significant influence on the material demands during different laboratory years. Figure 14 illustrates the total annual demand of different battery materials in the United States.
Our findings can be summarized as follows:
- The total lithium content requirement increases from 1848 tons to 78,243 tons by laboratory year 2045 for current technology improvements (low progress), and 83,156 tons for VTO technology improvements (high progress).
- The total nickel content requirement increases from 10,223 tons to 481,107 tons by laboratory year 2045 for current technology improvements (low progress), and 572,780 tons for VTO technology improvements (high progress).
- The total manganese content requirement increases from 1456 tons to 49,141 tons by laboratory year 2045 for current technology improvements (low progress), and 29,776 tons for VTO technology improvements (high progress).
- The total cobalt content requirement increases from 2432 tons to 68,293 tons by laboratory year 2045 for current technology improvements (low progress), and 31,941 tons for VTO technology improvements (high progress).
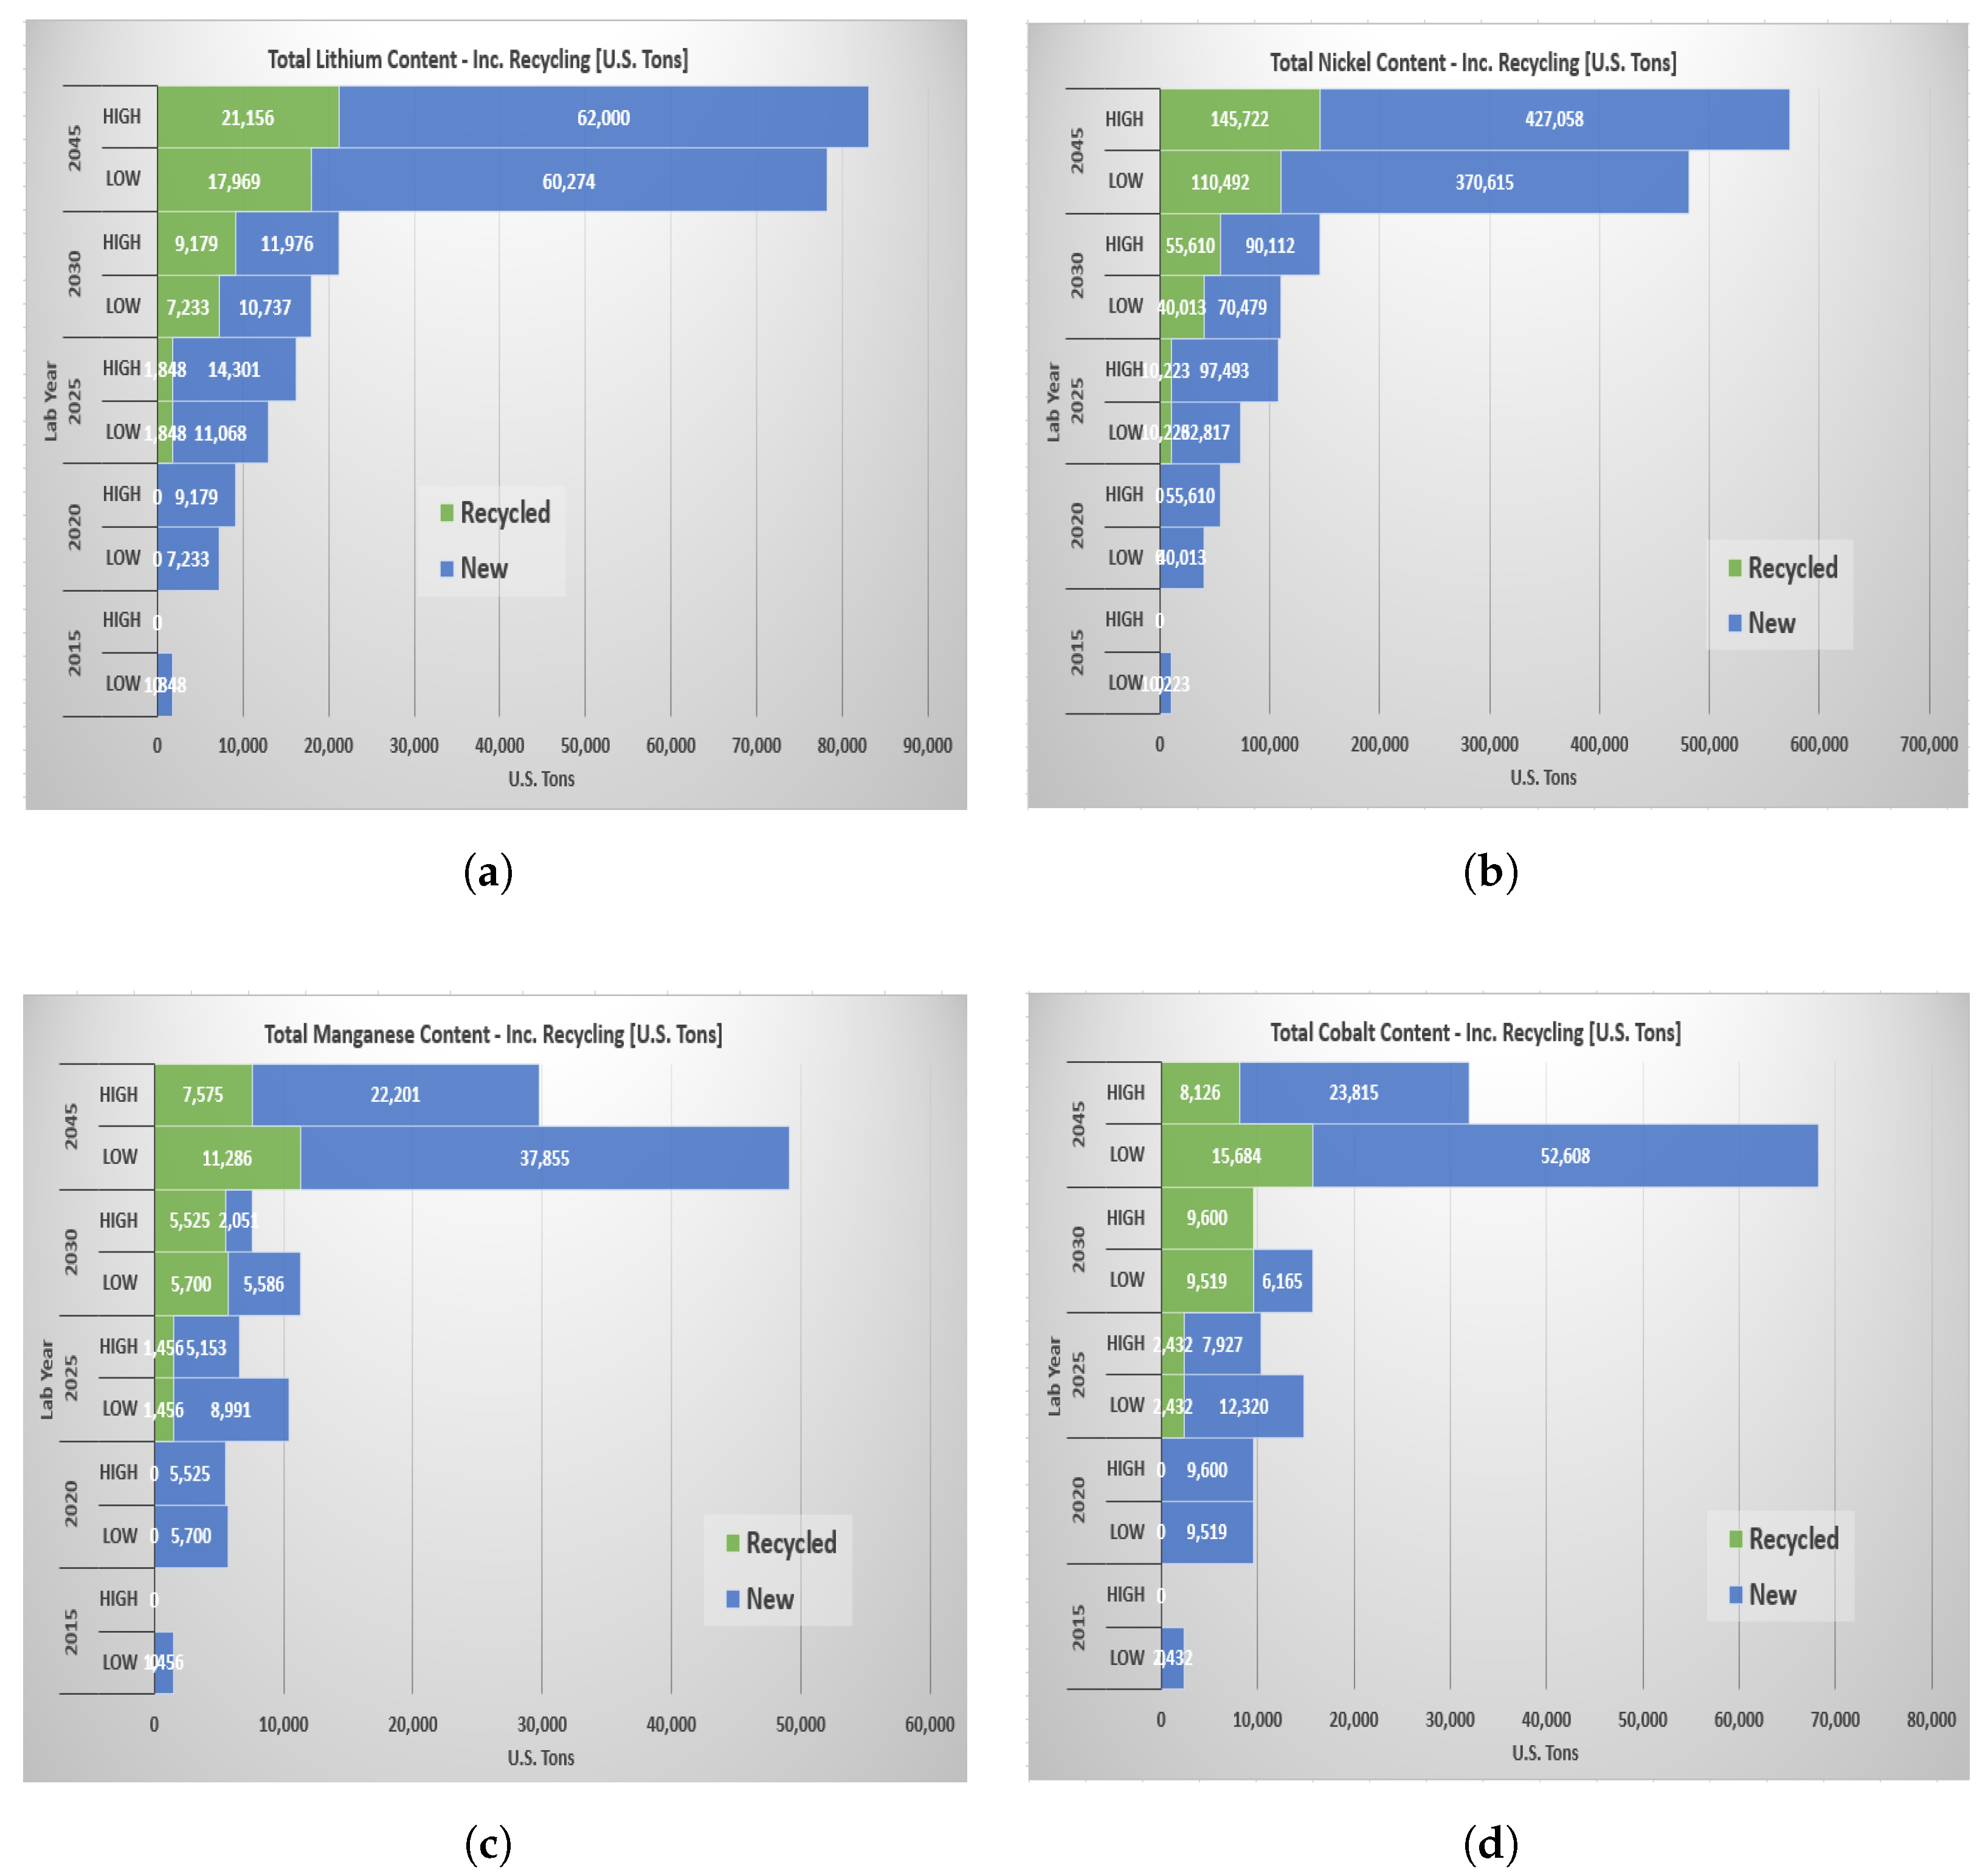
Accounting for the recycling assumptions mentioned earlier, we further conducted analysis to evaluate the impact of recycling on the different battery material demands. Figure 15 illustrates the annual demand of different raw materials in the United States. to satisfy the market penetration of 17 million new vehicle sales per year, accounting for battery recycling.
The impact of our recycling estimates can be summarized as follows:
- For total lithium content, 11–14% of the demand can be met through recycling in laboratory year 2025, 40–43% in laboratory year 2030 and 23–25% in laboratory year 2045.
- For total nickel content, 9–14% of the demand can be met through recycling in laboratory year 2025, 36–38% in laboratory year 2030 and 23–25% in laboratory year 2045.
- For total manganese content, 14–22% of the demand can be met through recycling in laboratory year 2025, 51–73% in laboratory year 2030 and 23–25% in laboratory year 2045.
- For total cobalt content, 16–23% of the demand can be met through recycling in laboratory year 2025, 61–118% in laboratory year 2030 and 23–25% in laboratory year 2045.
We see that the assumed recycling estimates reduce the material content demands significantly more with the advances from the aggressive DOE-VTO target.
4.5. Global Demand
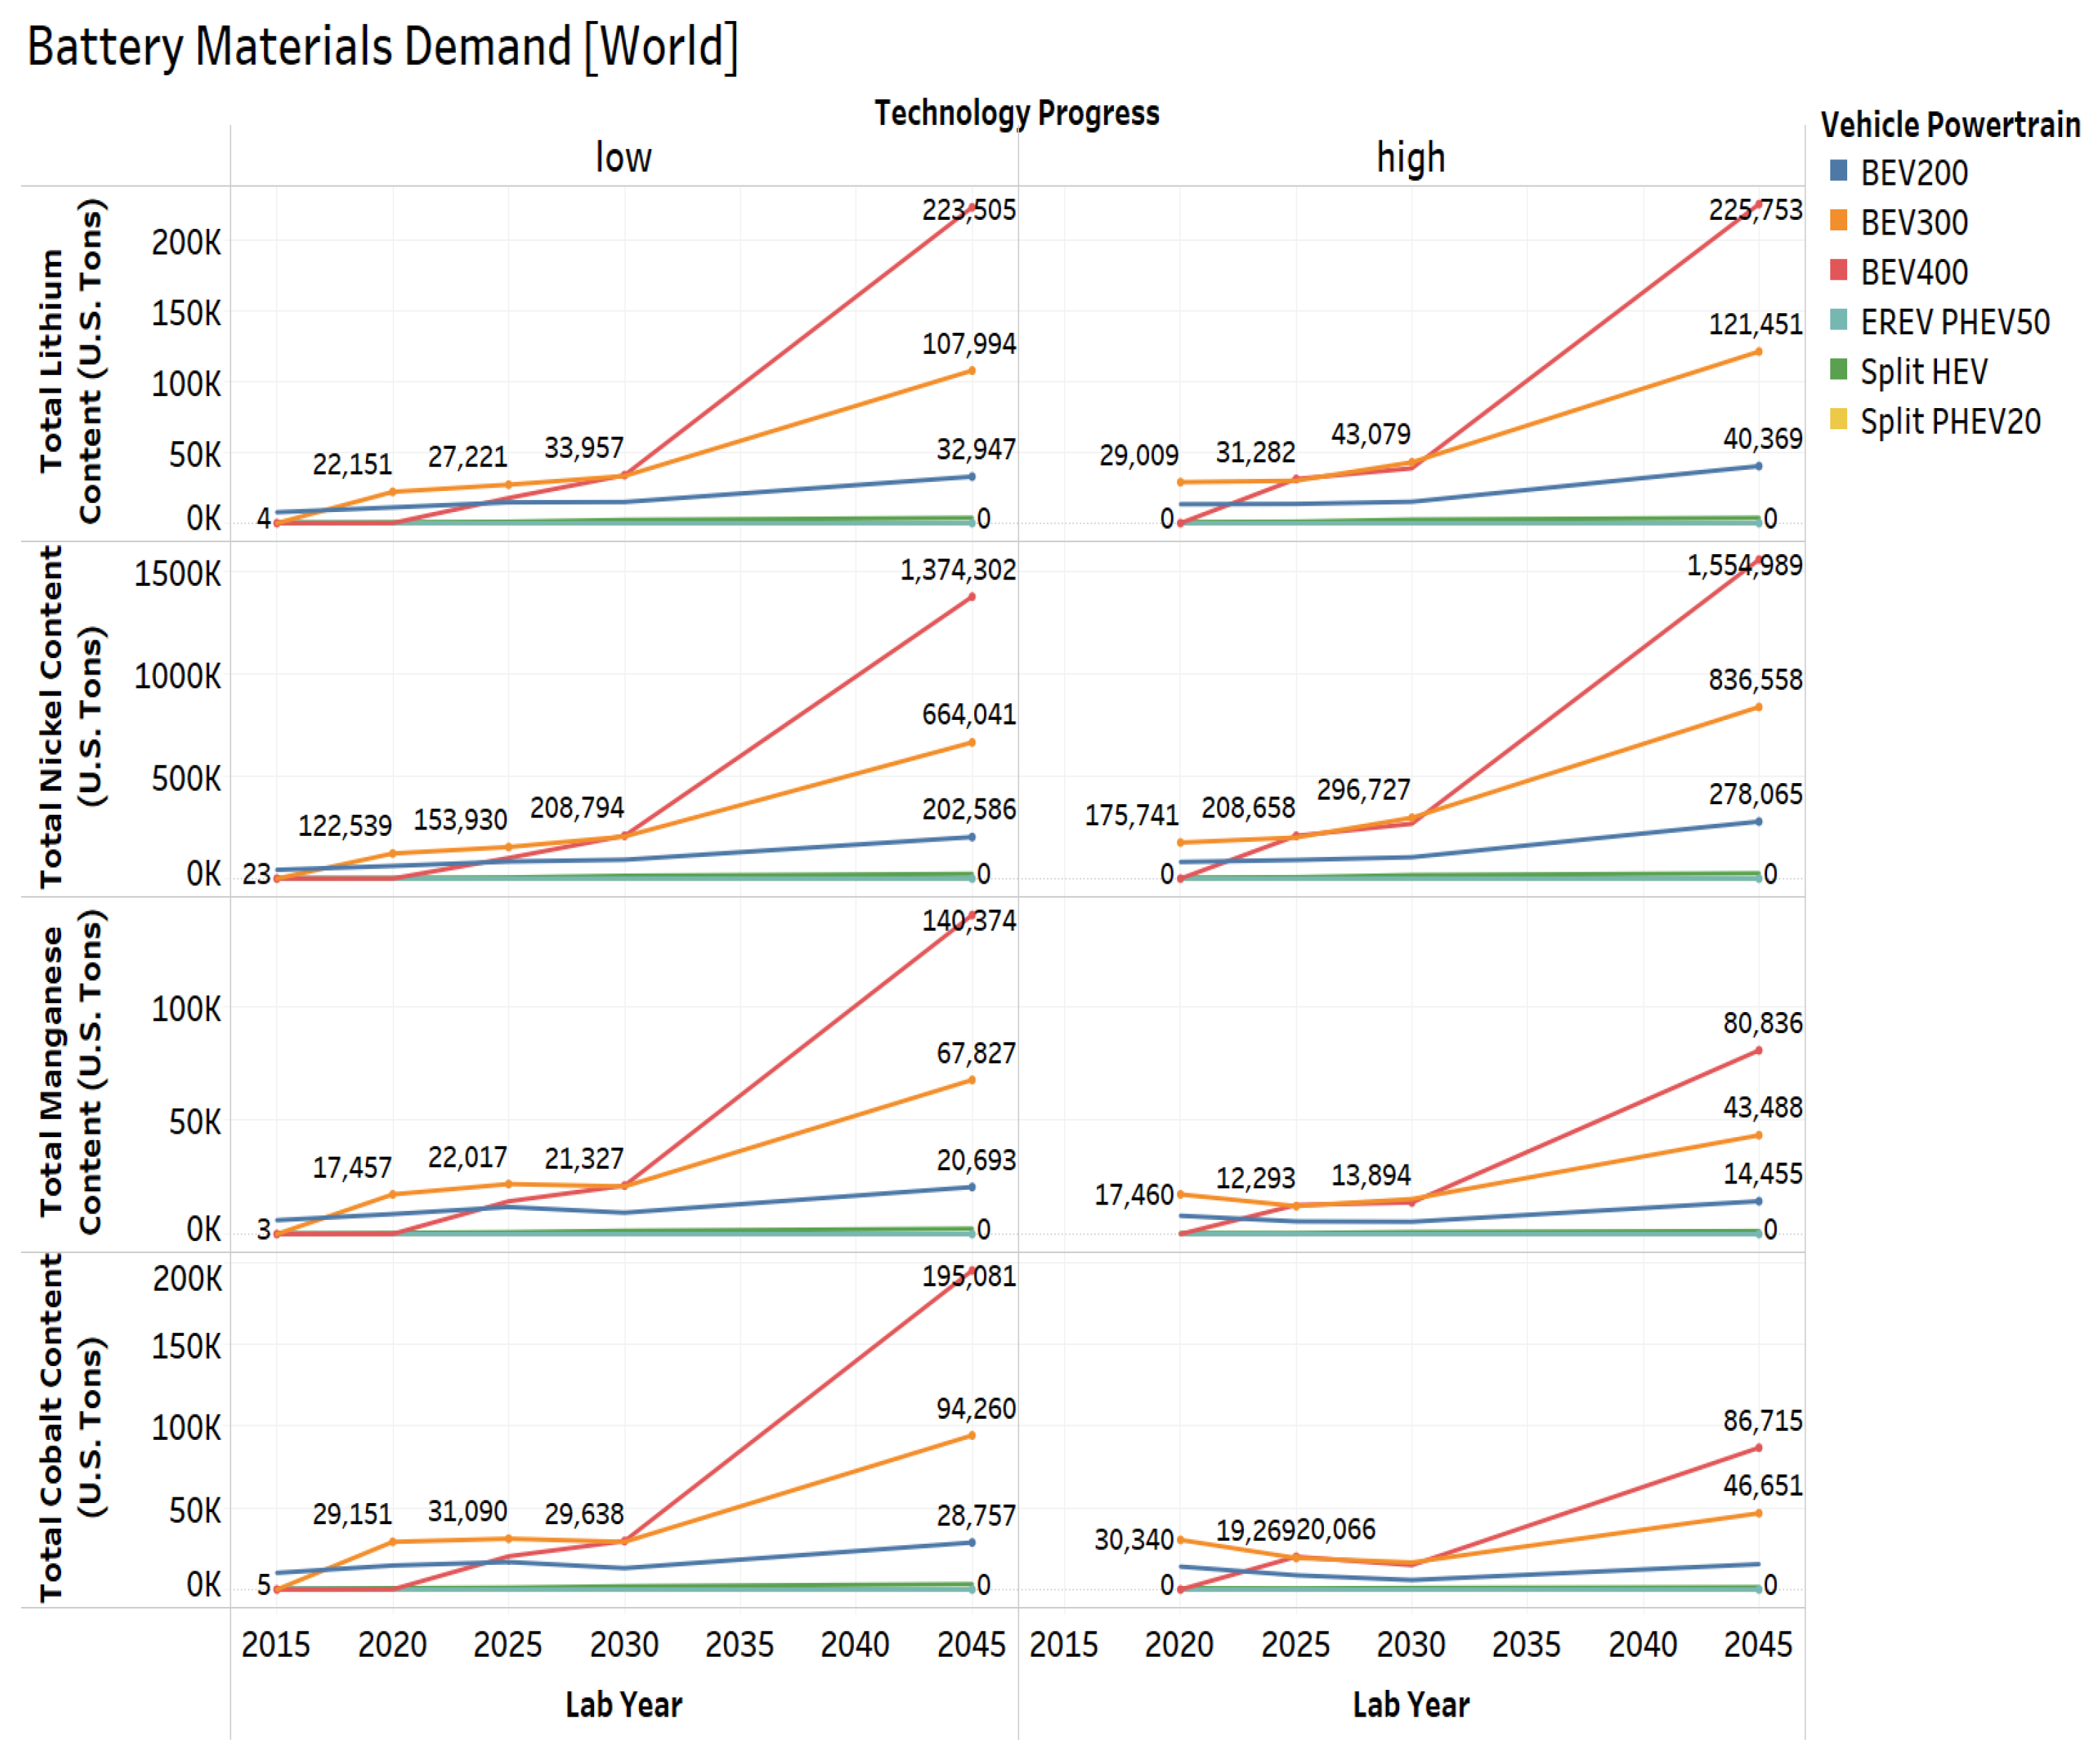
If we assume that there will be 80 million new vehicle sales in the global market every year [17,18], we can adopt an appropriate market penetration for the different powertrains and classes. We evaluate the material demands at the global scale, scaling for the total energy requirements. Figure 16 illustrates the total annual demand for different battery materials around the world split up across the vehicle powertrains modeled.
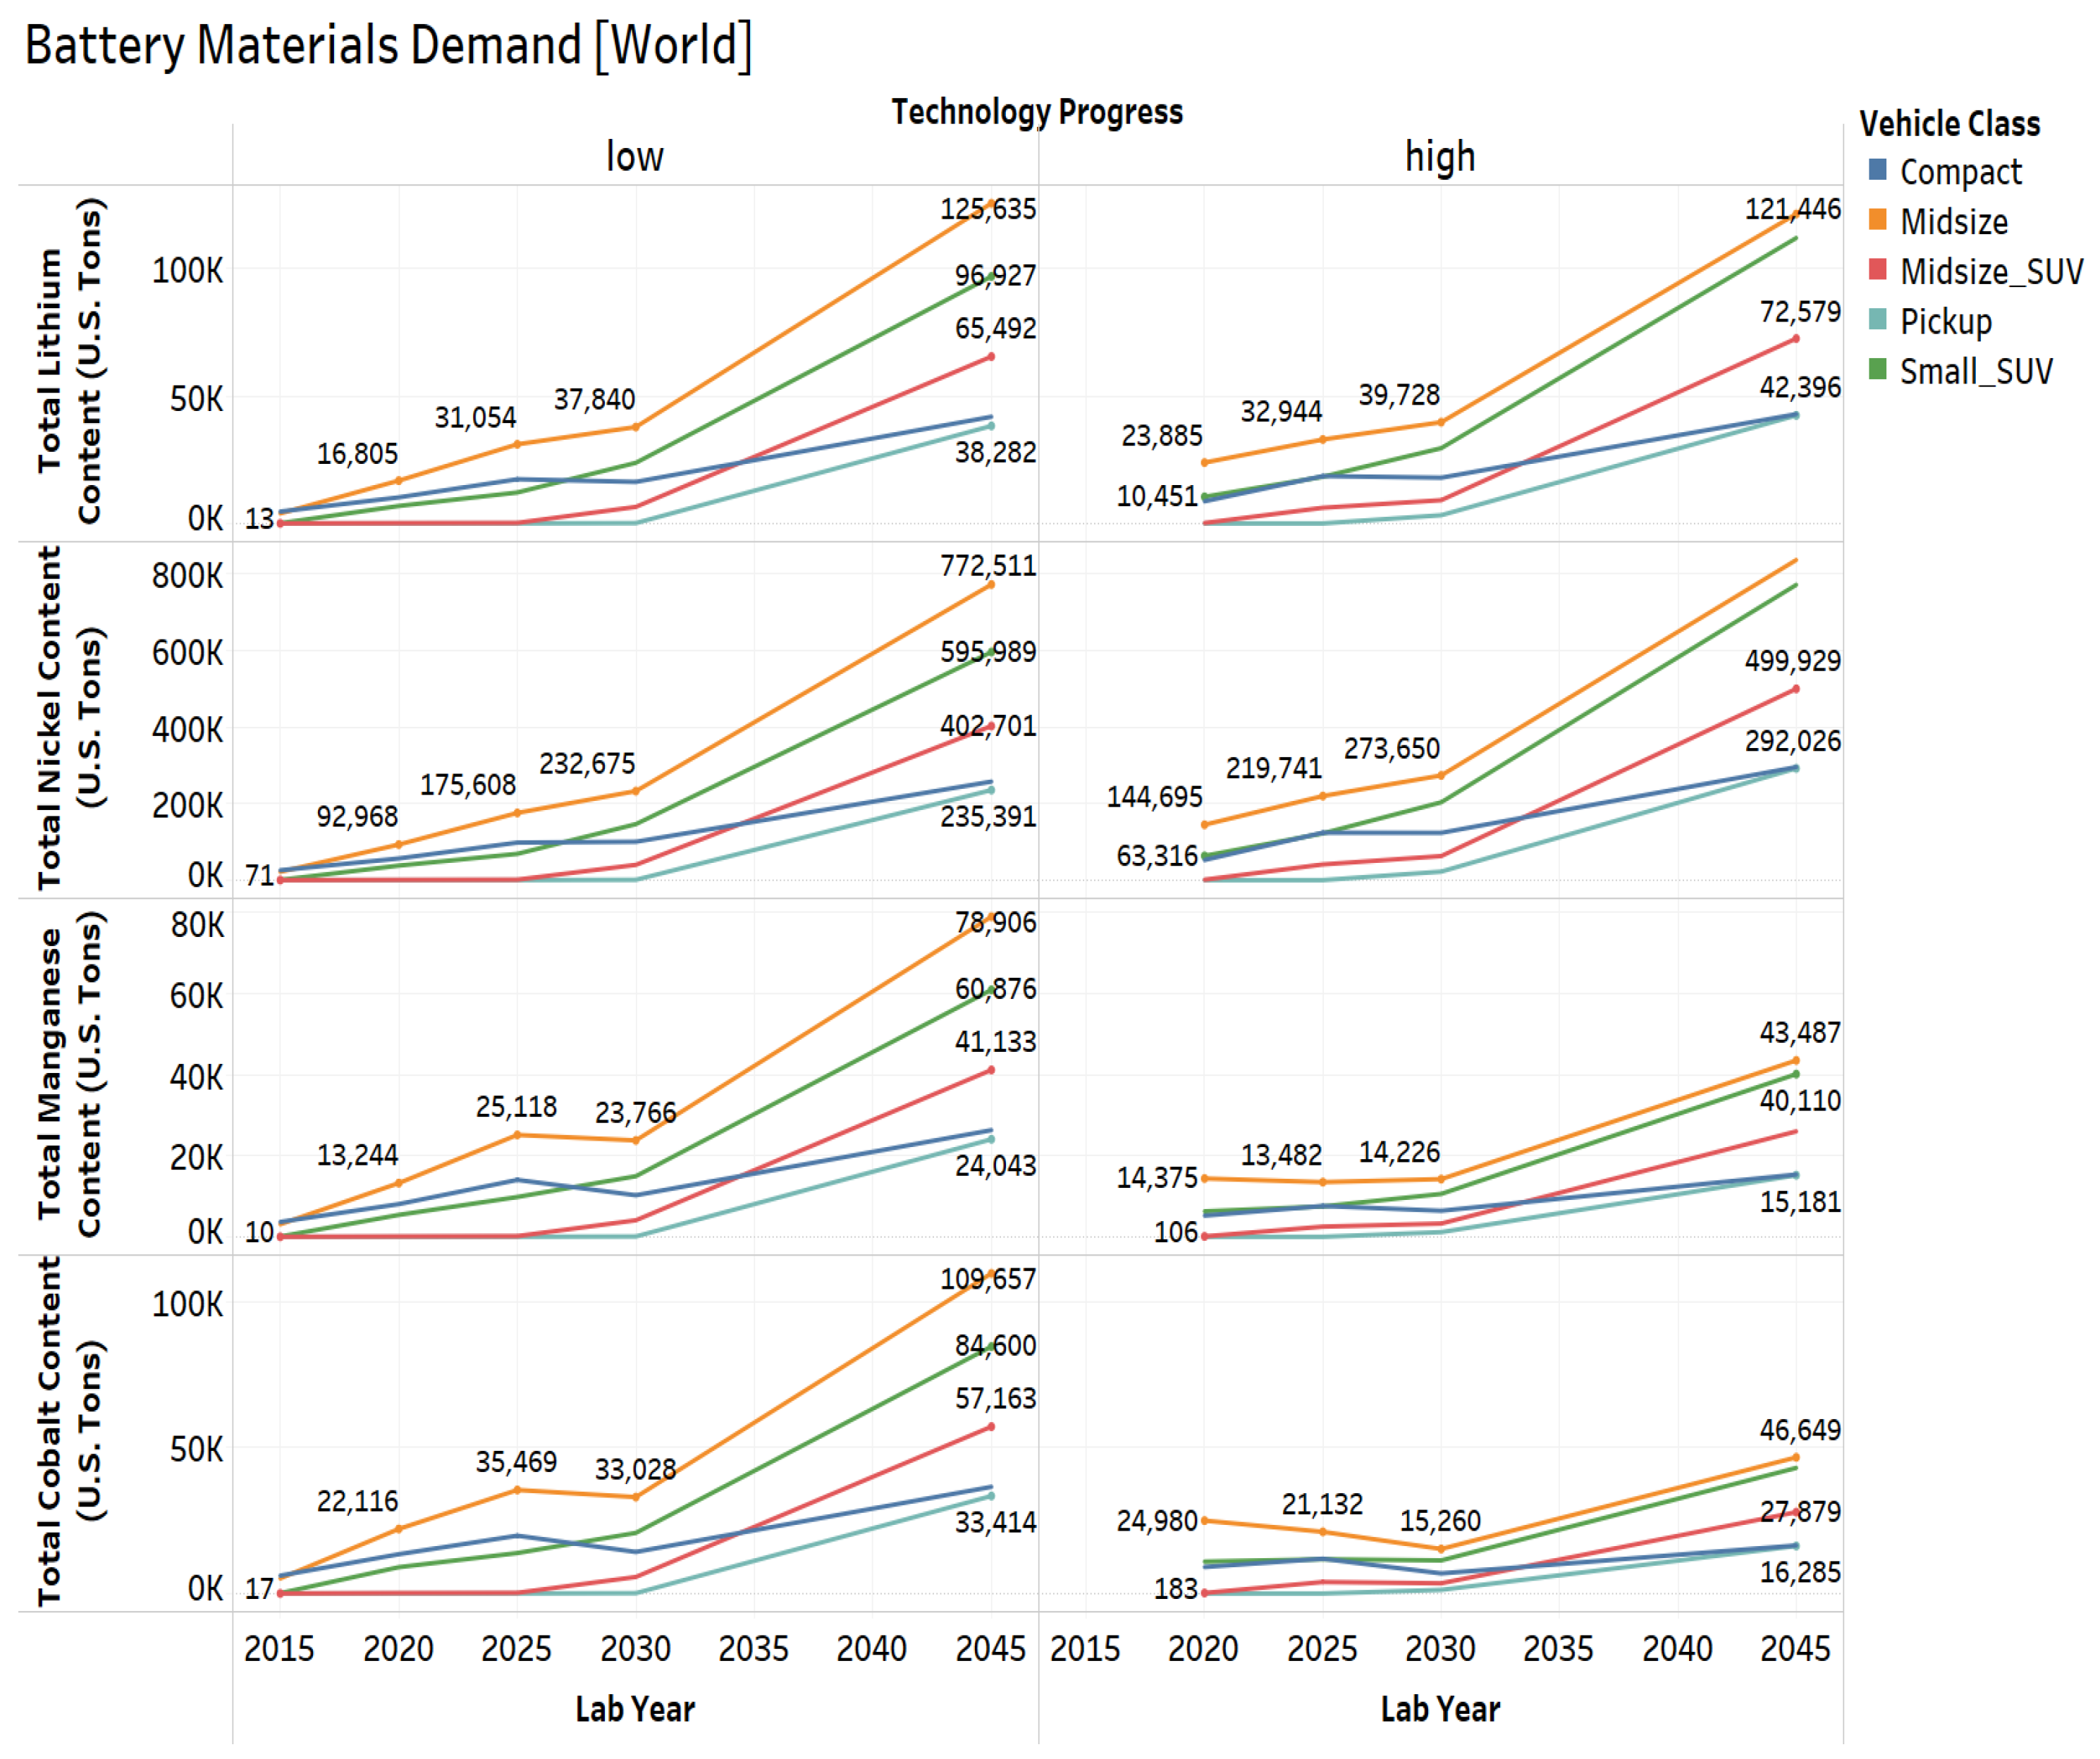
Figure 17 illustrates the total annual demand for different battery materials around the world, split up across the vehicle classes modeled.
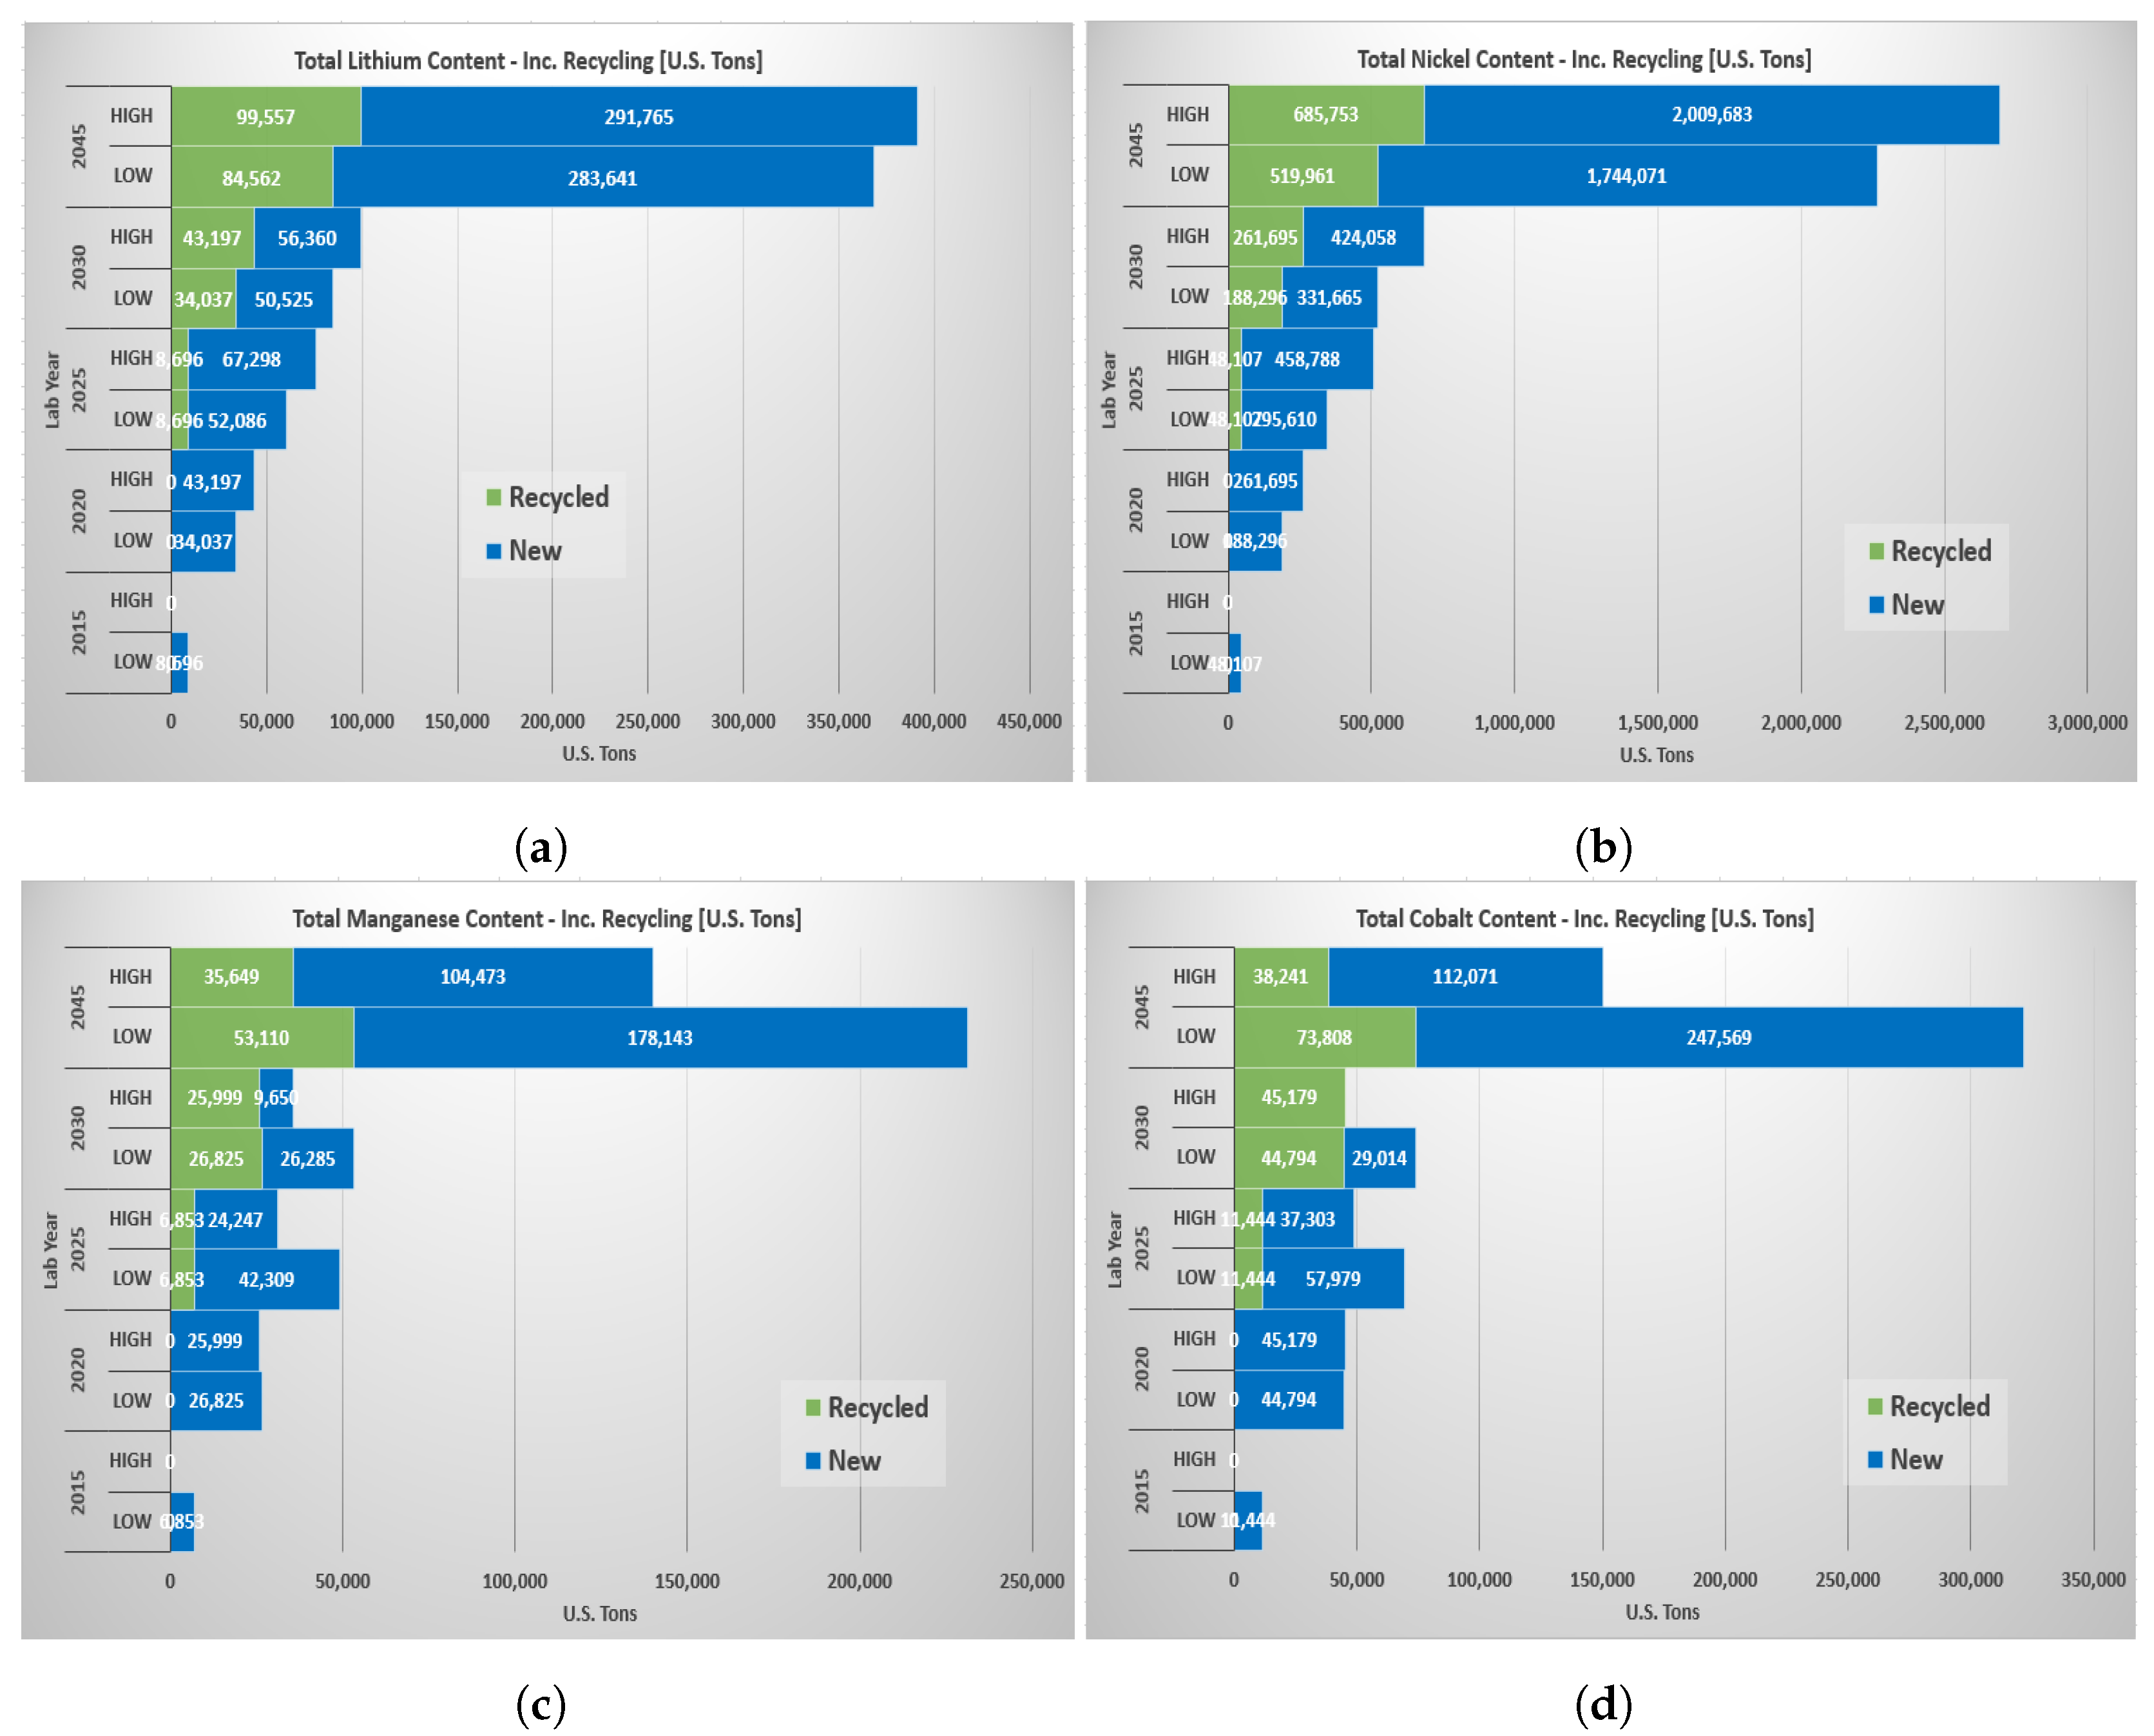
Figure 18 illustrates the annual global supply of different raw materials needed to satisfy a market penetration of 80 million new vehicle sales per year, accounting for the same recycling assumption.
5. Summary and Conclusions
In this study, we conducted an in-depth analysis of the demand for different raw materials for use in EV batteries. We show the impact that DOE-VTO goals for battery energy densities would have on reducing total energy demand, and the subsequent impacts on the demand for different raw materials. The impacts of the demand for different raw materials is influenced by the market penetration of vehicles, along with different battery chemistries. The main conclusions drawn from the study are outlined below:
- The DOE-VTO goals are expected to decrease the total energy requirement of batteries by 31% by laboratory year 2045 for low technology progress and 40% for high technology progress;
- The market penetration of electrified vehicles is assumed to increase by 62% by laboratory year 2045 for low technology progress and by 81% for high technology progress;
- The DOE-VTO goals impact the total demand per GWh for different materials. By laboratory year 2045, total lithium content is expected to decrease by 16%, total nickel content by 62%, and total cobalt content by 75%; total nickel content is expected to increase by 5%;
- Accounting for the market penetration of different battery chemistries and electrified vehicles, the total lithium content requirement is expected to increase by a factor of 42 by 2045 for low technology progress and 45 for high technology progress. The total nickel content requirement is expected to increase by a factor of 47 for low technology progress and 56 for high technology progress. The total manganese content requirement is expected to increase by a factor of 34 for low technology progress and 20 for high technology progress. The total cobalt content requirement is expected to increase by a factor of 28 for low technology progress and by 13 for high technology progress in both U.S. and global market.
For the purposes of this study, we made certain assumptions for the market penetration of vehicles, as well as the different battery chemistries. Although these assumptions could influence the values we obtained, this approach lets us evaluate the impact of DOE-VTO goals on the demand for different battery materials. Future research will include a closed-loop recycling process integration to the study to enable accurate pyro and hydro recycling of the battery modules and the raw active materials.
Author Contributions
Conceptualization, E.S.I. and A.R.; methodology, E.S.I. and A.R.; software, E.S.I.; validation, E.S.I. and A.R.; formal analysis, E.S.I. and S.A.; investigation, E.S.I. and S.A.; resources, A.R.; data curation, E.S.I. and S.A.; writing—original draft preparation, E.S.I.; writing—review and editing, E.S.I.; visualization, E.S.I. and S.A.; supervision, A.R.; project administration, E.S.I. and A.R.; funding acquisition, A.R. All authors have read and agreed to the published version of the manuscript.
Funding
This research was funded by Vehicle Technologies Office Office of Energy Efficiency and Renewable Energy U.S. Department of Energy (DE-AC02-06CH11357).
Data Availability Statement
The detailed dataset supporting this study are available at https://www.autonomie.net/publications/fuel_economy_report.html, accessed on 26 April 2021 and https://www.anl.gov/cse/batpac-model-software, accessed on 26 April 2021.
Acknowledgments
This work was supported by the U.S. Department of Energy’s Vehicle Technologies Office under the direction of Dave Howell. The submitted manuscript has been created by UChicago Argonne, LLC, Operator of Argonne National Laboratory (“Argonne”). Argonne, a U.S. Department of Energy Office of Science laboratory, is operated under Contract No. DE-AC02-06CH11357. The views and opinions of the authors expressed herein do not necessarily state or reflect those of the United States Government or any agency thereof. Neither the United States Government nor any agency thereof, nor any of their employees, makes any warranty, expressed or implied, or assumes any legal liability or responsibility for the accuracy, completeness, or usefulness of any information, apparatus, product, or process disclosed, or represents that its use would not infringe privately owned rights.
Conflicts of Interest
The authors declare no conflict of interest. The funders had no role in the design of the study; in the collection, analyses, or interpretation of data; in the writing of the manuscript, or in the decision to publish the results.
Abbreviations
The following abbreviations are used in this manuscript:
| AER | All-Electric Range |
| BEV | Battery-Electric Vehicle |
| BISG | Belt-Integrated Starter Generator |
| DOE | United States Department of Energy |
| HEV | Hybrid-Electric Vehicle |
| PHEV | Plug-In Hybrid Electric Vehicle |
| VTO | Vehicle Technologies Office |
References
- Fact of the Week #1124, 9 March 2020: U.S. All-Electric Vehicle Sales Level Off in 2019. Available online: https://www.energy.gov/eere/vehicles/articles/fotw-1124-march-9-2020-us-all-electric-vehicle-sales-level-2019 (accessed on 20 April 2021).
- Fact of the Week #1136, 1 June 2020: Plug-in Vehicle Sales Accounted for about 2% of all Light-Duty Vehicle Sales in the United States in 2019. Available online: https://www.energy.gov/eere/vehicles/articles/fotw-1136-june-1-2020-plug-vehicle-sales-accounted-about-2-all-light-duty (accessed on 20 April 2021).
- Fact of the Week #1128, 6 April 2020: Innovations in Automotive Battery Cell Composition. Available online: https://www.energy.gov/eere/vehicles/articles/fotw-1128-april-6-2020-innovations-automotive-battery-cell-composition (accessed on 20 April 2021).
- Richa, K.; Babbitt, C.W.; Gaustad, G.; Wang, X. A future perspective on lithium-ion battery waste flows from electric vehicles. Resour. Conserv. Recycl. 2014, 83, 63–76. [Google Scholar] [CrossRef]
- Hao, H.; Geng, Y.; Tate, J.E.; Liu, F.; Chen, K.; Sun, X.; Zhao, F. Impact of transport electrification on critical metal sustainability with a focus on the heavy-duty segment. Nat. Commun. 2019, 10, 5398. [Google Scholar] [CrossRef] [PubMed]
- Weil, M.; Ziemann, S.; Peters, J. The Issue of Metal Resources in Li-Ion Batteries for Electric Vehicles. In Behaviour of Lithium-Ion Batteries in Electric Vehicles: Battery Health, Performance, Safety, and Cost; Pistoia, G., Liaw, B., Eds.; Springer: Berlin, Germany, 2018; pp. 59–74. [Google Scholar]
- Islam, E.; Kim, N.; Moawad, A.; Rousseau, A. An Extensive Study on Sizing, Energy Consumption, and Cost of Advanced Vehicle Technologies, ANL/ESD-17/17; Argonne National Laboratory: Lemont, IL, USA, October 2018. [Google Scholar]
- Autonomie. Available online: http://www.autonomie.net (accessed on 20 April 2021).
- BatPaC Model Software. Available online: https://www.anl.gov/cse/batpac-model-software (accessed on 20 April 2021).
- Islam, E.; Kim, N.; Moawad, A.; Rousseau, A. Energy Consumption And Cost Reduction Of Future Light-Duty Vehicles Through Advanced Vehicle Technologies: A Modeling Simulation Study Through 2050; ANL/ESD-19/10; Argonne National Laboratory: Lemont, IL, USA, 2020. [Google Scholar]
- MA3T Model. Oak Ridge National Laboratory. Available online: https://www.ornl.gov/content/ma3t-model (accessed on 20 April 2021).
- Ziemann, S.; Müller, D.B.; Schebek, L.; Weil, M. Modeling the potential impact of lithium recycling from EV batteries on lithium demand: A dynamic MFA approach. Resour. Conserv. Recycl. 2018, 133, 76–85. [Google Scholar] [CrossRef]
- Mayyas, A.; Steward, D.; Mann, M. The Case for Recycling: Overview and Challenges in the Material Supply Chain for Automotive Li-Ion Batteries. Sustain. Mater. Technol. 2019, 19, e00087. [Google Scholar] [CrossRef]
- Neubauer, J.; Smith, K.; Wood, E.; Pesaran, A. Identifying and Overcoming Critical Barriers to Widespread Second Use of PEV Batteries; National Renewable Energy Lab. (NREL): Golden, CO, USA, 2015. [Google Scholar] [CrossRef]
- Fact of the Week #1116, 13 January 2020: U.S. Light-Duty Vehicle Sales in 2019 Were Nearly 17 Million Vehicles. Available online: https://www.energy.gov/eere/vehicles/articles/fotw-1116-january-13-2020-us-light-duty-vehicle-sales-2019-were-nearly-17 (accessed on 19 April 2021).
- Fact of the Week #1151: 14 September 2020: Lithium-Ion Battery Capacity for New All-Electric Vehicles Sold in the United States Reached a Record High in 2019. Available online: https://www.energy.gov/eere/vehicles/articles/fotw-1151-september-14-2020-lithium-ion-battery-capacity-new-all-electric (accessed on 21 April 2021).
- WardsAuto. World Vehicle Sales Surpass 80 Million in 2012. Available online: https://www.wardsauto.com/industry/world-vehicle-sales-surpass-80-million-2012 (accessed on 19 April 2021).
- Statista. Automotive Industry Worldwide–Statistics & Facts. Available online: https://0-www-statista-com.brum.beds.ac.uk/topics/1487/automotive-industry/#dossierSummary (accessed on 19 April 2021).
Figure 1.
Large-scale simulation process to quantify battery material demand.

Figure 2.
BEV sizing algorithm.

Figure 3.
Market penetration assumptions of electrified powertrains and vehicle classes: (a) penetration of electrified powertrains with current technology improvements; (b) penetration of electrified powertrains with VTO technology targets; (c) penetration of vehicle class with current technology improvements; and (d) penetration of vehicle class with VTO technology targets.


Figure 4.
Market penetration of different powertrains and vehicle classes.

Figure 5.
Battery and vehicle weight for midsize vehicles.

Figure 6.
Battery total energy for midsize vehicles.

Figure 7.
Total battery energy (in watt-hours, Wh) for different vehicle classes.

Figure 8.
Battery material content per vehicle.

Figure 9.
Battery material content across classes.

Figure 10.
Total battery materials content (in U.S. tons) per GWh: (a) lithium; (b) nickel; (c) manganese; and (d) cobalt.
Figure 10.
Total battery materials content (in U.S. tons) per GWh: (a) lithium; (b) nickel; (c) manganese; and (d) cobalt.

Figure 11.
Total battery energy requirement from U.S. demand in GWh.

Figure 12.
Total battery material demands for different vehicle powertrains.

Figure 13.
Total battery material demands for different vehicle classes.

Figure 14.
Total battery material demands across different laboratory years.

Figure 15.
United States battery materials demand (in U.S. tons) for different laboratory years (including recycling): (a) total lithium content; (b) total nickel content; (c) total manganese content; and (d) total cobalt content.
Figure 15.
United States battery materials demand (in U.S. tons) for different laboratory years (including recycling): (a) total lithium content; (b) total nickel content; (c) total manganese content; and (d) total cobalt content.

Figure 16.
Global battery materials demand for different vehicle powertrains.

Figure 17.
Global battery materials demand for different vehicle classes.

Figure 18.
Global battery materials demand (in U.S. tons) for different laboratory years (including recycling): (a) total lithium; (b) total nickel; (c) total manganese; and (d) total cobalt.
Figure 18.
Global battery materials demand (in U.S. tons) for different laboratory years (including recycling): (a) total lithium; (b) total nickel; (c) total manganese; and (d) total cobalt.


Table 1.
Battery Chemistry Assumptions.
| Parameter | NCA-G | NMC622-G | NMC811-G | NMC955-G | NCA-G 10% Co |
|---|---|---|---|---|---|
| Specific Active Capacity (mAh/kg) | 200 | 180 | 212 | 222 | 209 |
| Cell Voltage (V) | 3.68 | 3.75 | 3.751 | 3.751 | 3.68 |
| Lithium Content | 0.0722 | 0.0836 | 0.0769 | 0.0768 | 0.0722 |
| Nickel Content | 0.4886 | 0.3731 | 0.4710 | 0.5290 | 0.5194 |
| Cobalt Content | 0.0920 | 0.1249 | 0.0591 | 0.0295 | 0.0613 |
| Manganese Content | 0.0000 | 0.1164 | 0.0551 | 0.0275 | 0.0000 |
Table 2.
Vehicle Classification and Characteristics.
| Vehicle Class | 0–60 mph Time (s) | Frontal Area (m) | Drag Coefficient | Rolling Resistance |
|---|---|---|---|---|
| Compact | 10 | 2.3 | 0.31 | 0.009 |
| Midsize | 9 | 2.35 | 0.3 | 0.009 |
| Small SUV | 9 | 2.65 | 0.36 | 0.009 |
| Midsize SUV | 10 | 2.85 | 0.38 | 0.009 |
| Pickup | 7 | 3.25 | 0.42 | 0.009 |
Table 3.
Technology Assumptions.
| Parameter | Laboratory Year & Technology Progress Cases | ||||||
|---|---|---|---|---|---|---|---|
| 2015 | 2020 | 2025 | 2045 | ||||
| Low | Low | High | Low | High | Low | High | |
| Specific Power at 70% SOC: HEVs (W/kg) | 2750 | 3000 | 4000 | 4000 | 5000 | 5000 | 6000 |
| Energy Density (usable): PHEV20 (Wh/kg) | 60 | 80 | 100 | 105 | 125 | 115 | 170 |
| Energy Density (usable): PHEV50 (Wh/kg) | 70 | 95 | 105 | 105 | 125 | 115 | 170 |
| Energy Density (usable): BEV (Wh/kg) | 170 | 170 | 230 | 230 | 310 | 280 | 320 |
Table 4.
Battery Chemistry Penetration across Laboratory Years.
| Parameter | Laboratory Year & Technology Progress Cases | ||||||||
|---|---|---|---|---|---|---|---|---|---|
| 2015 | 2020 | 2025 | 2030 | 2045 | |||||
| Low | Low | High | Low | High | Low | High | Low | High | |
| NCA-G | 40 | 40 | 20 | 20 | 0 | 10 | 0 | 10 | 0 |
| NMC622-G | 48 | 48 | 24 | 37.5 | 0 | 16 | 0 | 16 | 0 |
| NMC811-G | 9 | 9 | 30 | 33.75 | 37.5 | 44 | 0 | 44 | 0 |
| NMC955-G | 3 | 3 | 6 | 3.75 | 37.5 | 20 | 100 | 20 | 100 |
| NCA-G 10% Co | 0 | 0 | 20 | 5 | 25 | 10 | 0 | 10 | 0 |
Short Biography of Authors
 | Ehsan Sabri Islam completed his M. Sc. in Interdisciplinary Engineering from Purdue University, USA in 2019 and his B.A.Sc in Mechatronics Engineering from the University of Waterloo, Canada, in 2016. His skill set and interests focus on applying mechatronics principles to innovate systems and processes in advanced vehicle technologies and controls systems. At Argonne National Laboratory, he focuses his research on vehicle energy consumption analyses and inputs for U.S. DOE-VTO and the National Highway Transportation Safety Administration/U.S. Environmental Protection Agency/U.S. Department of Transportation (DOT) Corporate Average Fuel Economy (CAFE) and CO standards using innovative, large-scale simulation processes and applications of artificial intelligence. |
 | Dr. Shabbir Ahmed is a Senior Chemical Engineer in the Chemical Sciences and Engineering Division of Argonne National Laboratory. His research interests have included hydrogen production, fuel cells and systems, and the techno-economic modeling of lithium ion batteries and their supply chain. |
 | Aymeric Rousseau is the Manager of the Systems Modeling and Control Section at Argonne National Laboratory. He received his engineering diploma at the Industrial System Engineering School in La Rochelle, France in 1997 and an Executive MBA from Chicago Booth School of Business in 2019. For the past 20 years, he has been evaluating the impact of advanced vehicle and transportation technologies from a mobility and energy point of view including the development of Autonomie (vehicle system simulation) and POLARIS (large-scale transportation system simulation). In addition to leading numerous projects for OEMs and the U.S. Department of Energy, Aymeric Rousseau provides the vehicle energy consumption analysis for the U.S. CAFE regulations and has authored or co-authored more than 80 papers related to vehicle electrification. |
Publisher’s Note: MDPI stays neutral with regard to jurisdictional claims in published maps and institutional affiliations. |
© 2021 by the authors. Licensee MDPI, Basel, Switzerland. This article is an open access article distributed under the terms and conditions of the Creative Commons Attribution (CC BY) license (https://creativecommons.org/licenses/by/4.0/).
Share and Cite
MDPI and ACS Style
Islam, E.S.; Ahmed, S.; Rousseau, A. Future Battery Material Demand Analysis Based on U.S. Department of Energy R&D Targets. World Electr. Veh. J. 2021, 12, 90. https://0-doi-org.brum.beds.ac.uk/10.3390/wevj12030090
AMA Style
Islam ES, Ahmed S, Rousseau A. Future Battery Material Demand Analysis Based on U.S. Department of Energy R&D Targets. World Electric Vehicle Journal. 2021; 12(3):90. https://0-doi-org.brum.beds.ac.uk/10.3390/wevj12030090
Chicago/Turabian StyleIslam, Ehsan Sabri, Shabbir Ahmed, and Aymeric Rousseau. 2021. "Future Battery Material Demand Analysis Based on U.S. Department of Energy R&D Targets" World Electric Vehicle Journal 12, no. 3: 90. https://0-doi-org.brum.beds.ac.uk/10.3390/wevj12030090