
Challenges in Grid Integration of Electric Vehicles in Urban and Rural Areas


1
Reiner Lemoine Institut gGmbH, Rudower Chaussee 12, 12489 Berlin, Germany
2
Department of Electrical Energy Storage Technology, Technische Universität Berlin, 10623 Berlin, Germany
*
Author to whom correspondence should be addressed.
†
These authors contributed equally to this work.
World Electr. Veh. J. 2021, 12(4), 206; https://0-doi-org.brum.beds.ac.uk/10.3390/wevj12040206
Submission received: 6 October 2021
/
Revised: 18 October 2021
/
Accepted: 19 October 2021
/
Published: 21 October 2021
(This article belongs to the Special Issue Towards Intelligent E-Mobility—Selected Papers from The 34th International Electric Vehicles Symposium and Exhibition (Nanjing, China))
Abstract
:The ramp-up of battery electric vehicles (BEVs) could lead to severe grid issues but also enables flexibility. This paper provides a better understanding of the challenges and potentials of integrating BEVs in power grids. Three charging strategies were modelled on four use cases and six low-voltage grids for urban and rural areas. Especially in rural areas, where many cars charge at home overnight, the charging strategy significantly affects grid issues. Purely market-oriented strategies can lead to high load peaks and thus to transformer and line overloading, while even a relatively simple, balanced charging strategy can significantly reduce grid issues.
1. Introduction
The share of renewable energies in electricity generation is steadily increasing, exceeding 50% in 2020 for the first time in Germany [1]. At the same time, the share of battery electric vehicles (BEVs) is also increasing. In 2020, the share of new electric passenger cars registrations in Germany almost tripled. Currently, over one per cent of all registered passenger cars are electric [2]. This share will grow strongly in the coming years. According to own calculations based on [3], around 40 million vehicles in Germany will be electrified in 2040, corresponding to around 85% of all passenger cars. In the wake of these changes, flexibility options are becoming increasingly important for grid operators. Battery electric vehicles offer a high potential for this flexibility demand due to the built-in storage and the possibility to charge flexibly during the entire standing time.
However, this potential varies depending on the charging option and region. For this purpose, the German Federal Ministry of Transport has defined seven charging use cases. Because of the different mobility and parking behaviour in urban and rural areas, the charging demand and, therefore, the distribution among the seven charging use cases also differs. Together with different charging strategies, this distribution can result in different impacts on the power grid.
Because power grids are usually designed for several decades, the impacts and potentials of electric vehicle integration need to be included in long-term planning. Therefore, the primary research questions of this paper are:
- How does charging demand differ in urban and rural areas?
- What impact do different charging strategies have on the load profile of electric vehicles at different charging use cases?
- What is the impact of integrating electric vehicles on the power grid in urban and rural areas?
These questions are investigated based on the German states of urban Berlin and rural Brandenburg, which differ in mobility behaviour and grid topology. This paper will compare the impact of three different charging strategies on low-voltage grids for the two types of region.
2. Methodology
2.1. Number of Electric Vehicles
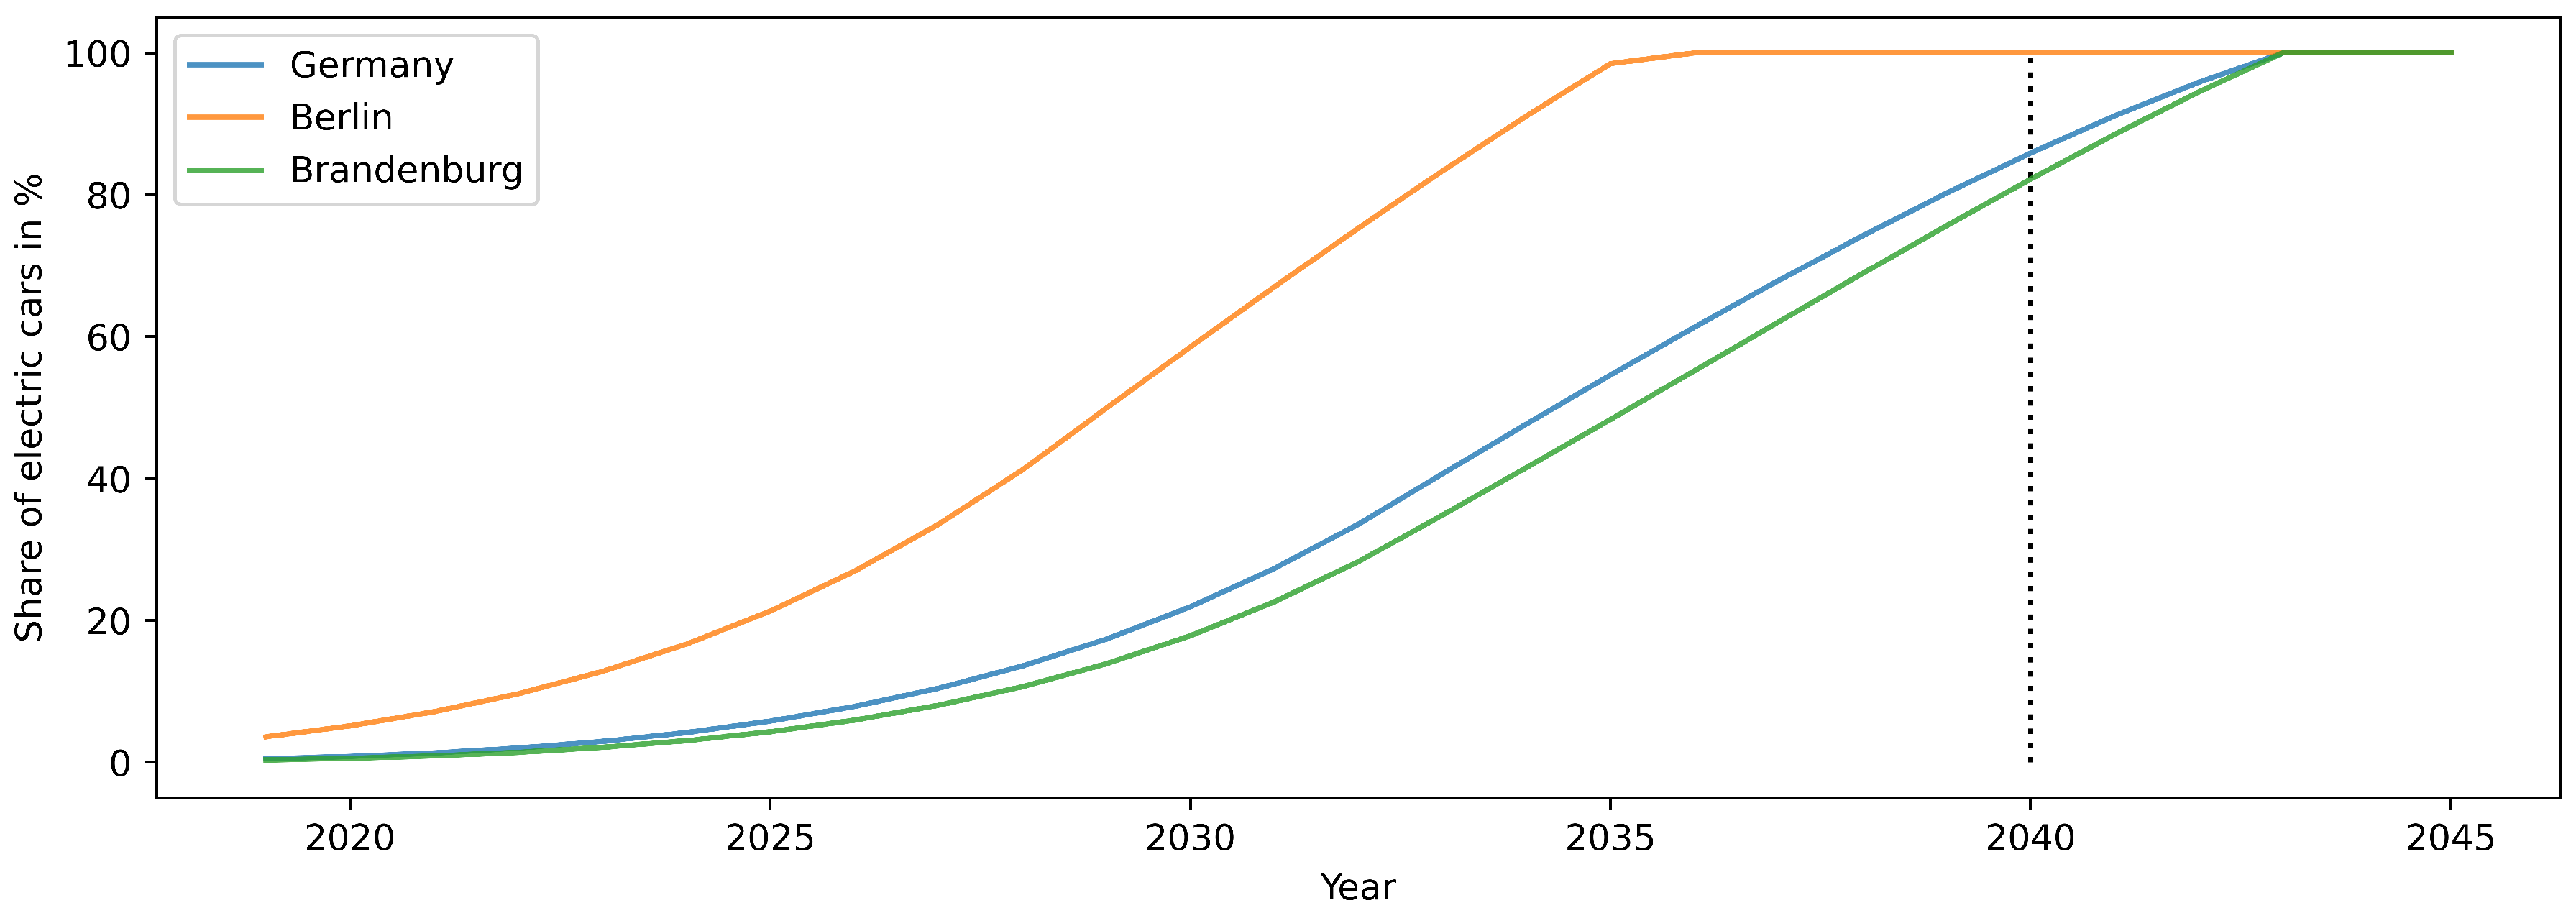
In line with current developments, the share of electric cars will rise sharply in the coming years. The increase in electric vehicles can vary from region to region. Currently, electric cars are more often registered in urban areas than in rural areas. Areas such as Berlin, which have been well above the national average electrification rate, are therefore expected to achieve full electrification a few years earlier than rural regions such as Brandenburg [4]. The calculations for Figure 1 are based on studies by Reiner Lemoine Institute and [3].
Assuming a constant level of motorisation (number of cars per inhabitant), in 2040, around 1.12 million cars will be registered in Berlin and 1.38 million cars in Brandenburg. Different development rates are applied to determine the number of electric passenger cars following the different electrification development in the urban and the rural federal state. By 2040, in Berlin, all registered passenger cars are expected to be electric, while in Brandenburg, this share amounts to around 82%.
The registered passenger cars are distributed very differently among the households. While in Berlin, only 49% of the households own a car, the figure is 79% in rural Brandenburg. The number of cars per household also differs. All characteristic values are listed in Table 1.
2.2. Driving Profiles
In a first step, driving profiles for the vehicles in both regions are created. In Germany, mobility behaviour is regularly investigated by the study “Mobility in Germany” (MiD—Mobilität in Deutschland). The survey asks around 150,000 households about their mobility behaviour, including aspects such as daily trips, the trip purpose, the time and distance travelled and the mode of transportation. The last survey dates back to 2017, with over 900,000 individual trips recorded [5].
At the Reiner Lemoine Institut, the tool SimBEV was developed to create driving profiles for passenger cars for seven different region types. The basis for the driving profiles is probability data gained from the analysis of MiD2017. The different region types are based on the RegioStaR7-classification given by the German Federal Ministry of Transport and Digital Infrastructure (BMVI) [8]. The created driving profiles include information such as the status of the car for every 15 min time step, location of the car and the energy used during a trip. Additionally, by providing probabilities of how likely it is to charge at a specific location, the output includes information on whether a charging point exists at that location and the maximum charging capacity. Possible locations for parked cars are work, business (business trips starting from work), school, shopping, private/ridesharing, leisure and home. Probabilities are based on [5,9,10].
Mobility behaviour in rural and urban areas differs mainly in the distances travelled daily and the parking possibilities. As a large city, distances travelled daily in Berlin are relatively low, and people who own a private car seldom have a private parking space available. As a predominantly rural state, Brandenburg distances are higher but fewer trips per week are made, and most people have access to an own parking space. The two study areas Berlin and Brandenburg also differ in their degree of motorisation and the parking possibilities. In Berlin, the degree of motorisation is 28.7%, and around 37% of people have access to a private parking space. In Brandenburg, the degree of motorisation is almost twice as high, with 57.2%, and the majority of people has access to an own parking space (83%) (Table 1).
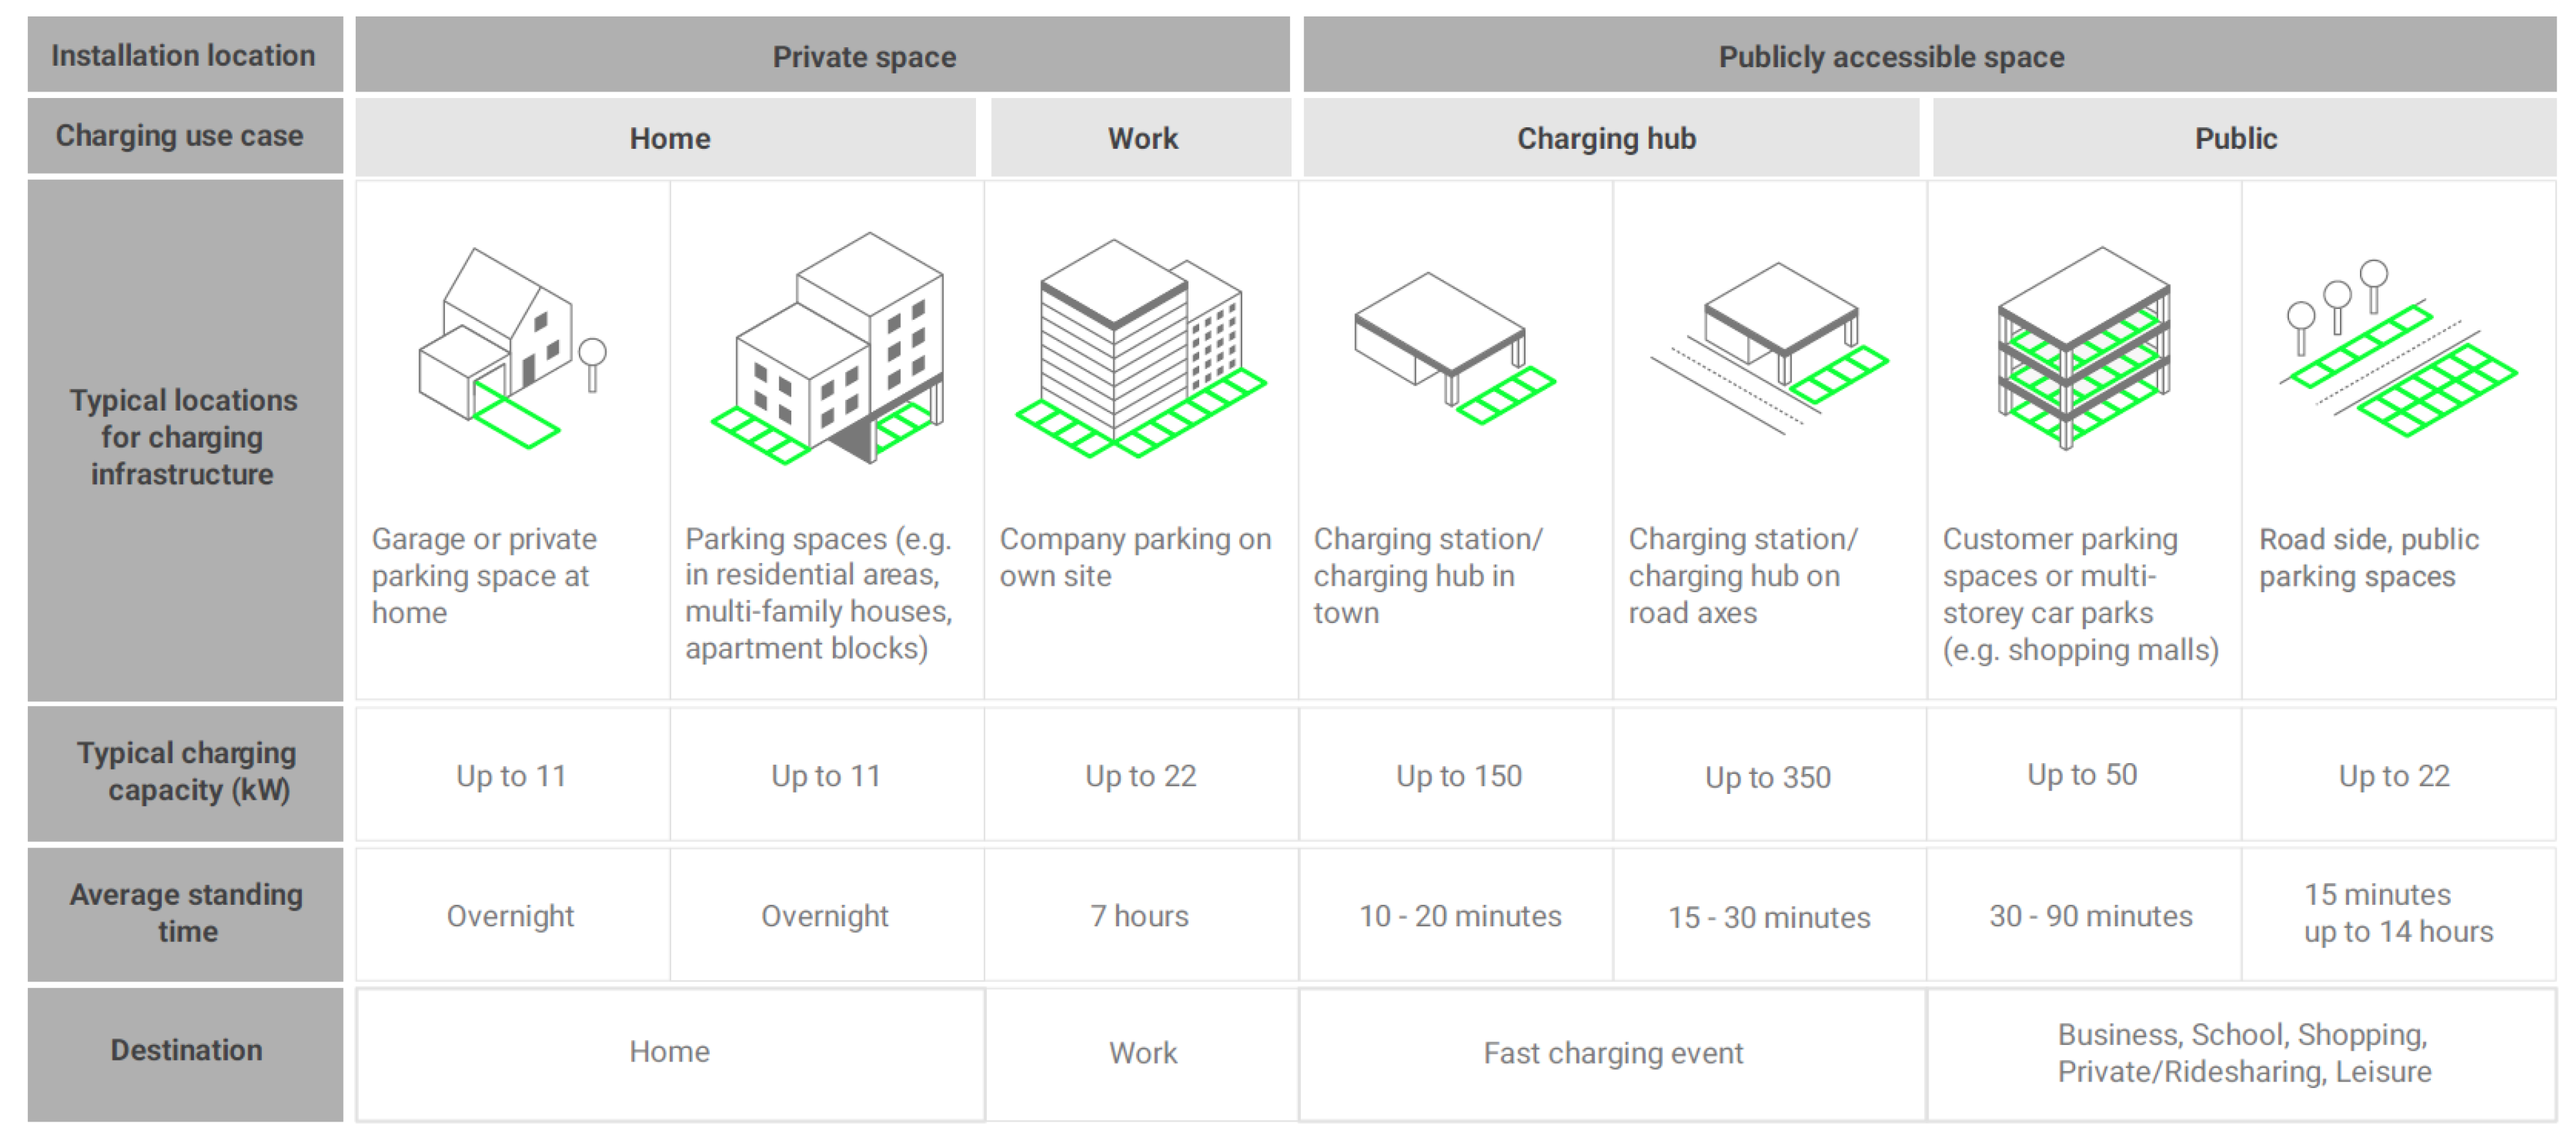
If a trip is longer than the remaining battery capacity, a fast-charging event is triggered. At a fast-charging hub, the maximum charging capacity of the charging point is defined as either 150 or 350 kW. Additionally, the destinations from the study MiD2017 are assigned to four different charging use cases, according to Figure 2: Home, Work, Charging hub and Public.
Table 2 shows the usable battery capacity, the consumption, and the maximum charging power for the vehicle classes small, medium and large. The battery and maximum charging capacity assumptions are taken from the scenario “Increased Electrification” for 2035--2042 from [11]. Energy consumptions are taken from [12], assuming a 10 per cent decrease until 2040 due to increases in energy efficiency.
Depending on the region under investigation, a representative sample of 0.1% of the required number of driving profiles is created for 14 days. For urban Berlin, this adds up to 1124 driving profiles (441 small, 519 medium and 164 large vehicles), and for rural Brandenburg, 1137 driving profiles (442 small, 555 medium and 140 large vehicles) are generated. The resulting charging profiles created by applying the charging strategies are then scaled up to the entire vehicle fleet.
2.3. Charging Strategies
EVs typically do not need to be charged with maximum power over the entire standing time. Thus, the charging power can be varied within the standing time, allowing for a lower charging power or the load to be shifted according to external signals. The effects on the power grid, therefore, depend heavily on the respective charging strategy. This paper uses the tool SpiceEV (Simulation program for individual charging events of electric vehicles) to apply three different charging strategies on the created driving profiles for urban and rural areas, to investigate the impact on use cases and the power grid.
SpiceEV calculates the actual and the desired State of Charge (SoC) for each charging event. The initial SoC is taken from SimBEV-output. The desired SoC is either defined by the following trip distance or by setting a minimum required value. Independent from the charging strategy, the specific load is distributed within the standing time until the desired SoC of 80% is reached or the standing time is over. Three charging strategies are applied for this purpose:
- Greedy: Charging is performed immediately after plugging in the vehicle at maximum power.
- Balanced: Depending on the standing time, the minimum possible charging power is calculated in each time step. As long as this charging power is below 10% of the charging point’s maximum charging power, charging does not occur. As soon as the calculated charging power exceeds the threshold value of 10%, charging occurs until the end of the standing time.
- Market-oriented: This strategy uses the stock exchange electricity price as an external price signal [13]. For the respective charging event, it is determined at which time it is most favourable to charge. In the case of negative prices, additional charging is performed beyond the desired SoC.
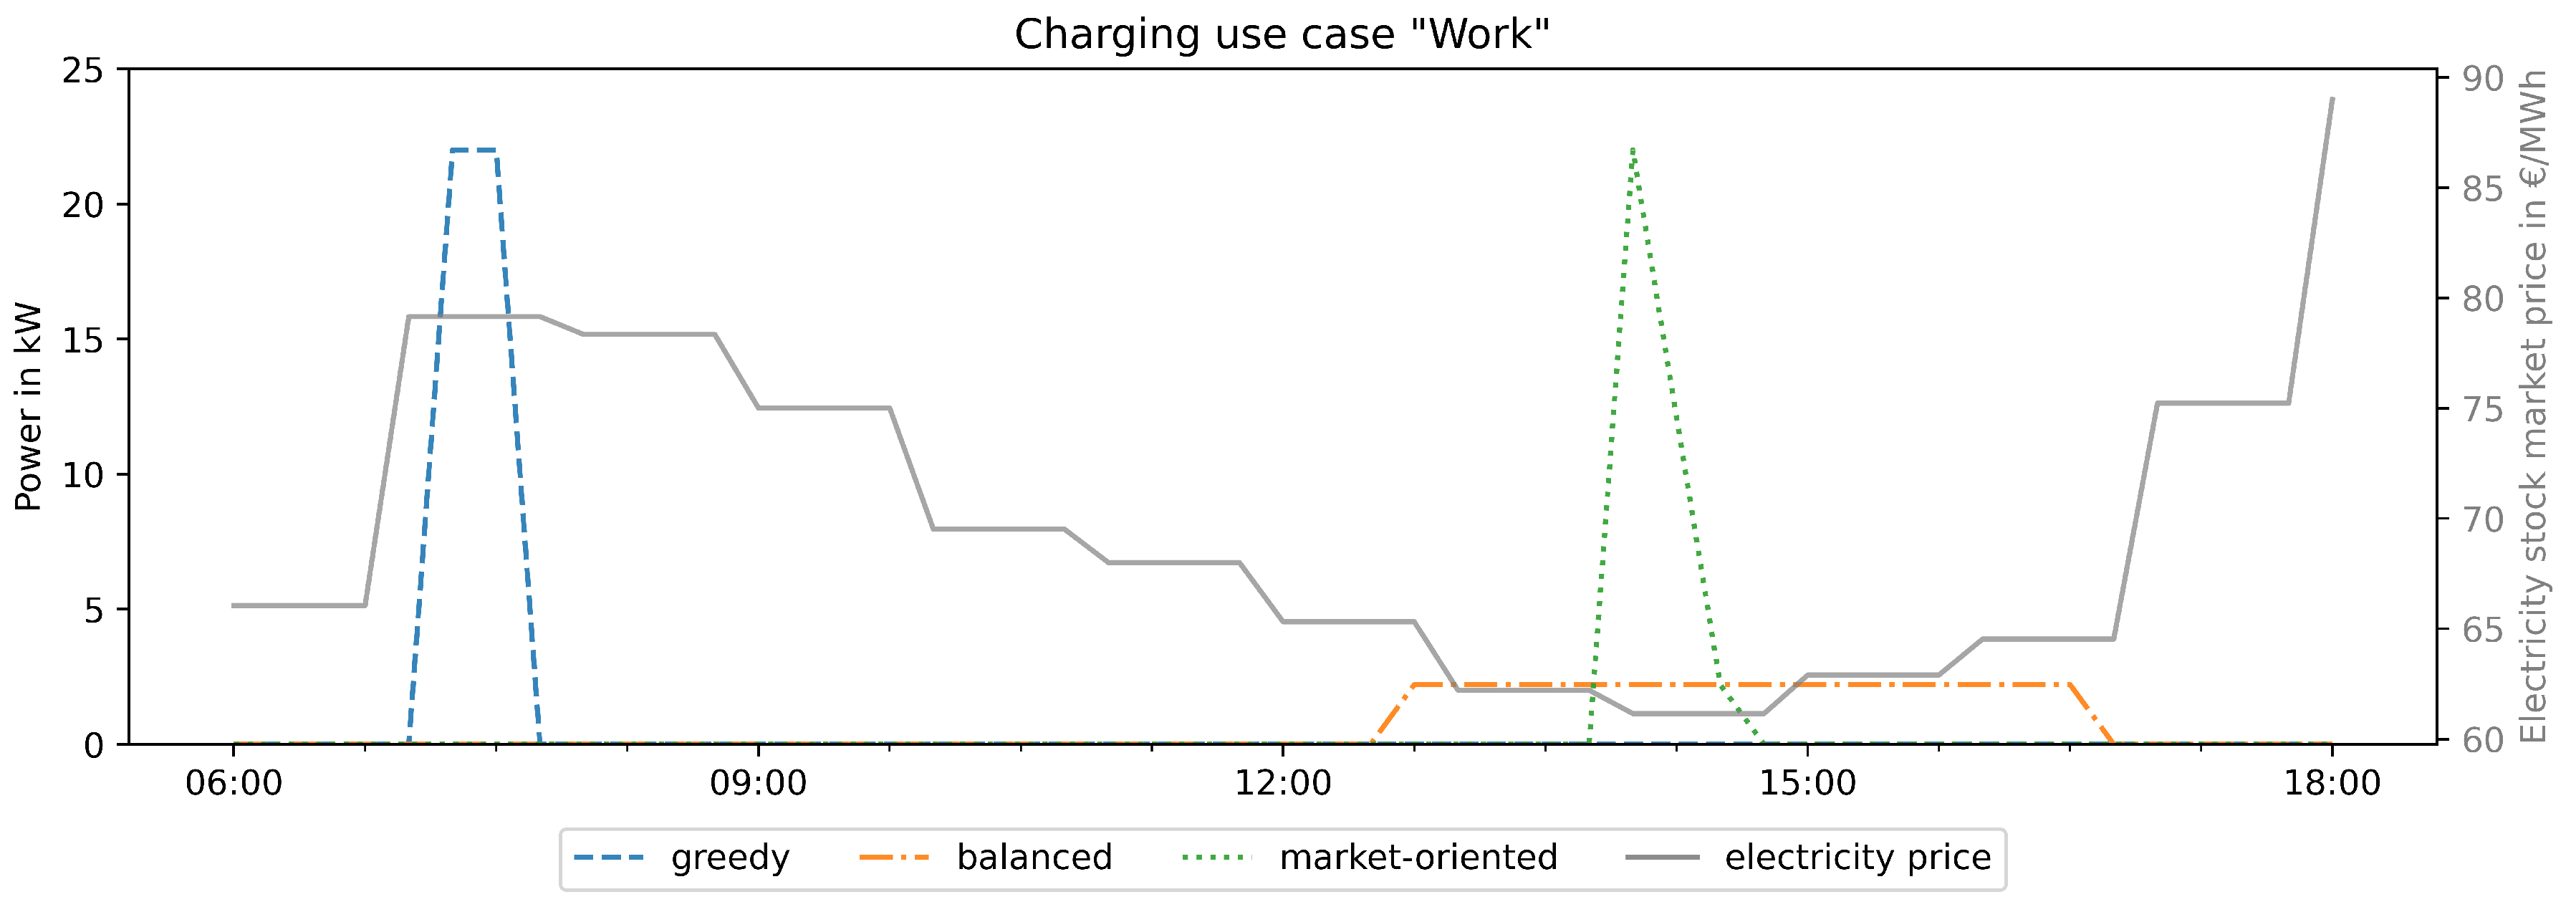
For this study, the market-oriented charging strategy is based on an immutable (historic) schedule of electricity prices. If the strategy was adopted massively, it can be assumed that the schedule of electricity prices would change. Figure 3 shows the charging profile for one medium BEV for the three charging strategies at the use case “work” on 18 March. At 07:15, the car is plugged in at the workplace, standing until 16:30. The stock exchange electricity price is lowest at 14:00 with 61.15 Euro/MWh. The charged energy within one charging event can differ between the strategies since the start SoC depends on previous charging events.
2.4. Impact on Low-Voltage Grids
EVs are primarily connected at the low-voltage grid level. Six representative synthetic low-voltage grids for rural and urban regions are examined to assess the impact of different charging strategies on grid stability [14]. While the three rural grids are typically characterized by long line distances, the other three suburban and urban grids, in contrast, are dominated by a higher number of grid consumption points in a smaller grid area. In this study, suburban and urban grids are defined as urban grids. Thus, the following assumptions made for urban grids are also applied to the two suburban grids in [14]. The low-voltage grids examined are radial networks. This grid topology is the most frequently encountered grid type at the low-voltage level due to its cost structure [15]. Radial grids are characterized by feeders to which consumers are connected and radiate from the local grid transformer. In radial grids, no rings or meshed structures exist. At times of high consumption, when BEVs charge simultaneously with high charging power, grid issues may emerge [16]. In these cases, high consumption can cause three kinds of grid issues:
- Voltage issues: They occur mainly at the end of a feeder with long line lengths. The nominal voltage is 1.0 p.u. (Per-unit-system: In electrical power engineering, the per-unit system represents an auxiliary unit of measurement related to a reference value. This allows power data to be compared directly without a conversion factor.) It should not fall below 0.9 p.u. and not exceed 1.1 p.u. at any bus within the grid [17].
- Line overloads: They occur mainly in feeders near the transformer.
- Transformer overloads.
To examine which grid issue emerges at which time and to which extent, power flow calculations are conducted. An own developed model based on the open energy network calculation program pandapower is used [18]. The simulation is based on a 15 min time resolution and 14 days time scope, defined by the period of the created driving profiles. Only general household loads are considered within the grids based on real measured power consumption profiles [19]. To better understand the impact of BEVs on grid stability, other sector-coupled consumers or grid components, such as heat pumps, decentralized energy production units or stationary energy storage units, are not considered. Additional consumption or production units may superimpose the effects on the grid stability and probably lead to indistinct conclusions. Nevertheless, the interaction of different sector-coupled consumers, decentralized energy production units, and storage units appears worth investigating for future energy system planning but is not part of this study.
According to Table 1, the number of “vehicles per household”, the “electrification rate”, and the “car owners with private parking space” are considered in the simulation for both rural and urban regions. The charging points are statistically distributed across the network. Furthermore, the examined grids are considered residential areas. Thus, only the charging profiles for use case “home” are taken into account. Table 3 shows the Number of Households and BEVs within the examined rural and urban grids.
3. Results
The examinations of this paper show the influence of the different charging strategies on peak loads in different use cases and how many charging points are occupied at the same time. In addition, it was investigated how mobility behaviour differs in urban and rural areas and what influence this has on charging performance. The power grid analyses show which effects arise in the low-voltage grid in urban and rural areas.
In the two weeks under consideration, the energy charged by the entire fleet of BEVs in Berlin sums up to 142,485 MWh (on average: 126 kWh per BEV); in rural Brandenburg, the sum is 8.60% lower with 130,228 MWh (on average: 114 kWh per BEV). Table 4 provides information on how the total amount of charged energy is distributed among the four use cases in Berlin and Brandenburg. In Brandenburg, almost half of the total energy is charged at home, whereas in Berlin, it is less than 20%. In Berlin, on the other hand, most of the energy is charged in a publicly accessible area.
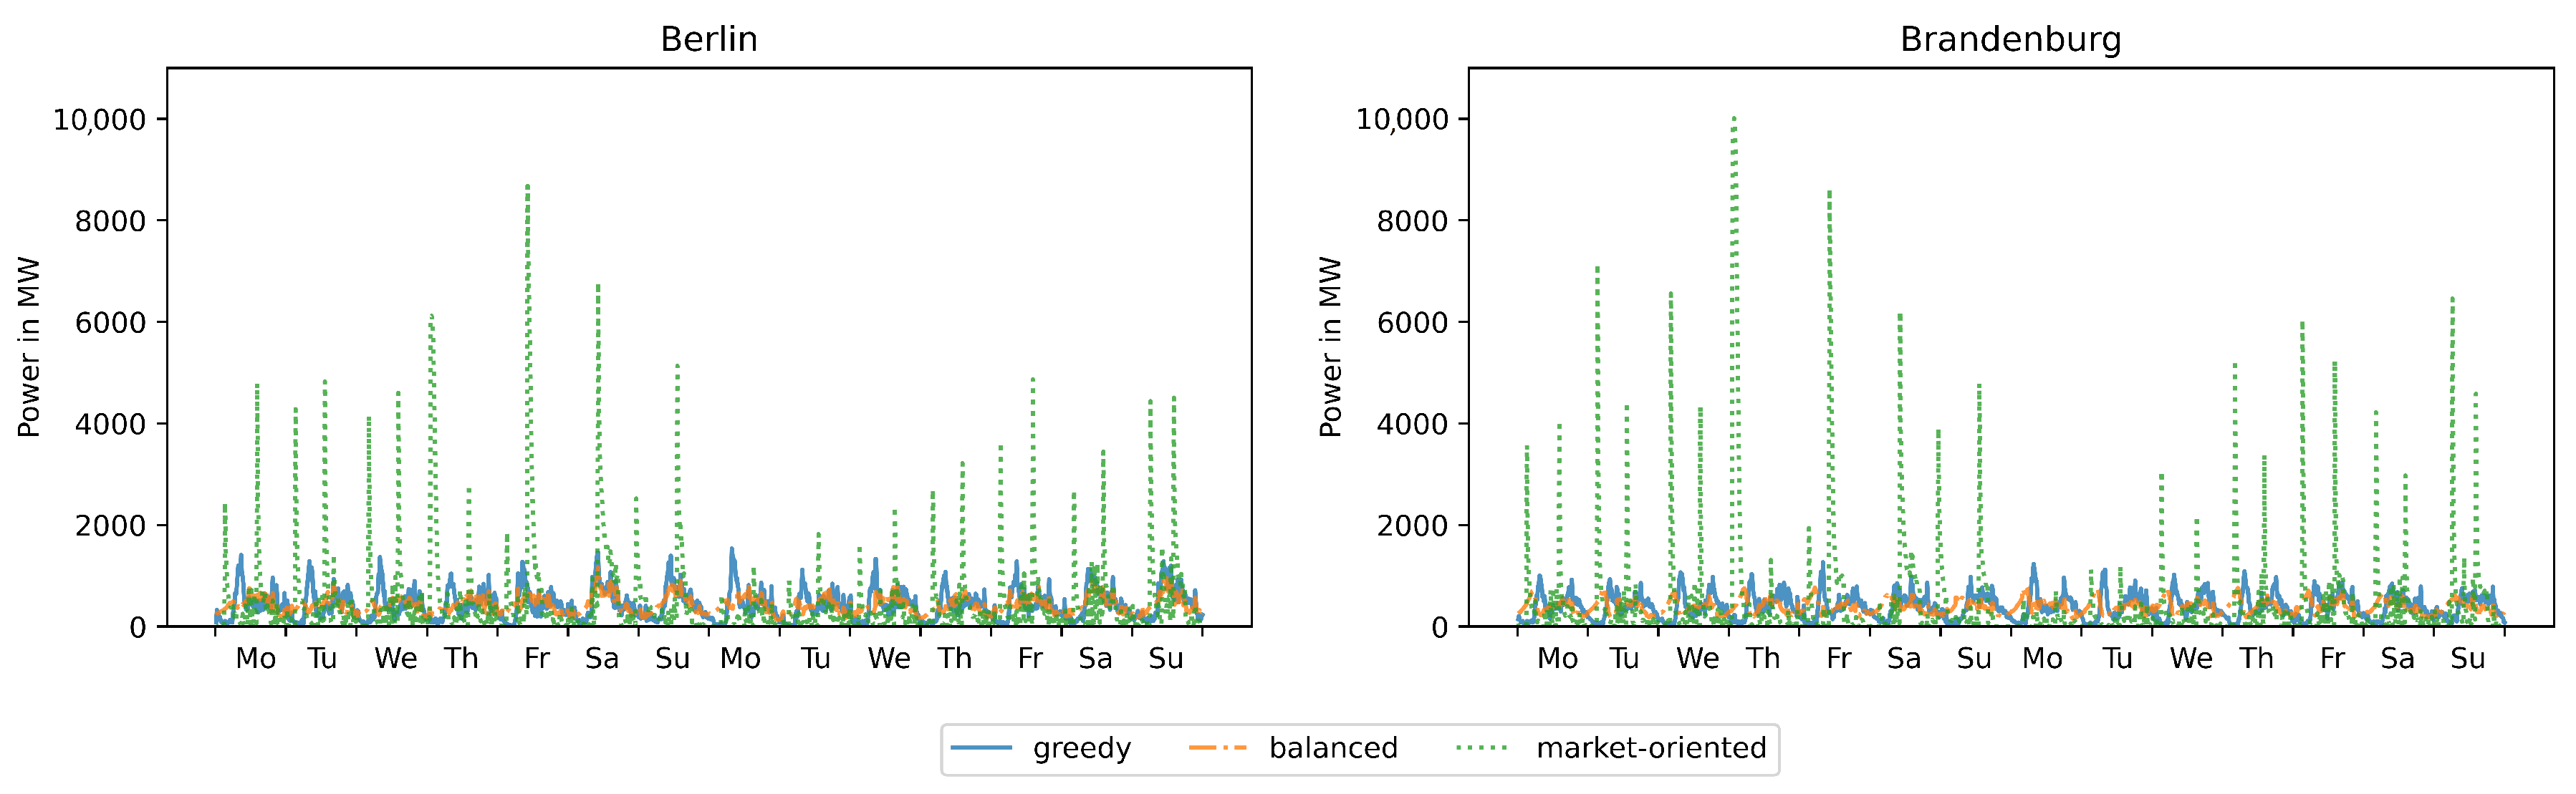
The load profile resulting from the three charging strategies in Berlin and Brandenburg are show in Figure 4. The resulting load peaks depend strongly on the charging strategy. The highest load peaks result from applying the market-oriented charging strategy because the strategy treats all vehicles individually. Thus, each BEV takes advantage of the favourable charging times. In Berlin, the maximum charging power sums up to 1537 MW for the strategy “greedy”, to 1159 MW for the strategy “balanced”, and 8678 MW for the strategy “market-oriented”. In Brandenburg, the maximum charging power for the strategy “greedy” and “balanced” are 18 to 32% lower, with 1266 MW and 793 MW, respectively. The strategy “market-oriented” in contrast results in a 15% higher power peak of 10,013 MW.
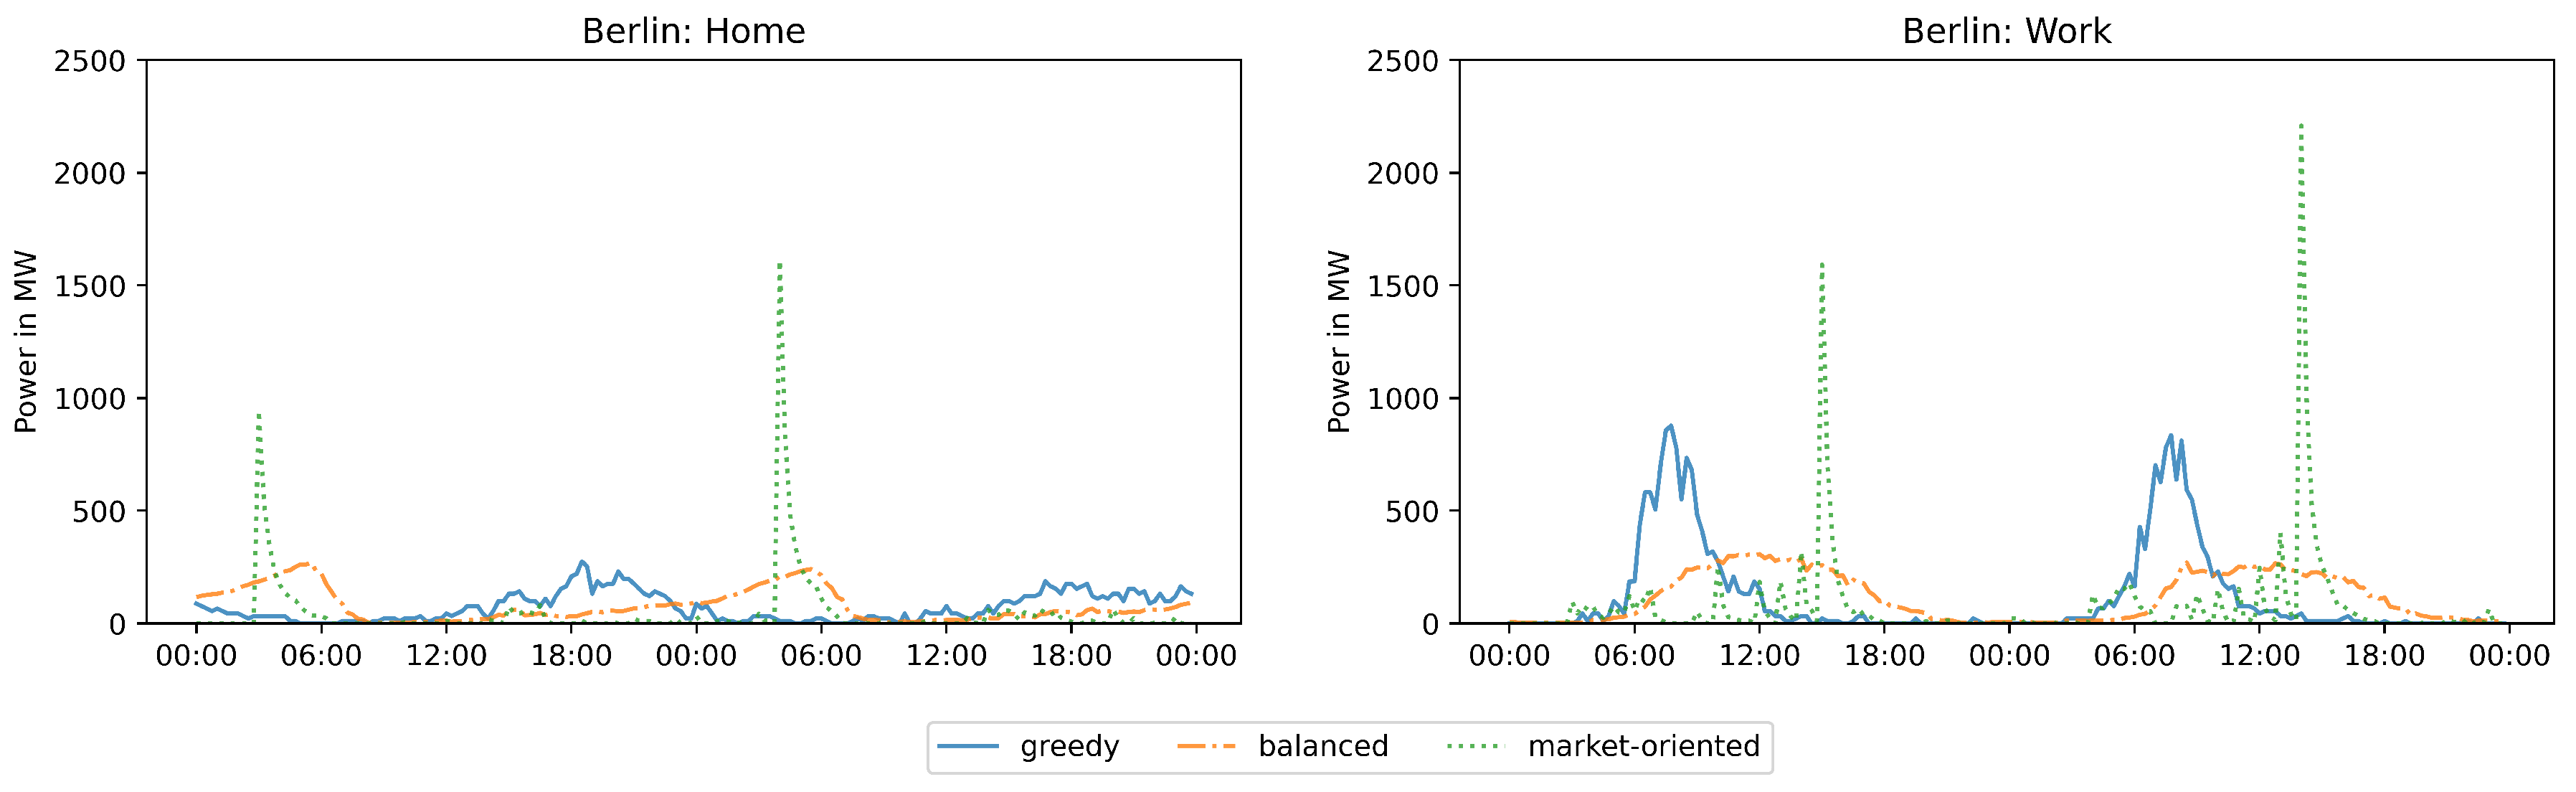
The examination of the individual use cases shows a different potential for load shifting and thus the applicability of charging strategies. Figure 5 shows the load profiles in the private space on the example of Berlin for two representative days. Long standing times in the private space offer a high potential for load shifting. By applying the strategy “greedy”, regular load peaks occur at the workplace, where many vehicles are connected in a short time window in the morning. At home, lower peaks occur because people do not get home as simultaneously as they go to work. The strategy “balanced” smooths the load profiles. At home, loads are shifted from evening to morning hours, and at work, the load is distributed relatively evenly throughout the standing time. The market-oriented charging strategy results in high peak loads both at home and at work.
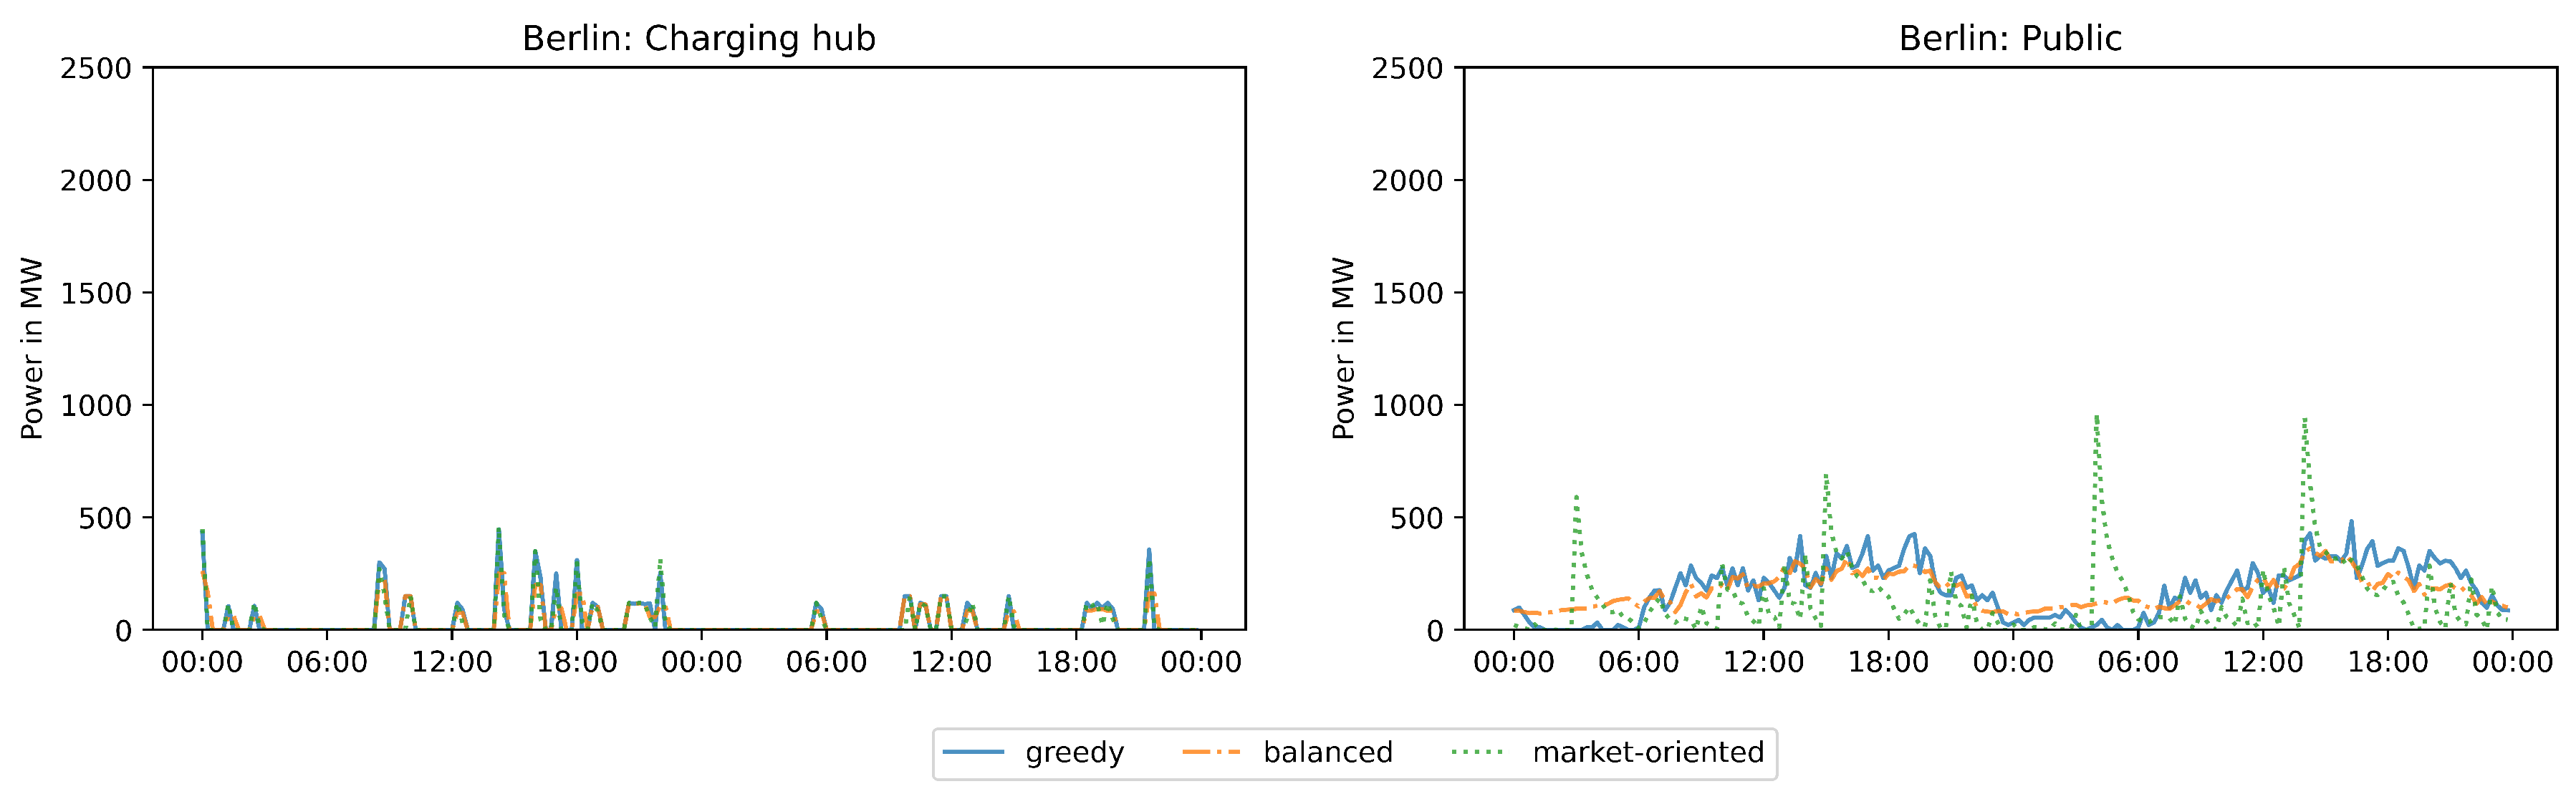
Figure 6 shows the load profiles in the publicly accessible space in Berlin for the same two days. The load profiles resulting from the charging strategies differ less than in the private space. Especially at charging hubs, the choice of charging strategy has little influence on the load profile. The need to recharge a relatively large amount of energy in a few minutes offers almost no potential to adjust the charging power. At the use case “public”, the potential for shifting loads is higher than at charging hubs. However, only minor differences can be observed between the strategies “greedy” and “balanced”. The balanced strategy manages to lower loads during the daytime by shifting loads into night hours. Load peaks result mainly from the market-oriented charging strategy. The same pattern can be observed in Brandenburg, except that higher loads occur at home and lower loads in the public space due to the different distribution of energy demand.
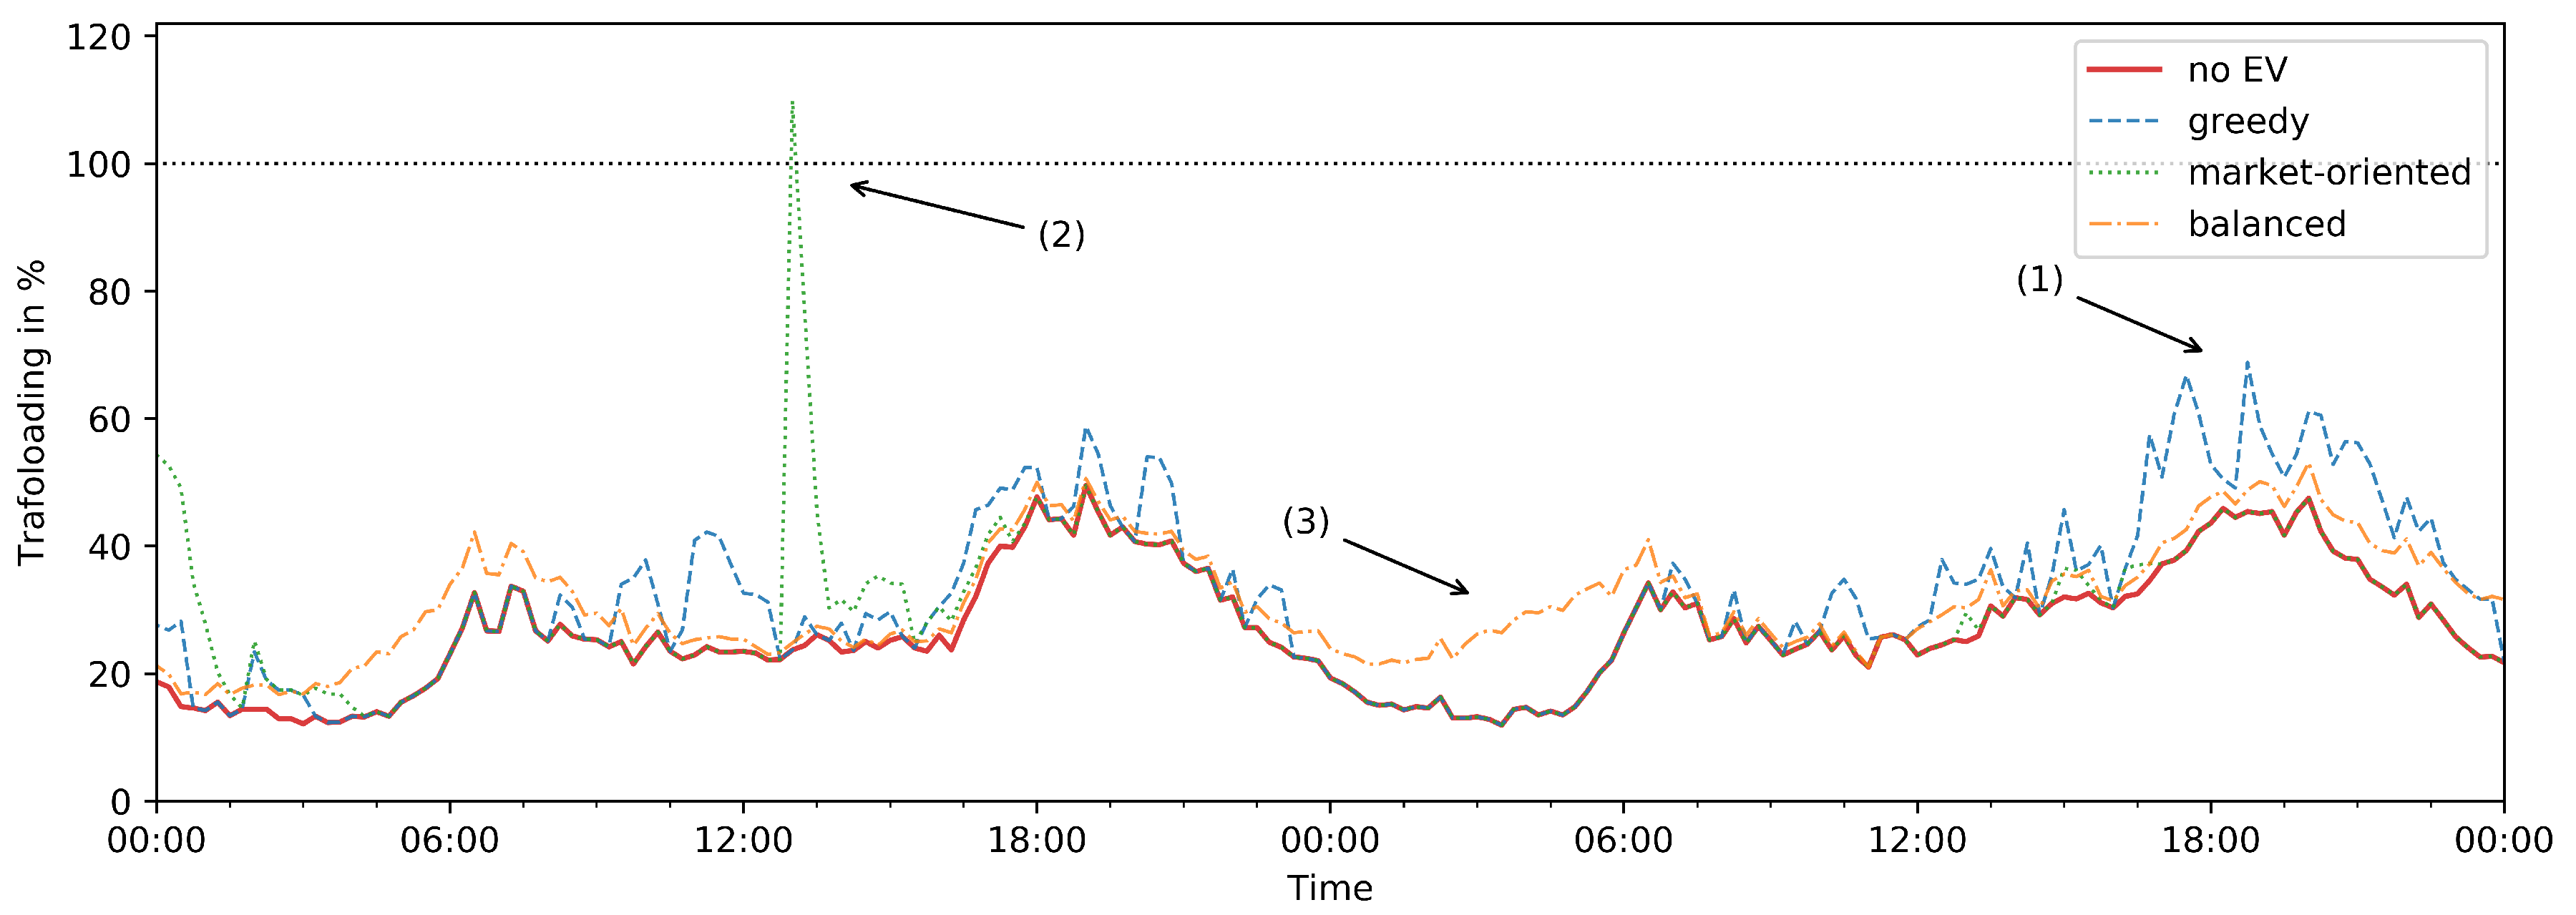
Load peaks influence the voltage stability and the load on transformers and lines in the grids under consideration. Exemplary, the transformer load of rural grid 2 for different charging strategies over two representative days is depicted in Figure 7. The total transformer load comprises the regular household load and the load caused by different charging strategies. In contrast to the transformer load without BEVs, the transformer load increases in the “greedy” strategy, especially in the evening hours when many BEVs are plugged in and charging simultaneously (1). These charging events lead to additional transformer loading up to 20%. The charging strategy “market-oriented” shows a significant increase in the load when the market price is low and cause severe high load peaks and an overload of the transformer (2). Furthermore, Figure 7 reveals that the “balanced” strategy can significantly reduce the transformer load. Load peaks, which mainly occur in the evening, are decreased, and the charging is shifted to the night when the transformer load is at its lowest (3).
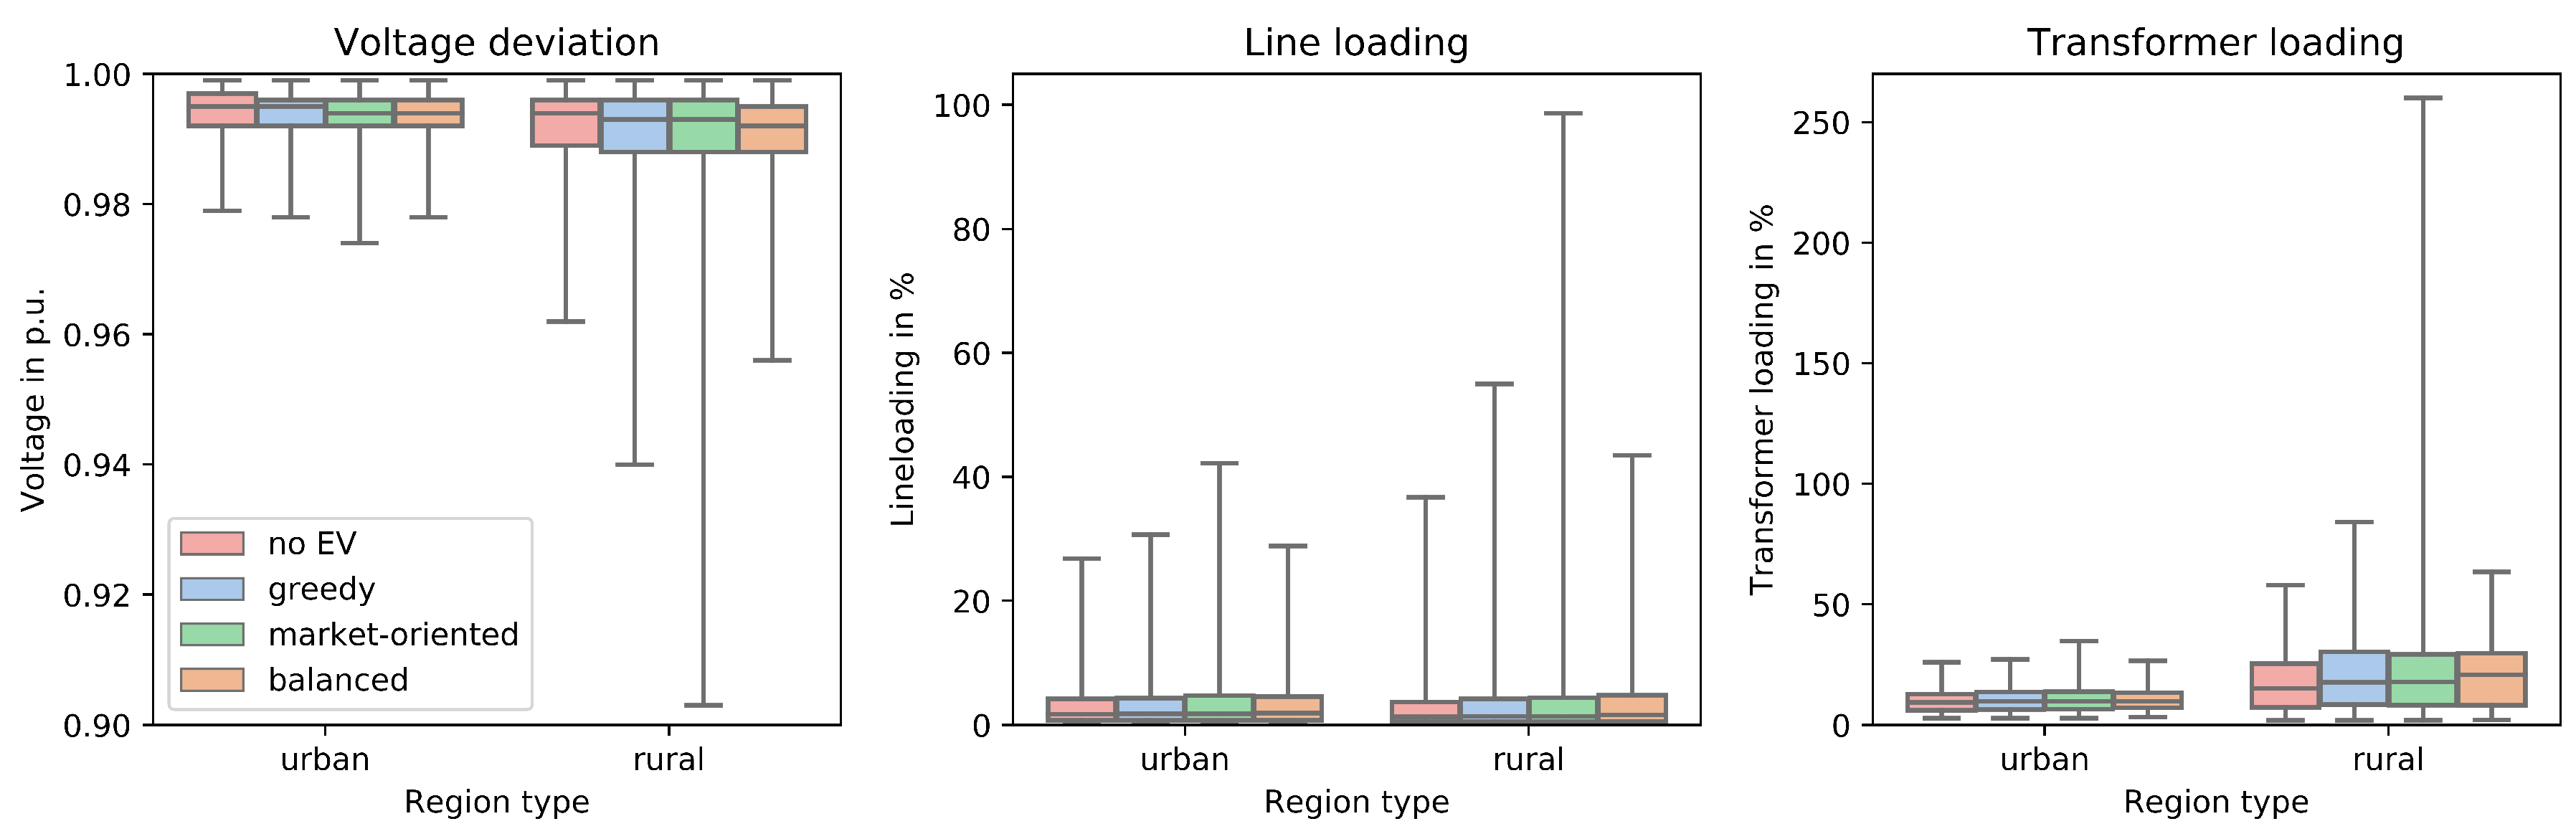
Figure 8 depicts the impact of the three different charging strategies on rural and urban grids. The region types “rural” and “urban” each contain three grids’ power flow calculation results. The results show that grid components such as transformers and lines in rural grids are exposed to much higher stress than urban grid components. This stress in rural grids is due to the higher number of BEVs with home charging point in 2040 (rural 54%, urban 18%). Furthermore, within the examined urban grids, transformers and lines can carry a higher power related to the household number within the grid. Longer line length and the resulting voltage drop over these lines additionally cause higher voltage deviation in the rural grids.
Especially in rural grids, different charging strategies appear to have a significant impact on grid issues. Charging strategies such as “greedy” and “market-oriented” lead to higher loads on transformers and lines. Specifically, within the “market-oriented” scenario, transformer overloads up to more than 250% occur several times, lines are loaded up to nearly 100%, and voltage deviations almost reach the lower voltage band of 0.9 p.u. These crucial grid issues suggest that a pure market-oriented charging strategy is not grid-serving. In contrast, the “balanced” strategy can reduce the charging peaks significantly and therefore relieve the grid to a large extent. The maxima of the voltage deviation and the transformer and line loadings are slightly higher than in the simulation without BEVs.
4. Discussion
This examination shows the impact of different charging strategies on power grids in urban metropolitan areas and predominantly rural areas using the German states Berlin and Brandenburg. In terms of charging strategies, both “greedy” and “market-oriented” represent extreme examples. The “greedy” strategy illustrates the load peaks that can occur with entirely uncontrolled charging. “Market-oriented”, on the other hand, shows the influence of a charging strategy that is purely oriented to the dynamic stock exchange electricity price. Since all vehicles individually use favourable times for charging without taking the other vehicles into account, high power peaks occur, which can cause overloads in the grid. The “balanced” strategy approach leads to an increase in the total charging power at the end of the idle times, which can be observed mainly in the use case home. Other approaches are conceivable to take advantage of the idle time and to avoid falling below the minimum charging power due to the efficiency. For example, charging could be done directly at the beginning until the desired SoC is reached, or the minimum possible charging power could also be randomly placed in the standing time, which would flatten the overall load curve further. Furthermore, the distribution among the use cases depends strongly on the defined probabilities.
In this paper, only 0.1% of the overall predicted vehicle fleet in 2040 was simulated. For the whole number of BEVs in the examined regions of more than one million vehicles, it can be assumed that the load peaks are lower than in this analysis due to a random distribution. Thus, this study represents an extreme case with relatively high simultaneity factors. In addition, a vehicle ramp-up was assumed that does not consider changes in mobility behaviour. However, a change in the total number of vehicles or people’s driving behaviour by 2040 would directly affect the charging profiles.
The study shows the effects of different charging strategies on charging profiles in individual use cases. There is little potential to shift loads at locations with short standing times, mainly in the publicly accessible space. Especially at charging hubs, there is hardly any flexibility because these fast charging events usually require a relatively large amount of energy to be recharged in only 15–30 min. At locations with long standing times on the other hand, the charging strategies have a substantial impact on the charging profiles, as can be seen for the “balanced” and “market-oriented” strategy. Especially at home and at work, the application of grid-serving charging strategies can lead to grid relief. Even a relatively simple charging strategy reduces grid issues significantly and could decrease or avoid expensive and time-consuming grid expansion in the future. In a 100% renewable energy system, the load will have to be increasingly adapted to the generation to shift it in times of very high feed-in. The strategy “market-oriented” offers the potential to balance generation and BEV consumption. At the same time, a “market-oriented” strategy must not lead to grid overloads and should consider local grid restrictions.
5. Conclusions
The analysis of the two federal states has shown that there are apparent differences between urban and rural regions. Accordingly, different approaches are needed for the grid integration of electric vehicles. Because of a distinct mobility behaviour in both regions, the energy demand is distributed differently between private and public use cases. This different mobility behaviour results in individual potentials for load shifting. More energy is charged in private locations in rural areas, where long standing times offer a high potential to adjust the charging profile by applying charging strategies. In urban areas, on the other hand, people depend more on public charging locations, which offer less flexibility to apply charging strategies.
The examination shows that a simple balanced strategy can significantly reduce grid issues such as transformer and line overloads, especially in rural areas, where many charging processes simultaneously occur at home. Purely market-oriented charging, on the other hand, causes significant load peaks. That suggests that price signals must not be determined solely by a dynamic stock exchange electricity price but must also consider the local grid situation, such as voltage violation and overloading of grid components, the number of consumers, and their charging behaviour.
Author Contributions
Conceptualization: J.G., C.D. and R.R.; Data curation: J.G.; Formal analysis: J.G. and R.R.; Investigation: J.G., C.D. and R.R.; Methodology: J.G., C.D. and R.R.; Project administration: J.G.; Resources: J.G. and R.R.; Software: J.G. and R.R.; Supervision: J.G.; Validation: C.D.; Visualization: J.G. and R.R.; Writing—original draft: J.G. and R.R.; Writing—review and editing: C.D. All authors have read and agreed to the published version of the manuscript.
Funding
This research received no external funding.
Acknowledgments
The authors gratefully thank the Reiner Lemoine Foundation for supporting this research work.
Conflicts of Interest
The authors declare no conflict of interest.
Abbreviations
The following abbreviations are used in this manuscript:
| BEV | Battery electric vehicle |
| SoC | State of charge |
References
- Burger, B. Energy-Charts. Technical Report, Fraunhofer Institute for Solar Energy Systems ISE. Available online: https://energy-charts.info/?l=en&c=DE (accessed on 23 February 2021).
- Kraftfahrt-Bundesamt. Jahresbilanz 2020. Available online: https://www.kba.de/DE/Statistik/Fahrzeuge/Neuzulassungen/Jahresbilanz_Neuzulassungen/jahresbilanz_node.html (accessed on 1 October 2021).
- National Platform Future of Mobility—Working Group 5. Demand-Oriented and Economical Public Charging Infrastructure—Plea for a Dynamic NPM Model (German Report); Technical Report; National Platform Future of Mobility: Berlin, Germany, 2020.
- Reiner Lemoine Institut.; Localiser RLI.; SPV Spreeplan Verkehr. Studie Elektromobilität Berlin 2025+. Berlin. June 2021. Available online: https://www.parlament-berlin.de/adosservice/18/Haupt/vorgang/h18-3262.C-v.pdf (accessed on 11 September 2021).
- Nobis, C.; Kuhnimhof, T. MID2017—Mobilität in Deutschland 2017; Technical Report; On behalf of Federal Ministry of Transport and Digital Infrastructure (BMVI): Bonn/Berlin, Germany, 2018.
- Bund-Länder Demographie-Portal. Entwicklung der Bevölkerungszahl nach Variante 2. Available online: https://www.demografie-portal.de/DE/Fakten/bevoelkerungszahl.html?nn=676784 (accessed on 18 September 2021).
- Kraftfahrt-Bundesamt. Bestand an Kraftfahrzeugen und Kraftfahrzeuganhängern nach Bundesländern, Fahrzeugklassen und ausgewählten Merkmalen (FZ 27). Flensburg, March 2021. Available online: https://www.kba.de/EN/Statistik_en/Fahrzeuge_en/fahrzeuge_node_en.html (accessed on 17 April 2021).
- Federal Ministry of Transport and Digital Infrastructure (BMVI). Regionalstatistische Raumtypologie (RegioStaR). November 2020. Available online: https://www.bmvi.de/SharedDocs/DE/Artikel/G/regionalstatistische-raumtypologie.html (accessed on 17 March 2021).
- Helfenbein, K. Analyse des Einflusses Netzdienlicher Ladestrategien auf Verteilnetze Aufgrund der Zunehmenden Netzintegration von Elektrofahrzeugen. Master’s Thesis, Hochschule für Technik und Wirtschaft Berlin—University of Applied Sciences, Berlin, Germany, April 2021. [Google Scholar]
- Der Maur, A.A.; Nils, B.; Kutschera, M. Lade-Report: Entwicklung der öffentlich Zugänglichen Ladeinfrastruktur für die Elektromobilität sowie Vergleich der Ladetarife in Deutschland. February 2021. Available online: https://www.prognos.com/sites/default/files/2021-01/20200207_prognos_lade-report_2020_01.pdf (accessed on 17 March 2021).
- Kaul, A.; Hagedorn, M.; Heilert, D. Automobile Wertschöpfung 2030/2050. December 2019. Available online: https://www.bmwi.de/Redaktion/DE/Publikationen/Studien/automobile-wertschoepfung-2030-2050.pdf?__blob=publicationFile&v=16 (accessed on 17 March 2021).
- Pasaoglu, G.; Fiorello, D.; Zani, L.; Martino, A.; Zubaryeva, A.; Thiel, C. Projections for Electric Vehicle Load Profiles in Europe Based on Travel Survey Data. European Commission, DG JRC, Institute for Energy and Transport, 2013. Available online: https://core.ac.uk/download/pdf/38626161.pdf (accessed on 15 April 2021).
- Bundesnetzagentur. SMARD—Electricity market data for Germany. Available online: https://www.smard.de/en (accessed on 1 May 2021).
- Meinecke, S.; Sarajlic, D.; Drauz, S.R.; Klettke, A.; Lauven, L.; Rehtanz, C.; Moser, A.; Braun, M. SimBench—A Benchmark Dataset of Electric Power Systems to Compare Innovative Solutions based on Power Flow Analysis. Energies 2020, 13, 3290. [Google Scholar] [CrossRef]
- Büchner, J.; Katzfey, J.; Flörcken, O.; Moser, A.; Schuster, H.; Dierkes, S.; van Leeuwen, T.; Verheggen, L.; Uslar, M.; van Amelsvoort, M. Moderne Verteilernetze für Deutschland (Verteilernetzstudie); Technical Report; E-Bridge—Kompetenz in Energie, Institut für Elektrische Anlagen und Energiewirtschaft (IAEW), OFFIS: Aachen, Germany, 2014. [Google Scholar]
- Rizvi, S.A.A.; Xin, A.; Masood, A.; Iqbal, S.; Jan, M.U.; Rehman, H. Electric Vehicles and their Impacts on Integration into Power Grid: A Review. In Proceedings of the 2018 2nd IEEE Conference on Energy Internet and Energy System Integration (EI2), Beijing, China, 20–22 October 2018; pp. 1–6. [Google Scholar] [CrossRef]
- DIN EN 50160:2011-02. Merkmale der Spannung in öffentlichen Elektrizitätsversorgungsnetzen; Deutsche Fassung EN 50160:2010 + Cor.:2010; Beuth Verlag GmbH: Berlin, Germany, 2011. [Google Scholar]
- Thurner, L.; Scheidler, A.; Schäfer, F.; Menke, J.; Dollichon, J.; Meier, F.; Meinecke, S.; Braun, M. Pandapower—An Open-Source Python Tool for Convenient Modeling, Analysis, and Optimization of Electric Power Systems. IEEE Trans. Power Syst. 2018, 33, 6510–6521. [Google Scholar] [CrossRef] [Green Version]
- Tjaden, T.; Bergner, J.; Weniger, J.; Quaschning, V. Repräsentative Elektrische Lastprofile für Wohngebäude in Deutschland auf 1-Sekündiger Datenbasis; Datensatz, lizenz: Cc-by-nc-4.0, heruntergeladen am 03.03.2020; Hochschule für Technik undWirtschaft (HTW): Berlin, Germany, 2015. [Google Scholar]
Figure 1.
Ramp-up of electromobility in Germany, Berlin and Brandenburg.

Figure 2.
Characteristics of different charging use cases.

Figure 3.
Different charging strategies for one passenger car at work.

Figure 4.
Total load profile for each charging strategy for Berlin and Brandenburg for 2 weeks.

Figure 5.
Load profile for each charging strategy in Berlin for 2 days in the private space.

Figure 6.
Load profile for each charging strategy in Berlin for 2 days in the public space.

Figure 7.
Load profile for each charging strategy in Berlin for 2 days in the private space.

Figure 8.
Load profile for each charging strategy in Berlin for 2 days in the private space.


Table 1.
Comparison of the electric passenger car development of Berlin and Brandenburg in 2040 [5,6,7].
| Berlin | Brandenburg | |
|---|---|---|
| Population | 3,919,000 | 2,418,000 |
| Degree of motorisation | 287 cars per 1000 inhabitants | 572 cars per 1000 inhabitants |
| Number of vehicles | 1,124,000 | 1,383,000 |
| Electrification rate | 100% | 82.2% |
| Number of BEVs | 1,124,000 | 1,137,000 |
| Vehicles per household | 0.6 | 1.1 |
| Share of households with 0/1/2/3+ vehicles | 51%/43%/6%/0% | 21%/54%/22%/2% |
| Car owners with private parking space | 37% | 83% |
| Vehicle classes small/medium/large | 39%/46%/14% | 39%/49%/12% |
| Battery Capacity | Consumption | Max. Charging Capacity | |
|---|---|---|---|
| BEV small | 70 kWh | 0.126 kWh/km | 120 kW |
| BEV medium | 100 kWh | 0.148 kWh/km | 350 kW |
| BEV large | 120 kWh | 0.171 kWh/km | 350 kW |
Table 3.
Number of households and BEVs within the examined grids [14].
Table 3.
Number of households and BEVs within the examined grids [14].
| Rural Grid 1 | Rural Grid 2 | Rural Grid 3 | Urban Grid 1 | Urban Grid 2 | Urban Grid 3 | |
|---|---|---|---|---|---|---|
| Number of households | 13 | 99 | 118 | 41 | 104 | 111 |
| Number of BEVs with home charging place | 9 | 69 | 83 | 10 | 23 | 25 |
Table 4.
Energy charged by the entire electric vehicle fleet in the four use cases considered in Berlin and Brandenburg.
Table 4.
Energy charged by the entire electric vehicle fleet in the four use cases considered in Berlin and Brandenburg.
| Home | Work | Charging Hub | Public | |
|---|---|---|---|---|
| Berlin | 27,620.6 MWh 19.38% | 32,413.3 MWh 22.75% | 13,211.5 MWh 9.27% | 69,240.1 MWh 48.59% |
| Brandenburg | 58,924.5 MWh 45.25% | 27,415.3 MWh 21.05% | 5,978.9 MWh 4.59% | 37,908.9 MWh 29.11% |
Publisher’s Note: MDPI stays neutral with regard to jurisdictional claims in published maps and institutional affiliations. |
© 2021 by the authors. Licensee MDPI, Basel, Switzerland. This article is an open access article distributed under the terms and conditions of the Creative Commons Attribution (CC BY) license (https://creativecommons.org/licenses/by/4.0/).
Share and Cite
MDPI and ACS Style
Gemassmer, J.; Daam, C.; Reibsch, R. Challenges in Grid Integration of Electric Vehicles in Urban and Rural Areas. World Electr. Veh. J. 2021, 12, 206. https://0-doi-org.brum.beds.ac.uk/10.3390/wevj12040206
AMA Style
Gemassmer J, Daam C, Reibsch R. Challenges in Grid Integration of Electric Vehicles in Urban and Rural Areas. World Electric Vehicle Journal. 2021; 12(4):206. https://0-doi-org.brum.beds.ac.uk/10.3390/wevj12040206
Chicago/Turabian StyleGemassmer, Jakob, Carolin Daam, and Ricardo Reibsch. 2021. "Challenges in Grid Integration of Electric Vehicles in Urban and Rural Areas" World Electric Vehicle Journal 12, no. 4: 206. https://0-doi-org.brum.beds.ac.uk/10.3390/wevj12040206