
Prediction of Esophageal Varices Based on Serum-Ascites Albumin Gradient in Cirrhotic Patients


1
Department of Internal Medicine, Faculty of Medicine, University of Medicine and Pharmacy at Ho Chi Minh City, Ho Chi Minh City 72714, Vietnam
2
Department of Gastroenterology, Cho Ray Hospital, Ho Chi Minh City 72713, Vietnam
*
Author to whom correspondence should be addressed.
Gastroenterol. Insights 2021, 12(2), 270-277; https://0-doi-org.brum.beds.ac.uk/10.3390/gastroent12020023
Submission received: 28 May 2021
/
Accepted: 1 June 2021
/
Published: 2 June 2021
(This article belongs to the Section Liver)
Abstract
:Background: Ascites and esophageal varices (EV) are the most common complications of portal hypertension, with an incidence of approximately 50%. Since effective preventive modalities have been established for variceal hemorrhage, early detection of EV is critical for primary prevention of bleeding. Serum-ascites albumin gradient (SAAG) can be considered an indirect parameter for the detection of EV and is useful in regions where there is a shortage of human and material resources to perform upper gastrointestinal endoscopy (UGE). The aim was to evaluate the role of serum-ascites albumin gradient (SAAG) in the prediction of esophageal varices (EV) in cirrhotic patients with ascites. Methods: All cirrhotic patients with ascites, identified by ultrasonography, who underwent measurement of SAAG, were included in this study. All patients underwent upper gastrointestinal endoscopy (UGE) for assessment of the presence and size of EV. Results: The study included 80 cirrhotic patients with ascites. The main causes of cirrhosis were alcohol intake (37.5%), hepatitis B virus (25.0%), and hepatitis C virus (15.0%). Patients with SAAG values > 1.75 g/dL demonstrated EV with a sensitivity and specificity of 78.4% and 83.3%, respectively. SAAG values > 1.8 g/dL were associated with the risk of large EV with AUC of 0.856, sensitivity of 88.24%, and specificity of 50.79%. The correlation coefficient (r) between SAAG and EV was 0.429, which was statistically significant (p < 0.001). Conclusions: Cirrhotic patients with SAAG values ≥ 1.8 have a higher risk of large EV. In particular, those with values > 1.9 who have higher possibility of bleeding must undergo upper GI endoscopy.
1. Introduction
Cirrhosis is the final stage of chronic liver disease. Ascites and esophageal varices (EVs) are the most common complications of portal hypertension (PHT), with an incidence of approximately 50% [1]. Since effective preventive modalities have been established for variceal hemorrhage, early detection of EVs is critical for primary prevention of bleeding. Despite limitations, upper gastrointestinal endoscopy (UGE) remains the gold standard for screening [2,3]. However, many studies have been conducted to predict PHT and EV with a diverse rate of accuracy. UGE screening is recommended at the time of diagnosis in patients with cirrhosis to identify those at high risk of bleeding and who may benefit from primary prophylaxis, since EVs are an independent predictive factor and an early complication of cirrhosis. The test should also be repeated during the follow-up of patients with cirrhosis without EVs, who are at risk of bleeding, with or without decompensation [1]. UGE remains the gold standard to screen patients for variceal development; however, this procedure has many limitations such as being relatively expensive, invasive, and restrictive [4]. Such a screening test should be simple, rapid, reproducible, and inexpensive [5,6,7]. The serum-ascites albumin gradient (SAAG) is a minimally invasive method that is precise and has already been described in the classification of ascitic fluid based on the absence or presence of PHT [8]. Studies have been performed to identify non-invasive parameters for the prediction of EVs in patients newly diagnosed with cirrhosis [5]. SAAG can be considered an indirect parameter for the detection of EVs and is useful in regions where there is a shortage of human and material resources to perform UGE. The aim of this study was to evaluate the role of SAAG in the prediction of EVs in cirrhotic patients with ascites.
2. Material and Methods
This was a descriptive cross-sectional study of data from the hospital records of patients in the Department of Gastroenterology, Cho Ray Hospital, conducted from December 2019 to May 2020. The Research Ethics Committee of the University of Medicine and Pharmacy at Ho Chi Minh City, Vietnam approved this study.
2.1. Inclusion Criteria
All newly diagnosed cirrhotic patients with ascites were confirmed based on physical examination, biochemical parameters, and abdominal ultrasound. Patients without any history of hematemesis and/or melena were included in the study.
2.2. Exclusion Criteria
Pregnant patients, those with bleeding from existing PHT or AIDS, and those currently on beta-blockers were excluded from the present study. Patients with ascites due to etiologies other than cirrhosis, such as congestive heart failure, abdominal tuberculosis, hepatocellular carcinoma, renal failure, and intra-abdominal malignancy, as well as patients with albumin transfusion were excluded.
2.3. Study Process
All patients in this study underwent complete clinical evaluation. Serum and ascitic fluid albumin levels were determined using standard techniques [1]. SAAG was calculated using the following formula: SAAG (g/dL) = (serum albumin) − (albumin level of ascitic fluid). The two values were measured at the same time. Patients with cirrhosis are often subjected to screening endoscopy for varices in order to plan prophylactic therapy and/or follow-up. Endoscopy was performed according to standard guidelines [7]. Informed consent was obtained from the patients prior to inclusion in the study.
2.4. Statistical Analysis
Data were collected in a predetermined manner and results were analyzed using the Statistical Package for Social Sciences (SPSS) program, version 20.0. The chi-square test (χ2) and Fisher’s exact test were used to calculate differences between qualitative variables as indicated. Quantitative data are expressed as mean ± SD. Independent t-test was used to calculate the differences between quantitative variables in the two groups. One-way ANOVA F-test was used to calculate the differences between quantitative variables in more than two groups. All statistical comparisons were conducted with a significance level of p ≤ 0.05, wherein a p value of < 0.001 indicated a highly significant difference, while a value > 0.05 indicated non-significant difference. The 95% confidence interval (CI), positive predictive value (PPV), negative predictive value (NPV), and area under the ROC curve (AUC) were calculated.
3. Results
The study included 80 cirrhotic patients with ascites during the aforementioned period. There were 60 men and 20 women (male/female ratio of 4/1).
3.1. Baseline Characteristics
The average age of the patients was 54.59 ± 13.23 years. The most represented age group was 18 to 79 years. The main causes of cirrhosis were alcohol intake (37.5%) and hepatitis B virus (HBV, 25.0%) and hepatitis C virus (HCV, 15.0%) infection.
Mean values ± SD of serum albumin, ascitic fluid albumin, total bilirubin, and platelet count were 2.49 ± 0.52 g/dL, 0.53 ± 0.54 g/dL, 5.39 ± 7.12 mg/dL, and 138.35 ± 86.54 G/L, respectively (Table 1).
Distribution according to the Child–Pugh classification showed that patients in class C had the highest rate at 72.5%, with only about a quarter of patients in classes A and B. The mean score was 10.48 ± 1.71. In our study, there were 74 patients with EVs (92.50%), of which the majority had EVs grades II and III (46 patients, 62.16%).
EVs were more frequent in patients with high SAAG values of ≥1.5 g/dL (p < 0.0001) (Table 2).
3.2. Predictive Factors of EVs
Results of the univariate analysis showed that factors such as platelet count, peritoneal fluid albumin level, SAAG, and Child–Pugh score were related to the occurrence of EVs on endoscopy results (Table 3).
Multivariate analysis showed that only SAAG was an independent predictor of EVs on endoscopy results with p < 0.05 (Table 4).
3.3. SAAG to Predict EVs
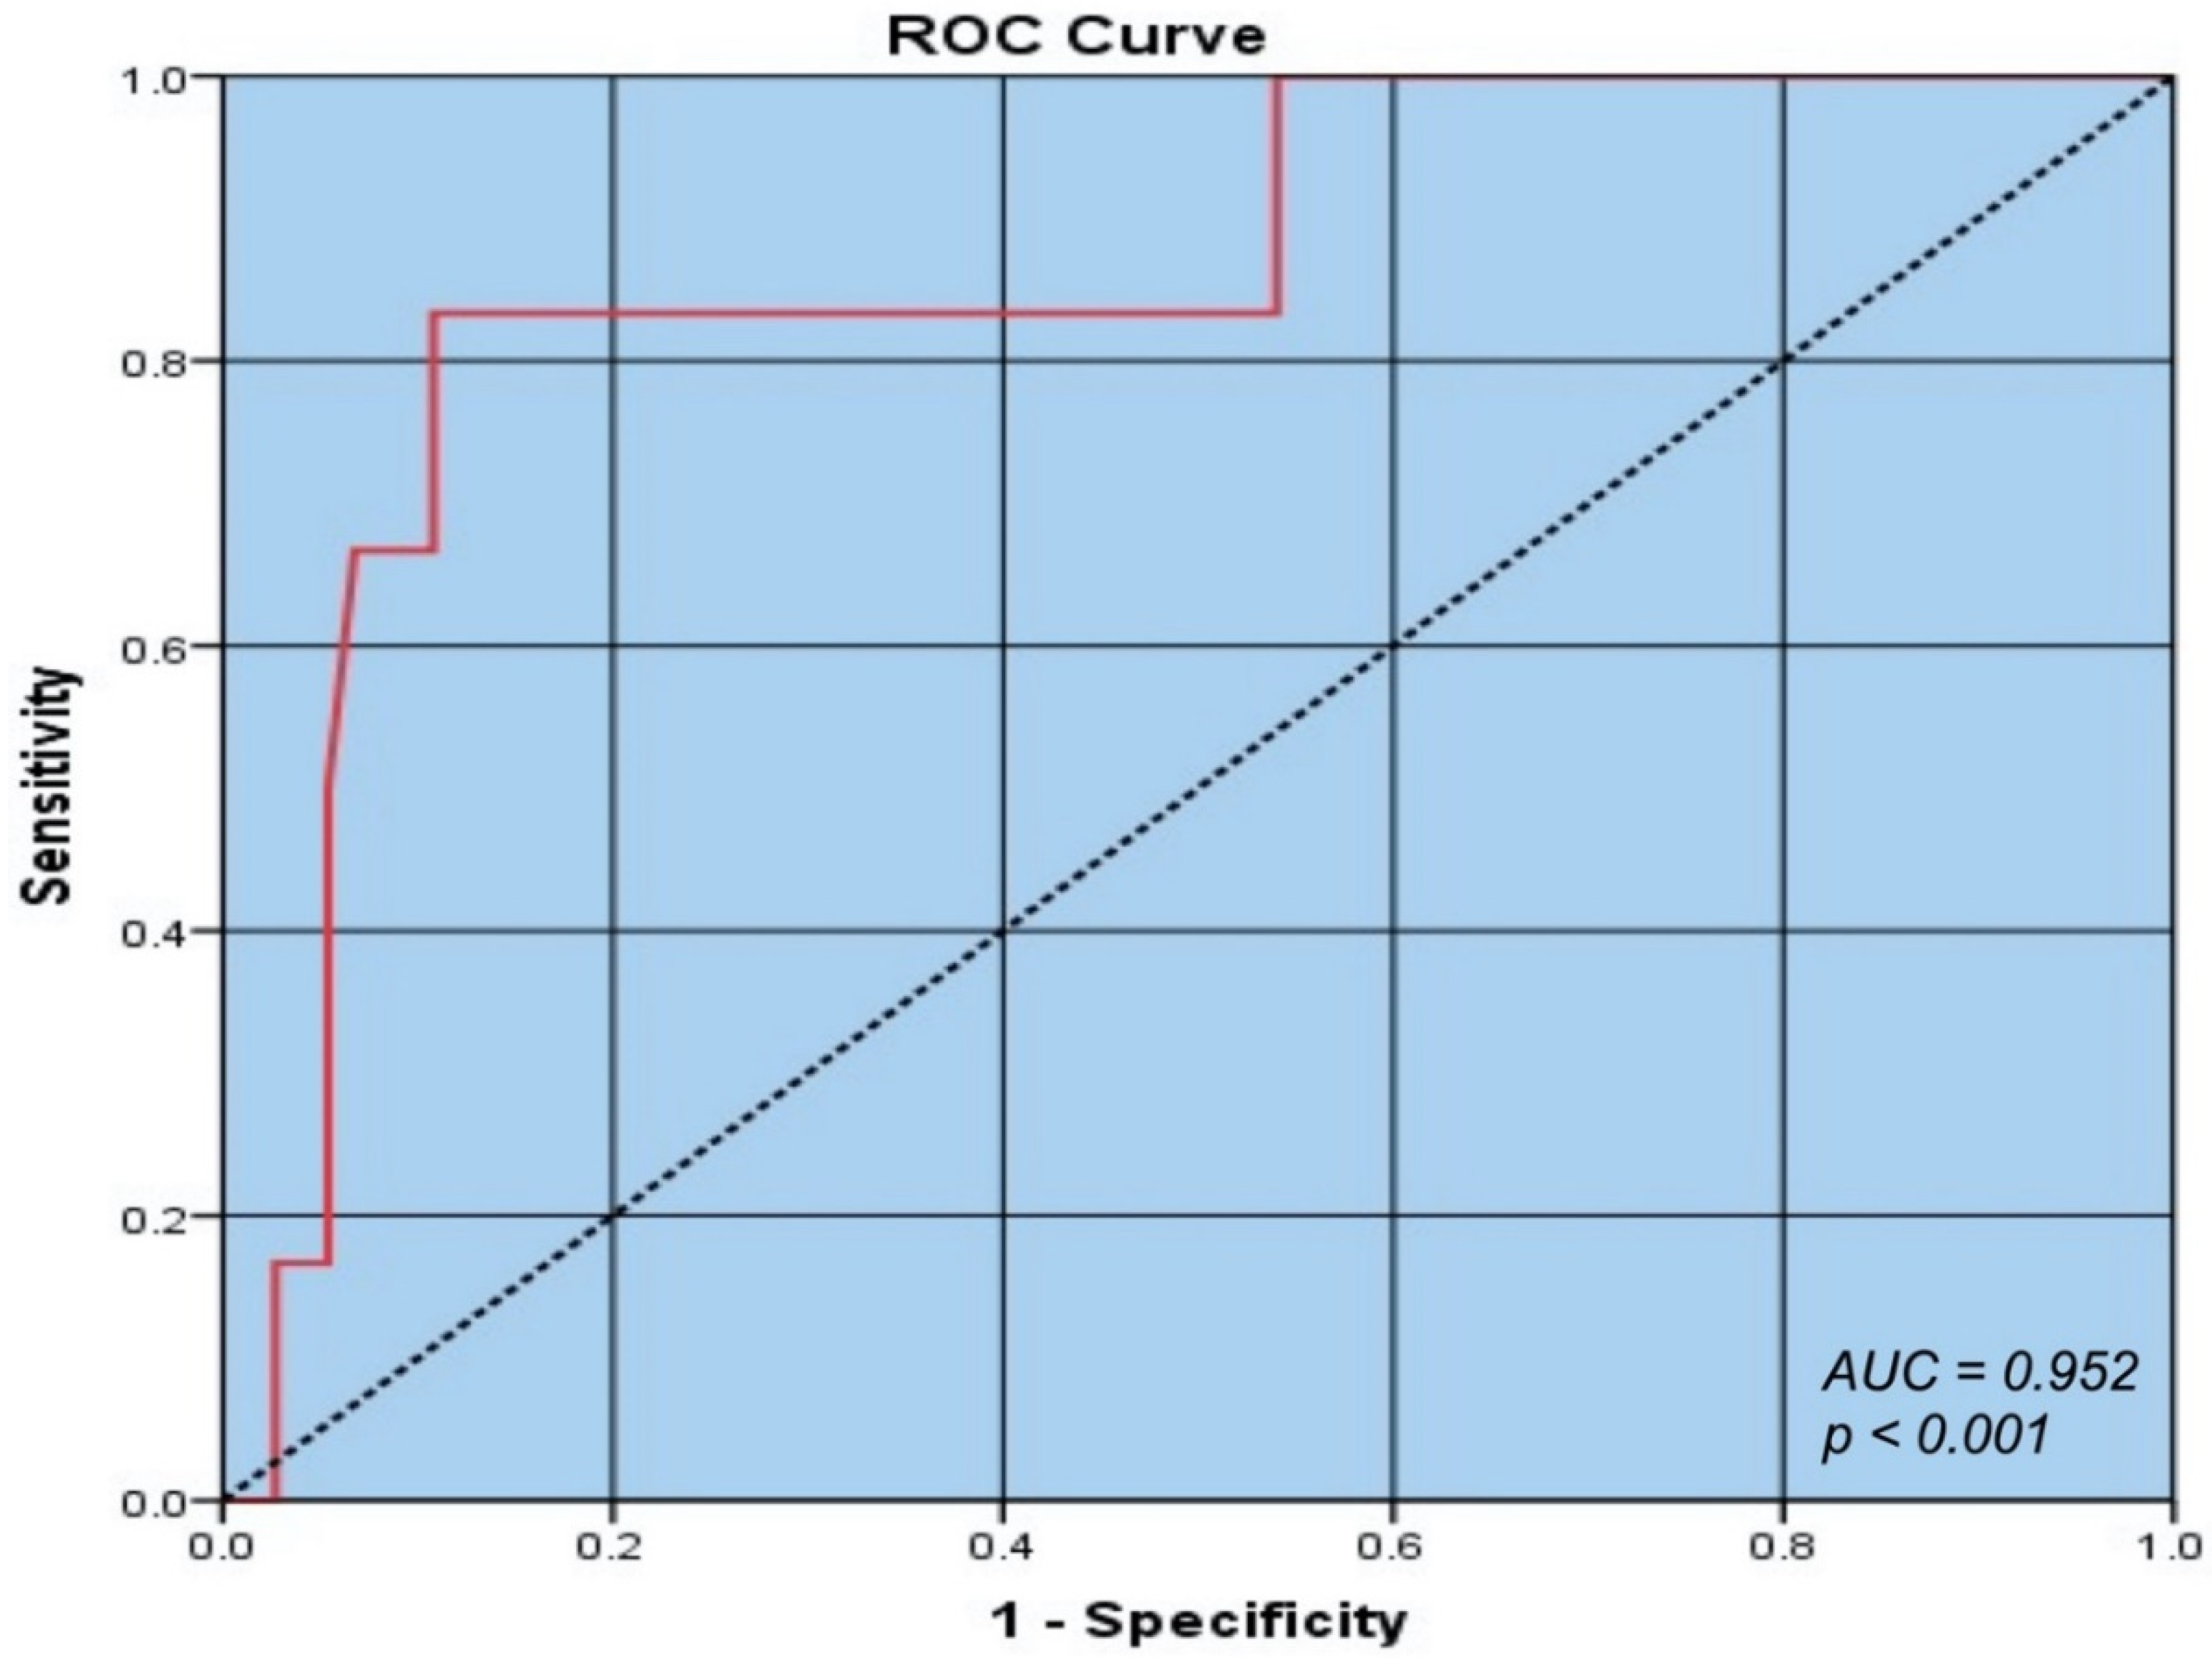
The results of our study revealed that SAAG values > 1.75 g/dL could predict EVs with a sensitivity of 78.4%, specificity of 83.3%, PPV of 98.31%, and an AUC of 0.952 (Figure 1).
In the analysis of the correlation of SAAG with the severity of EVs, values > 1.8 g/dL were associated with the risk of large EVs with an AUC of 0.856, sensitivity of 88.24%, and specificity of 50.79% (Table 5).
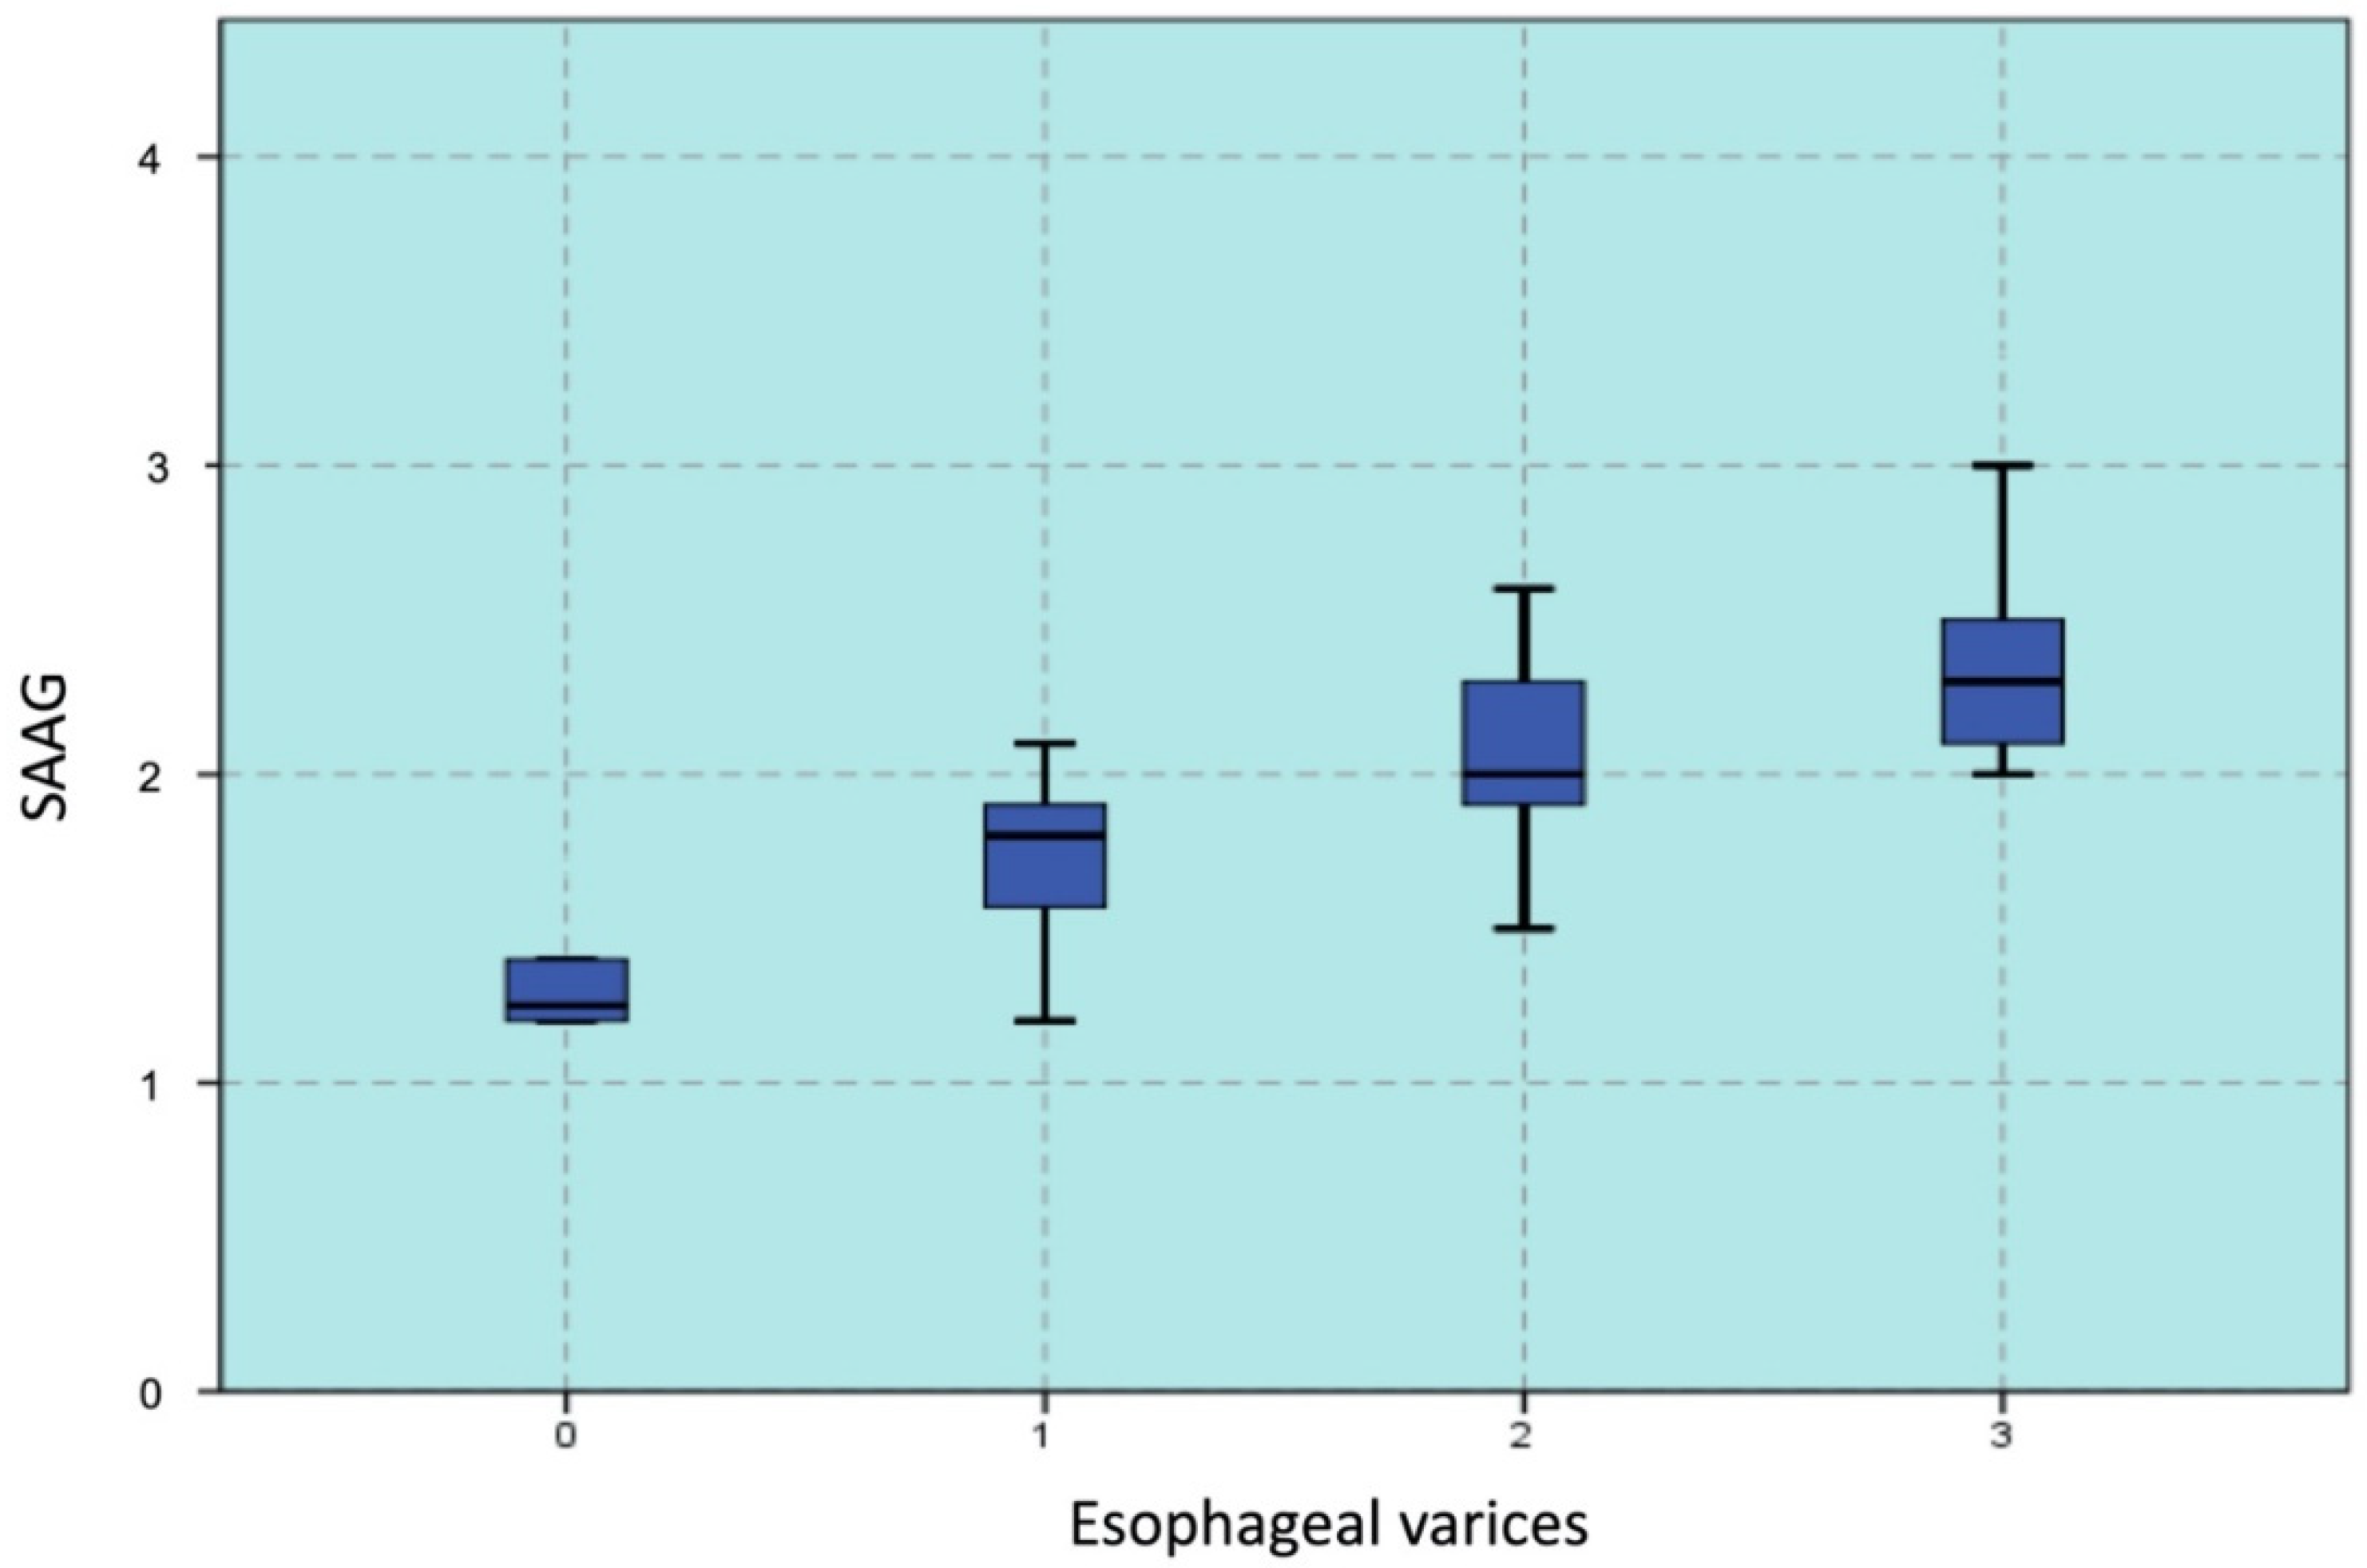
The correlation coefficient (r) between SAAG and EVs was 0.429, which was statistically significant (p < 0.001). Analysis of the correlation between the grades of EVs on endoscopy results with SAAG revealed r = 0.724, p < 0.001, and the linear correlation had a confidence level of 99% (Figure 2).
4. Discussion
In our study, patients with cirrhosis were on an average 54.59 ± 13.23 years old, and the highest rate (30%) was seen in patients between 50 and 59 years of age. This result was similar to that reported by Hou Y et al., who included cirrhotic patients with a mean age of 52.5 ± 10.3 years [8]. However, the age of our patients was higher than of those included in the study by Lawson-Ananissoh LM et al. [9]. They included over 125 cirrhotic patients with a mean age of 48.70 ± 14.89 years. However, this difference was not significant, probably due to the differences in race and geography. The causes of cirrhosis can vary depending on the location, population characteristics, living habits, and human and medical development levels. Nonetheless, alcohol intake and viral hepatitis remain the leading causes of liver fibrosis, globally. There are many types of hepatitis virus but the most common are HBV and HCV. Our research showed that alcohol intake, HBV, and HCV were the top three causes of cirrhosis, accounting for 83.75% of the cases. In our study, the average platelet count was 138.35 ± 86.54 G/L, and the lowest count was 11 G/L. The mean INR value in our study was 1.79 ± 0.52. The average total serum bilirubin level was 5.39 ± 7.12 mg/dL, and the highest value was 36.50 mg/dL. Bilirubin is a degradation product of heme, mainly from the hemoglobin of erythrocytes and is eliminated from the circulatory system by the liver. In cirrhotic patients, both conjugation and secretion of bilirubin into the bile are compromised.
Albumin is the most important protein synthesized by the liver. Normally, the body can produce approximately 15 g of albumin per day. Albumin synthesis has been reported to decrease to approximately 4 g per day in Child–Pugh class C patients with cirrhosis. Our study predominantly included Child–Pugh class C patients; therefore, the mean albumin concentration of the study sample was low. The mean albumin concentration in our study was 2.49 ± 0.52 g/dL, which was higher than that in the study by Dewa Gde AB et al., who reported a concentration of 2.21 ± 0.45 g/dL in cirrhotic patients [10]. Lawson-Ananissoh LM et al. reported that serum albumin levels of <3.5 g/dL in patients with abdominal cirrhosis accounted for 92.8% of the cases [9]. The mean albumin level in ascitic fluid in our study was 0.53 ± 0.54 g/dL, ranging from 0.1 to 2.8 g/dL. This result was similar to that in the study by Enas A et al., who reported peritoneal fluid albumin in the range of 0.2–3.3 g/dL, with an average of 1.37 ± 0.7 g/dL [11]. Hou Y et al. reported that peritoneal fluid albumin averaged 0.6 ± 0.47 g/dL [8].
Currently, endoscopy is considered a good method to determine EVs in cirrhotic patients according to the recommendations of global digestive associations [2,12,13]. The mean value of SAAG in this study was 1.94 ± 0.40 g/dL, ranging from 1.2 to 3.4 g/dL. This result was similar to that reported in the study by Iqbal N et al. (1.905 ± 0.7955 g/dL) [14] but lower than that reported by Hou Y et al. (2.14 ± 0.47 g/dL) [8]. The results of our study showed that five out of ten patients with SAAG values from 1.1 to 1.49 g/dL, 33/34 patients with values from 1.5 to 1.99 g/dL, and all patients with values ≥2 g/dL had EVs on their endoscopy results. This difference in SAAG values was statistically significant with the occurrence of EVs (χ2 = 54.614 and p < 0.0001). Lawson-Ananissoh LM et al. reported that 75% of the patients with SAAG values >1.5 g/dL will develop EVs [9]. However, Suresh I et al. showed that 50% of the patients with SAAG values from 1.1 to 1.49 g/dL and all patients with values >1.5 g/dL had EVs [15], and this result was similar to that of our study. Torres E et al. reported that approximately 40% of the patients with SAAG values < 1.5 g/dL demonstrated EVs on endoscopy results, in contrast to 66.7% and 100% of those with values from 1.5 to 1.99 g/dL and ≥2 g/dL, respectively [16]. Summarizing these studies, it may be considered that the SAAG value is related to the degree of EVs. The results of our study also showed that the incidence of EVs was higher in patients with higher SAAG. In our study, 50% of the patients with SAAG values from 1.1 to 1.49 g/dL and 100% of those with values >2 g/dL had EVs. Some studies reported that all patients with SAAG values ≥ 1.5 g/dL had EVs [17,18].
Our study revealed that the mean SAAG value in patients with and without EVs was 2.012 and 1.33, respectively. Multivariate analysis revealed that SAAG was an independent factor to predict EVs (p = 0.0104), and the corresponding r value was 0.429. Previous studies by Iqbal N et al. have demonstrated that the degree of esophageal varicose veins was significantly related to the SAAG value with a Pearson relationship value of 0.631 (p < 0.01) [14]. Suresh I et al. reported that the r value was 0.607 [15]. However, Hou Y et al. and Shahed FHM et al. reported the r values as 0.244 and 0.358, respectively [8,17]. The correlation coefficients differed marginally in the above studies; however, they both concluded that there was a positive correlation between SAAG and EVs, and that higher SAAG values were associated with a greater likelihood of EVs. This difference may be due to variations in the sampling population and in the incidence of cirrhosis and liver damage, distribution of the causes of cirrhosis, and poor nutritional status. Vietnamese patients may be a differentiating factor. In the study by Iqbal N et al., SAAG value ≥ 1.90 ± 0.796 g/dL was a predictor of the presence of esophageal veins [14], while that in the study by Torres E et al. was 1.435 ± 0.015 g/dL [16]. Prabakaran DB et al. reported that a SAAG cutoff of 1.48 g/dL resulted in a specificity and accuracy of 82% and 89% respectively in the prediction of EVs [19]. In addition, Sayyed J et al. and Gurubacharya DL et al. suggested that the cut-off point of SAAG was 1.5 g/dL [19,20]. The results of our study showed that SAAG values >1.75 g/dL demonstrated a sensitivity of 78.4%, specificity of 83.3%, PPV of 98.31%, and AUC of 0.925 in patients at increased risk for EVs. In the analysis of the correlation of SAAG with the severity of EVs, values >1.8 g/dL were associated with the risk of large EVs with an AUC of 0.856, sensitivity of 88.24%, and specificity of 50.79%. This result is lower than that reported by Hou Y et al., who considered a cut-off point of 2.5 g/dL to predict EVs [8].
Although the method using SAAG values to predict EVs has high sensitivity and specificity, it cannot completely replace UGE. SAAG is only a predictive and early warning tool that can help clinicians advise UGE or refer high-risk patients to an endoscopy center. Cirrhotic patients with SAAG values ≥1.8 should undergo endoscopy, considering their risk for large EVs. In particular, patients with SAAG value >1.9 had higher possibility of grade III EVs, which subsequently may lead to higher risk of bleeding. Therefore, these patients must undergo upper GI endoscopy. However, the present study is limited to some points. The following time is short to evaluate patients and this was a single center.
5. Conclusions
In conclusion, cirrhotic patients with SAAG values ≥1.8 have a higher risk of large EVs. In particular, those with values >1.9 who have higher possibility of bleeding must undergo the upper GI endoscopy.
Author Contributions
V.D.T. and H.T.V.A. conceived, designed, and performed the study, analyzed the data, and wrote the manuscript. V.D.T. revised the manuscript. All authors made substantial contributions to conception and design, acquisition of data, or analysis and interpretation of data; took part in drafting the article or revising it critically for important intellectual content; agreed to submit to the current journal; gave final approval of the version to be published; and agree to be accountable for all aspects of the work. All authors have read and agreed to the published version of the manuscript.
Funding
This research received no external funding.
Institutional Review Board Statement
The study was reviewed and approved by the Ethical Committee of the Faculty of Medicine, University of Medicine and Pharmacy at Ho Chi Minh City (Vietnam). The study complied with the Declaration of Helsinki principles.
Informed Consent Statement
All study participants or their legal guardians provided informed written consent before study enrollment.
Acknowledgments
The authors thank all the staff members of the Department of Gastroenterology, Cho Ray Hospital, Ho Chi Minh City, for the help that they provided to our research group throughout the study process.
Conflicts of Interest
The authors declare no conflict of interest.
References
- Rye, K.; Scott, R.; Mortimore, G.; Lawson, A.; Austin, A.; Freeman, J. Towards non invasive detection of esophageal varices. Int. J. Hepatol. 2012, 12, 1–9. [Google Scholar] [CrossRef] [PubMed] [Green Version]
- de Franchis, R. Revising consensus in portal hypertension: Report of the Baveno V consensus workshop on methodology of diagnosis and therapy in portal hypertension. J. Hepatol. 2010, 53, 762–768. [Google Scholar] [CrossRef] [PubMed] [Green Version]
- Bhasin, D.K.; Malhi, N.J. Variceal bleeding and portal hypertension: Much to learn, much to explore. Endoscopy 2002, 34, 119–128. [Google Scholar] [CrossRef] [PubMed]
- Bosch, J.; Abraldes, J.G.; Berzigotti, A.; Garcia-Pagan, J.C. Portal hypertension and gastrointestinal bleeding. Semin. Liver Dis. 2008, 28, 3–25. [Google Scholar] [CrossRef] [PubMed] [Green Version]
- Chalasani, N.; Imperiale, T.F.; Ismail, A.; Sood, G.; Carey, M.; Wilcox, C.M.; Madichetty, H.; Kwo, P.Y.; Boyer, T.D. Predictors of large esophageal varices in patients with cirrhosis. Am. J. Gastroenterol. 1999, 94, 3285–3291. [Google Scholar] [CrossRef] [PubMed]
- Mahassadi, A.K.; Bathaix, F.Y.; Assi, C.; Bangoura, A.D.; Allah-Kouadio, E.; Kissi, H.Y.; Touré, A.; Doffou, S.; Konaté, I.; Attia, A.K.; et al. Usefulness of non invasive predictors of esophageal varices in Black African cirrhotic patients in Côte d’Ivoire. Gastroenterol. Res. Pract. 2012, 2012, 216390. [Google Scholar] [CrossRef] [PubMed] [Green Version]
- Garcia-Tsao, G.; Sanyal, A.J.; Grace, N.D.; Carey, W. Practice Guidelines Committee of the American Association for the Study of Liver Diseases, Practice Parameters Committee of the American College of Gastroenterology. Prevention and management of gastroesophageal varices and variceal hemorrhage in cirrhosis. Hepatology 2007, 46, 922–938. [Google Scholar] [CrossRef] [PubMed]
- Hou, Y.; Yang, Z.; Yang, Y.; Gao, F.; Liu, X.; Zhang, Q.; Zhu, B.; Jiang, Y.; Wang, X. Serum-ascites albumin gradient: An independent predictor of esophageal variceal bleeding in cirrhosis patients with ascites. Int. J. Clin. Exp. Med. 2019, 12, 8645–8653. [Google Scholar]
- Lawson-Ananissoh, L.M.; Bagny, A.; Bouglouga, O.; Ganbobo, I.M.S.; Yakoubou, R.E.-H.; Kogoe, L.; Kaaga, L.; Redah, D. Interest of serum-ascites albumin concentration gradient in the diagnosis of portal hypertension in cirrhotic patients. Open J. Gastroenterol. 2019, 09, 13–21. [Google Scholar] [CrossRef] [Green Version]
- Budiyasa, D.G.; Ariawan, Y.; Mariadi, I.K.; Wibawa, I.D.; Purwadi, N.; Suryadarma, I.G. Correlation between serum albumin level and degree of esophageal varices in patients with liver cirrhosis. Indones. J. Gastroenterol. Hepatol. Dig. Endosc. 2011, 12, 23–27. [Google Scholar]
- Enas, A.; Dalia, G.; Sara, A.; Wesam, A.I. Correlation between serum-ascites albumin gradient and esophageal varices in patients with portal hypertension. Rep. Opin. 2011, 3, 39–49. [Google Scholar]
- European Association for Study of Liver; Asociacion Latinoamericana para el Estudio del Higado. EASL-ALEH Clinical Practice Guidelines: Non-invasive tests for evaluation of liver disease severity and prognosis. J. Hepatol. 2015, 63, 237–264. [Google Scholar] [CrossRef] [PubMed] [Green Version]
- Labrecque, D.; Khan, A.G.; Sarin, S.K.; Le Mair, A.W. Esophageal Varices. In World Gastroenterology Organization Global Guidelines; World Gastroenterology Organization: Milwaukee, WI, USA, 2014; pp. 1–14. [Google Scholar]
- Iqbal, N.; Shah, S.; Hanif, S. Correlation between serum ascites albumin gradient (SAAG) and esophageal varices in patients having chronic liver disease. Pak. Armed Forces Med. J. 2019, 69, 273–278. [Google Scholar]
- Prasad Jagini, S. Correlation of serum-ascites albumin concentration gradient and endoscopic parameters of portal hypertension in chronic liver disease. Int. J. Adv. Med. 2018, 5, 159. [Google Scholar]
- Torres, E.; Calmet, F.; Barrós, P. Endoscopic and clinical parameters in assessing th degree of portal hypertension: The value of the serum-ascitic fluid albumin gradient. Rev. Gastroenterol. Del Peru Organo Soc. Gastroenterol. Del Peru 1996, 16, 20–26. [Google Scholar]
- Shahed, F.H.M.; Mamun-Al-Mahtab, M.; Rahman, S. The Evaluation of Serum ascites albumin Gradient and Portal Hypertensive changes in Cirrhotic Patients with ascites. Euroasian J. Hepatogastroenterol. 2016, 6, 8–9. [Google Scholar] [PubMed] [Green Version]
- Cervantes Pérez, E.; Cervantes Guevara, G.; Cervantes Pérez, G.; Cervantes Cardona, G.A.; Fuentes Orozco, C.; Pintor Belmontes, K.J.; Guzmán Ramírez, B.G.; Reyes Aguirre, L.L.; Barbosa Camacho, F.J.; Bernal Hernández, A.; et al. Diagnostic utility of the serum-ascites albumin gradient in Mexican patients with ascites related to portal hypertension. JGH Open 2020, 4, 838–842. [Google Scholar] [CrossRef] [PubMed]
- Mahmoud, T.M.; Abdel Monem, S.M.; Abdel Wahab, E.; Dawod, H.M.; Ibrahem, M.A. A study on correlation between SAAG and platelet count: Spleen size ratio for the prediction of esophageal varices among chronic liver disease patients. Indian J. Basic Appl. Med. Res. 2015, 7, 502–508. [Google Scholar]
- Gurubacharya, D.L.; Mathura, K.C.; Karki, D.B. Correlation between serum-ascites albumin concentration gradient and endoscopic parameters of portal hypertension. Kathmandu Univ. Med. J. 2005, 3, 327–333. [Google Scholar]
Figure 1.
Receiver operating characteristic (ROC) curve corresponding to evaluation of the serum-ascites albumin gradient (SAAG) in patients with esophageal varices (EVs) (AUC: Area under the ROC Curve).
Figure 1.
Receiver operating characteristic (ROC) curve corresponding to evaluation of the serum-ascites albumin gradient (SAAG) in patients with esophageal varices (EVs) (AUC: Area under the ROC Curve).

Figure 2.
Correlated distribution of serum-ascites albumin gradient (SAAG) with grades of esophageal varices (EVs).
Figure 2.
Correlated distribution of serum-ascites albumin gradient (SAAG) with grades of esophageal varices (EVs).


Table 1.
Baseline characteristics.
| Variable | Total (n = 80) |
|---|---|
| Age(y) | 54.59 ± 13.23 |
| Sex [No. (%)] | |
| Male | 60 (75.0%) |
| Female | 20 (25.0%) |
| Etiology [No. (%)] | |
| Alcohol intake | 30 (37.5%) |
| HBV | 20 (25.0%) |
| HCV | 12 (15.0%) |
| NAFLD | 5 (5.25%) |
| Wilson’s disease | 1 (1.25%) |
| Other | 12 (15.0%) |
| Serum albumin (g/dL) | 2.49 ± 0.52 |
| Ascitic fluid albumin (g/dL) | 0.53 ± 0.54 |
| Total bilirubin (mg/dL) | 5.39 ± 7.12 |
| Platelet count (G/L) | 138.35 ± 86.54 |
| Ascites protein/fluid (g/dL) | 1.15 ± 1.05 |
| Child–Pugh Score | |
| Child–Pugh A | 3 (3.75%) |
| Child–Pugh B | 19 (23.75%) |
| Child–Pugh C | 58 (72.50%) |
| Esophageal varices | |
| Absent | 6 (7.5%) |
| I | 28 (35.0%) |
| II | 33 (41.2%) |
| III | 13 (16.3) |
| SAAG (g/dL) | |
| 1.10–1.49 | 10 (12.5%) |
| 1.50–1.99 | 34 (42.5%) |
| ≥2 | 36 (45.0%) |
Mean ± SD; HBV: Hepatitis B virus; HCV: Hepatitis C virus; NAFLD: Non-alcoholic fatty liver disease; SAAG: Serum-ascites albumin gradient.
Table 2.
SAAG with the presence of EVs.
| SAAG (g/dL) | Absence of Esophageal Varices | Presence of Esophageal Varices | p Value | ||
|---|---|---|---|---|---|
| n | % | n | % | ||
| 1.1–1.49 | 5 | 6.25 | 5 | 6.25 | |
| 1.5–1.99 | 1 | 1.25 | 33 | 41.25 | <0.0001 ++ |
| ≥2 | 0 | 0 | 36 | 45.0% | |
++—Independent chi-square test; SAAG: Serum-Ascites Albumin Gradient.
Table 3.
Predictive factors of EVs (univariate analysis).
| Absence of Esophageal Varices | Presence of Esophageal Varices | p Value | r Value | |
|---|---|---|---|---|
| Age (y) | 46.50 | 55.24 | 0.120 | 0.175 |
| Platelets (G/L) | 233.33 | 130.65 | 0.004 | −0.314 |
| Prothrombin | 19.23 | 21.99 | 0.367 | 0.102 |
| INR | 1.53 | 1.81 | 0.215 | 0.140 |
| Serum albumin (g/dL) | 2.55 | 2.49 | 0.769 | 0.033 |
| Ascites albumin (g/dL) | 1.22 | 0.47 | 0.001 | 0.362 |
| Total bilirubin (mg/dL) | 1.07 | 5.74 | 0.123 | 0.174 |
| Child–Pugh score | 8.17 | 10.66 | <0.001 | 0.388 |
| SAAG | 1.33 | 2.012 | <0.001 | 0.429 |
INR: International Normalized Ratio; SAAG: Serum-Ascites Albumin Gradient.
Table 4.
Predictive factors of EVs (multivariate analysis).
| OR | 95% CI | p Value | |
|---|---|---|---|
| Platelets (G/L) <150 vs. ≥150 | 1.011 | 0.995–1.027 | 0.1875 |
| Child C vs. A and B | 2.407 | 0.831–6.971 | 0.1056 |
| SAAG (g/dL) ≥1.1 vs. <1.1 | 22.778 | 1.628–318.7109 | 0.0104 |
95% CI: 95% Confidence Interval; OR: Odds Ratio; SAAG: Serum-Ascites Albumin Gradient.
Table 5.
SAAG with the grades of EVs.
| Cut-Off SAAG | Se | Spe | PPV (+) | NPV (−) | AUC | |
|---|---|---|---|---|---|---|
| Presence of EVs | 1.75 | 78.38% | 83.33% | 98.31% | 23.81% | 0.952 |
| EVs grade II | 1.8 | 88.24% | 50.79% | 74.14% | 86.36% | 0.704 |
| EVs grade III | 1.9 | 100% | 63.77% | 23.91% | 88.23% | 0.856 |
EVs: esophageal varices; SAAG: Serum-Ascites Albumin Gradient.
Publisher’s Note: MDPI stays neutral with regard to jurisdictional claims in published maps and institutional affiliations. |
© 2021 by the authors. Licensee MDPI, Basel, Switzerland. This article is an open access article distributed under the terms and conditions of the Creative Commons Attribution (CC BY) license (https://creativecommons.org/licenses/by/4.0/).
Share and Cite
MDPI and ACS Style
Thong, V.D.; Anh, H.T.V. Prediction of Esophageal Varices Based on Serum-Ascites Albumin Gradient in Cirrhotic Patients. Gastroenterol. Insights 2021, 12, 270-277. https://0-doi-org.brum.beds.ac.uk/10.3390/gastroent12020023
AMA Style
Thong VD, Anh HTV. Prediction of Esophageal Varices Based on Serum-Ascites Albumin Gradient in Cirrhotic Patients. Gastroenterology Insights. 2021; 12(2):270-277. https://0-doi-org.brum.beds.ac.uk/10.3390/gastroent12020023
Chicago/Turabian StyleThong, Vo Duy, and Ho Thi Van Anh. 2021. "Prediction of Esophageal Varices Based on Serum-Ascites Albumin Gradient in Cirrhotic Patients" Gastroenterology Insights 12, no. 2: 270-277. https://0-doi-org.brum.beds.ac.uk/10.3390/gastroent12020023