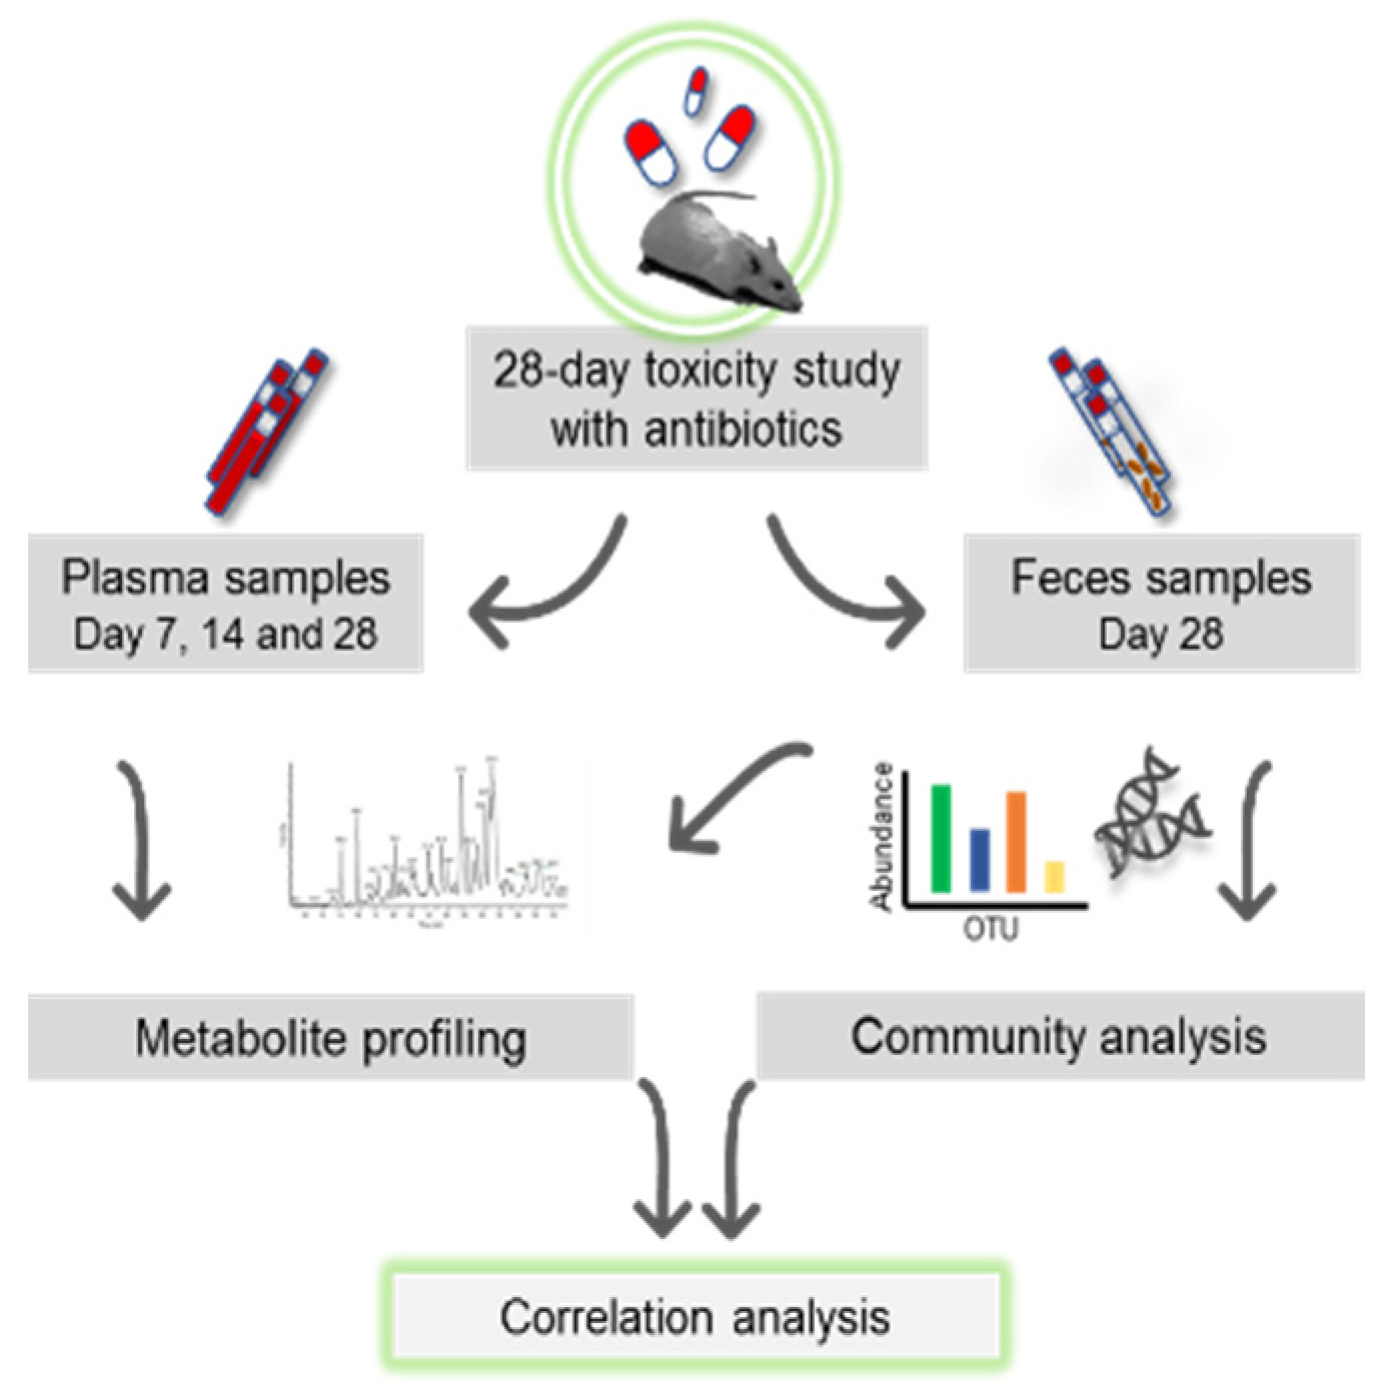
Figure 1.
The schematic diagram shows the overall process of a 28-day oral toxicity study with plasma and feces sampling. Plasma sampling was conducted on days 7, 14, and 28 of the study and feces was sampled on the day of necropsy, day 28. Subsequently, plasma and feces samples were subjected to metabolomics and feces to 16S community analysis. With both omic datasets, correlation analyses were carried out.
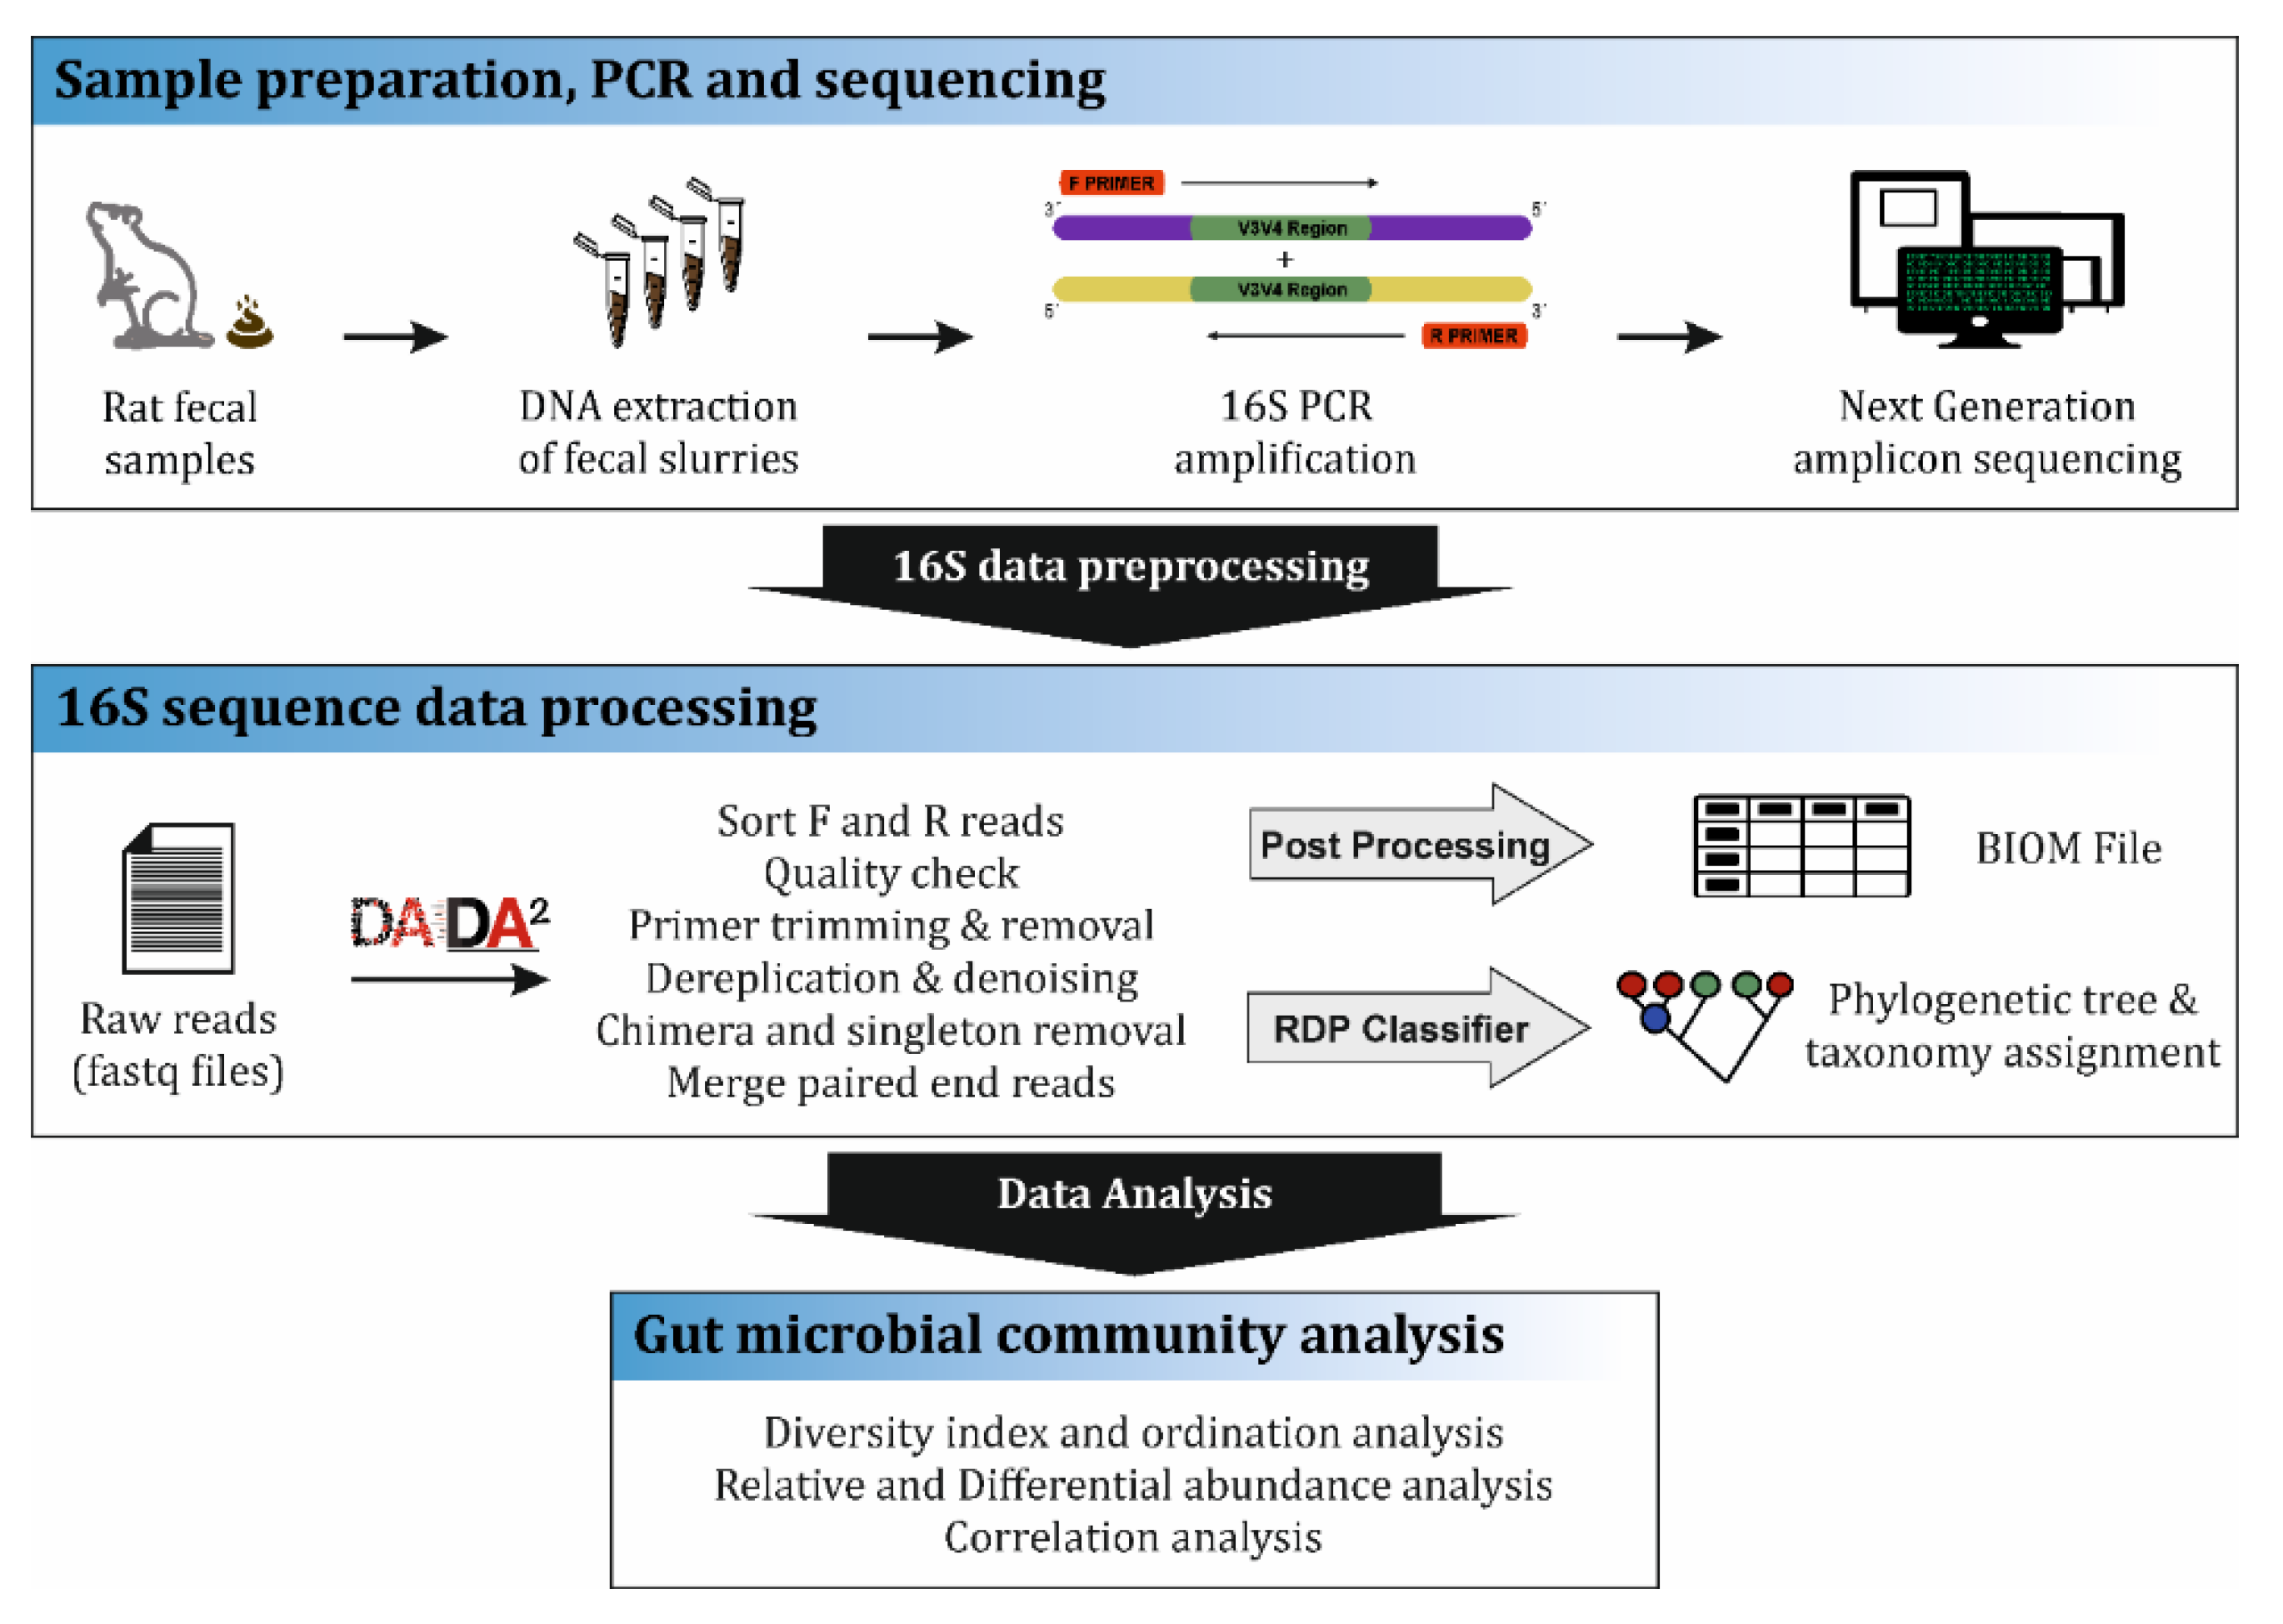
Figure 2.
16S community analysis workflow. The first step involved the preparation of fecal samples collected during necropsy (day 28) from the Wistar rats. Samples were subjected to DNA isolation, quantification and further 16S rDNA gene amplification by Polymer chain reaction (PCR) and sequencing report generation. The next step involved the data pre-processing where filtering, denoising and demultiplexing of the reads were conducted by DADA2 software and the final step was the bacterial community data analysis.
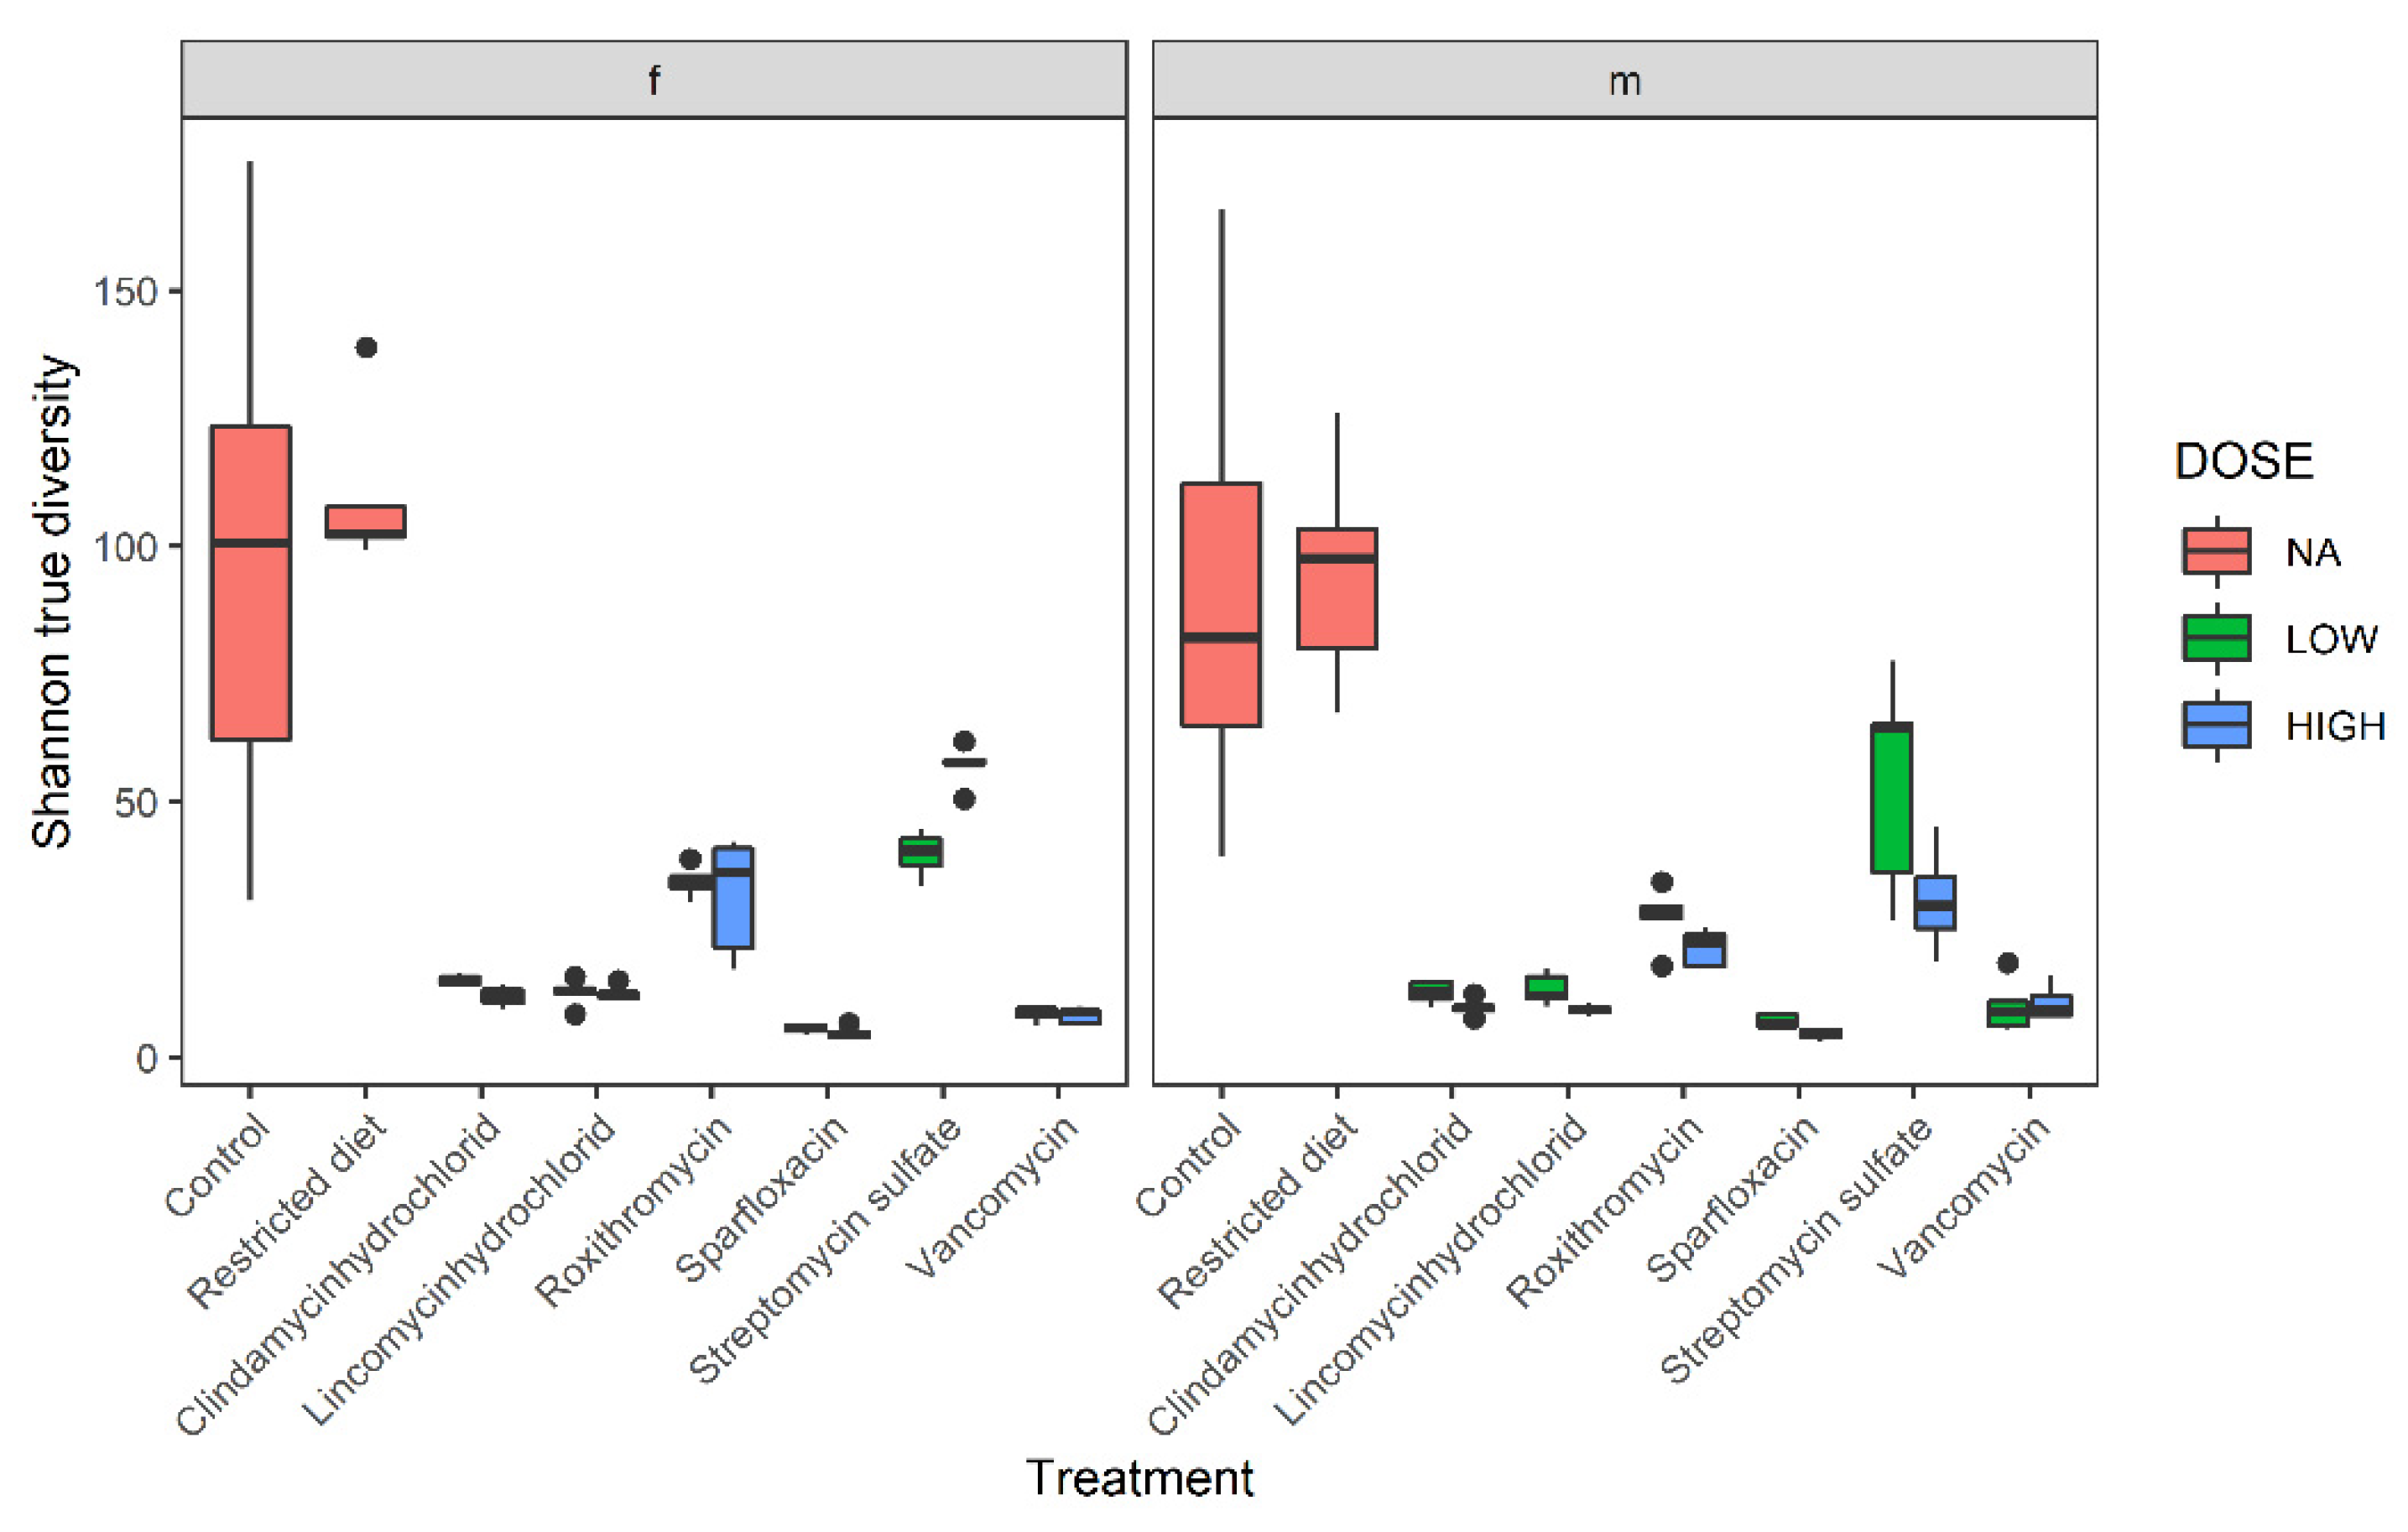
Figure 3.
Shannon true diversity analysis of six antibiotic treatments, restricted-diet-fed and controls for both male and female Wistar rats. Boxplot shows the diversity analysis on the left for females (f) and on the right for males (m). The colors show different dose groups, where red refers to no dose applicable, blue box refers to high-dose and green refers to low-dose groups. The x-axis shows the different treatment groups, and y-axis shows Shannon diversity value; whiskers denote standard deviations, solid lines within the boxes indicate the group median and dots lying outside the boxes are outliers. A closer comparison of the treated groups and dose response is depicted in
Supplementary Figure S9.
Figure 4.
Principle Coordinate Analysis (PCoA) of bacterial families from different treatments. (a) The distance matrix used is Bray–Curtis, which is a rank-based clustering. (b) Principle Coordinate Analysis (PCoA) using weighted UniFrac distance matrix that is a phylogenetic-based distance that takes bacterial abundances into account.
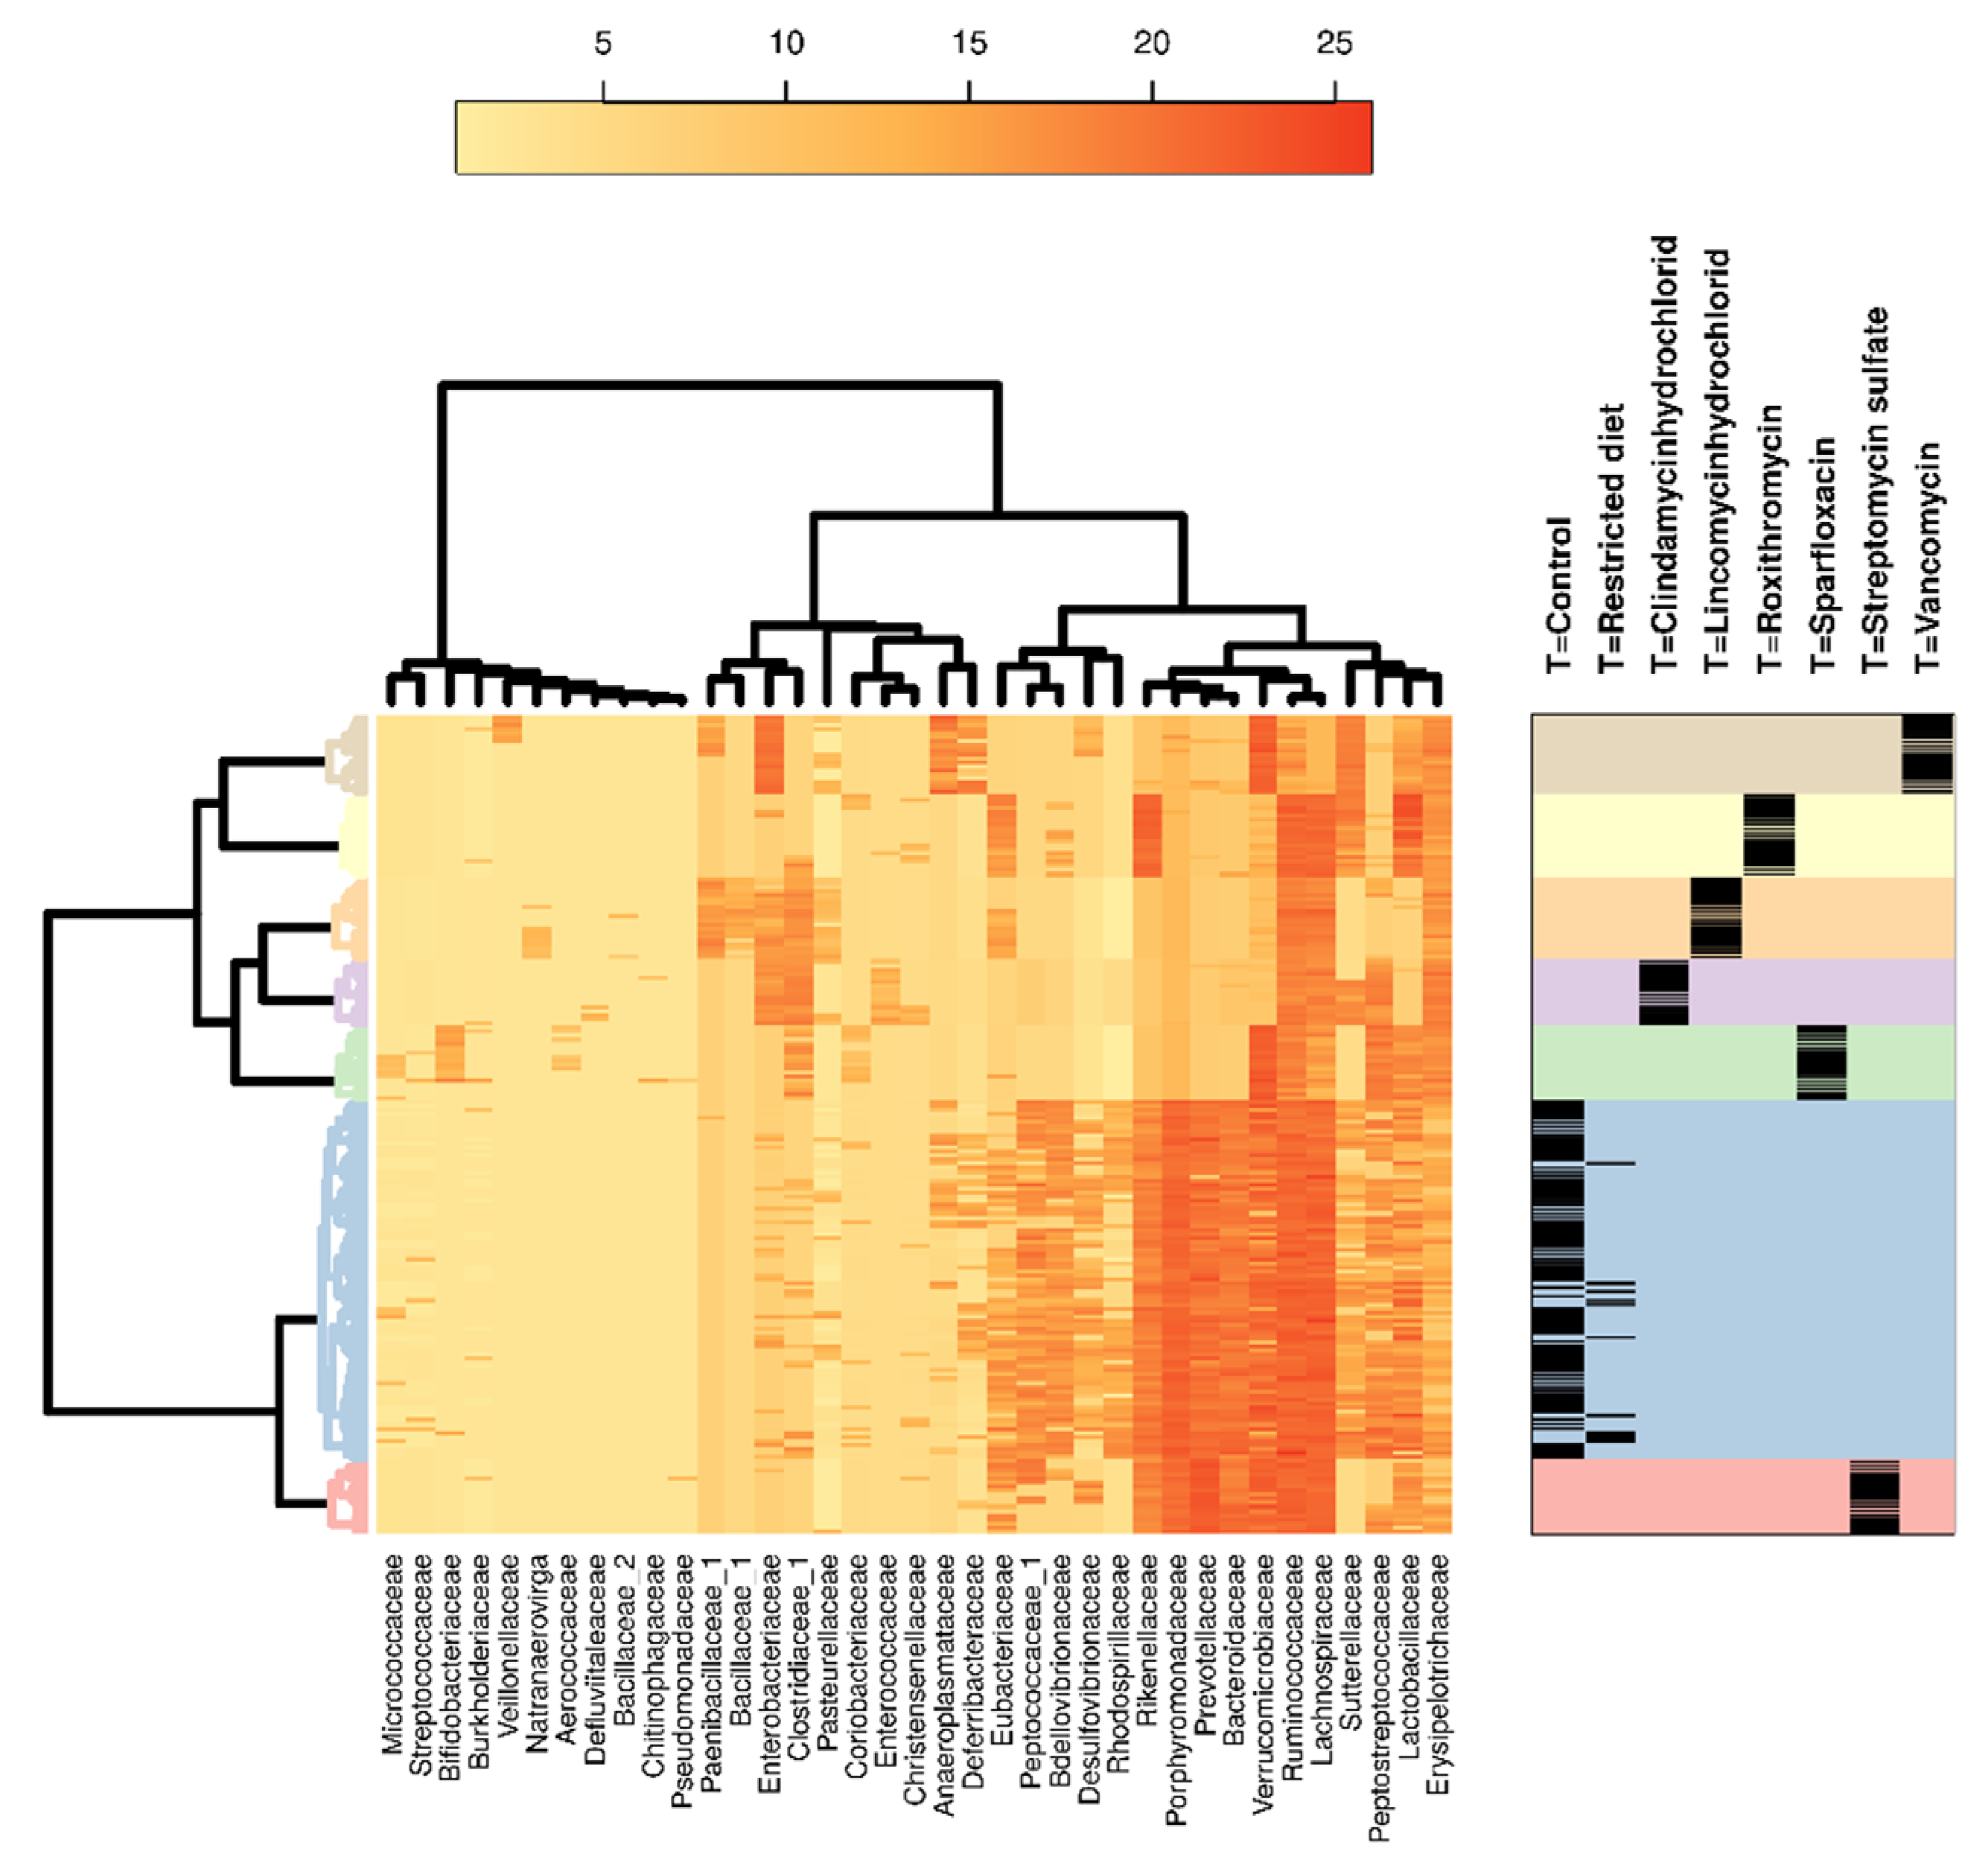
Figure 5.
Hierarchical clustering analysis of 16S bacterial families in different treatments, dose groups and sexes. Heatmap showing occurrences of bacterial families in different antibiotic treatment groups, including hierarchical clustering of bacteria families and different treatments. Color coding on the right indicates the different treatment groups that correspond to the clustering analysis on the left. The black bands on the right show the samples from individual animals belonging to respective treatment groups. Dose groups and sexes showed very marginal differences; hence, they were not separated.
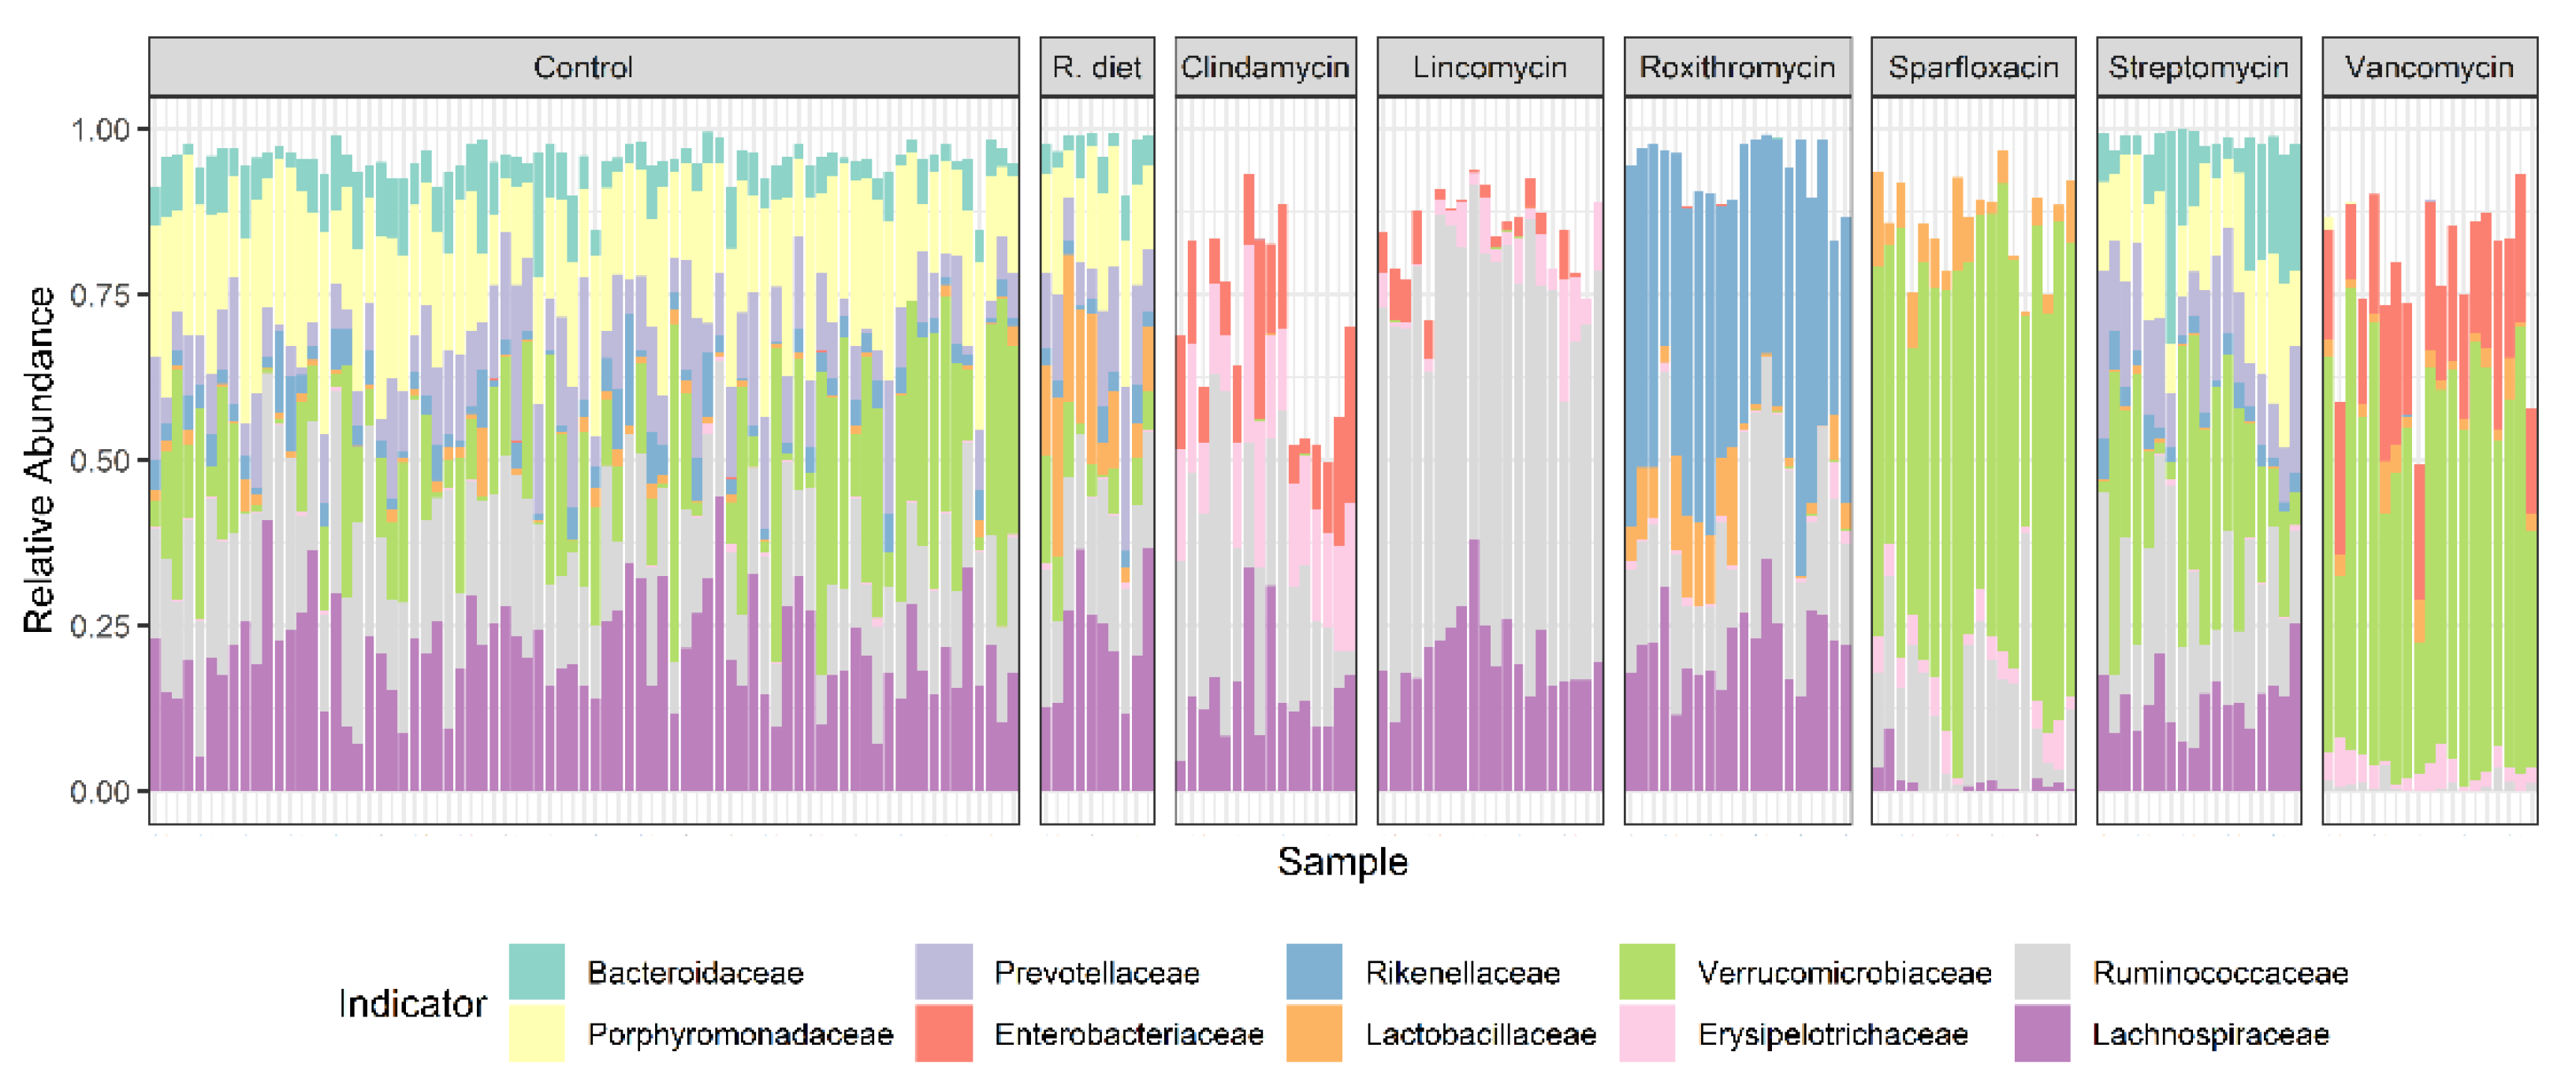
Figure 6.
Stacked bar showing group indicators or core bacterial families that were detected in specific treatment groups, where R. diet refers to the restricted diet (−20%) group. Individual animal variability can be easily observed. Dose groups and sexes showed very marginal differences; hence, they were not separated. Antibiotic treatments clearly show class-dependent effects on the intestinal community composition. Compared to control, restricted diet and Streptomycin sulfate treatment groups, all the other antibiotics produced reduced/changed bacterial diversity and richness.
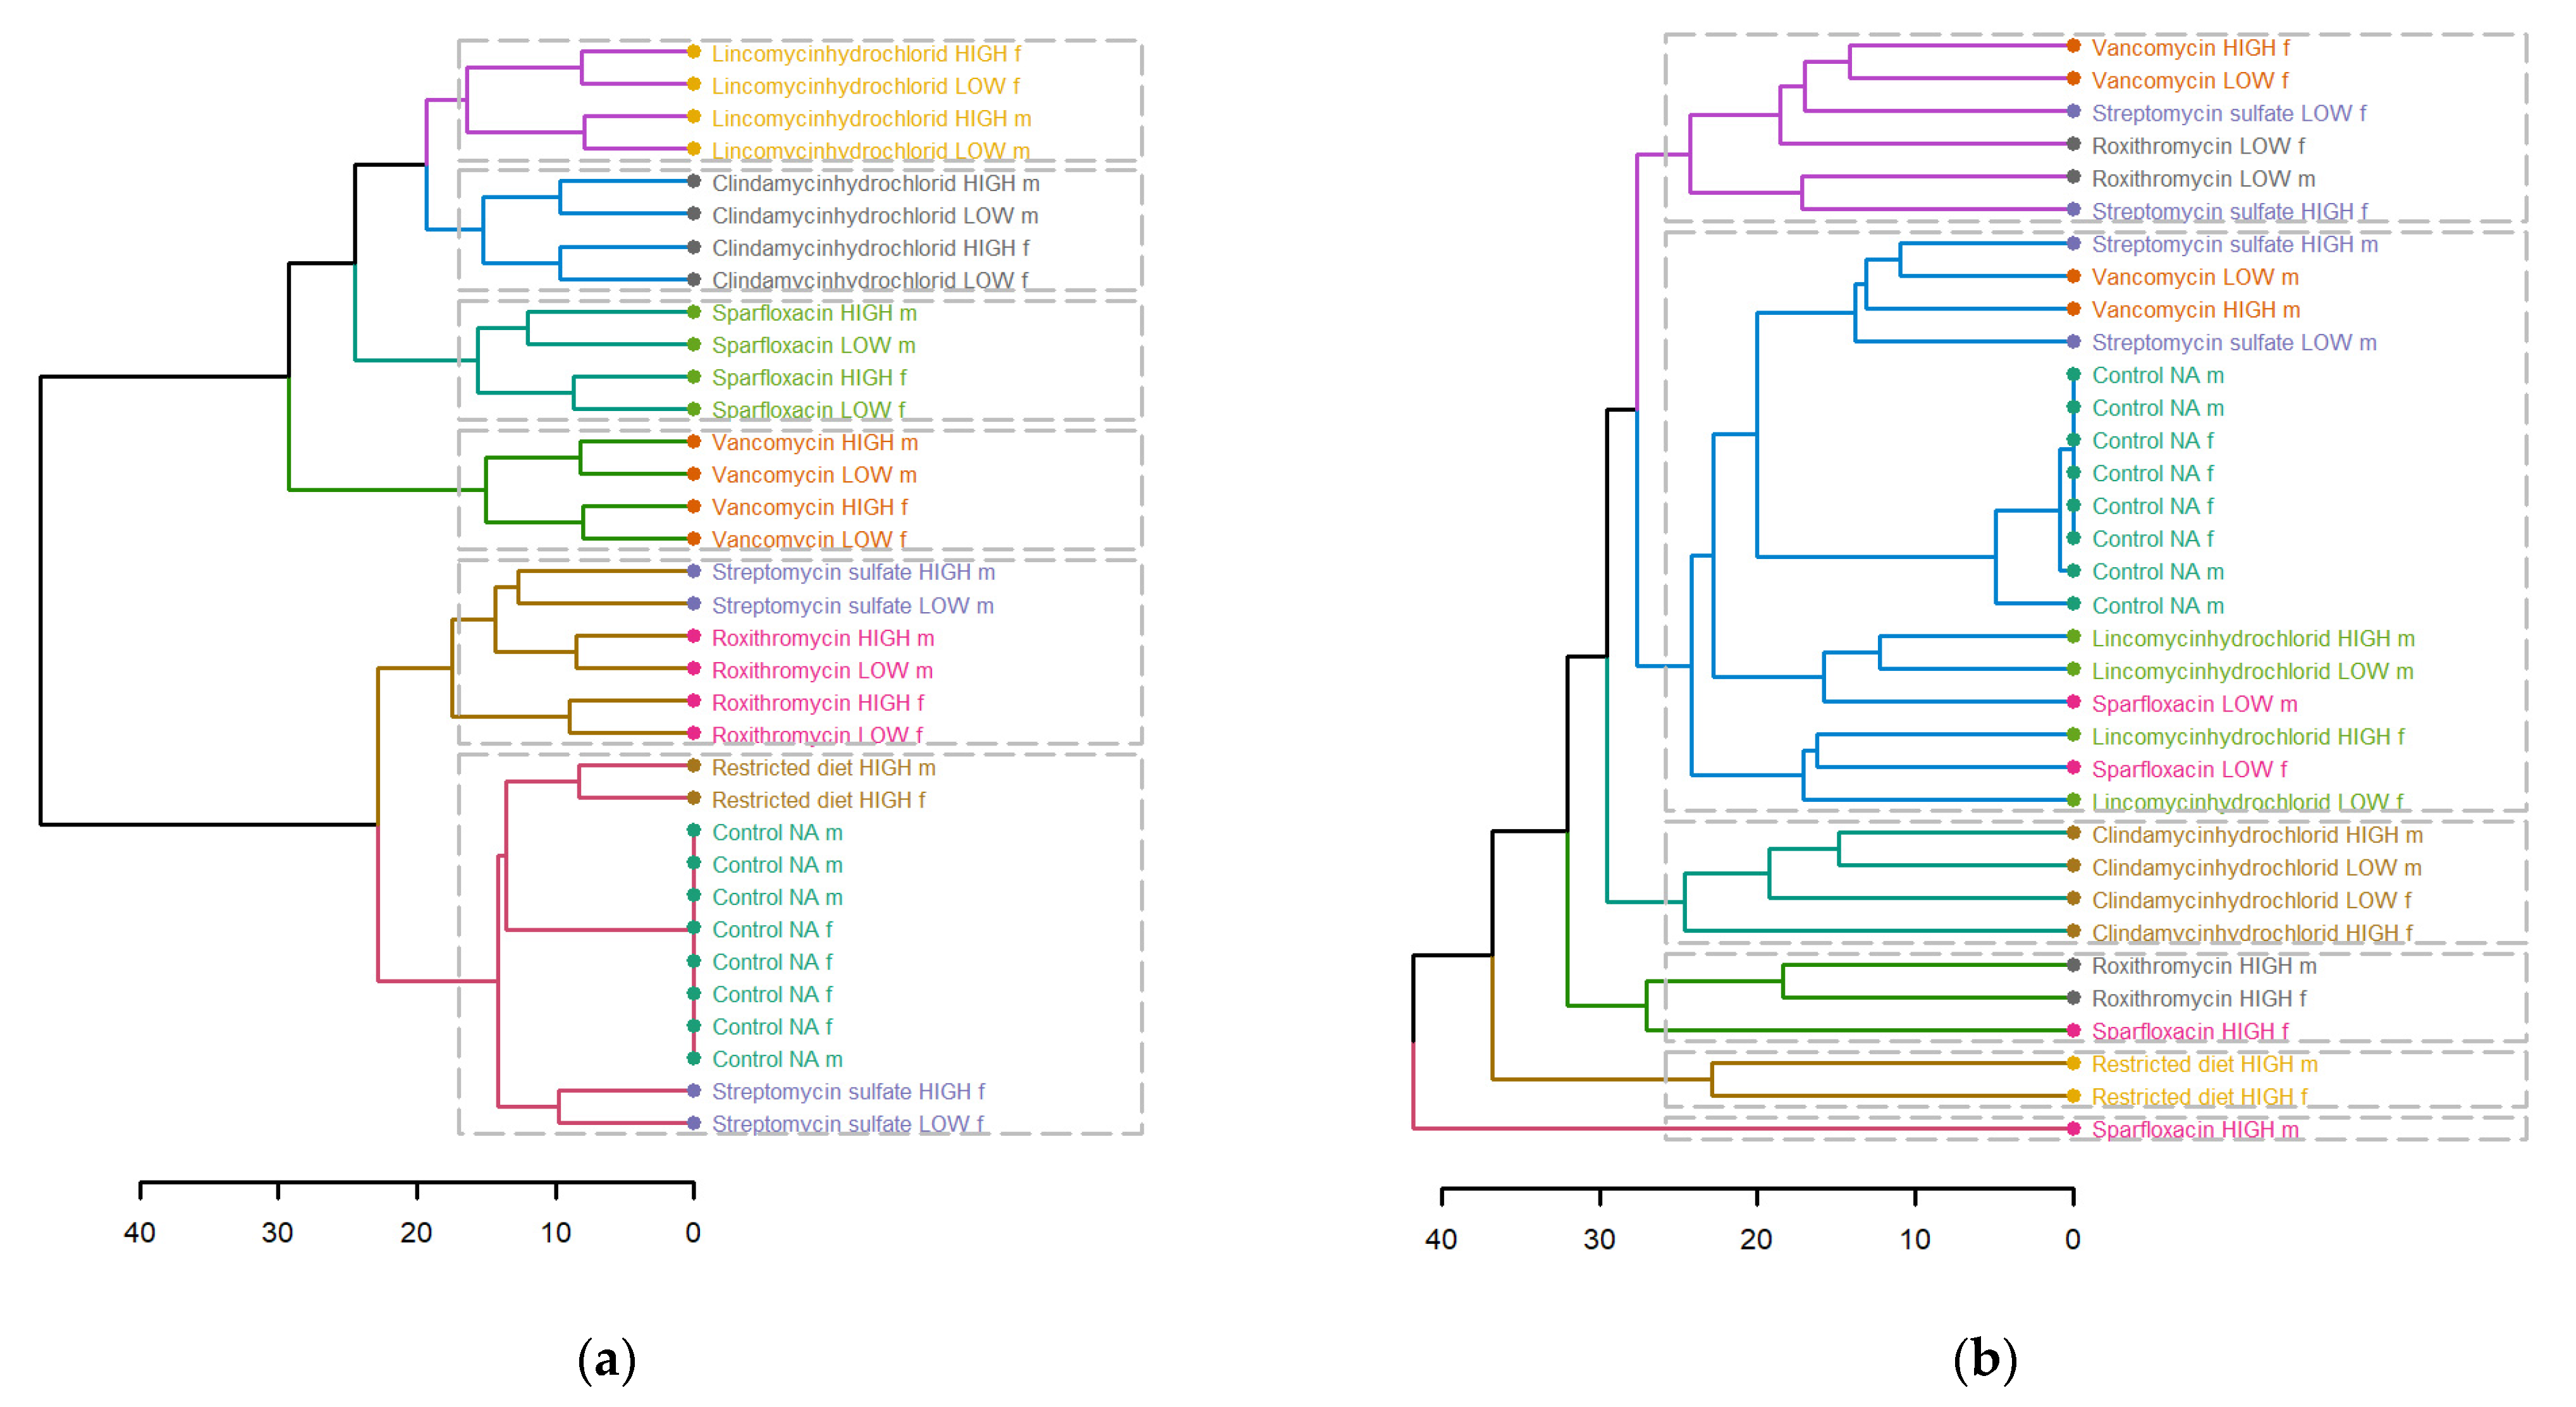
Figure 7.
Dendrogram showing hierarchical clustering of (a) fecal and (b) plasma metabolites of different treatments, dose groups and sex. Euclidean distance was used, and different treatments are depicted, and different colors and dotted boxes show different clusters.
Figure 7.
Dendrogram showing hierarchical clustering of (a) fecal and (b) plasma metabolites of different treatments, dose groups and sex. Euclidean distance was used, and different treatments are depicted, and different colors and dotted boxes show different clusters.
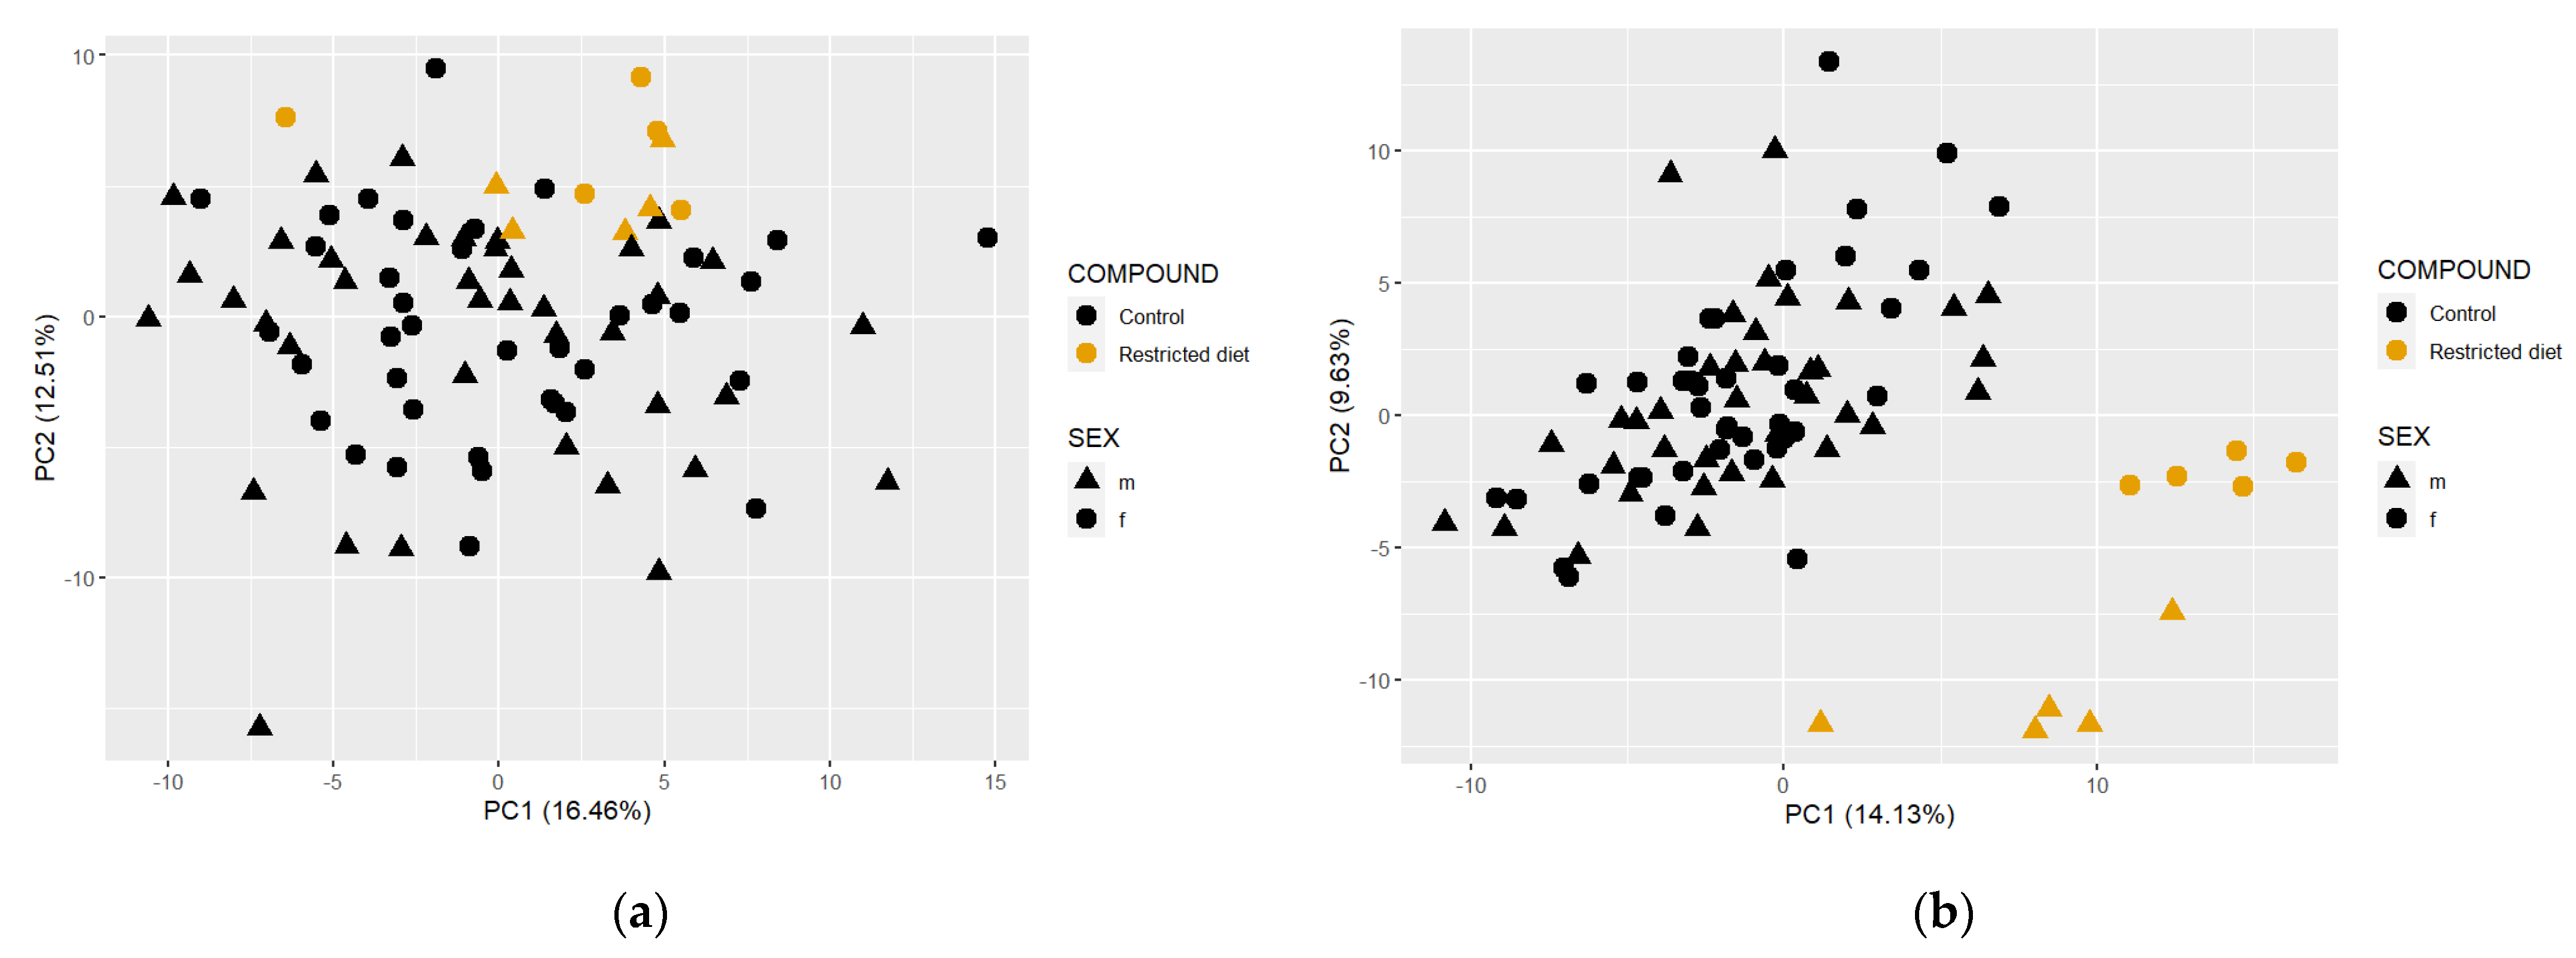
Figure 8.
Principal component analysis (PCA) of restricted-diet-fed and controls from all the studies. (a) PCA using feces metabolome (left side); (b) plasma metabolome data (right side).
Figure 8.
Principal component analysis (PCA) of restricted-diet-fed and controls from all the studies. (a) PCA using feces metabolome (left side); (b) plasma metabolome data (right side).
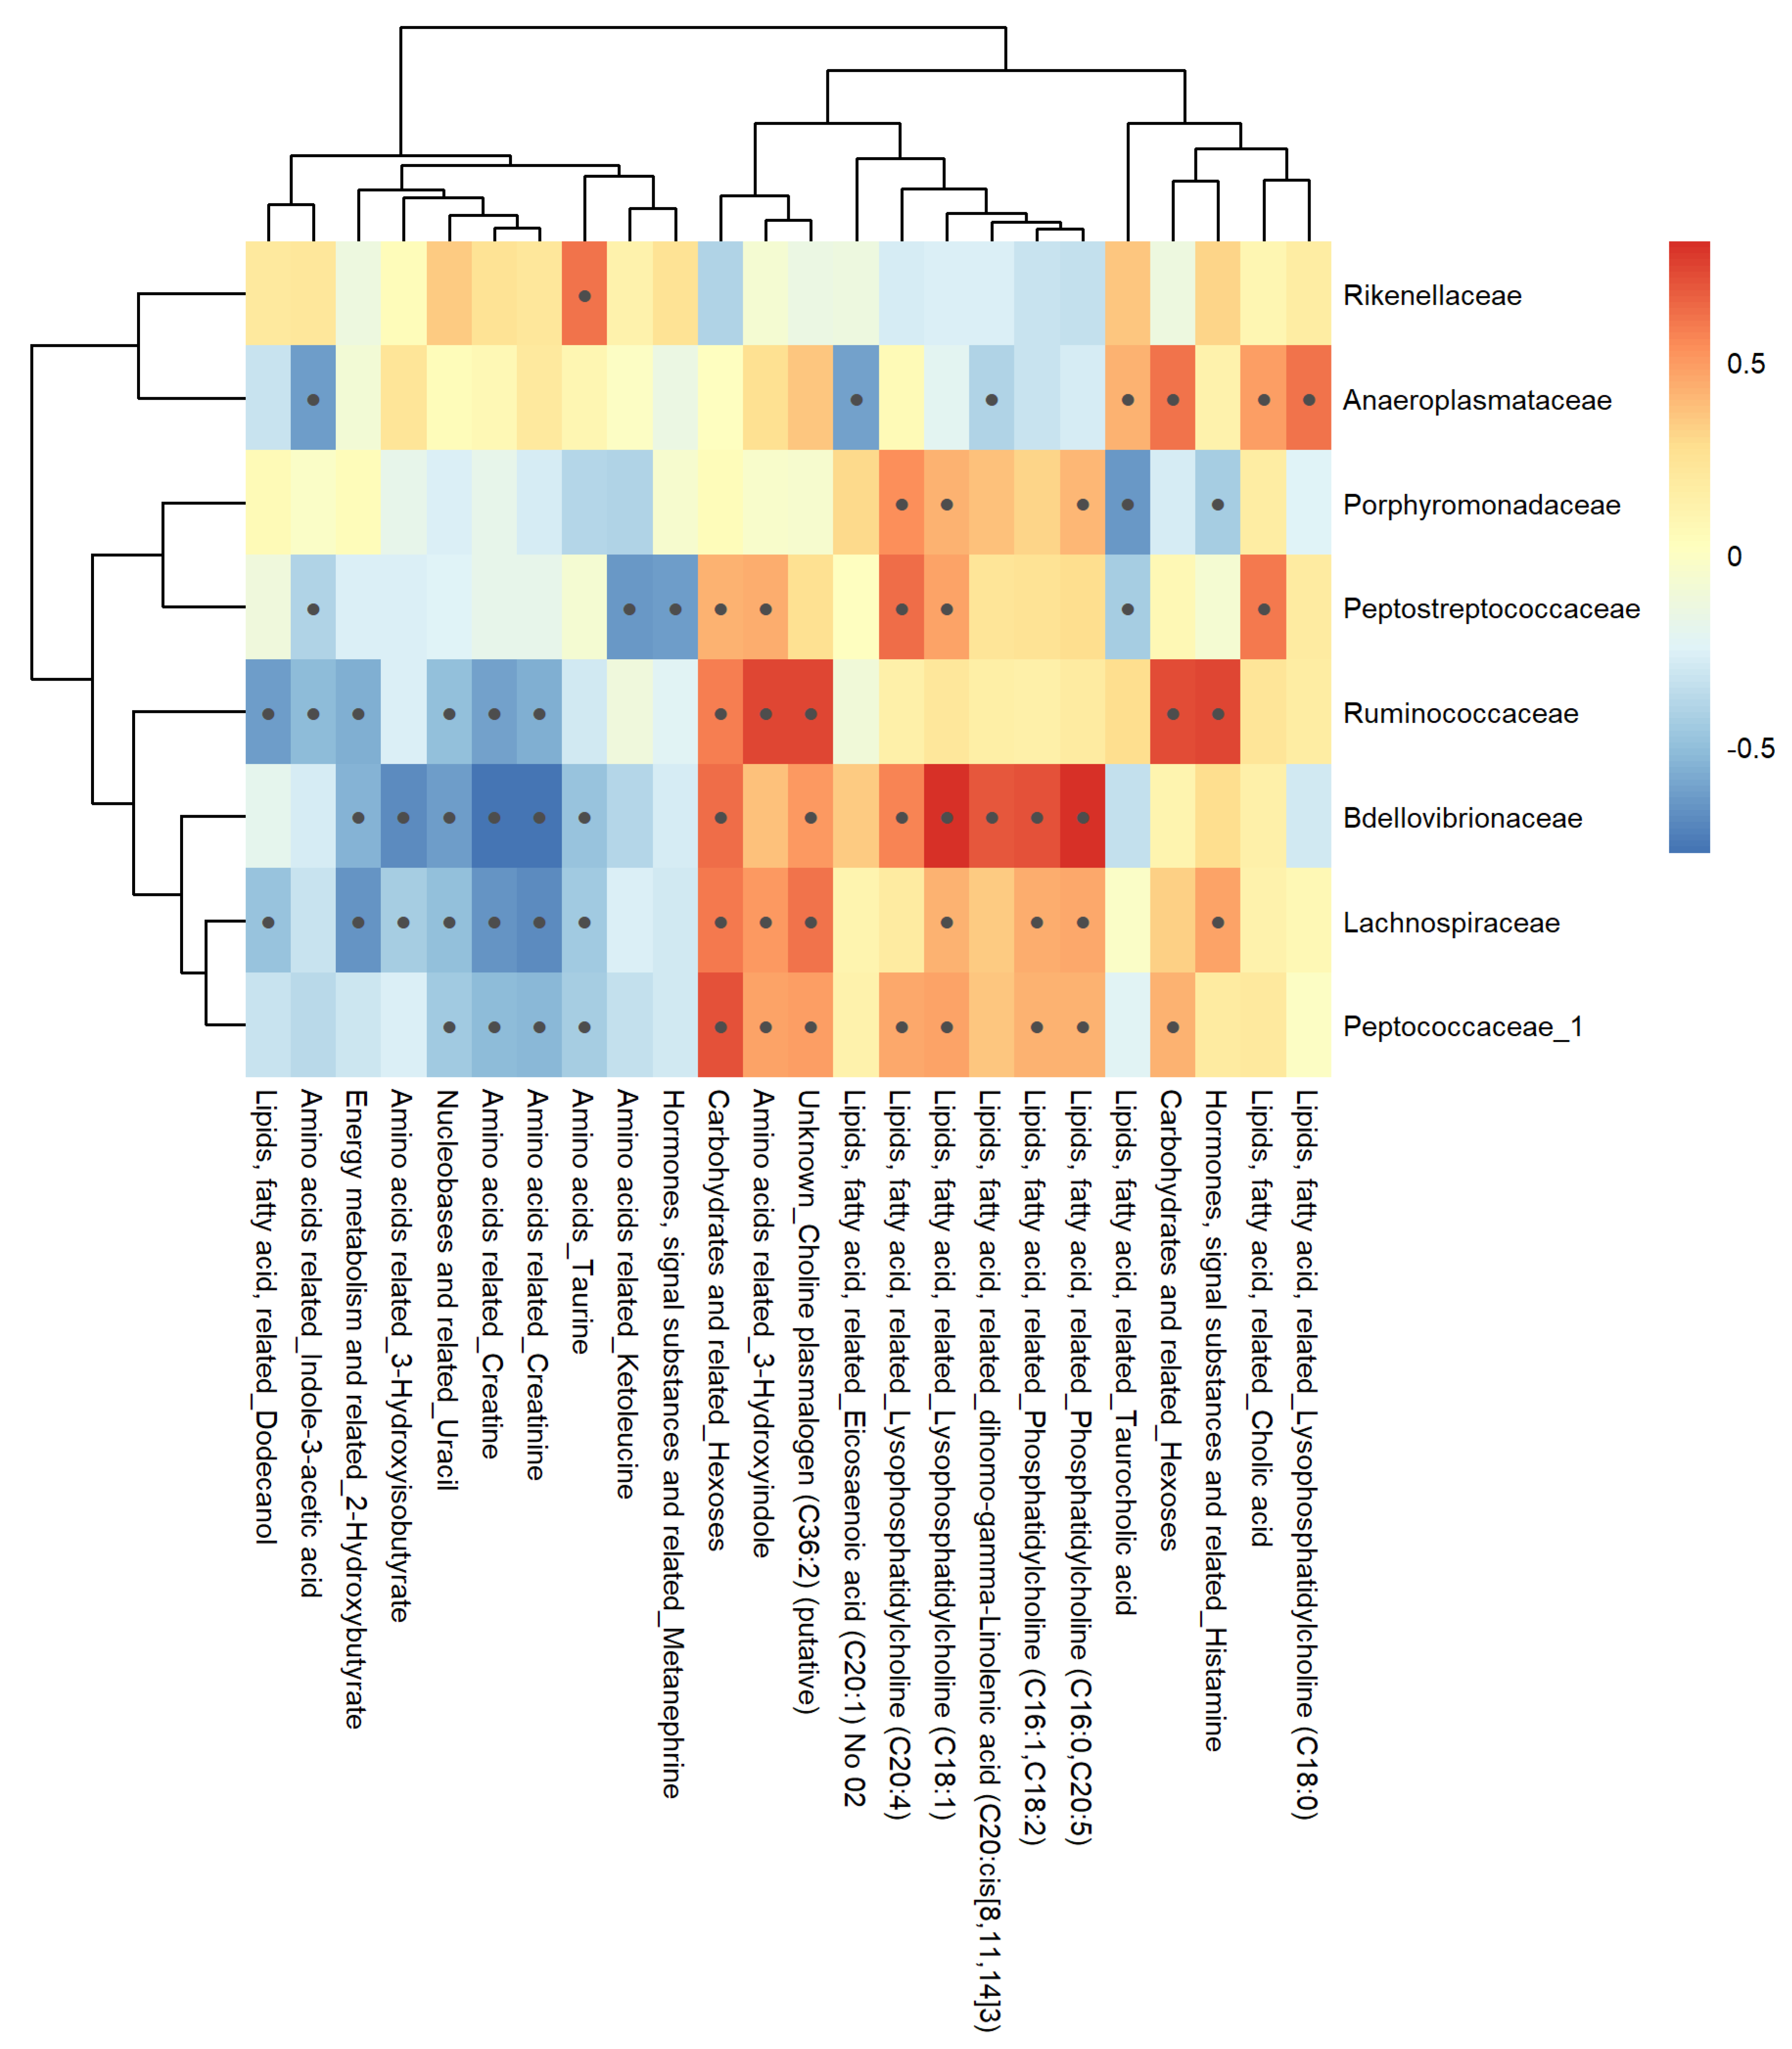
Figure 9.
Pearson colorations of 16S bacterial families and corresponding fecal metabolite classes. The heatmap shows positive (red) and negative (blue) correlations between fecal metabolites and corresponding bacterial families. Metabolite classes have been indicated along with the metabolite names on the horizontal part of the figure. Black dots within the boxes indicate p-value < 0.05 calculated using cor.test.
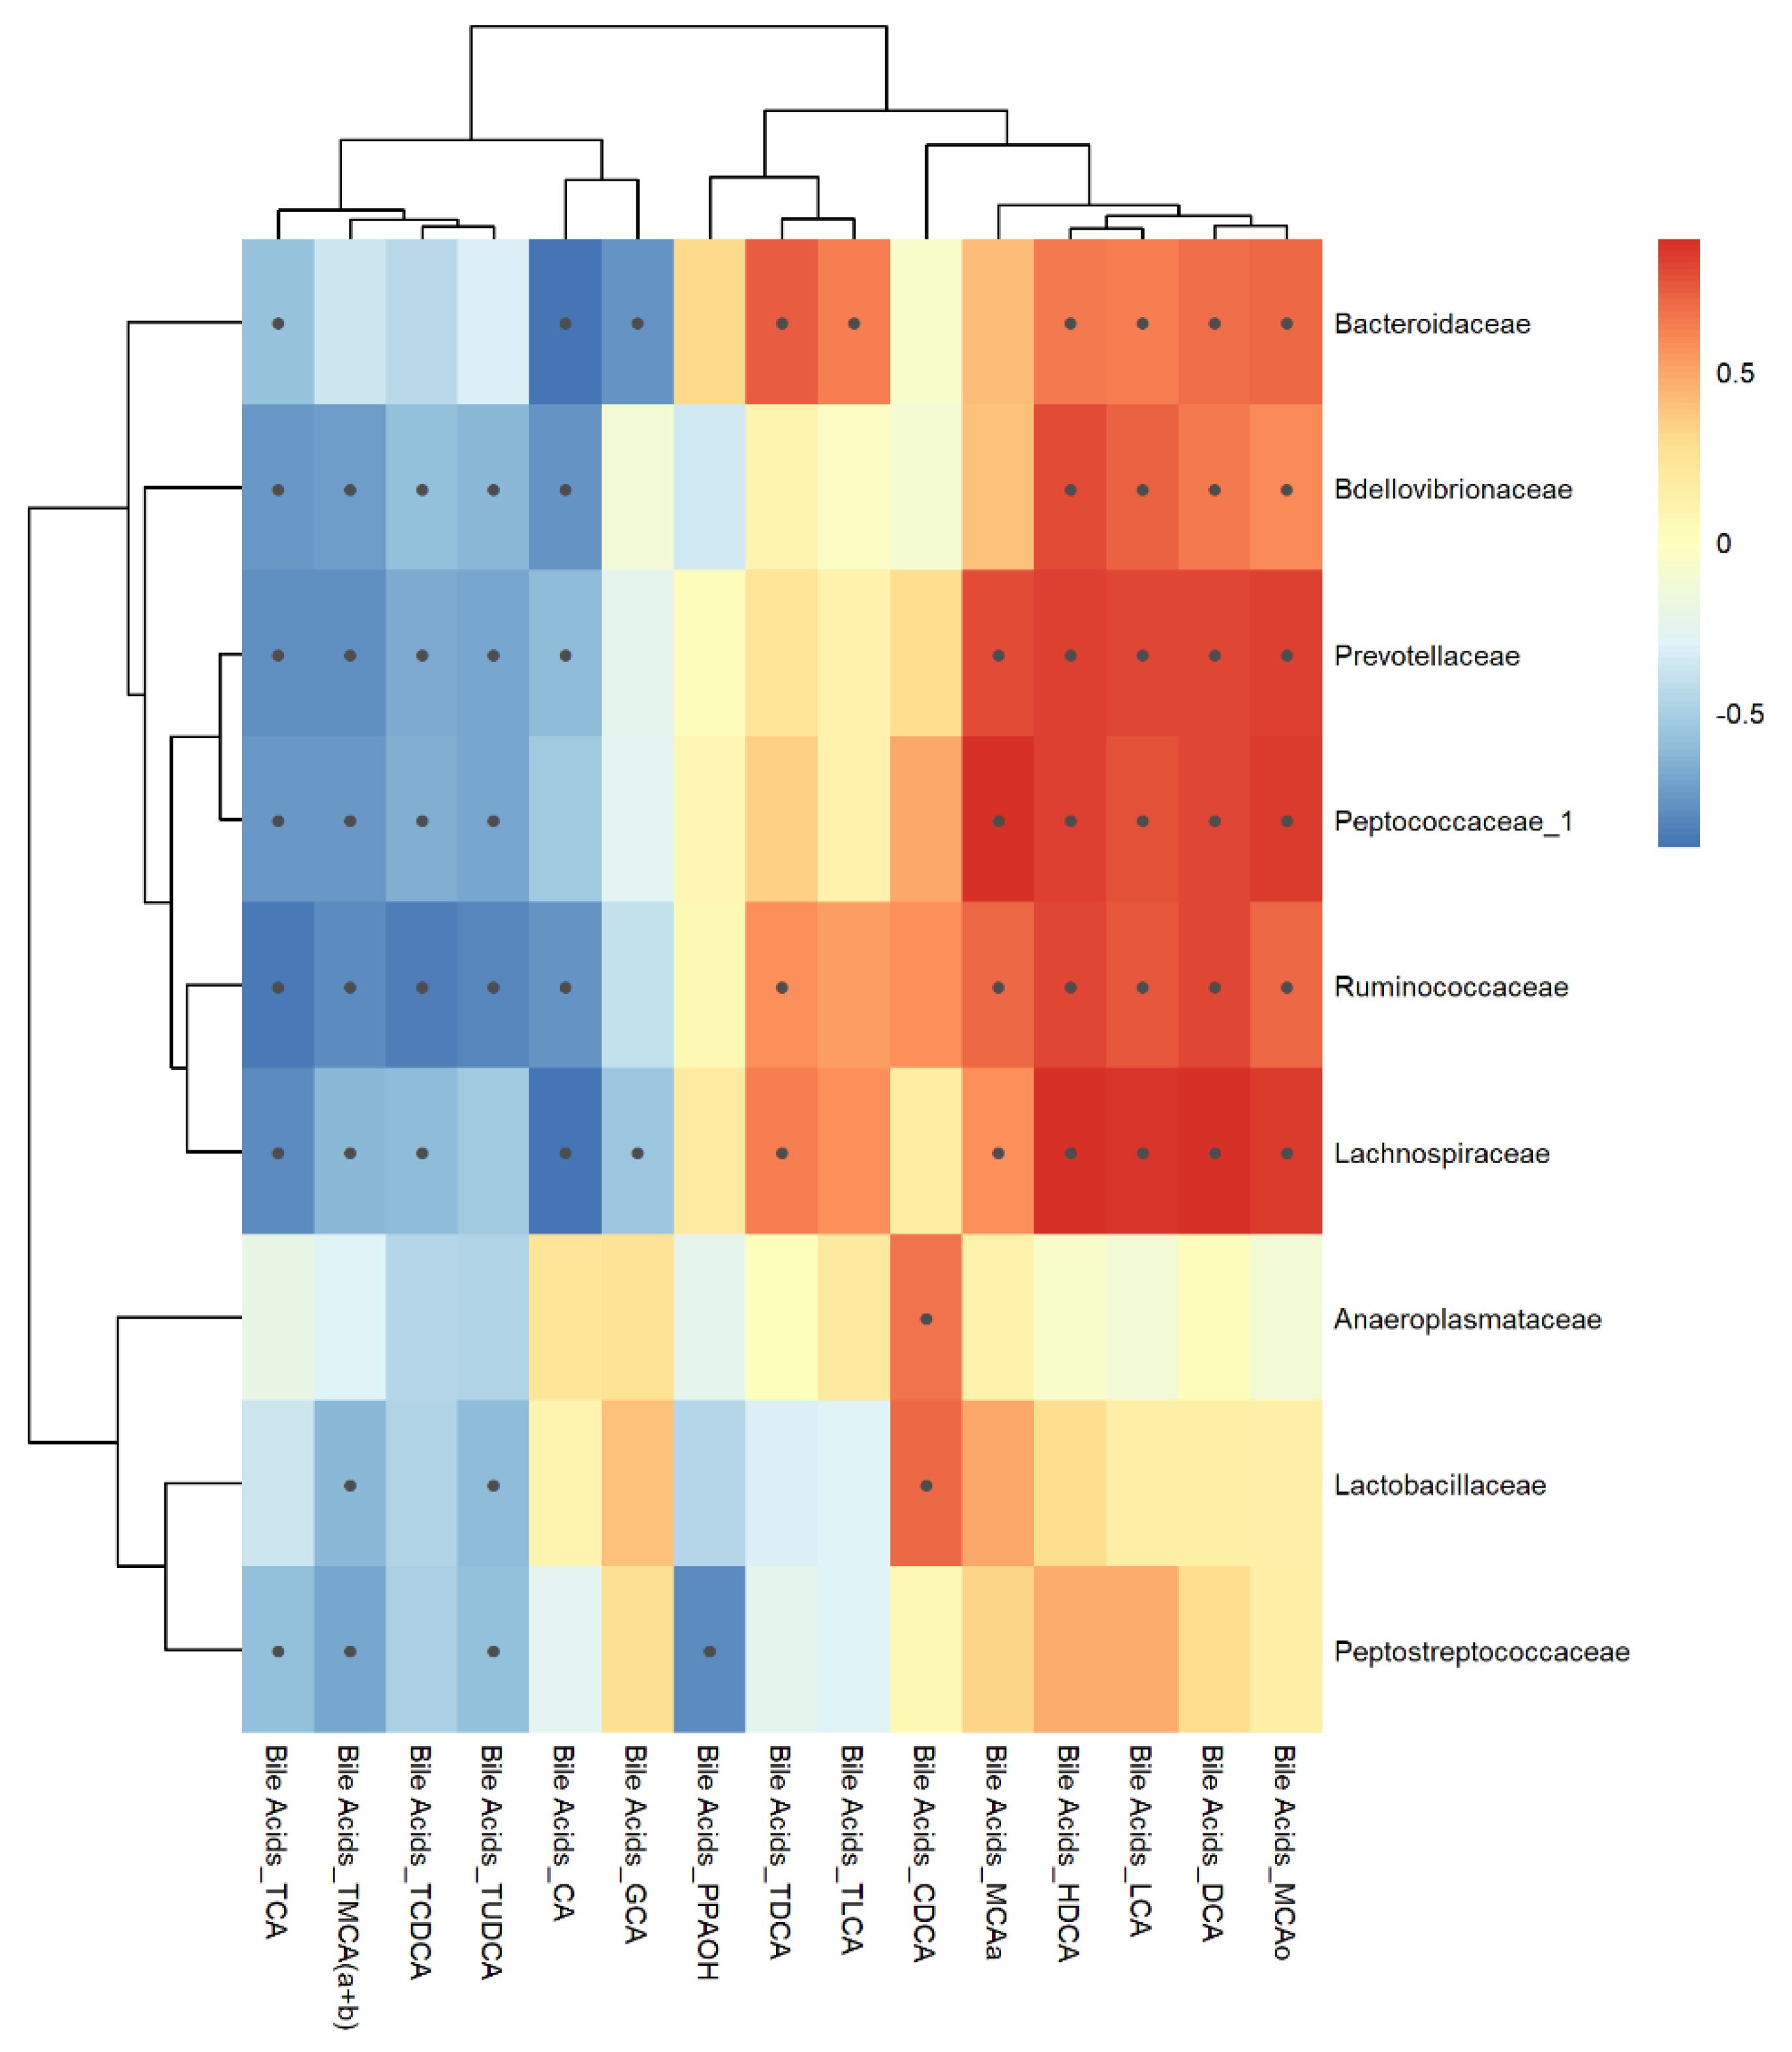
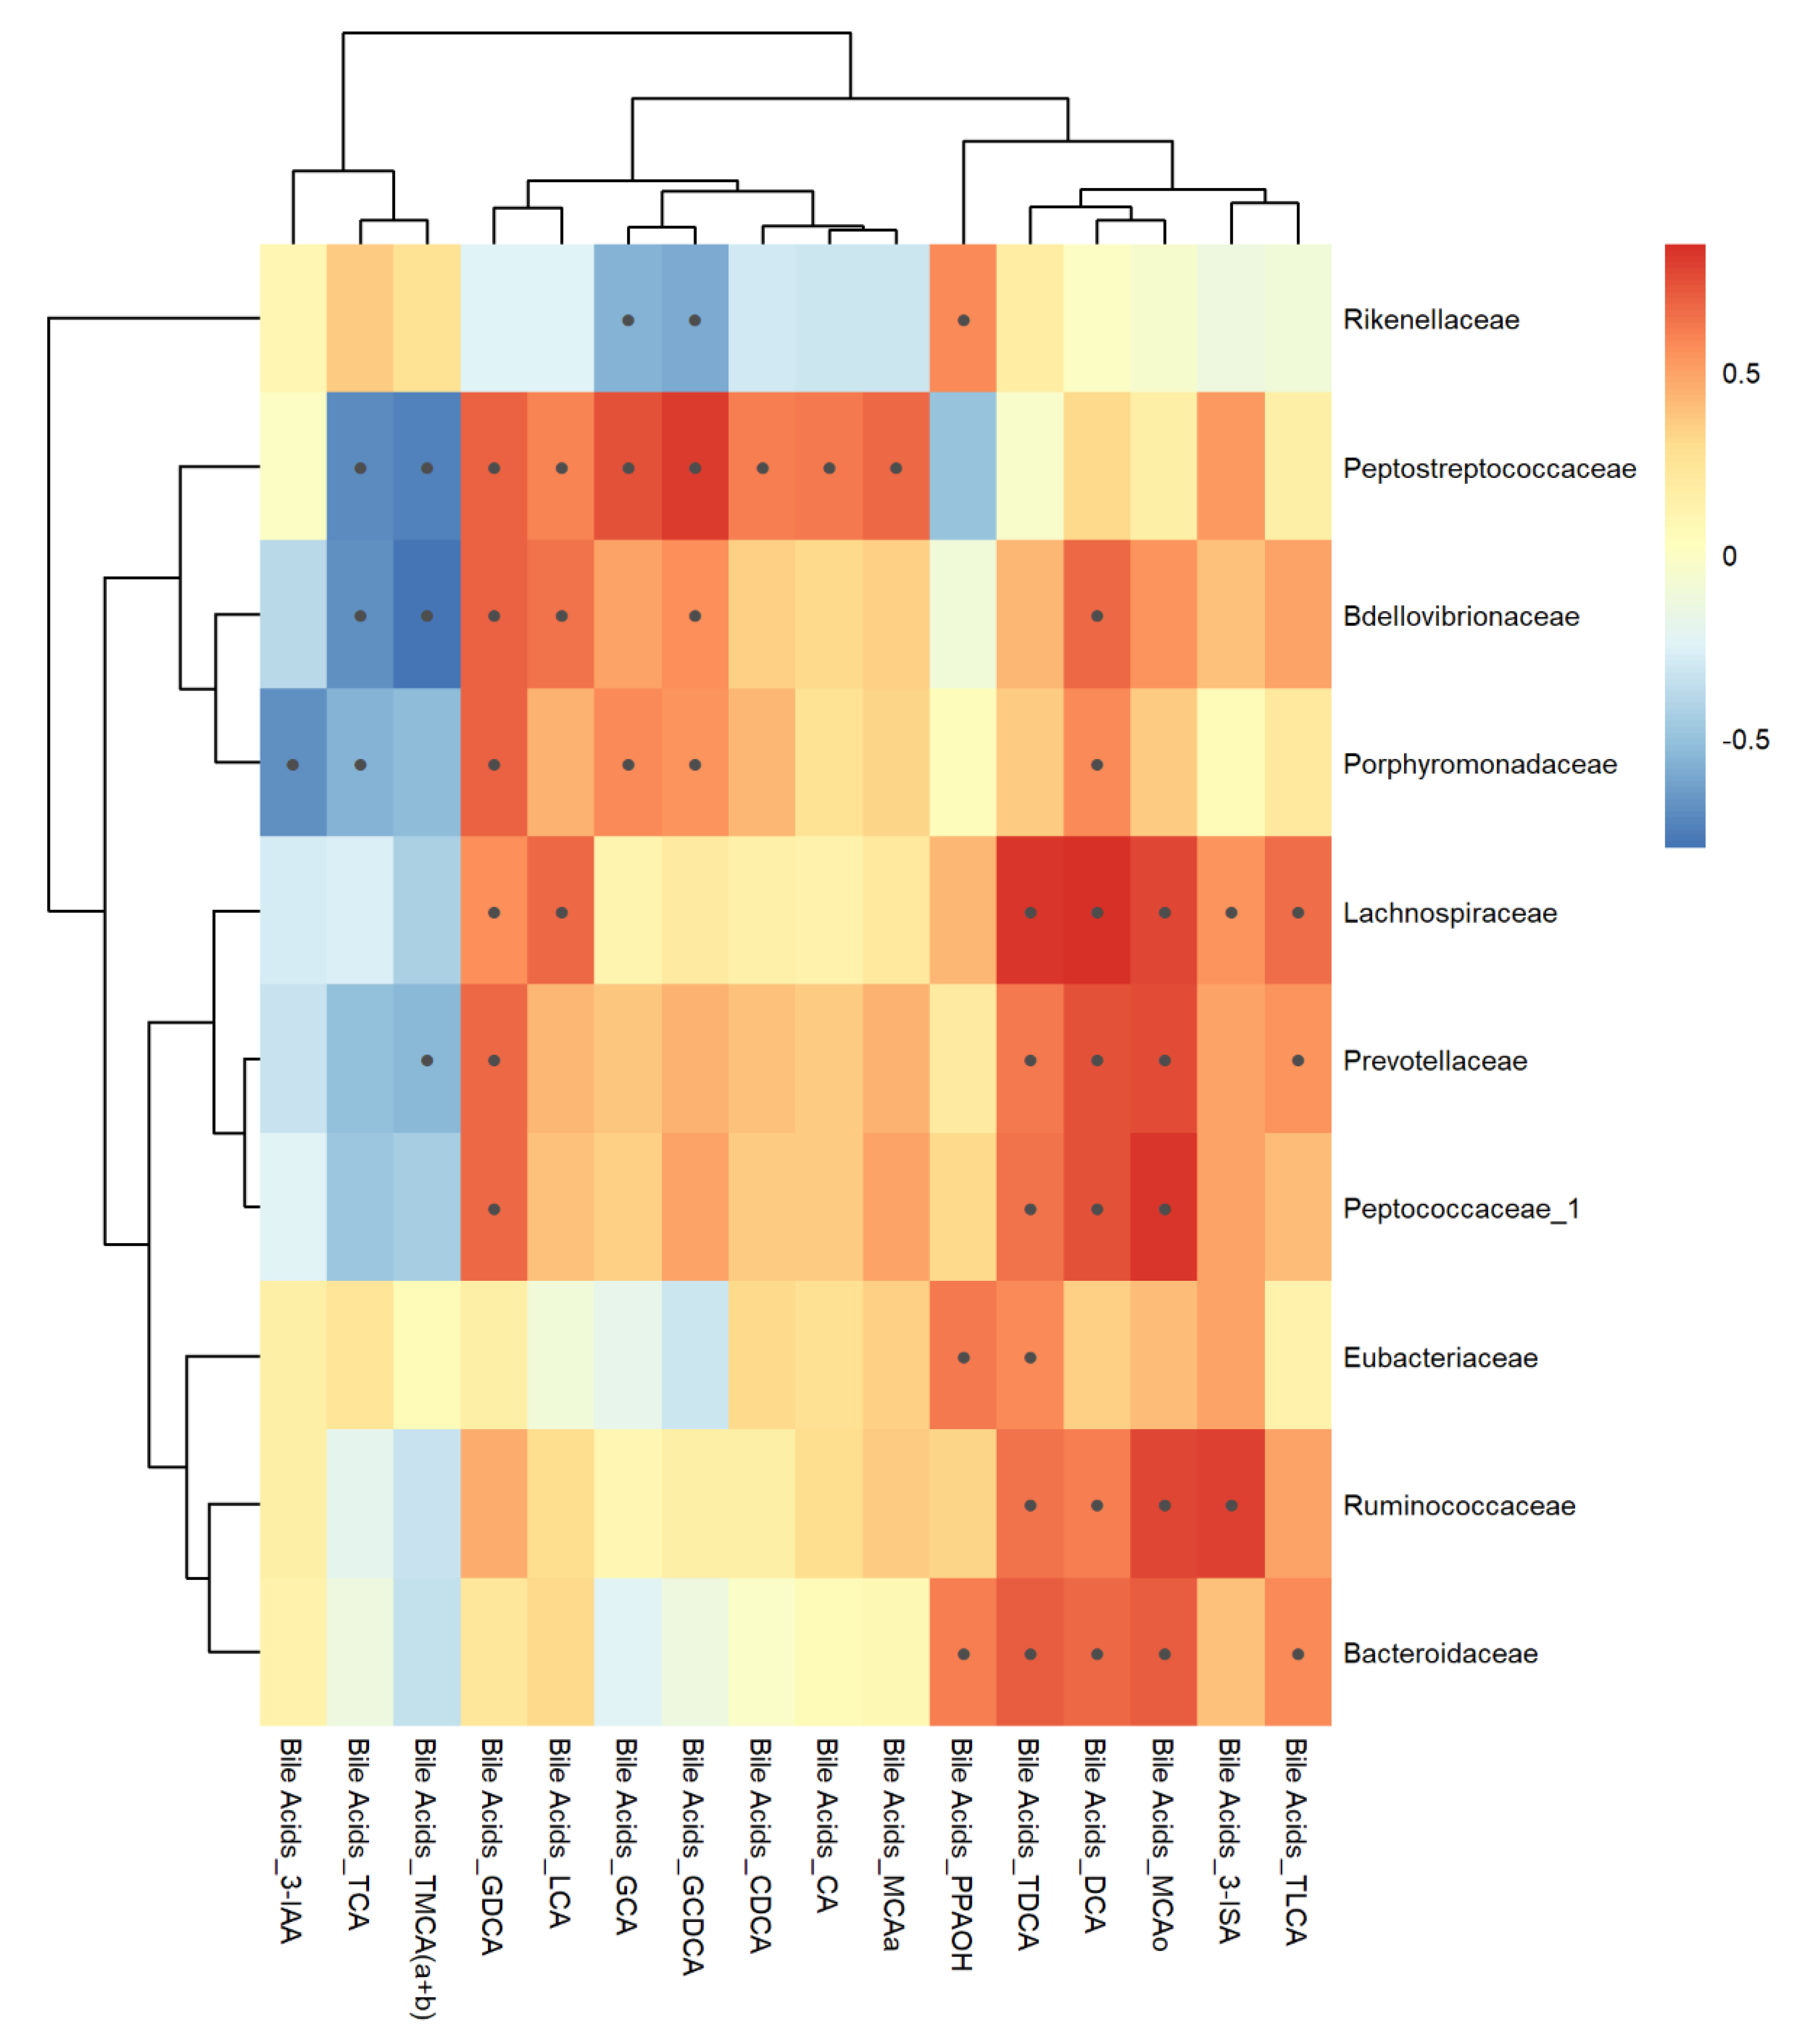
Figure 10.
Inter-omic Pearson correlations between 16S bacterial taxa and bile acid metabolites measured from feces. Black dots within the boxes indicate p-value < 0.05 calculated using cor.test.
Figure 10.
Inter-omic Pearson correlations between 16S bacterial taxa and bile acid metabolites measured from feces. Black dots within the boxes indicate p-value < 0.05 calculated using cor.test.
Figure 11.
Pearson correlations of 16S bacterial families with plasma metabolite classes. The heatmap shows positive (red) and negative (blue) correlations between plasma metabolites and corresponding bacterial families. Metabolite classes have been indicated along with the metabolite names on the horizontal part of the figure. Black dots within the boxes indicate p-value < 0.05 calculated using cor.test.
Figure 12.
Correlation analysis using Pearson correlations between plasma bile acids and 16S bacterial families. Black dots within the boxes indicate p-value < 0.05 calculated using cor.test.
Figure 12.
Correlation analysis using Pearson correlations between plasma bile acids and 16S bacterial families. Black dots within the boxes indicate p-value < 0.05 calculated using cor.test.
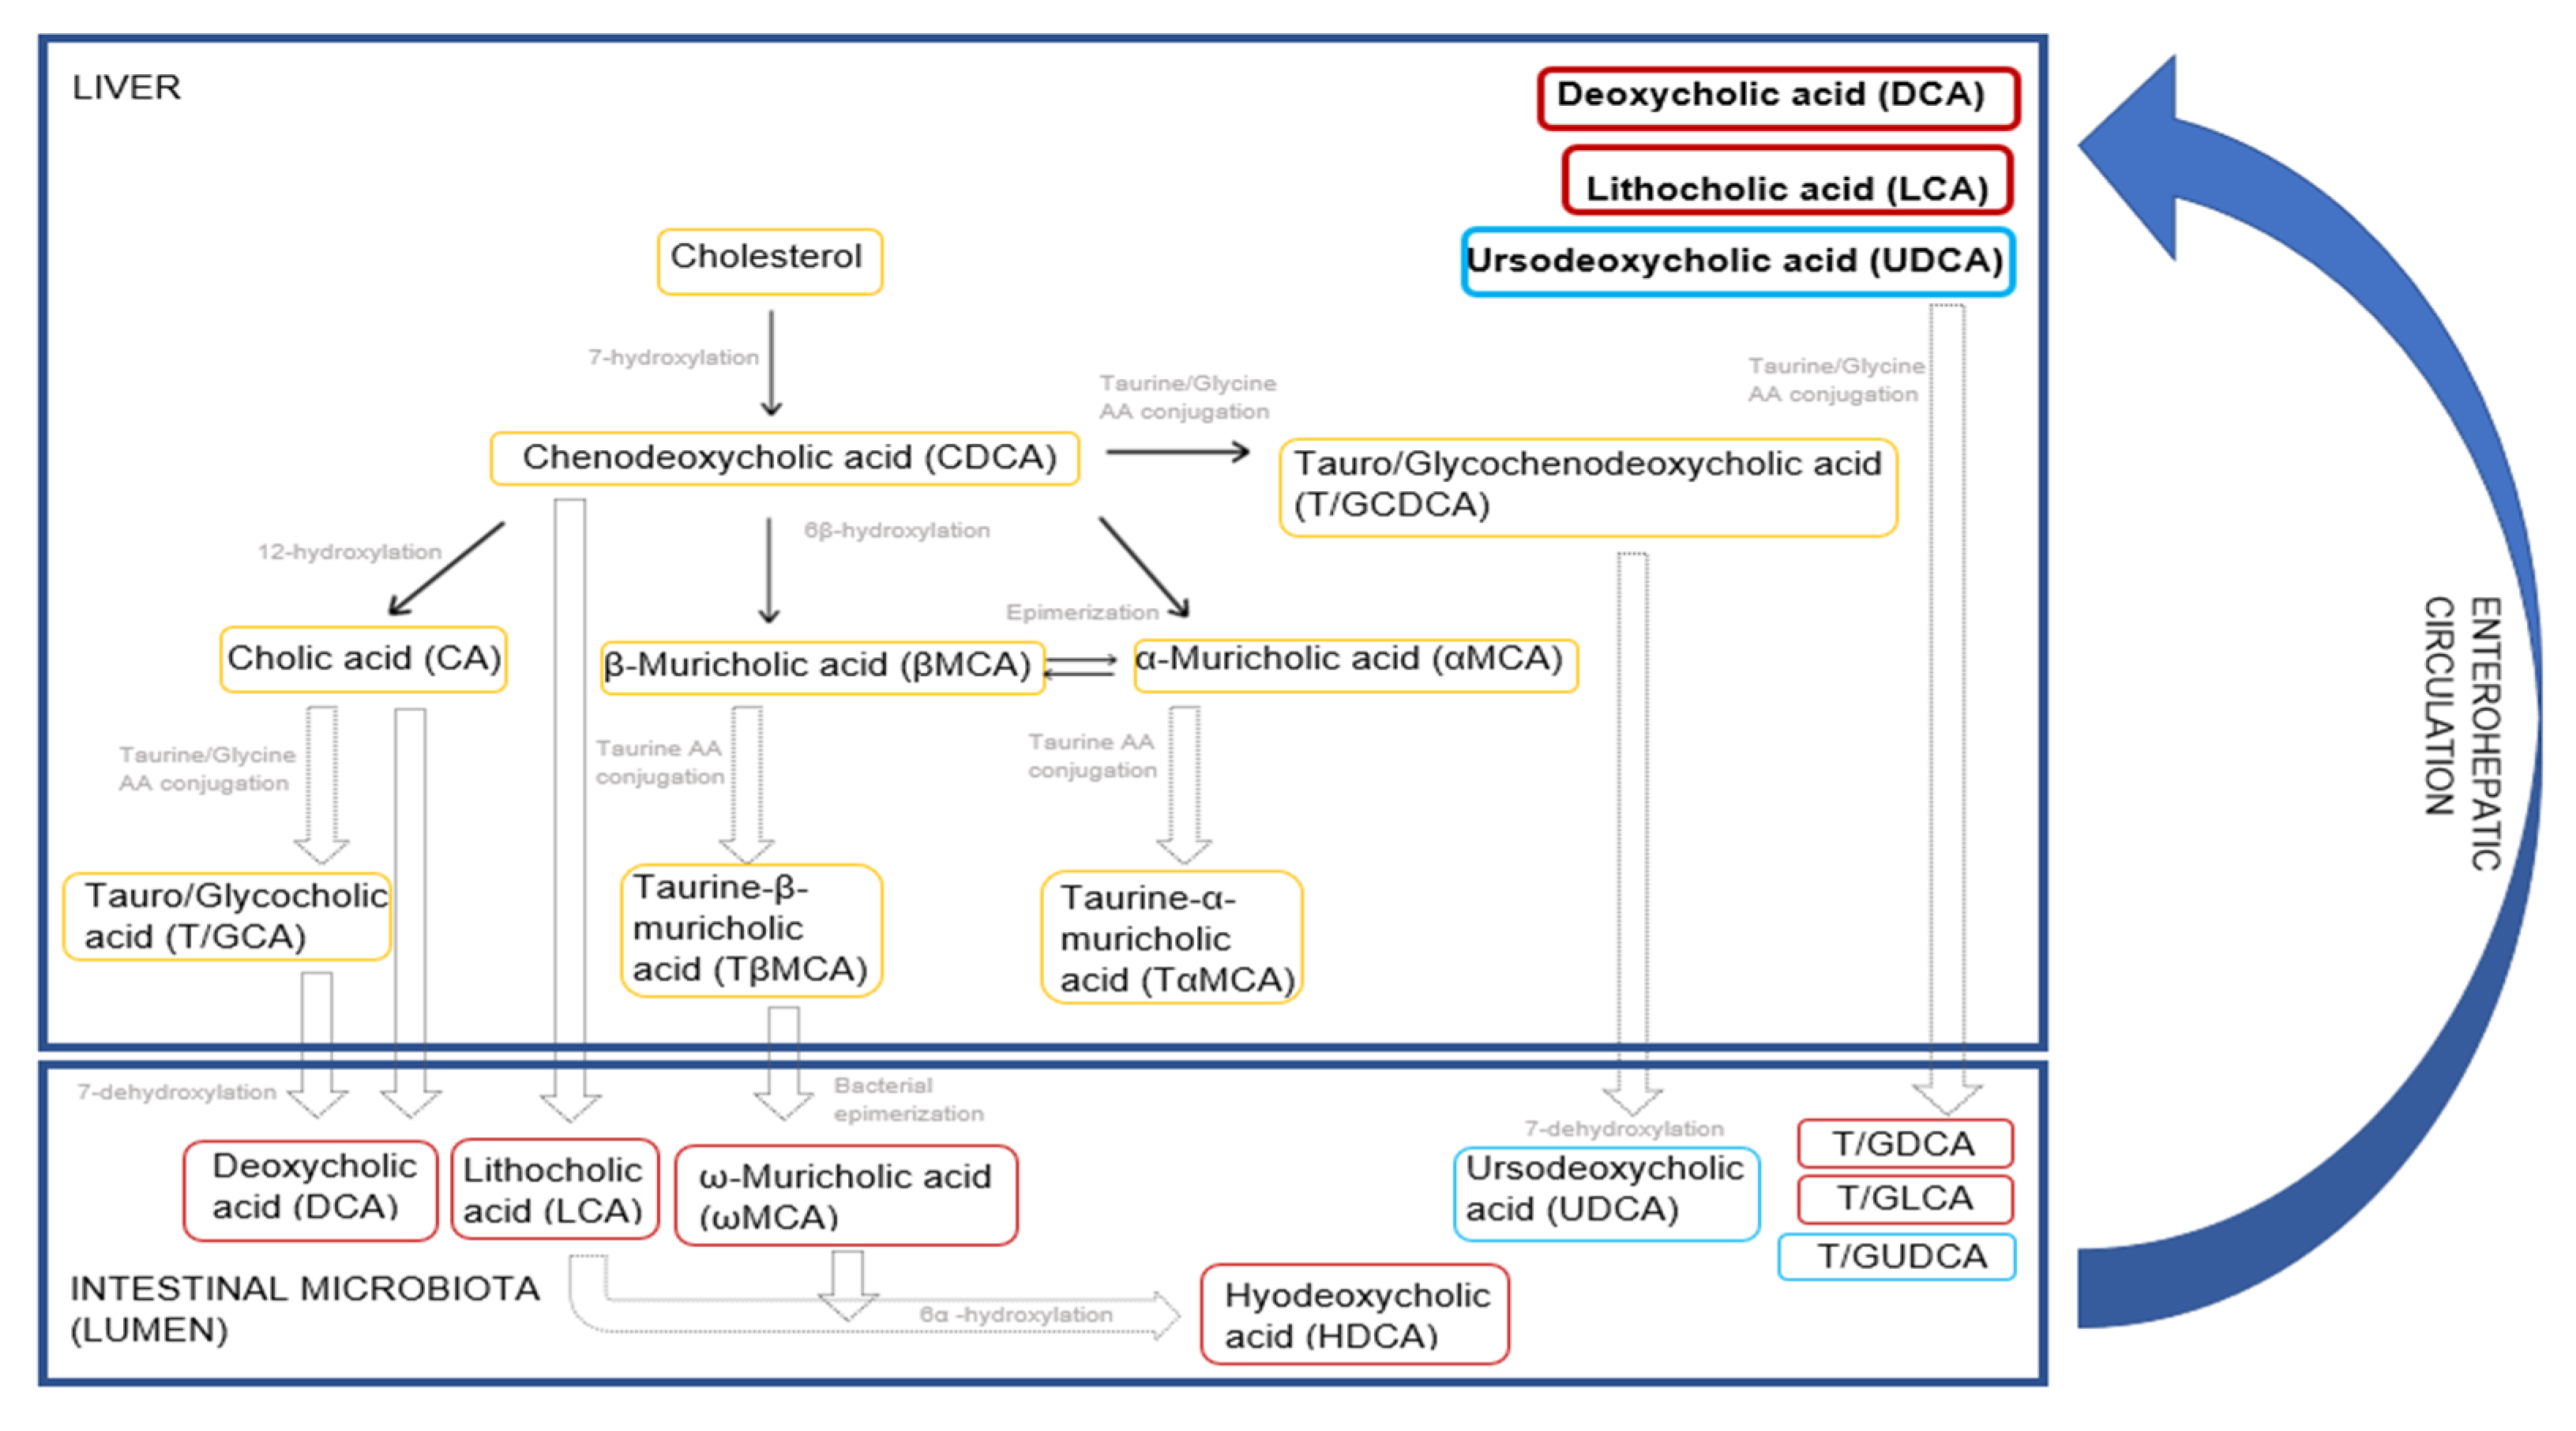
Figure 13.
Host and gut microbiota-mediated bile acid metabolism in rodents. The schematic diagram shows yellow boxes for bile acids that are primarily synthesized in the liver, red boxes for secondary bile acids that are biotransformed from the primary bile acids by the gut microbiota and blue boxes for the tertiary bile acid that enters the enterohepatic circulation. Primary, secondary and tertiary bile acids are reabsorbed from the GI walls and re-enter the liver via enterohepatic circulation to stabilize the bile acid pool. This figure was made based on previous publications [
57,
58].
Table 1.
Compounds used, dose levels, caging type and class of antibiotics. All compounds were administered orally by gavage.
Table 1.
Compounds used, dose levels, caging type and class of antibiotics. All compounds were administered orally by gavage.
| Study Number | Treatment | Low Dose (mg/kg bw/day) | High Dose (mg/kg bw/day) | Caging | Form of Preparation | Class of Antibiotics |
|---|
| 1–4 | Control diet | - | - | Grouped (5) | - | - |
| 1 | Vancomycin | 50 | 400 | Grouped (5) | in ultra-pure water | Glycopeptides |
| 1 | Streptomycin sulfate | 100 | 450 | Grouped (5) | in water containing 0.5% CMC a | Aminoglycosides |
| 1 | Roxithromycin | 200 | 600 | Grouped (5) | in water containing 0.5% CMC a | Macrolides |
| 2 | Sparfloxacin | 200 | 600 | Grouped (5) | in water containing 0.5% CMC a | Fluoroquinolones |
| 3 | Restricted diet (−20%) | - | - | Single (1) | - | - |
| 4 | Clindamycin hydrochloride | 200 | 600 | Grouped (5) | in ultra-pure water | Lincosamides |
| 4 | Lincomycin hydrochloride | 300 | 10000 | Grouped (5) | in water containing 0.5% CMC a | Lincosamides |
Table 2.
Fold changes of different bile acid levels going up (red boxes) and down (blue colored boxes) in the feces and plasma matrices of male and female Wistar rats of Clindamycin treatment (p-value depends on the shade of the colors, the darkest red is p-value < 0.01, medium red is p-value < 0.05; and the lightest shade of red is p-value < 0.10 and similarly for blue coloring). F represents females, M represents males, 7 d, 14 d and 28 d denote blood sampling time points days 7, 14 and 28, respectively.
| Metabolite Name | Analyte Name | Feces | Plasma |
|---|
| F | M | F 7d | F 14d | F 28d | M 7d | M 14d | M 28d |
|---|
| Cholate | CA | 18.64 | 19.90 | 0.02 | 0.03 | 0.01 | 0.01 | 0.03 | 0.01 |
| Chenodeoxycholate (chenodeoxycholic acid) | CDCA | 0.30 | 0.08 | 0.02 | 0.03 | 0.04 | 0.02 | 0.10 | 0.02 |
| Deoxycholate (deoxycholic acid) | DCA | 0.00 | 0.00 | 0.35 | 0.00 | 0.01 | 0.10 | 0.36 | 0.01 |
| Glycocholate, glycocholic acid | GCA | 1.72 | 0.47 | 0.44 | 0.30 | 0.21 | 0.22 | 0.35 | 0.16 |
| Glycochenodeoxycholate (glycochenodeoxycholic acid) | GCDCA | 2.67 | 0.09 | 0.56 | 0.40 | 0.76 | 0.06 | 0.08 | 0.06 |
| Glycodeoxycholate, -cholic acid | GDCA | 0.58 | | 0.04 | | 0.07 | 0.01 | 0.01 | 0.02 |
| Glycolithocholic aicd | GLCA | 0.52 | 0.44 | 0.54 | 0.26 | 0.68 | 0.12 | 0.79 | 0.36 |
| Glycoursodeoxycholic acid | GUDCA | 2.82 | 2.25 | 0.11 | 1.03 | | | 0.97 | 0.30 |
| Hyodeoxycholate, hyodeoxycholic acid | HDCA | 0.00 | 0.00 | 0.01 | 0.01 | | 0.00 | 0.01 | 0.00 |
| Lithocholate, lithocholic acid | LCA | 0.01 | 0.01 | 1.00 | | | 0.53 | 1.55 | 0.35 |
| Muricholic acid (alpha) | MCAa | 0.59 | 0.16 | 0.03 | 0.06 | 0.06 | 0.01 | 0.02 | 0.01 |
| Muricholic acid (beta) | MCAb | 2.36 | 0.87 | 0.11 | 0.25 | 0.39 | 0.15 | 0.31 | 0.39 |
| Muricholic acid (omega) | MCAo | 0.06 | 0.01 | 0.00 | 0.01 | 0.04 | 0.01 | 0.00 | 0.01 |
| Taurocholate, taurocholic acid | TCA | 47.42 | 90.80 | 1.34 | 1.01 | 1.63 | 4.68 | 2.94 | 4.56 |
| Taurochenodeoxycholate | TCDCA | 35.03 | 13.64 | 1.38 | 0.99 | 1.54 | 2.46 | 1.46 | 1.25 |
| Taurodeoxycholate, -cholic acid | TDCA | 0.25 | 0.15 | 0.02 | 0.01 | 0.01 | 0.01 | 0.01 | 0.05 |
| Taurolithocholic aicd | TLCA | 0.15 | 0.34 | 0.04 | | 0.04 | 0.19 | 0.14 | 0.19 |
| Tauromuricholic acid (a + b) | TMCA (a + b) | 155.83 | 192.72 | 1.96 | 1.41 | 2.38 | 4.97 | 2.57 | 3.99 |
| Tauroursodeoxycholic acid | TUDCA | 22.61 | 28.27 | 6.92 | | | 0.20 | 0.57 | 0.74 |
| Ursodeoxycholate, Ursodeoxycholic acid, Ursodiol | UDCA | 0.02 | 0.03 | 0.05 | 0.27 | 0.01 | 0.01 | 0.30 | 0.02 |
Table 3.
Fold changes of different bile acid levels going up (red coloed boxes) and down (blue boxes) in the feces and plasma matrices of male and female Wistar rats of Vancomycin treatment (p-value depends on the shade of the colors; the darkest red represents p-value < 0.01, medium red represents p-value < 0.05 and the lightest shade of red represents p-value < 0.10, and similarly for blue). F represents females, M represents males, 7 d, 14 d and 28 d denote blood sampling time points days 7, 14 and 28, respectively.
| Metabolite Name | Analyte Name | Feces | Plasma |
|---|
| F | M | F 7d | F 14d | F 28d | M 7d | M 14d | M 28d |
|---|
| Cholate | CA | 19.45 | 38.66 | 0.18 | 0.60 | 0.14 | 0.10 | 0.13 | 0.13 |
| Chenodeoxycholate (chenodeoxycholic acid) | CDCA | 4.30 | 0.99 | 0.18 | 0.36 | 0.05 | 0.10 | 0.16 | 0.18 |
| Deoxycholate (deoxycholic acid) | DCA | 0.00 | 0.00 | 0.01 | 0.42 | 0.01 | 0.00 | 0.18 | 0.00 |
| Glycocholate, glycocholic acid | GCA | 2.67 | 1.45 | 0.46 | 1.54 | 0.73 | 0.39 | 0.36 | 0.18 |
| Glycochenodeoxycholate (glycochenodeoxycholic acid) | GCDCA | 1.01 | 1.54 | 0.39 | 0.87 | 0.64 | 0.30 | 0.27 | 0.42 |
| Glycodeoxycholate, -cholic acid | GDCA | 0.32 | 0.34 | 0.02 | 0.07 | 0.03 | 0.01 | 0.00 | 0.05 |
| Glycolithocholic aicd | GLCA | 0.24 | 0.86 | 0.56 | 0.21 | 0.20 | 0.48 | 1.65 | 4.39 |
| Glycoursodeoxycholic acid | GUDCA | 1.44 | 1.44 | 1.65 | 1.18 | 3.31 | 0.43 | 16.34 | 10.13 |
| Hyodeoxycholate, hyodeoxycholic acid | HDCA | 0.00 | 0.00 | 0.01 | 0.01 | 0.00 | 0.00 | 0.00 | 0.00 |
| Lithocholate, lithocholic acid | LCA | 0.01 | 0.07 | 0.12 | 10.74 | 0.15 | 0.35 | 27.95 | 0.19 |
| Muricholic acid (alpha) | MCAa | 0.44 | 0.71 | 0.21 | 0.44 | 0.10 | 0.13 | 0.14 | 0.23 |
| Muricholic acid (beta) | MCAb | 0.50 | 0.53 | 0.54 | 1.01 | 1.35 | 0.17 | 0.18 | 0.38 |
| Muricholic acid (omega) | MCAo | 0.02 | 0.03 | 0.05 | 0.01 | 0.07 | 0.03 | 0.01 | 0.02 |
| Taurocholate, taurocholic acid | TCA | 4.18 | 7.39 | 2.04 | 6.99 | 3.83 | 2.47 | 2.71 | 2.62 |
| Taurochenodeoxycholate | TCDCA | 0.99 | 3.04 | 1.87 | 2.42 | 2.64 | 2.69 | 3.18 | 2.97 |
| Taurodeoxycholate, -cholic acid | TDCA | 0.16 | 0.09 | 0.01 | 0.02 | 0.01 | 0.01 | 0.01 | 0.01 |
| Taurolithocholic aicd | TLCA | 0.42 | | 0.03 | 0.04 | 0.03 | 0.12 | 0.18 | 1.58 |
| Tauromuricholic acid (a + b) | TMCA (a + b) | 2.86 | 3.89 | 3.10 | 4.02 | 3.59 | 1.93 | 2.71 | 3.11 |
| Tauroursodeoxycholic acid | TUDCA | 0.54 | 2.93 | 3.61 | 1.82 | | 1.23 | | 0.79 |
| Ursodeoxycholate, Ursodeoxycholic acid, Ursodiol | UDCA | | | 0.21 | 0.06 | 0.29 | 0.13 | 0.12 | 0.23 |
Table 4.
Fold changes of different bile acid levels going up (red boxes) and down (blue colored boxes) in the feces and plasma matrices of male and female Wistar rats of Sparfloxacin treatment (p-value depends on the shade of the colors; the darkest red represents p-value < 0.01, medium red represents p-value < 0.05 and the lightest shade of red represents p-value < 0.10, and similarly for blue). F represents females, M represents males, 7 d, 14 d and 28 d denote blood sampling time points days 7, 14 and 28, respectively.
| Metabolite Name | Analyte Name | Feces | Plasma |
|---|
| F | M | F 7d | F 14d | F 28d | M 7d | M 14d | M 28d |
|---|
| Cholate | CA | 27.39 | 22.73 | 1.08 | 0.46 | 0.32 | 0.11 | 0.91 | 0.90 |
| Chenodeoxycholate (chenodeoxycholic acid) | CDCA | 0.52 | | 0.32 | 0.17 | 0.37 | 0.04 | 0.28 | 0.94 |
| Deoxycholate (deoxycholic acid) | DCA | 0.01 | 0.00 | 0.09 | 0.02 | 0.08 | 0.01 | 0.18 | 0.03 |
| Glycocholate, glycocholic acid | GCA | 1.88 | 1.57 | 1.02 | 0.53 | 2.05 | 0.42 | 0.59 | 0.71 |
| Glycochenodeoxycholate (glycochenodeoxycholic acid) | GCDCA | 1.25 | 2.93 | 0.51 | 0.34 | 1.61 | 0.14 | 0.13 | 0.40 |
| Glycodeoxycholate, -cholic acid | GDCA | | 2.70 | 0.08 | 0.25 | 0.51 | 0.02 | 0.01 | 0.12 |
| Glycolithocholic aicd | GLCA | 8.22 | 1.33 | | 0.90 | 0.71 | 0.24 | | 1.93 |
| Glycoursodeoxycholic acid | GUDCA | 0.96 | 1.61 | | | | | 0.33 | 1.30 |
| Hyodeoxycholate, hyodeoxycholic acid | HDCA | 0.01 | 0.00 | 0.06 | 0.01 | | 0.00 | 0.00 | |
| Lithocholate, lithocholic acid | LCA | 0.24 | 0.01 | 0.12 | 0.01 | 13.09 | 0.18 | 9.66 | 0.31 |
| Muricholic acid (alpha) | MCAa | 0.58 | 0.16 | 0.67 | 0.24 | 0.57 | 0.05 | 0.38 | 0.73 |
| Muricholic acid (beta) | MCAb | 0.33 | 0.37 | 1.46 | 1.21 | 0.31 | 0.25 | 1.87 | 1.10 |
| Muricholic acid (omega) | MCAo | 0.01 | 0.02 | 0.20 | 0.01 | 0.01 | 0.01 | 0.00 | |
| Taurocholate, taurocholic acid | TCA | 4.95 | 8.29 | 2.61 | 3.25 | 1.73 | 7.96 | 5.32 | 3.09 |
| Taurochenodeoxycholate | TCDCA | 2.29 | 4.99 | 1.21 | 1.44 | 1.77 | 3.85 | 3.63 | 2.08 |
| Taurodeoxycholate, -cholic acid | TDCA | 0.30 | 0.18 | 0.09 | 0.21 | 0.03 | 0.11 | 0.03 | 0.04 |
| Taurolithocholic aicd | TLCA | 0.27 | 0.75 | | 1.11 | 0.06 | 0.28 | 0.33 | 0.22 |
| Tauromuricholic acid (a + b) | TMCA (a + b) | 7.08 | 16.86 | 1.72 | 1.73 | 1.88 | 4.25 | 4.95 | 2.27 |
| Tauroursodeoxycholic acid | TUDCA | 2.12 | 9.35 | | 10.27 | | | 7.76 | 1.82 |
| Ursodeoxycholate, Ursodeoxycholic acid, Ursodiol | UDCA | 0.25 | 0.01 | 0.36 | 0.56 | 0.23 | 0.13 | 1.20 | 1.17 |
Table 5.
Fold changes of different bile acid levels going up (red boxes) and down (blue colored boxes) in the feces and plasma matrices of male and female Wistar rats of Roxithromycin treatment (p-value depends on the shade of the colors; the darkest red is p-value < 0.01, medium red is p-value < 0.05 and the lightest shade of red is p-value < 0.10, and similarly for blue). F represents females, M represents males, 7 d, 14 d and 28 d denote blood sampling time points days 7, 14 and 28, respectively.
| Metabolite Name | Analyte Name | Feces | Plasma |
|---|
| F | M | F 7d | F 14 d | F 28 d | M 7d | M 14 d | M 28 d |
|---|
| Cholate | CA | 0.52 | 0.55 | 0.04 | 0.05 | 0.13 | 0.00 | 0.00 | 0.02 |
| Chenodeoxycholate (chenodeoxycholic acid) | CDCA | 0.90 | | 0.02 | 0.06 | 0.08 | 0.02 | 0.01 | 0.05 |
| Deoxycholate (deoxycholic acid) | DCA | 0.49 | 0.70 | 0.75 | 0.58 | 0.86 | 0.15 | 0.11 | 0.20 |
| Glycocholate, glycocholic acid | GCA | 0.15 | 0.23 | 0.42 | 0.30 | 0.10 | 0.25 | 0.10 | 0.08 |
| Glycochenodeoxycholate (glycochenodeoxycholic acid) | GCDCA | 0.42 | 0.72 | 0.39 | 0.36 | 0.17 | 0.38 | 0.10 | 0.08 |
| Glycodeoxycholate, -cholic acid | GDCA | | 0.49 | 0.51 | 0.37 | 0.07 | 0.14 | 0.05 | 0.07 |
| Glycolithocholic aicd | GLCA | 0.41 | 1.63 | 0.28 | 0.27 | 0.49 | 0.33 | 0.93 | 0.66 |
| Glycoursodeoxycholic acid | GUDCA | 1.44 | | 1.82 | 0.59 | 1.13 | 0.46 | 1.45 | 0.63 |
| Hyodeoxycholate, hyodeoxycholic acid | HDCA | 0.06 | 0.03 | 0.10 | 0.04 | 0.10 | 0.01 | 0.01 | 0.01 |
| Lithocholate, lithocholic acid | LCA | 0.23 | 0.35 | 0.71 | 0.46 | 0.72 | 0.64 | 6.52 | 0.50 |
| Muricholic acid (alpha) | MCAa | 0.73 | 0.62 | 0.22 | 0.19 | 0.11 | 0.08 | 0.02 | 0.05 |
| Muricholic acid (beta) | MCAb | 1.33 | 0.84 | 0.71 | 1.30 | 2.28 | 0.16 | 0.05 | 0.22 |
| Muricholic acid (omega) | MCAo | 0.77 | 0.60 | 1.19 | 0.60 | 1.47 | 0.74 | 0.36 | 0.42 |
| Taurocholate, taurocholic acid | TCA | 2.41 | 1.58 | 2.59 | 5.55 | 3.14 | 3.35 | 2.19 | 3.77 |
| Taurochenodeoxycholate | TCDCA | 1.42 | 1.54 | 1.69 | 1.48 | 1.84 | 2.07 | 2.02 | 2.28 |
| Taurodeoxycholate, -cholic acid | TDCA | 9.42 | 4.61 | 2.29 | 3.11 | 1.89 | 2.55 | 1.19 | 2.06 |
| Taurolithocholic aicd | TLCA | 3.26 | 3.13 | 0.74 | 0.75 | 1.39 | 1.05 | 0.68 | 0.61 |
| Tauromuricholic acid (a + b) | TMCA (a + b) | 10.14 | 7.97 | 1.94 | 2.94 | 2.37 | 3.62 | 2.67 | 3.02 |
| Tauroursodeoxycholic acid | TUDCA | 3.42 | 2.20 | 9.03 | 1.23 | | 1.24 | | 0.55 |
| Ursodeoxycholate, Ursodeoxycholic acid, Ursodiol | UDCA | | | 0.11 | 0.06 | 0.53 | 0.03 | 0.05 | 0.01 |
Table 6.
Fold changes of different bile acid levels going up (red boxes) and down (blue boxes) in the feces and plasma matrices of male and female Wistar rats of Streptomycin sulfate treatment (p-value depends on the shade of the colors, the darkest red is p-value < 0.01, medium red is p value < 0.05 and the lightest shade of red is p-value < 0.10, and similarly for blue). F represents females, M represents males, 7 d, 14 d and 28 d denote blood sampling time points days 7, 14 and 28, respectively.
| Metabolite Name | Analyte Name | Feces | Plasma |
|---|
| F | M | F | M | F | M | F | M |
|---|
| Cholate | CA | 8.33 | 3.68 | 0.49 | 0.97 | 0.14 | 0.71 | 0.01 | 0.24 |
| Chenodeoxycholate (chenodeoxycholic acid) | CDCA | 17.60 | 0.56 | 0.43 | 1.65 | 0.17 | 0.64 | 0.02 | 0.37 |
| Deoxycholate (deoxycholic acid) | DCA | 1.15 | 1.56 | 0.67 | 0.68 | 1.22 | 0.62 | 0.15 | 0.31 |
| Glycocholate, glycocholic acid | GCA | 1.14 | 0.29 | 3.56 | 0.72 | 0.58 | 1.53 | 0.35 | 0.26 |
| Glycochenodeoxycholate (glycochenodeoxycholic acid) | GCDCA | 0.61 | 0.70 | 1.28 | 0.93 | 0.98 | 0.41 | 0.10 | 0.31 |
| Glycodeoxycholate, -cholic acid | GDCA | 0.39 | 0.21 | 1.54 | 1.02 | 0.49 | 0.23 | 0.05 | 0.10 |
| Glycolithocholic aicd | GLCA | 0.35 | 1.41 | 0.46 | 0.27 | 0.23 | 0.39 | 0.25 | 0.80 |
| Glycoursodeoxycholic acid | GUDCA | 0.89 | 0.50 | 1.65 | 0.61 | 1.00 | 1.06 | 1.24 | 0.89 |
| Hyodeoxycholate, hyodeoxycholic acid | HDCA | 0.20 | 0.04 | 0.18 | 0.25 | 0.34 | 0.03 | 0.01 | 0.03 |
| Lithocholate, lithocholic acid | LCA | 0.35 | 0.89 | 0.68 | 0.39 | 0.67 | 0.69 | 0.35 | 0.43 |
| Muricholic acid (alpha) | MCAa | 2.95 | 2.43 | 0.45 | 1.03 | 0.42 | 1.11 | 0.04 | 0.32 |
| Muricholic acid (beta) | MCAb | 1.07 | 2.79 | 1.89 | 1.81 | 0.77 | 1.89 | 0.53 | 0.87 |
| Muricholic acid (omega) | MCAo | 2.11 | 1.77 | 2.17 | 1.46 | 2.51 | 3.19 | 0.36 | 0.78 |
| Taurocholate, taurocholic acid | TCA | 2.07 | 1.13 | 1.73 | 2.97 | 2.05 | 4.50 | 3.28 | 2.67 |
| Taurochenodeoxycholate | TCDCA | 1.17 | 1.15 | 1.22 | 1.35 | 2.61 | 2.54 | 2.33 | 2.72 |
| taurodeoxycholate, -cholic acid | TDCA | 2.25 | 0.62 | 1.66 | 1.62 | 2.13 | 1.68 | 1.38 | 1.48 |
| Taurolithocholic aicd | TLCA | 0.60 | 1.68 | 1.11 | 0.83 | 1.05 | 0.66 | 0.38 | 0.47 |
| Tauromuricholic acid (a + b) | TMCA (a + b) | 1.86 | 1.79 | 1.60 | 2.44 | 2.59 | 3.01 | 2.64 | 2.64 |
| Tauroursodeoxycholic acid | TUDCA | 1.79 | 1.04 | 2.83 | | | 1.98 | | 0.63 |
| ursodeoxycholate, ursodeoxycholic acid, ursodiol | UDCA | | | 1.65 | 0.16 | 0.20 | 1.60 | 0.17 | 0.39 |


 and
and 


