
Evaluation of Antibiotic Tolerance in Pseudomonas aeruginosa for Aminoglycosides and Its Predicted Gene Regulations through In-Silico Transcriptomic Analysis


Abstract
:1. Introduction
2. Materials and Methods
2.1. Broth Dilution Method
2.2. In Vitro Exposure of Antibiotics to P. aeruginosa
2.3. In Silico Transcriptomic Analysis
2.3.1. Retrieval of Microarray Datasets
2.3.2. Differential Gene Expression Analysis
2.3.3. Functional Enrichment Analysis
3. Results
3.1. Broth Dilution Method
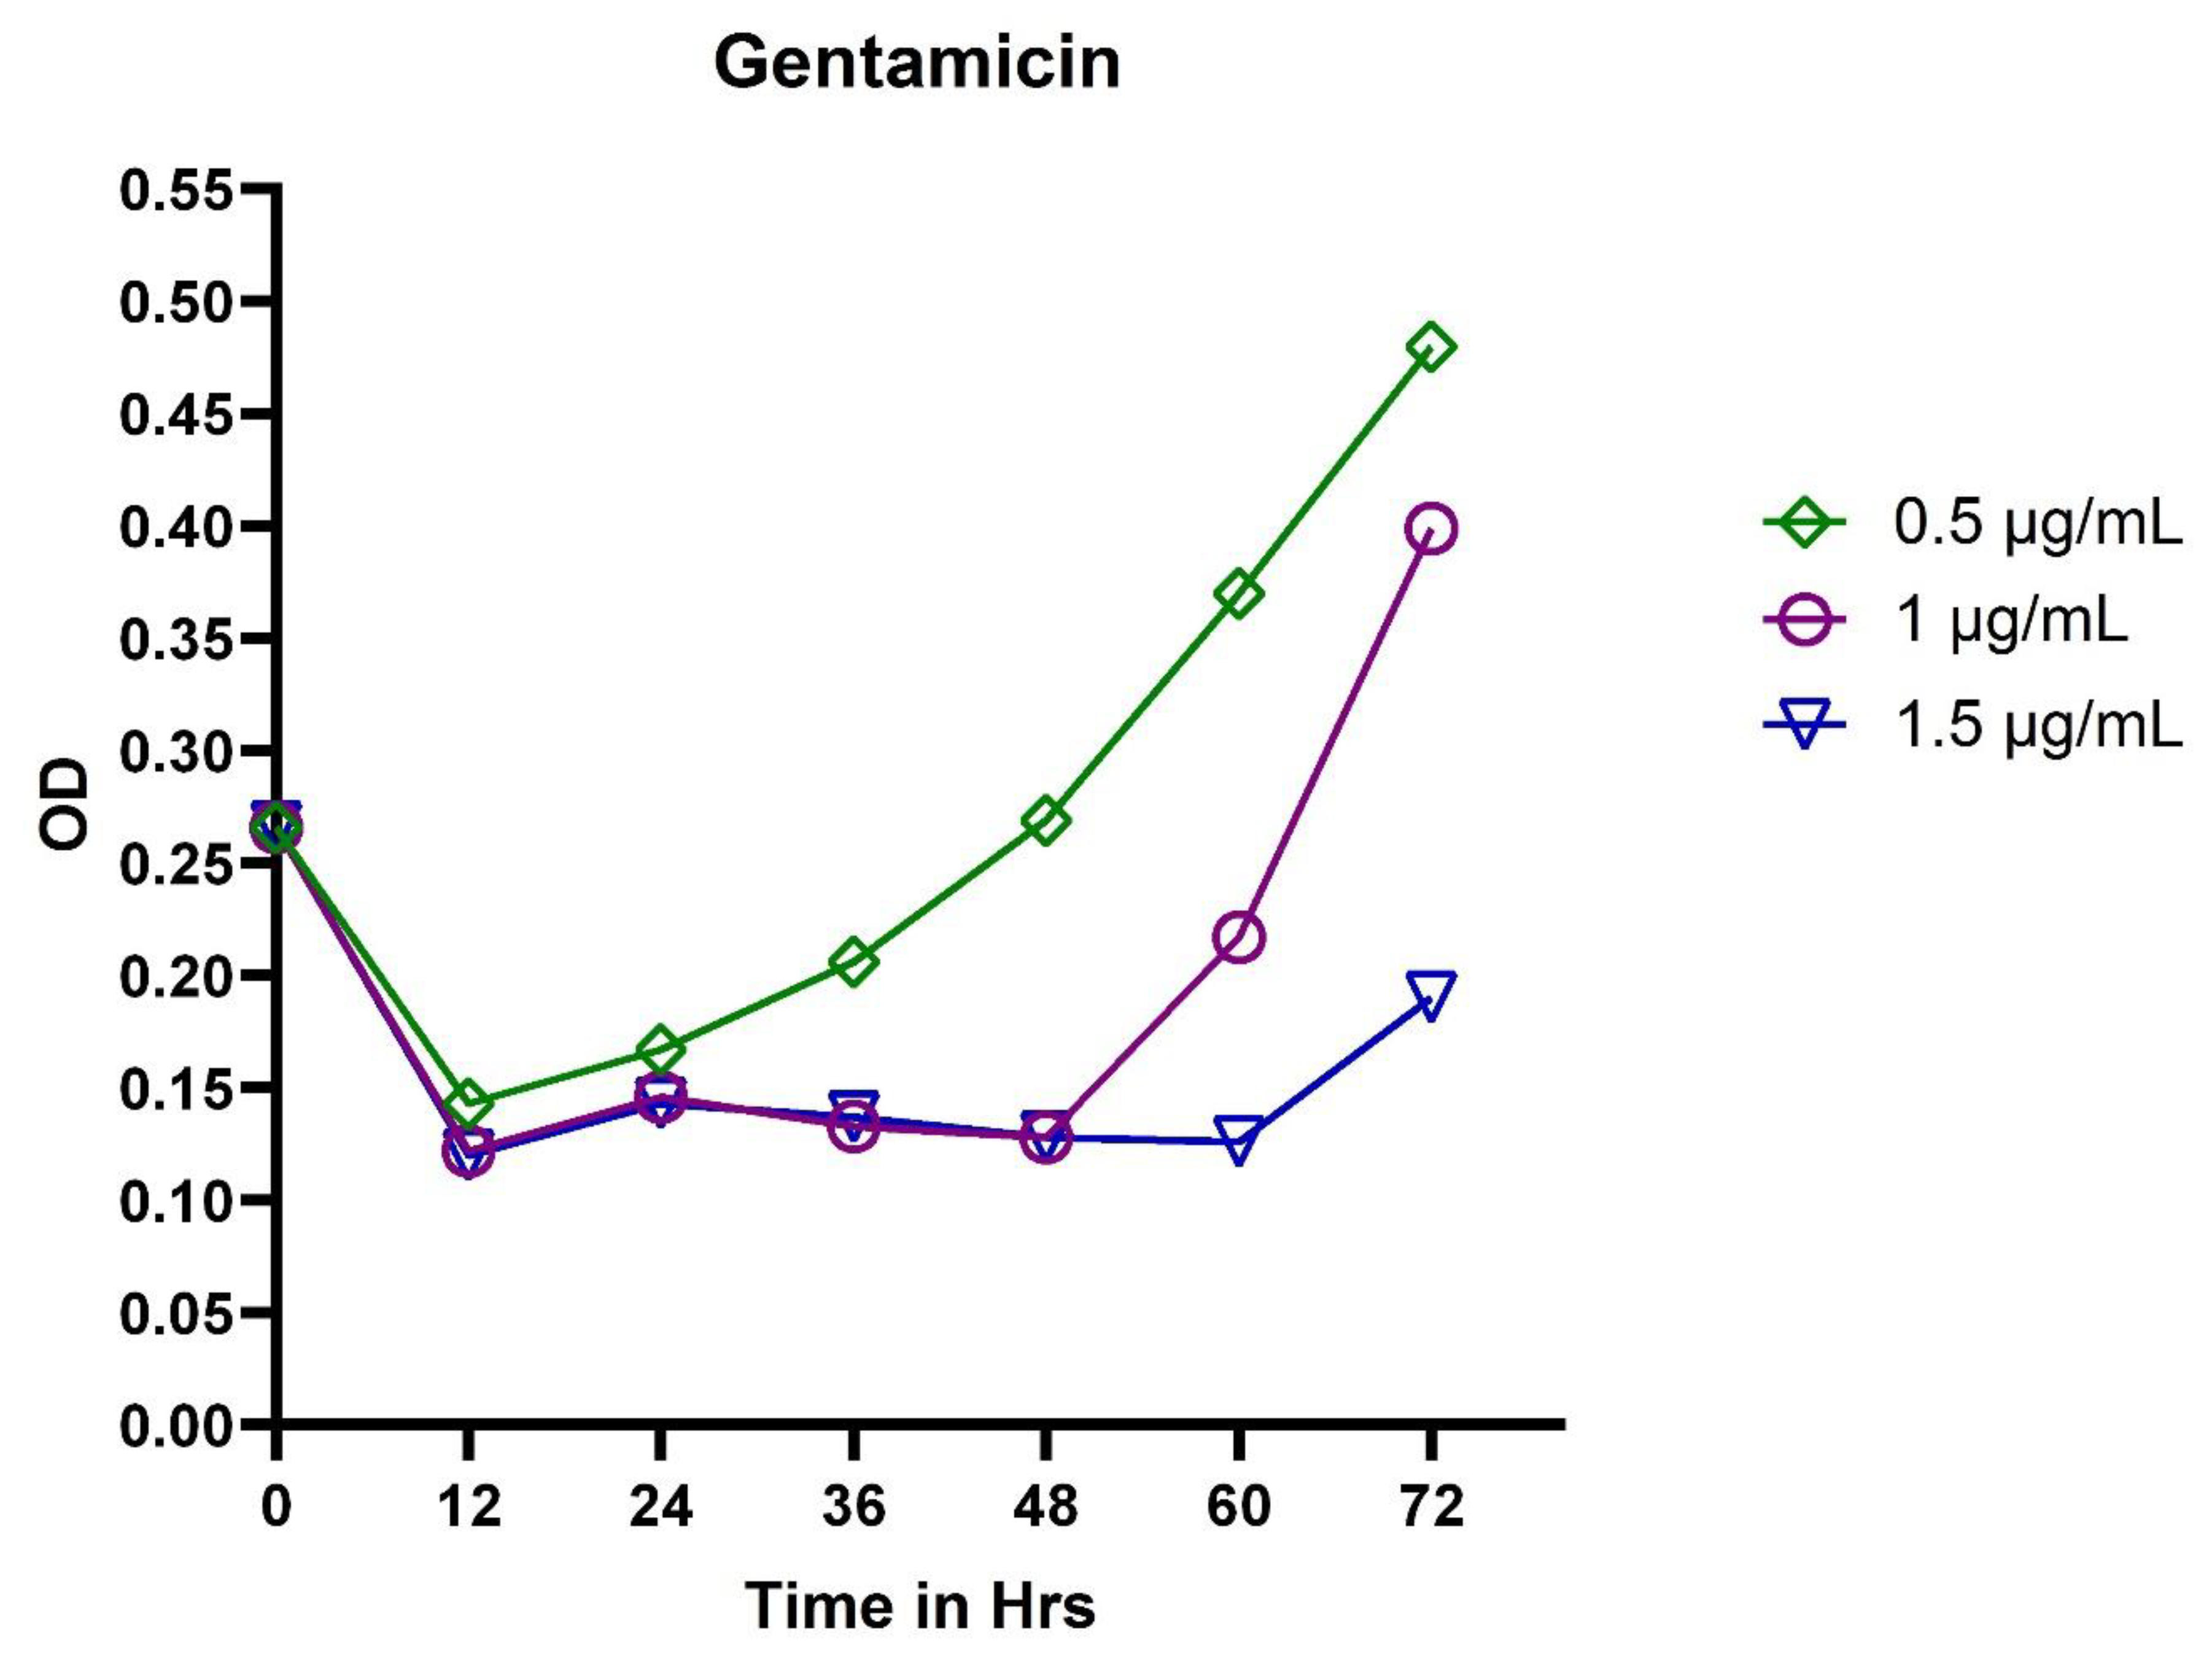
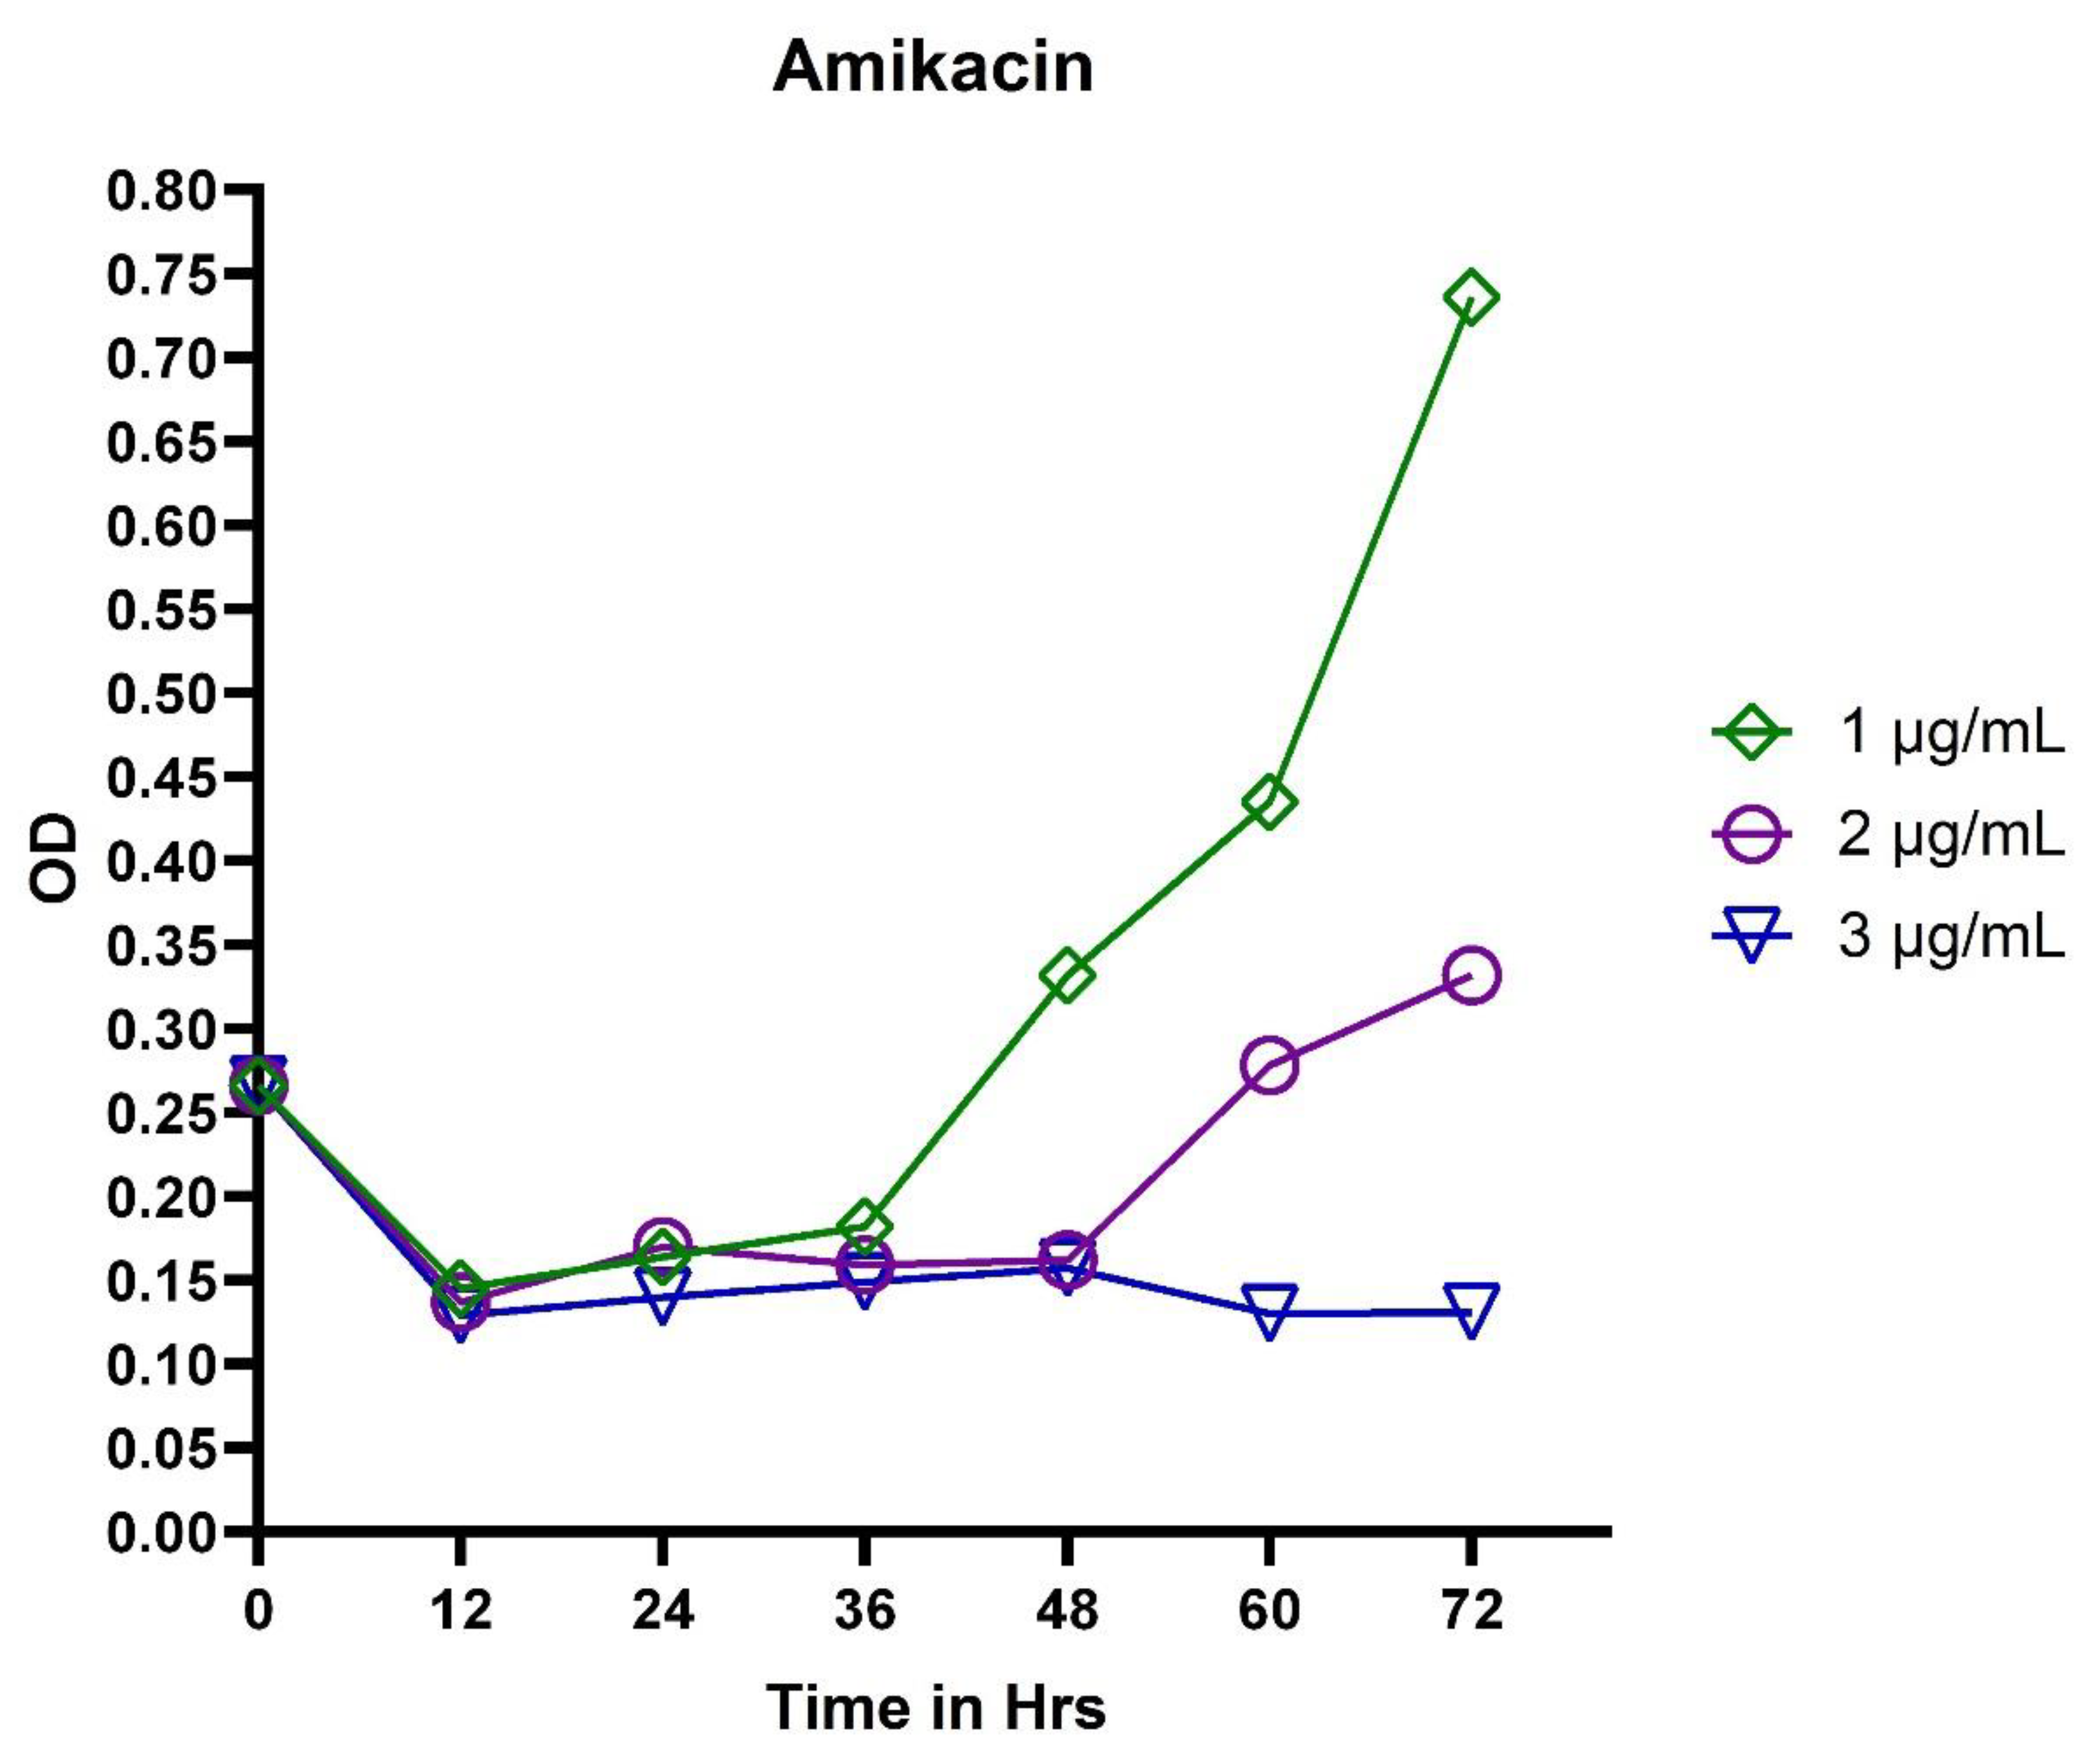
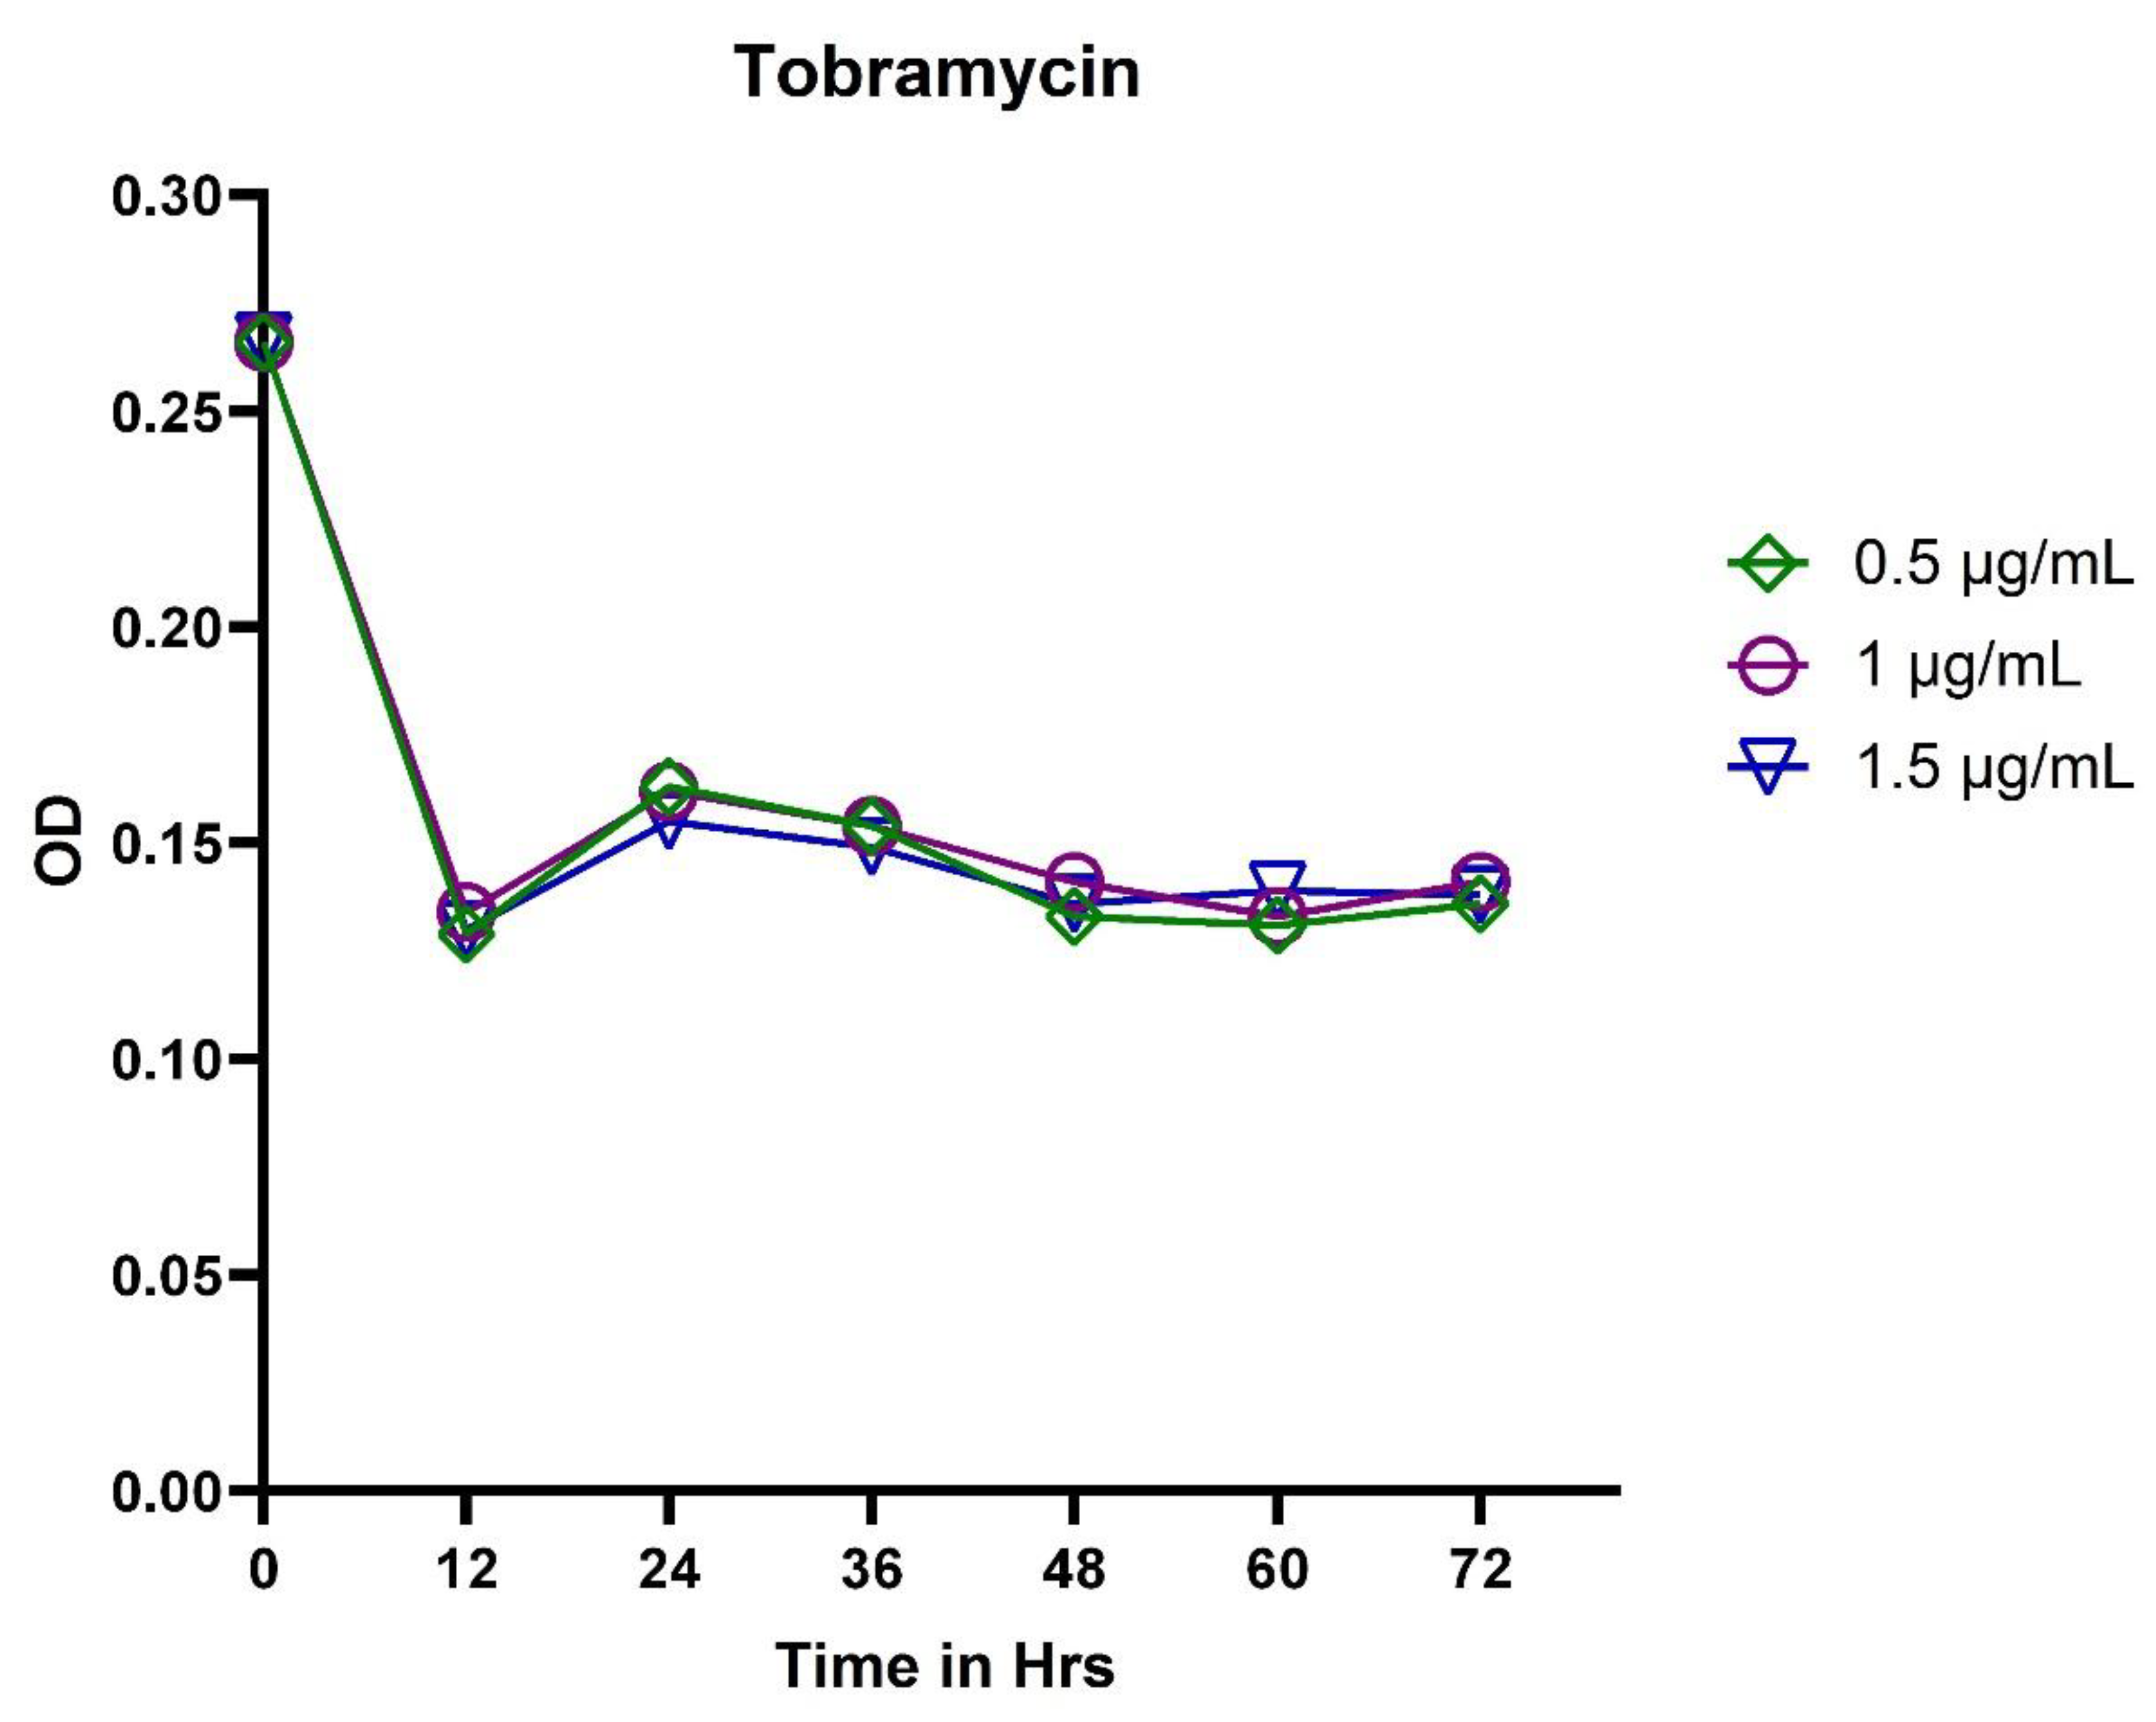
3.2. In Vitro Exposure of Antibiotics to P. aeruginosa
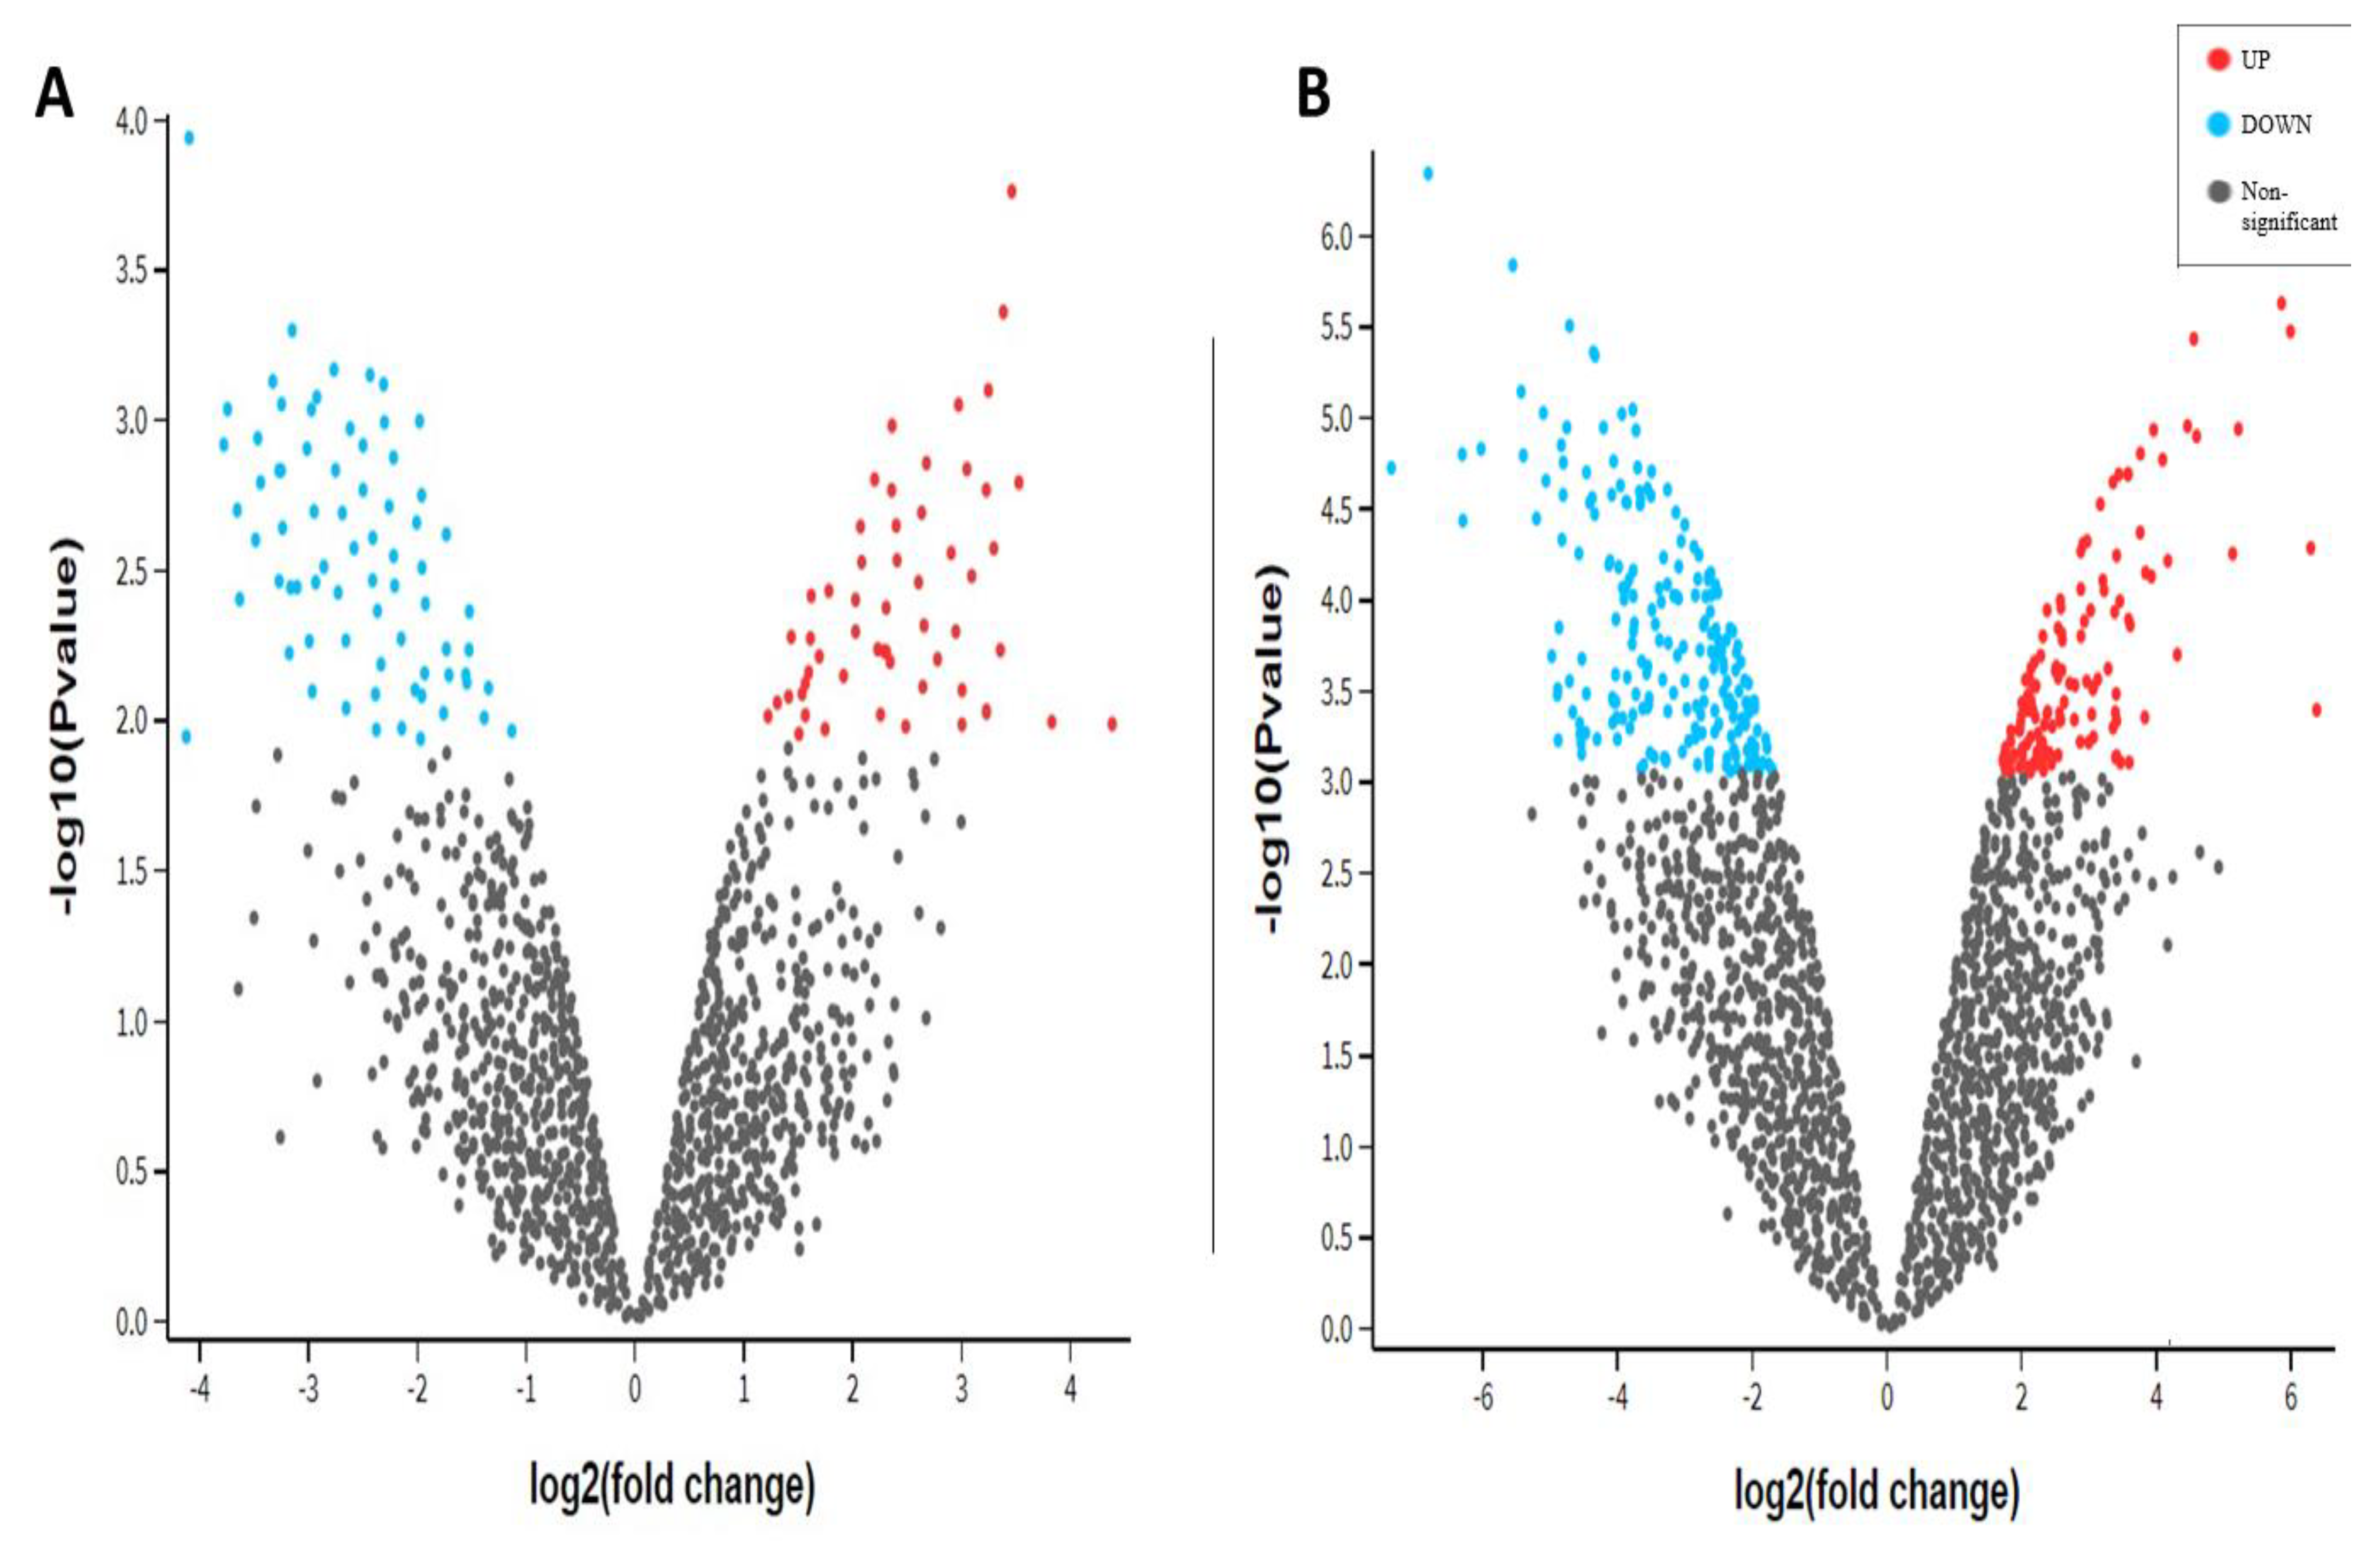
3.3. Differential Gene Expression Analysis
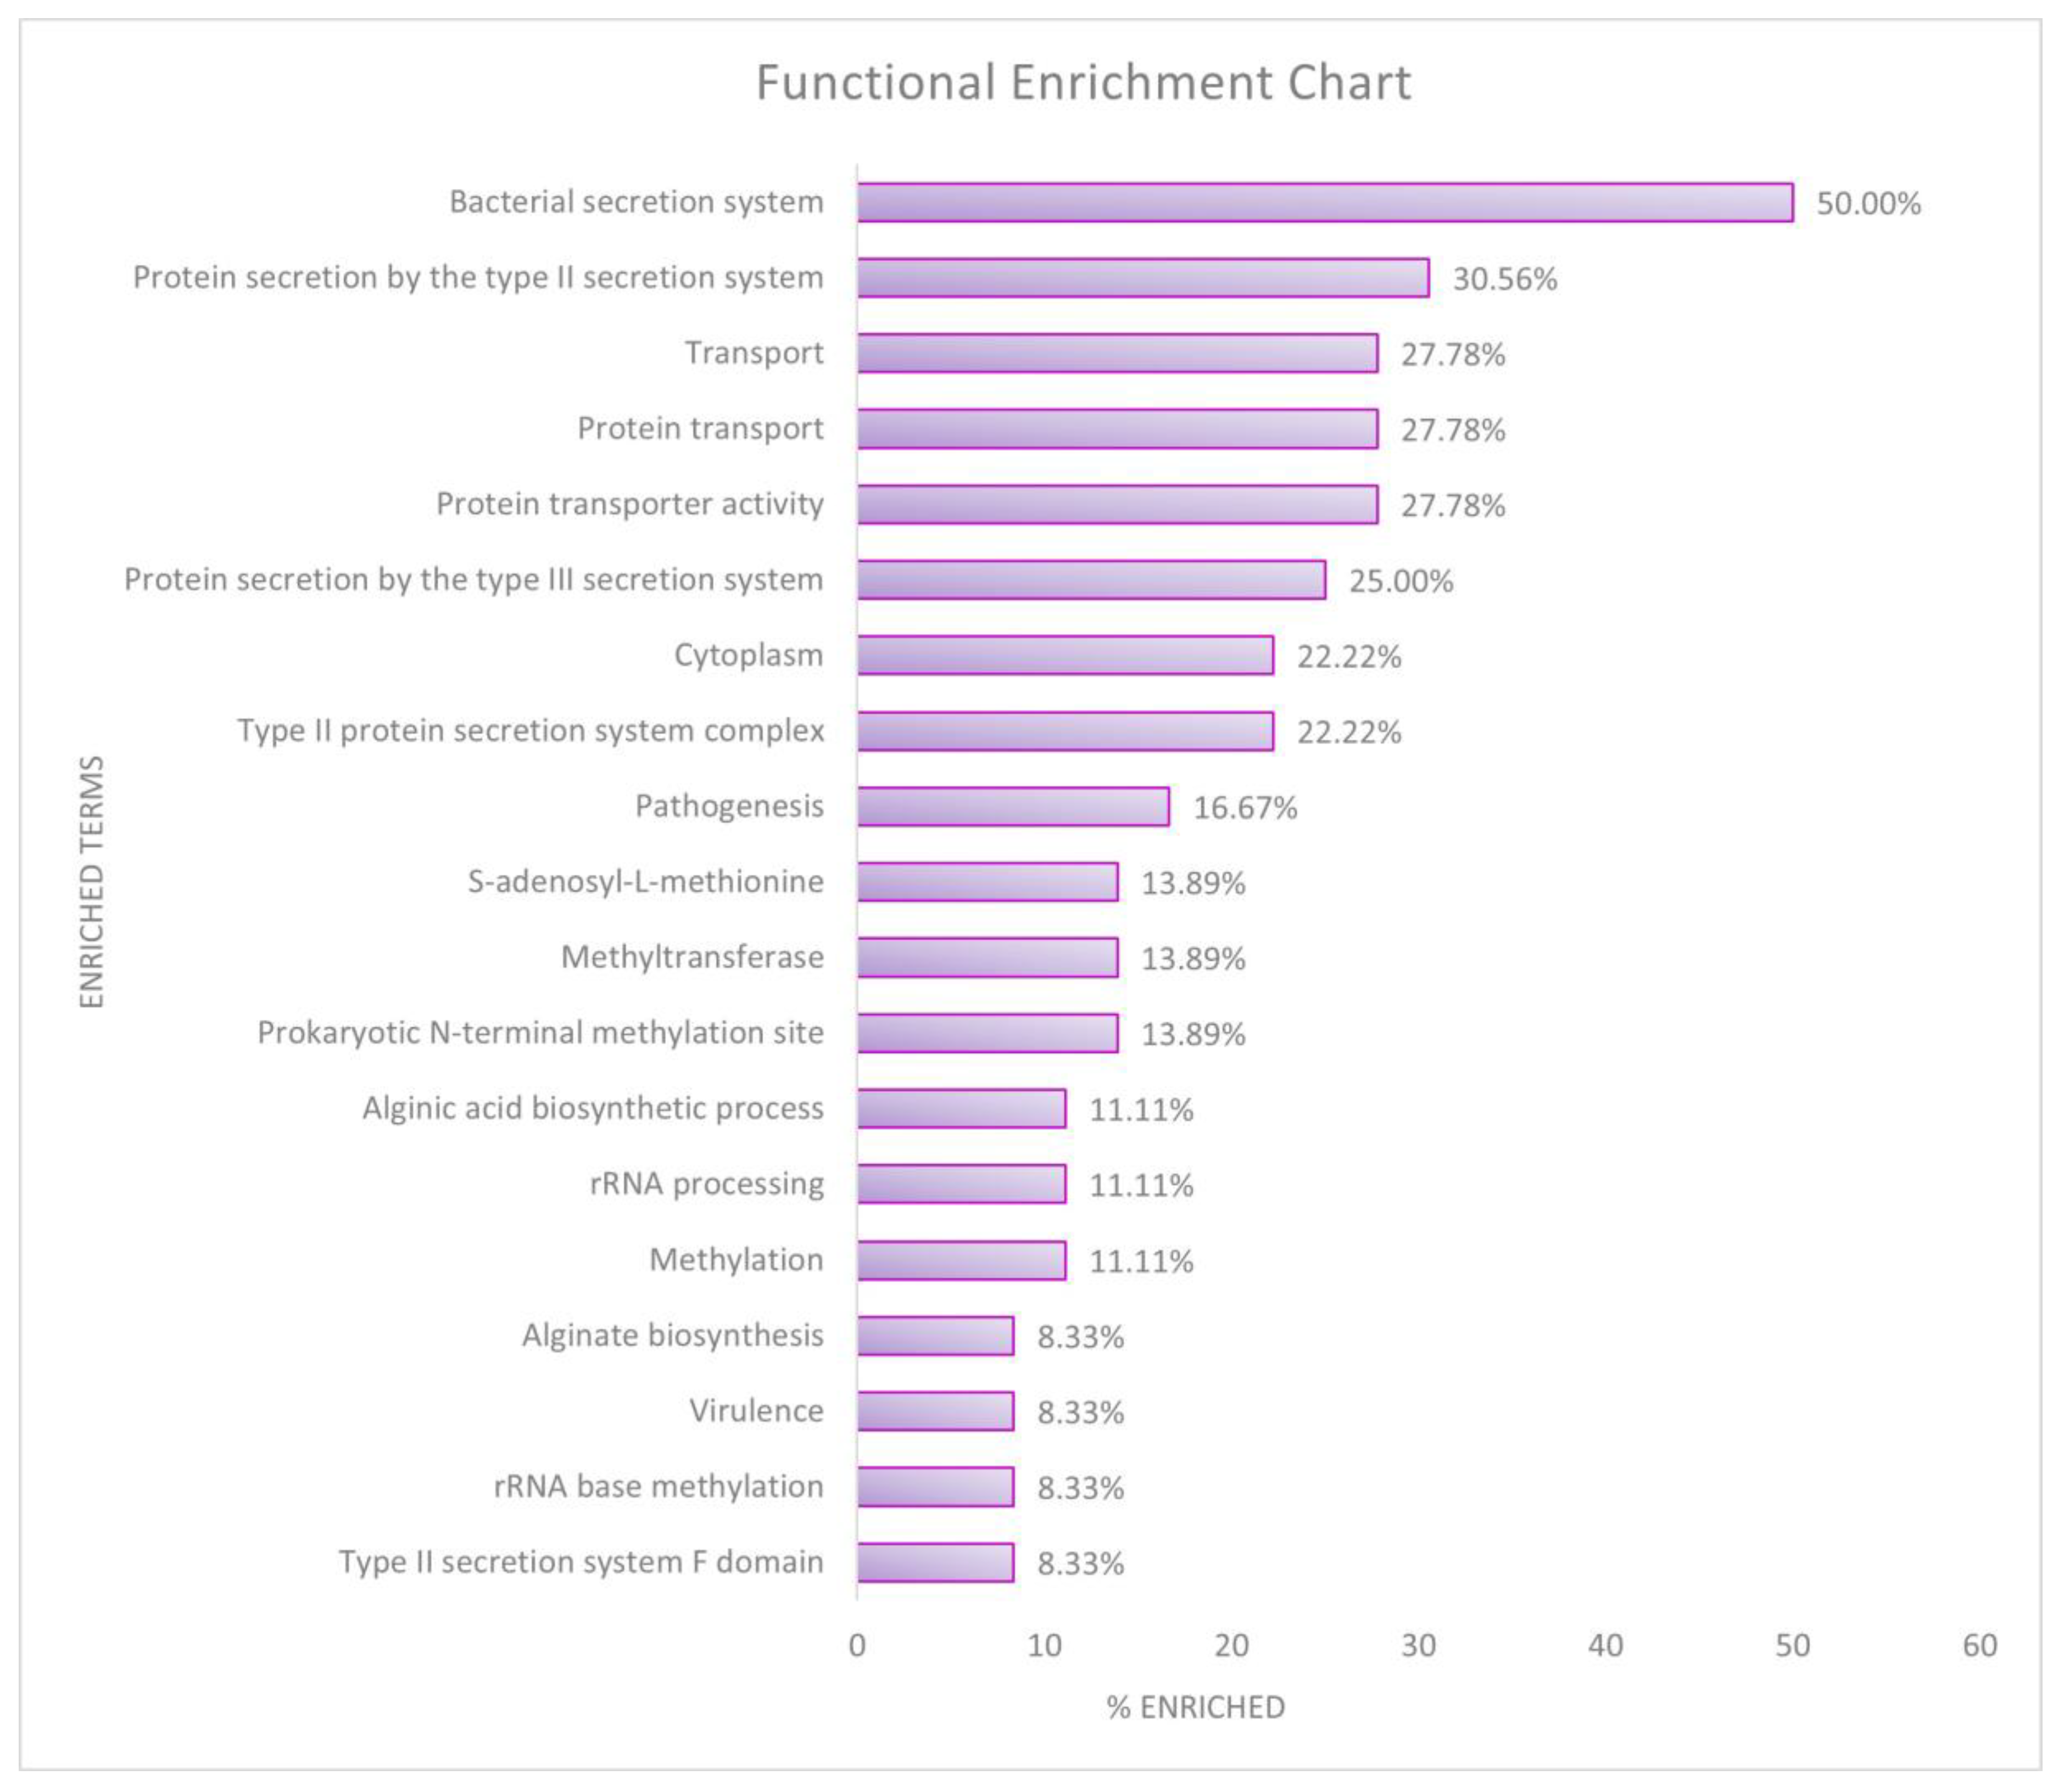
3.4. Functional Enrichment Analysis
4. Discussion
Author Contributions
Funding
Institutional Review Board Statement
Informed Consent Statement
Data Availability Statement
Acknowledgments
Conflicts of Interest
References
- Carmeli, Y.; Troillet, N.; Eliopoulos, G.M.; Samore, M.H. Emergence of antibiotic-resistant Pseudomonas aeruginosa: Comparison of risks associated with different antipseudomonal agents. Antimicrob. Agents Chemother. 1999, 43, 1379–1382. [Google Scholar] [CrossRef] [Green Version]
- Zhanel, G.G.; Clark, N.; Lynch, J.P. Emergence of antimicrobial resistance among Pseudomonas aeruginosa: Implications for therapy. Semin. Respir. Crit. Care Med. 2017, 38, 326–345. [Google Scholar] [CrossRef]
- Bassetti, M.; Vena, A.; Croxatto, A.; Righi, E.; Guery, B. How to manage Pseudomonas aeruginosa infections. Drugs Context 2018, 7, 212527. [Google Scholar] [CrossRef]
- Prayle, A.; Smyth, A. Aminoglycoside use in cystic fibrosis: Therapeutic strategies and toxicity. Curr. Opin. Pulm. Med. 2010, 16, 604–610. [Google Scholar] [CrossRef]
- Falagas, M.E.; Matthaiou, D.; Bliziotis, I.A. The role of aminoglycosides in combination with a β-lactam for the treatment of bacterial endocarditis: A meta-analysis of comparative trials. J. Antimicrob. Chemother. 2006, 57, 639–647. [Google Scholar] [CrossRef]
- Bodmann, K. Current guidelines for the treatment of severe pneumonia and sepsis. Chemotherapy 2005, 51, 227–233. [Google Scholar] [CrossRef]
- Dornbusch, K.; Olofsson, C.; Holm, S. Postantibiotic effect and postantibiotic sub-mic effect of dirithromycin and erythromycin against respiratory tract pathogenic bacteria. APMIS 1999, 107, 505–513. [Google Scholar] [CrossRef] [PubMed]
- Patel, J.A.; Javiya, V.A.; Ghatak, S.B.; Patel, K.R. Antibiotic susceptibility patterns of Pseudomonas aeruginosa at a tertiary care hospital in Gujarat, India. Indian J. Pharmacol. 2008, 40, 230–234. [Google Scholar] [CrossRef] [PubMed] [Green Version]
- Karlowsky, J.A.; Saunders, M.H.; Harding, G.A.; Hoban, D.J.; Zhanel, G.G. In Vitro characterization of aminoglycoside adaptive resistance in Pseudomonas aeruginosa. Antimicrob. Agents Chemother. 1996, 40, 1387–1393. [Google Scholar] [CrossRef] [PubMed] [Green Version]
- Gilleland, L.B.; Gilleland, H.E.; Gibson, J.A.; Champlin, F.R. Adaptive resistance to aminoglycoside antibiotics in Pseudomonas aeruginosa. J. Med. Microbiol. 1989, 29, 41–50. [Google Scholar] [CrossRef] [Green Version]
- Hocquet, D.; Vogne, C.; El Garch, F.; Vejux, A.; Gotoh, N.; Lee, A.; Lomovskaya, O.; Plésiat, P. MexXY-OprM efflux pump is necessary for adaptive resistance of Pseudomonas aeruginosa to aminoglycosides. Antimicrob. Agents Chemother. 2003, 47, 1371–1375. [Google Scholar] [CrossRef] [Green Version]
- Moradali, M.F.; Ghods, S.; Rehm, B.H.A. Pseudomonas aeruginosa lifestyle: A paradigm for adaptation, survival, and persistence. Front. Cell. Infect. Microbiol. 2017, 7, 39. [Google Scholar] [CrossRef] [Green Version]
- Esani, S.; Chen, T.; Leung, K.P.; Van Laar, T.A. Transcriptome sequence of antibiotic-treated Pseudomonas aeruginosa. Microbiol. Resour. Announc. 2019, 8, e01367-18. [Google Scholar] [CrossRef] [PubMed] [Green Version]
- Lonergan, Z.; Nairn, B.L.; Wang, J.; Hsu, Y.-P.; Hesse, L.; Beavers, W.N.; Chazin, W.J.; Trinidad, J.C.; VanNieuwenhze, M.S.; Giedroc, D.P.; et al. An Acinetobacter baumannii, zinc-regulated peptidase maintains cell wall integrity during immune-mediated nutrient sequestration. Cell Rep. 2019, 26, 2009–2018.e6. [Google Scholar] [CrossRef] [Green Version]
- Berti, A.D.; Wergin, J.E.; Girdaukas, G.G.; Hetzel, S.J.; Sakoulas, G.; Rose, W.E. Altering the proclivity towards daptomycin resistance in methicillin-resistant staphylococcus aureus using combinations with other antibiotics. Antimicrob. Agents Chemother. 2012, 56, 5046–5053. [Google Scholar] [CrossRef] [Green Version]
- Mellmann, A.; Cloud, J.; Maier, T.; Keckevoet, U.; Ramminger, I.; Iwen, P.; Dunn, J.; Hall, G.; Wilson, D.; LaSala, P.; et al. Evaluation of matrix-assisted laser desorption ionization-time-of-flight mass spectrometry in comparison to 16S rRNA gene sequencing for species identification of Nonfermenting bacteria. J. Clin. Microbiol. 2008, 46, 1946–1954. [Google Scholar] [CrossRef] [PubMed] [Green Version]
- Anderson, G.G.; Moreau-Marquis, S.; Stanton, B.A.; O’Toole, G.A. In Vitro analysis of tobramycin-treated Pseudomonas aeruginosa biofilms on cystic fibrosis-derived airway epithelial cells. Infect. Immun. 2008, 76, 1423–1433. [Google Scholar] [CrossRef] [Green Version]
- Xia, J.; Gill, E.E.; Hancock, R. NetworkAnalyst for statistical, visual and network-based meta-analysis of gene expression data. Nat. Protoc. 2015, 10, 823–844. [Google Scholar] [CrossRef] [PubMed]
- Huang, D.W.; Sherman, B.T.; Lempicki, R.A. Bioinformatics enrichment tools: Paths toward the comprehensive functional analysis of large gene lists. Nucleic Acids Res. 2009, 37, e16. [Google Scholar] [CrossRef] [PubMed] [Green Version]
- Freudenberg, J.; Joshi, V.K.; Hu, Z.; Medvedovic, M. Clean: Clustering enrichment analysis. BMC Bioinform. 2009, 10, 234. [Google Scholar] [CrossRef] [PubMed] [Green Version]
- Winsor, G.L.; Griffiths, E.J.; Lo, R.; Dhillon, B.K.; Shay, J.A.; Brinkman, F.S.L. Enhanced annotations and features for comparing thousands of Pseudomonas genomes in the Pseudomonas genome database. Nucleic Acids Res. 2016, 44, D646–D653. [Google Scholar] [CrossRef] [PubMed] [Green Version]
- Romero, P.; Karp, P. PseudoCyc, a pathway-genome database for Pseudomonas aeruginosa. J. Mol. Microbiol. Biotechnol. 2003, 5, 230–239. [Google Scholar] [CrossRef] [PubMed]
- Snel, B. String: A web-server to retrieve and display the repeatedly occurring neighbourhood of a gene. Nucleic Acids Res. 2000, 28, 3442–3444. [Google Scholar] [CrossRef] [PubMed] [Green Version]
- Szklarczyk, D.; Gable, A.L.; Lyon, D.; Junge, A.; Wyder, S.; Huerta-Cepas, J.; Simonovic, M.; Doncheva, N.T.; Morris, J.H.; Bork, P.; et al. String v11: Protein–Protein association networks with increased coverage, supporting functional discovery in genome-wide experimental datasets. Nucleic Acids Res. 2019, 47, D607–D613. [Google Scholar] [CrossRef] [PubMed] [Green Version]
- La Rosa, R.; Rossi, E.; Feist, A.M.; Johansen, H.K.; Molin, S. Compensatory evolution of Pseudomonas aeruginosa’s slow growth phenotype suggests mechanisms of adaptation in cystic fibrosis. Nat. Commun. 2021, 12, 3186. [Google Scholar] [CrossRef] [PubMed]
- Ziha-Zarifi, I.; Llanes, C.; Köhler, T.; Pechere, J.-C.; Plesiat, P. In Vivo emergence of multidrug-resistant mutants of Pseudomonas aeruginosa overexpressing the active efflux system MexA-MexB-OprM. Antimicrob. Agents Chemother. 1999, 43, 287–291. [Google Scholar] [CrossRef] [Green Version]
- Doi, Y.; Arakawa, Y. 16S ribosomal RNA methylation: Emerging resistance mechanism against aminoglycosides. Clin. Infect. Dis. 2007, 45, 88–94. [Google Scholar] [CrossRef]
- Mikheil, D.M.; Shippy, D.; Eakley, N.M.; Okwumabua, O.E.; Fadl, A.A. Deletion of gene encoding methyltransferase (gidB) confers high-level antimicrobial resistance in Salmonella. J. Antibiot. 2012, 65, 185–192. [Google Scholar] [CrossRef]
- Shippy, D.; Fadl, A.A. RNA modification enzymes encoded by the gid operon: Implications in biology and virulence of bacteria. Microb. Pathog. 2015, 89, 100–107. [Google Scholar] [CrossRef]
- Yu, S.; Wei, Q.; Zhao, T.; Guo, Y.; Ma, L.Z. A Survival Strategy for Pseudomonas aeruginosa that uses exopolysaccharides to sequester and store iron to stimulate psl-dependent biofilm formation. Appl. Environ. Microbiol. 2016, 82, 6403–6413. [Google Scholar] [CrossRef] [PubMed] [Green Version]
- Menendez, A.; Finlay, B.B. Defensins in the immunology of bacterial infections. Curr. Opin. Immunol. 2007, 19, 385–391. [Google Scholar] [CrossRef]
- Li, Y.-H.; Tian, X. Quorum sensing and bacterial social interactions in biofilms. Sensors 2012, 12, 2519–2538. [Google Scholar] [CrossRef] [PubMed]
- Ciofu, O.; Tolker-Nielsen, T. Tolerance and resistance of Pseudomonas aeruginosa biofilms to antimicrobial agents—How P. aeruginosa can escape antibiotics. Front. Microbiol. 2019, 10, 913. [Google Scholar] [CrossRef] [PubMed] [Green Version]
- Schiller, N.L.; Monday, S.R.; Boyd, C.M.; Keen, N.T.; Ohman, D.E. Characterization of the Pseudomonas aeruginosa alginate lyase gene (algL): Cloning, sequencing, and expression in Escherichia coli. J. Bacteriol. 1993, 175, 4780–4789. [Google Scholar] [CrossRef] [Green Version]
- Deretic, V.; Konyecsni, W.M. Control of mucoidy in Pseudomonas aeruginosa: Transcriptional regulation of algR and identification of the second regulatory gene, algQ. J. Bacteriol. 1989, 171, 3680–3688. [Google Scholar] [CrossRef] [PubMed] [Green Version]
- Jackson, K.D.; Starkey, M.; Kremer, S.; Parsek, M.R.; Wozniak, D.J. Identification of psl, a locus encoding a potential exopolysaccharide that is essential for Pseudomonas aeruginosa PAO1 biofilm formation. J. Bacteriol. 2004, 186, 4466–4475. [Google Scholar] [CrossRef] [PubMed] [Green Version]
- Qiu, D.; Eisinger, V.M.; Rowen, D.W.; Yu, H.D. Regulated proteolysis controls mucoid conversion in Pseudomonas aeruginosa. Proc. Natl. Acad. Sci. USA 2007, 104, 8107–8112. [Google Scholar] [CrossRef] [Green Version]
- Kim, Y.; Wood, T.K. Toxins Hha and CspD and small RNA regulator Hfq are involved in persister cell formation through MqsR in Escherichia coli. Biochem. Biophys. Res. Commun. 2010, 391, 209–213. [Google Scholar] [CrossRef] [PubMed] [Green Version]
- Korotkov, K.; Sandkvist, M.; Hol, W.G.J. The type II secretion system: Biogenesis, molecular architecture and mechanism. Nat. Rev. Genet. 2012, 10, 336–351. [Google Scholar] [CrossRef] [Green Version]
- Ma, Q.; Zhai, Y.; Schneider, J.C.; Ramseier, T.M.; Saier, M.H. Protein secretion systems of Pseudomonas aeruginosa and P. fluorescens. Biochim. Biophys. Acta Biomembr. 2003, 1611, 223–233. [Google Scholar] [CrossRef] [Green Version]
- Notti, R.Q.; Stebbins, C.E. The structure and function of type III secretion systems. Microbiol. Spectr. 2016, 4. [Google Scholar] [CrossRef] [PubMed] [Green Version]
- Sandoval-Motta, S.; Aldana, M. Adaptive resistance to antibiotics in bacteria: A systems biology perspective. Wiley Interdiscip. Rev. Syst. Biol. Med. 2016, 8, 253–267. [Google Scholar] [CrossRef] [PubMed]


| Genes | Log Fc | Adj. p-Value |
|---|---|---|
| PA2677 | −2.21809 | 0.0013 |
| PA0687 | −1.44816 | 0.0287 |
| PA2672 | −1.23836 | 0.0271 |
| xcpR | −0.28436 | 0.0332 |
| xcpU | −0.50274 | 0.0200 |
| xcpV | −0.19849 | 0.0484 |
| xcpY | −0.22214 | 0.0436 |
| xcpZ | −0.21626 | 0.0496 |
| tadB | −0.16973 | 0.0407 |
| tadD | −0.25359 | 0.0387 |
| algR | −0.35921 | 0.0284 |
| algL | 0.640009 | 0.0280 |
| pslF | −1.03452 | 0.0478 |
| PA1839 | 2.200892 | 0.0015 |
| PA0419 | −0.92439 | 0.0339 |
| PA0017 | −0.33728 | 0.0257 |
| PA3680 | −0.34165 | 0.0065 |
| Genes | Log Fc | Adj. p-Value |
|---|---|---|
| mucA | 4.094536 | 0.0035 |
| mucB | 1.155318 | 0.0062 |
| lexA | 3.42962 | 0.0035 |
| gidB | −3.31909 | 0.0050 |
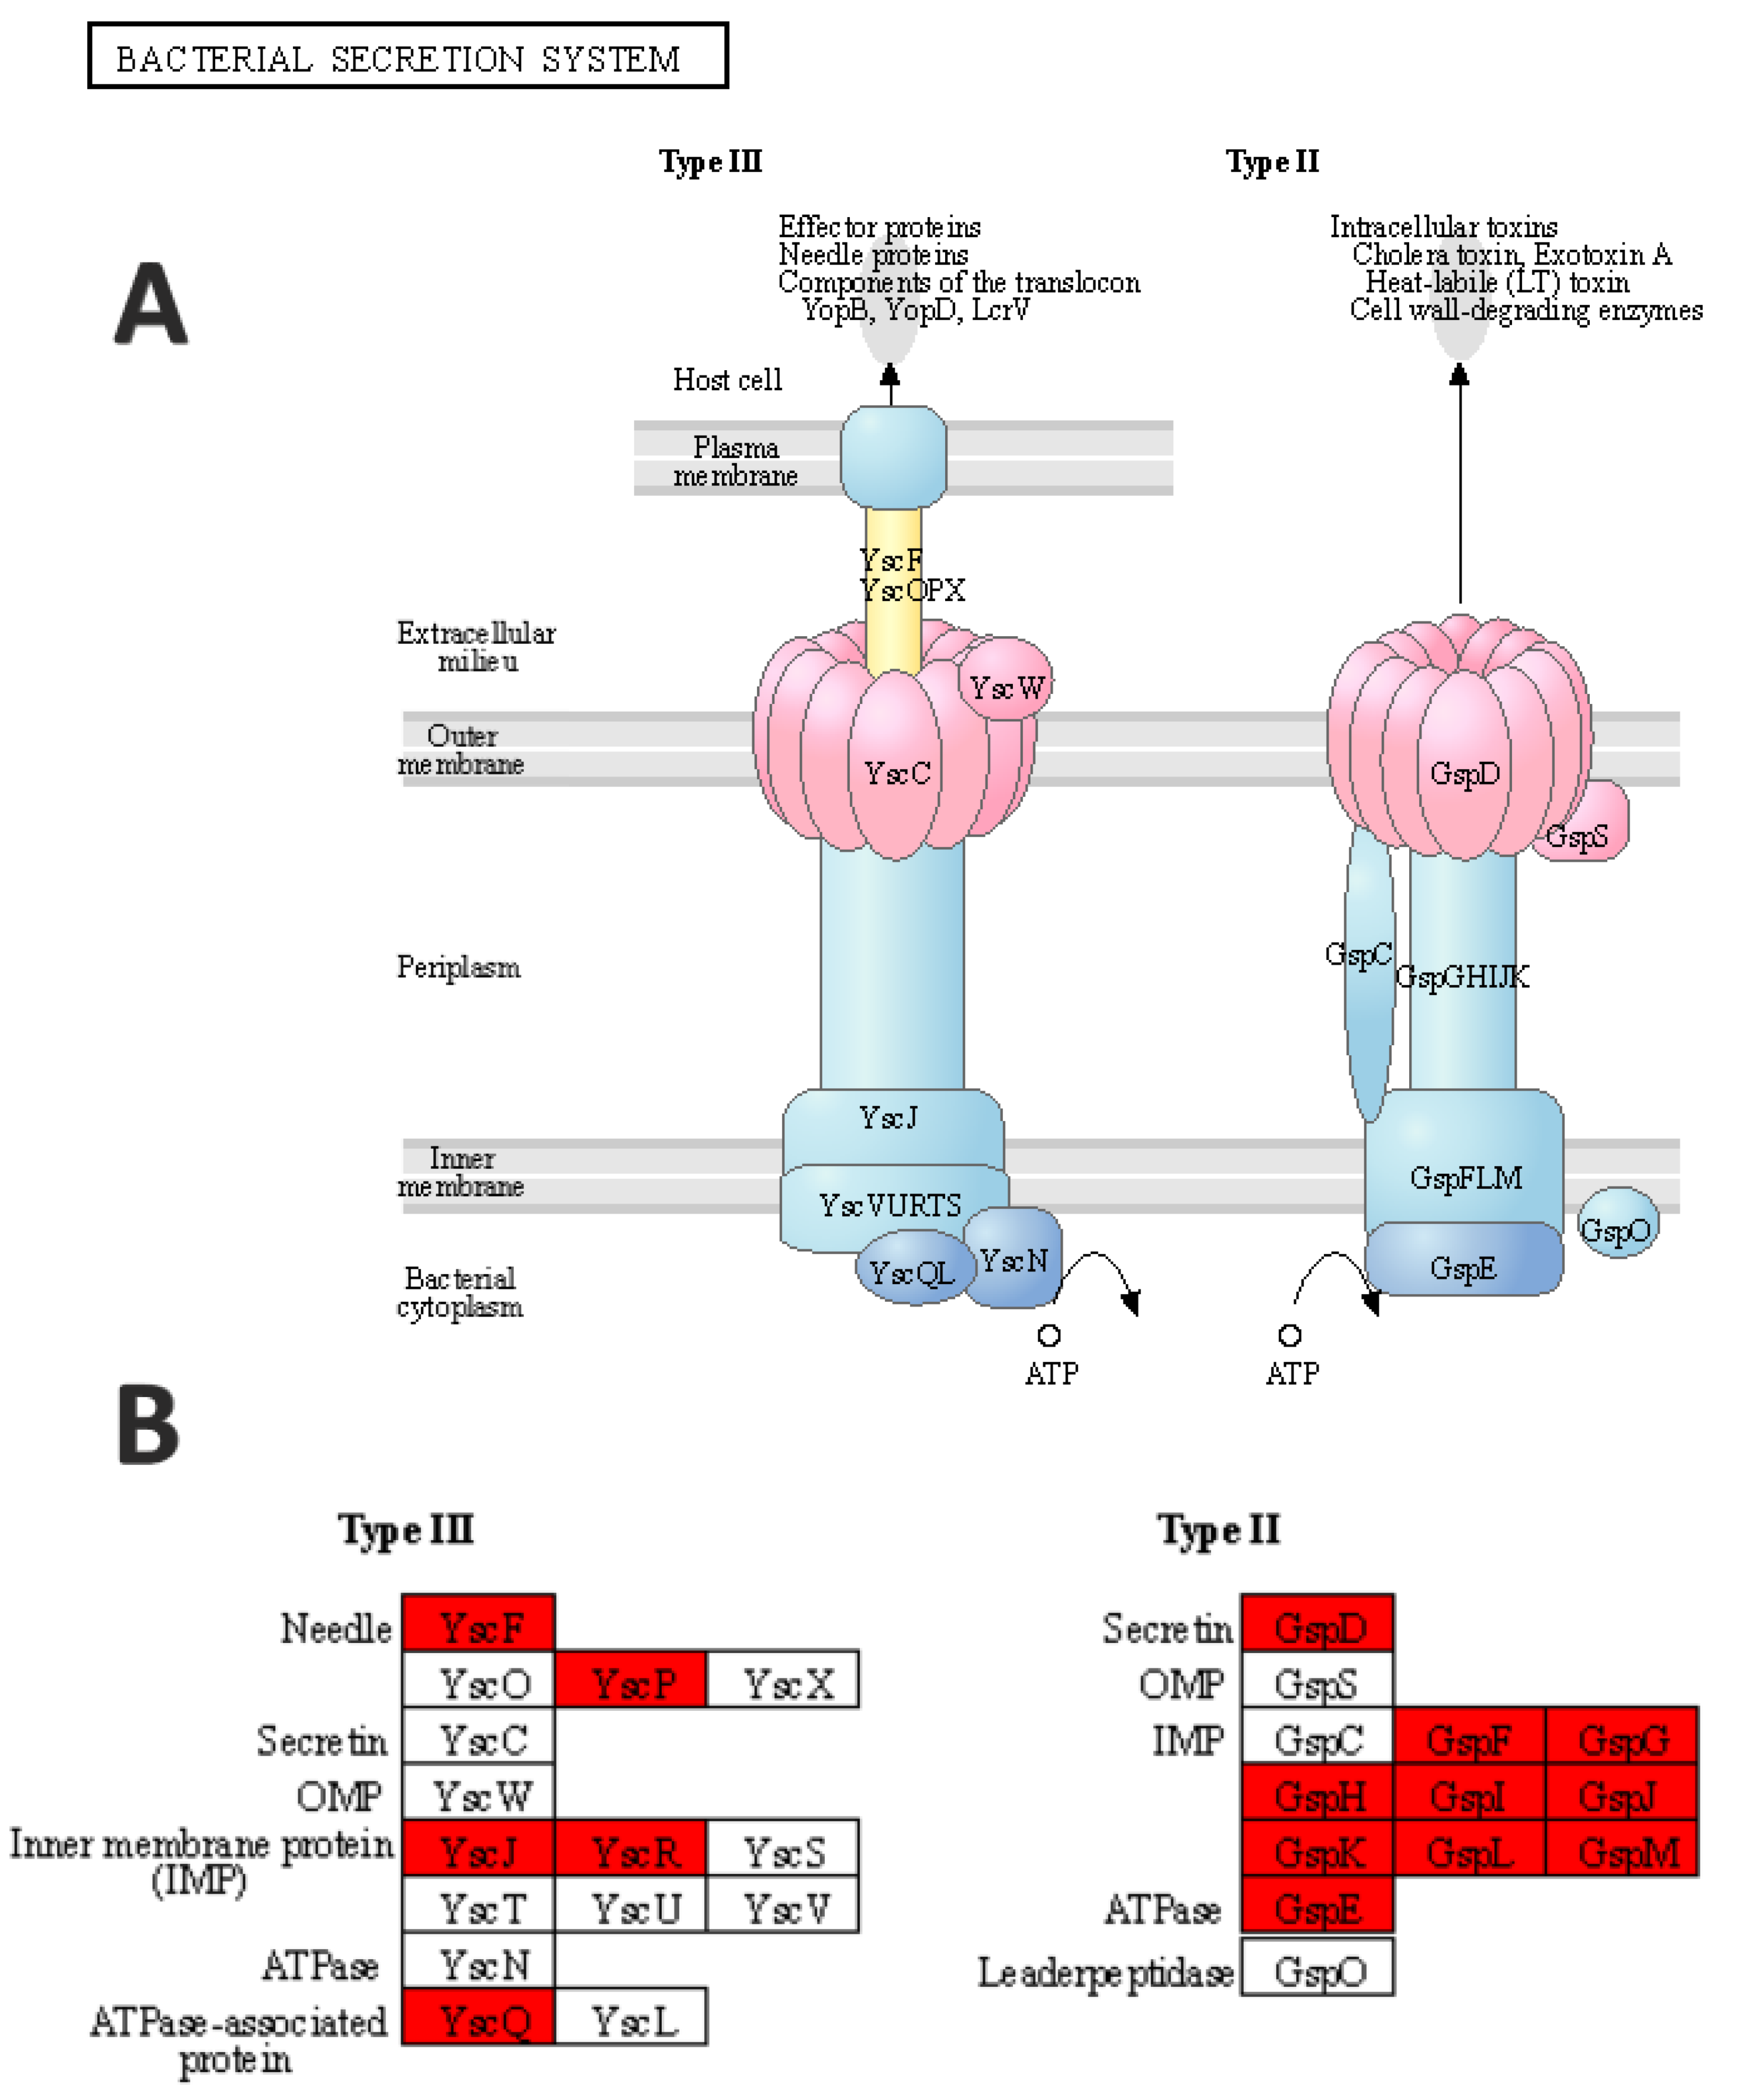
| pscQ | −2.35821 | 0.0105 |
| pscP | −3.64432 | 0.0155 |
| pscR | −3.11905 | 0.0346 |
| pscG | −1.75324 | 0.0061 |
| pscH | −1.52118 | 0.0381 |
| pscE | −3.84799 | 0.0501 |
| pscF | −1.3676 | 0.0122 |
| pscI | −2.27261 | 0.0176 |
| pscJ | −1.43567 | 0.0491 |
| pscK | −1.6767 | 0.0129 |
| xcpQ | −2.31778 | 0.0307 |
| xcpS | −1.40397 | 0.0273 |
| xcpT | −0.72049 | 0.0273 |
| xcpU | −1.33575 | 0.0248 |
| xcpV | −3.11543 | 0.0281 |
| xcpW | −0.69783 | 0.0323 |
| xcpX | −0.42221 | 0.0530 |
| xcpY | −0.5616 | 0.0380 |
| Databases | Clusters | % Enriched | Fold Enrichment | FDR |
|---|---|---|---|---|
| Cluster 1—Type II and Type III toxin secretion system | ||||
| KEGG Pathways | Bacterial secretion system | 50.00 | 16.68 | 2.93 × 10⁻²⁰ |
| GO Term—Biological Process | Protein secretion by type II secretion system | 30.56 | 43.27 | 8.77 × 10⁻¹⁴ |
| GO Term—Molecular Functions | Protein transporter activity | 27.78 | 52.90 | 2.65 × 10⁻¹³ |
| UniProtKB | Protein transport | 27.78 | 33.91 | 1.89 × 10⁻¹⁰ |
| GO Term—Cellular component | Type II protein secretion system complex | 22.22 | 42.90 | 1.33 × 10⁻⁹ |
| UniProtKB | Transport | 27.78 | 4.31 | 0.003997 |
| Cluster 1 Enrichment Score: 12.16 | ||||
| Cluster 2—Methylation metabolism | ||||
| GO Term—Cellular component | Type II protein secretion system complex | 22.22 | 42.90 | 1.33 × 10⁻⁹ |
| InterPro | Prokaryotic N-terminal methylation site | 13.89 | 38.23 | 4.58 × 10⁻⁴ |
| UniProtKB | Methylation | 11.11 | 35.91 | 0.003334 |
| Cluster 2 Enrichment Score: 6.32 | ||||
| Cluster 3—RNA methyltransferase and rRNA processing | ||||
| UniProtKB | Methyltransferase | 13.89 | 11.56 | 0.007267 |
| UniProtKB | rRNA processing | 11.11 | 19.69 | 0.007267 |
| UniProtKB | S-adenosyl-L-methionine | 13.89 | 10.75 | 0.007267 |
| GO Term—Biological Process | rRNA base methylation | 8.33 | 36.88 | 0.010077 |
| UniProtKB | Cytoplasm | 22.22 | 3.16 | 0.047188 |
| Cluster 3 Enrichment Score: 2.06 | ||||
Publisher’s Note: MDPI stays neutral with regard to jurisdictional claims in published maps and institutional affiliations. |
© 2021 by the authors. Licensee MDPI, Basel, Switzerland. This article is an open access article distributed under the terms and conditions of the Creative Commons Attribution (CC BY) license (https://creativecommons.org/licenses/by/4.0/).
Share and Cite
Kumar B, A.; Thankappan, B.; Jayaraman, A.; Gupta, A. Evaluation of Antibiotic Tolerance in Pseudomonas aeruginosa for Aminoglycosides and Its Predicted Gene Regulations through In-Silico Transcriptomic Analysis. Microbiol. Res. 2021, 12, 630-645. https://0-doi-org.brum.beds.ac.uk/10.3390/microbiolres12030045
Kumar B A, Thankappan B, Jayaraman A, Gupta A. Evaluation of Antibiotic Tolerance in Pseudomonas aeruginosa for Aminoglycosides and Its Predicted Gene Regulations through In-Silico Transcriptomic Analysis. Microbiology Research. 2021; 12(3):630-645. https://0-doi-org.brum.beds.ac.uk/10.3390/microbiolres12030045
Chicago/Turabian StyleKumar B, Abishek, Bency Thankappan, Angayarkanni Jayaraman, and Akshita Gupta. 2021. "Evaluation of Antibiotic Tolerance in Pseudomonas aeruginosa for Aminoglycosides and Its Predicted Gene Regulations through In-Silico Transcriptomic Analysis" Microbiology Research 12, no. 3: 630-645. https://0-doi-org.brum.beds.ac.uk/10.3390/microbiolres12030045