Mental Rotation in American Children: Diminished Returns of Parental Education in Black Families


1
Department of Family Medicine, Charles R Drew University of Medicine and Science, Los Angeles, CA 90059, USA
2
Department of Urban Public Health, Charles R Drew University of Medicine and Science, Los Angeles, CA 90059, USA
Pediatr. Rep. 2020, 12(3), 130-141; https://0-doi-org.brum.beds.ac.uk/10.3390/pediatric12030028
Submission received: 16 October 2020
/
Revised: 17 November 2020
/
Accepted: 17 November 2020
/
Published: 20 November 2020
Abstract
:Background: While parental education and family socioeconomic status (SES) are associated with an increase in children’s cognitive functioning, and less is known about racial variation in these effects. Minorities’ Diminished Returns (MDRs) suggest that, under racism and social stratification, family SES and particularly parental education show weaker effects on children’s tangible outcomes for marginalized, racialized, and minoritized families, particularly Blacks, compared to Whites. Aim: We conducted this study to compare the effect of parental education on children’s mental rotation abilities, as an important aspect of cognitive function, by race. Methods: This cross-sectional study included 11,135 9–10-year-old American children. Data came from baseline of the Adolescent Brain Cognitive Development (ABCD) study. The independent variable was parental education. The dependent variable, mental rotation, was measured by the Little Man Task. Ethnicity, gender, age, marital status, and household income were the covariates. Results: Parental education was positively associated with mental rotation. However, parental education showed a weaker association with mental rotation in Black than in White families. This was documented by a significant interaction between race and parental education on children’s efficiency score. Conclusion: Parental education shows a weaker correlation with mental rotation of Black rather than White children, which is probably because of racism, social stratification, and discrimination. This finding is in line with the MDRs phenomenon and suggests that marginalization and racism may interfere with the influences of parental assets and resources and Black American children’s development.
1. Introduction
Mental rotation [1], one specific aspect of cognitive performance [2], is the ability to rotate mental representations of two-dimensional and three-dimensional objects within the human mind [3]. Mental rotation is closely associated with abstract thinking, mathematical ability, and spatial memory and analysis [4,5]. Strong mental rotation ability is also associated with better visual perception of complex objects in the space. Mental rotation requires spatial processing, intelligence, abstraction, reasoning, and memory [6]. Mental rotation is commonly being measured by evaluation how well an individual’s brain can easily and efficiently move an objects in three dimensional space [7]. However, studies on social determinants of mental rotation and population variation in mental rotation are rarely done.
The associations between race, socioeconomic status (SES), and cognitive function are among the most sensitive, polarized, and politicalized areas of research in the US [8]. Over the past several decades, there has been an ongoing political debate on whether it is appropriate to study race and cognitive performance, whether race influences cognitive function, and whether such effects are due to social or biological causes [8]. The argument by Murray and others on lower cognitive performance of Black individuals has generated a very strong backlash from the scientific community [9,10]. Questioning racial variation in cognitive performance as a biological and genetic finding, the research community has provided considerable evidence that lower performance of Blacks in cognitive scores reflect poor performance, low education quality, low SES, and other reasons rather than biological difference in this regard [9,10]. Recent research finding that cognitive score predicts the mortality of White but not Black people is another support for the argument that existing cognitive measures fail to capture true cognitive performance of Black children [11].
Lack of predictive power of cognitive scores for Black people may also be related to Minorities’ Diminished Returns (MDRs) [12,13]. The MDRs reflect weaker health effects of economic assets of family particularly parental education for any marginalized group such as Black [12,13], Hispanic [14,15,16,17], Asian American [18], Native American [19], lesbian, gay, bisexual, transgender (LGBT) [20], immigrant [21], or even marginalized White [22] people. The non-specific nature of these MDRs suggests that they are not due to biological differences or behaviors, but the way society marginalizes all marginalized groups, including but not limited to Blacks. In this view, if Black children show lower attention, higher impulsivity, or worse educational outcomes, these are not because they are cognitively inferior than Whites but because Black children are sent to worse schools, live in worse neighborhoods, and have experienced high level of stress across all SES levels. That blames the society, rather than Blacks who are themselves the very victim of slavery, racism, segregation, Jim Crow, and unequal treatment [23,24,25].
Most of the research on MDRs has focused on the effects of parental education [26], family income [27,28], and marital status [29] on outcomes other than cognitive function. While all these studies have shown that family SES generates fewer developmental, health, emotional, and behavioral outcomes for Black compared to White families [26,27,28,30,31], we are not aware of even a single study on cognitive outcomes other than attention [32] and impulsivity [33,34]. Past work shows that parental SES and particularly parental education shows weaker effects on impulsivity [27], depression [30], anxiety [35], aggression [26], grade point average (GPA) [26,36,37], and substance use [26] for Black rather than White children. As a result of these MDRs, high SES Black children remain at risk of impulsivity [27,34], attention deficit hyperactivity disorder (ADHD) [38], obesity [39], aggression [26], chronic disease [26], anxiety [35], depression [30], and suicide [40], a pattern which does not exist for high SES White children.
Aims
Built on MDRs, we compared racial group of children for the effects of parental education on mental rotation, an important aspect of cognitive function. We expected a positive association between parental education and children’s mental rotation; however, we also expected this association to be weaker (diminished) for non-White, particularly Black, rather than White children.
2. Methods
2.1. Design and Settings
This secondary analysis used a cross-sectional design and borrowed data from the Adolescent Brain Cognitive Development (ABCD) study [41,42,43,44,45]. ABCD baseline data collection was conducted from 2016 to 2018 in 21 sites across states in the United States. For more information on the ABCD study, consult here [41,46].
2.2. Participants and Sampling
The ABCD participants were 9–10-year-old children who were selected from multiple cities across the states, US. The ABCD recruitment primarily relied on the US school system. For a detailed description of the sampling and recruitment in the ABCD, consult here [47]. Eligibility for our analysis had valid data on all our study variables including race, age, and mental rotation. The analytical sample of this paper was 11,135.
2.3. Study Variables
The study variables included race, ethnicity, sex, age, household income, parental education, marital status, and mental rotation. Race was self-identified: Blacks, Asians, Mixed/Other, and Whites (reference category). Parents reported the age of their children in months. Child sex was a 1 for males and a 0 for females. Parental marital status was reported by the parents and was 1 for married and 0 for other. Household income, reported by the parent, was a three-level categorical measure: less than 50K, 50–100K, and 100+K.
Mental rotation was evaluated by the Little Man Task (LMT) [48,49,50]. The LMT measures visuospatial processing, flexibility, and attention. This measure is particularly used to measure cognitive aspect that is highly vulnerable to alcohol/drug use. Developed by Acker and Acker (1982) [51], the task involved measurement of visual-spatial processing with varying degrees of difficulty. The LMT is not a memory test. As a part of the task, a rudimentary male figure holding a briefcase in one hand is presented in the middle of the screen. The figure appears in one of the following four positions (1) right side up, (2) upside down, (3) facing the respondent, or (4) with his back to the respondent. The briefcase may be in his right or his left hand. Using the computer buttons, the respondent should indicate which hand holds the briefcase. Left hand, always associated with a button to the left of the participant, is labeled “left”. The result of this test is very sensitivity to visual spatial compromise (e.g., mental rotation). Performance on the LMT is also correlated with the Block Design subtest of the WAIS [51]. In the ABCD, there has been substantial performance variability, with the average percentage of correct trials being 67% (std. dev. = 0.18). The mean reaction time for correct trials was 2670 (+470) ms.
For the high performers, the average RT for correct trials was 2760 (+368) ms; the numbers for low performers are 2520 (+572) ms. This measure also reflects age-related development. LMT and other cognitive tasks in the ABCD are well explained here [45]. We used the efficiency variable, which is the percentage correct (of the total possible, 32)/average RT to correct responses [45]. This variable is a continuous measure, centered (mean 00.00), and has a higher score reflecting higher mental rotation ability [45].
2.4. Data Analysis
We used Data Exploration and Analysis Portal (DEAP) for data analysis. DEAP provides advanced statistical analysis functions to work with the 2.0 data release from the ABCD study. DEAP is available for the users of the ABCD study. DEAP uses R package for statistical calculations such as linear mixed effects models, while adjusting for the nested nature of the ABCD data. We reported mean (standard deviation (SD)) and frequency (%) of our variables overall and by race. We also performed the Chi-square and Analysis of Variance (ANOVA) for our bivariate analysis. For multivariable modeling, we used mixed-effects regression models that allowed us to adjust for the nested nature of our data. This was because participants are nested to families that are nested to sites and states. Both models were performed in the overall sample. Model 1 did not have the interaction terms. Model 2 added interaction terms between race and parental education. In all models, mental rotation (efficiency score), a proxy of cognitive function, was the outcome. Figure A1 shows distribution of our variables and test of regression assumptions. Box A1 shows our models. Regression coefficient (b), SE, t value, and p-value were reported.
2.5. Ethical Aspect
The ABCD study has Institutional Review Board (IRB) approval, and all participants have provided assent or consent, depending their age [46]. Given that our analysis was performed on fully de-identified data, our analysis was exempt from a full IRB review.
3. Results
3.1. Descriptives
Overall, 11,135, 9–10-year-old children were analyzed. Most participants were Whites (n = 7212; 64.8%) followed by Blacks (n = 1743 15.7%). From all, 263 were Asian (2.4%) and 1917 (17.2%) were other/mixed race. Table 1 presents the descriptive data overall and by race. This table also compares racial groups for study variables. As this table shows, Black and mixed/other race participants had lowest parental education and White and Asian children had the highest parental education.
3.2. Multivariate Models (Additive Effects)
3.3. Multivariate Models (Interactions)
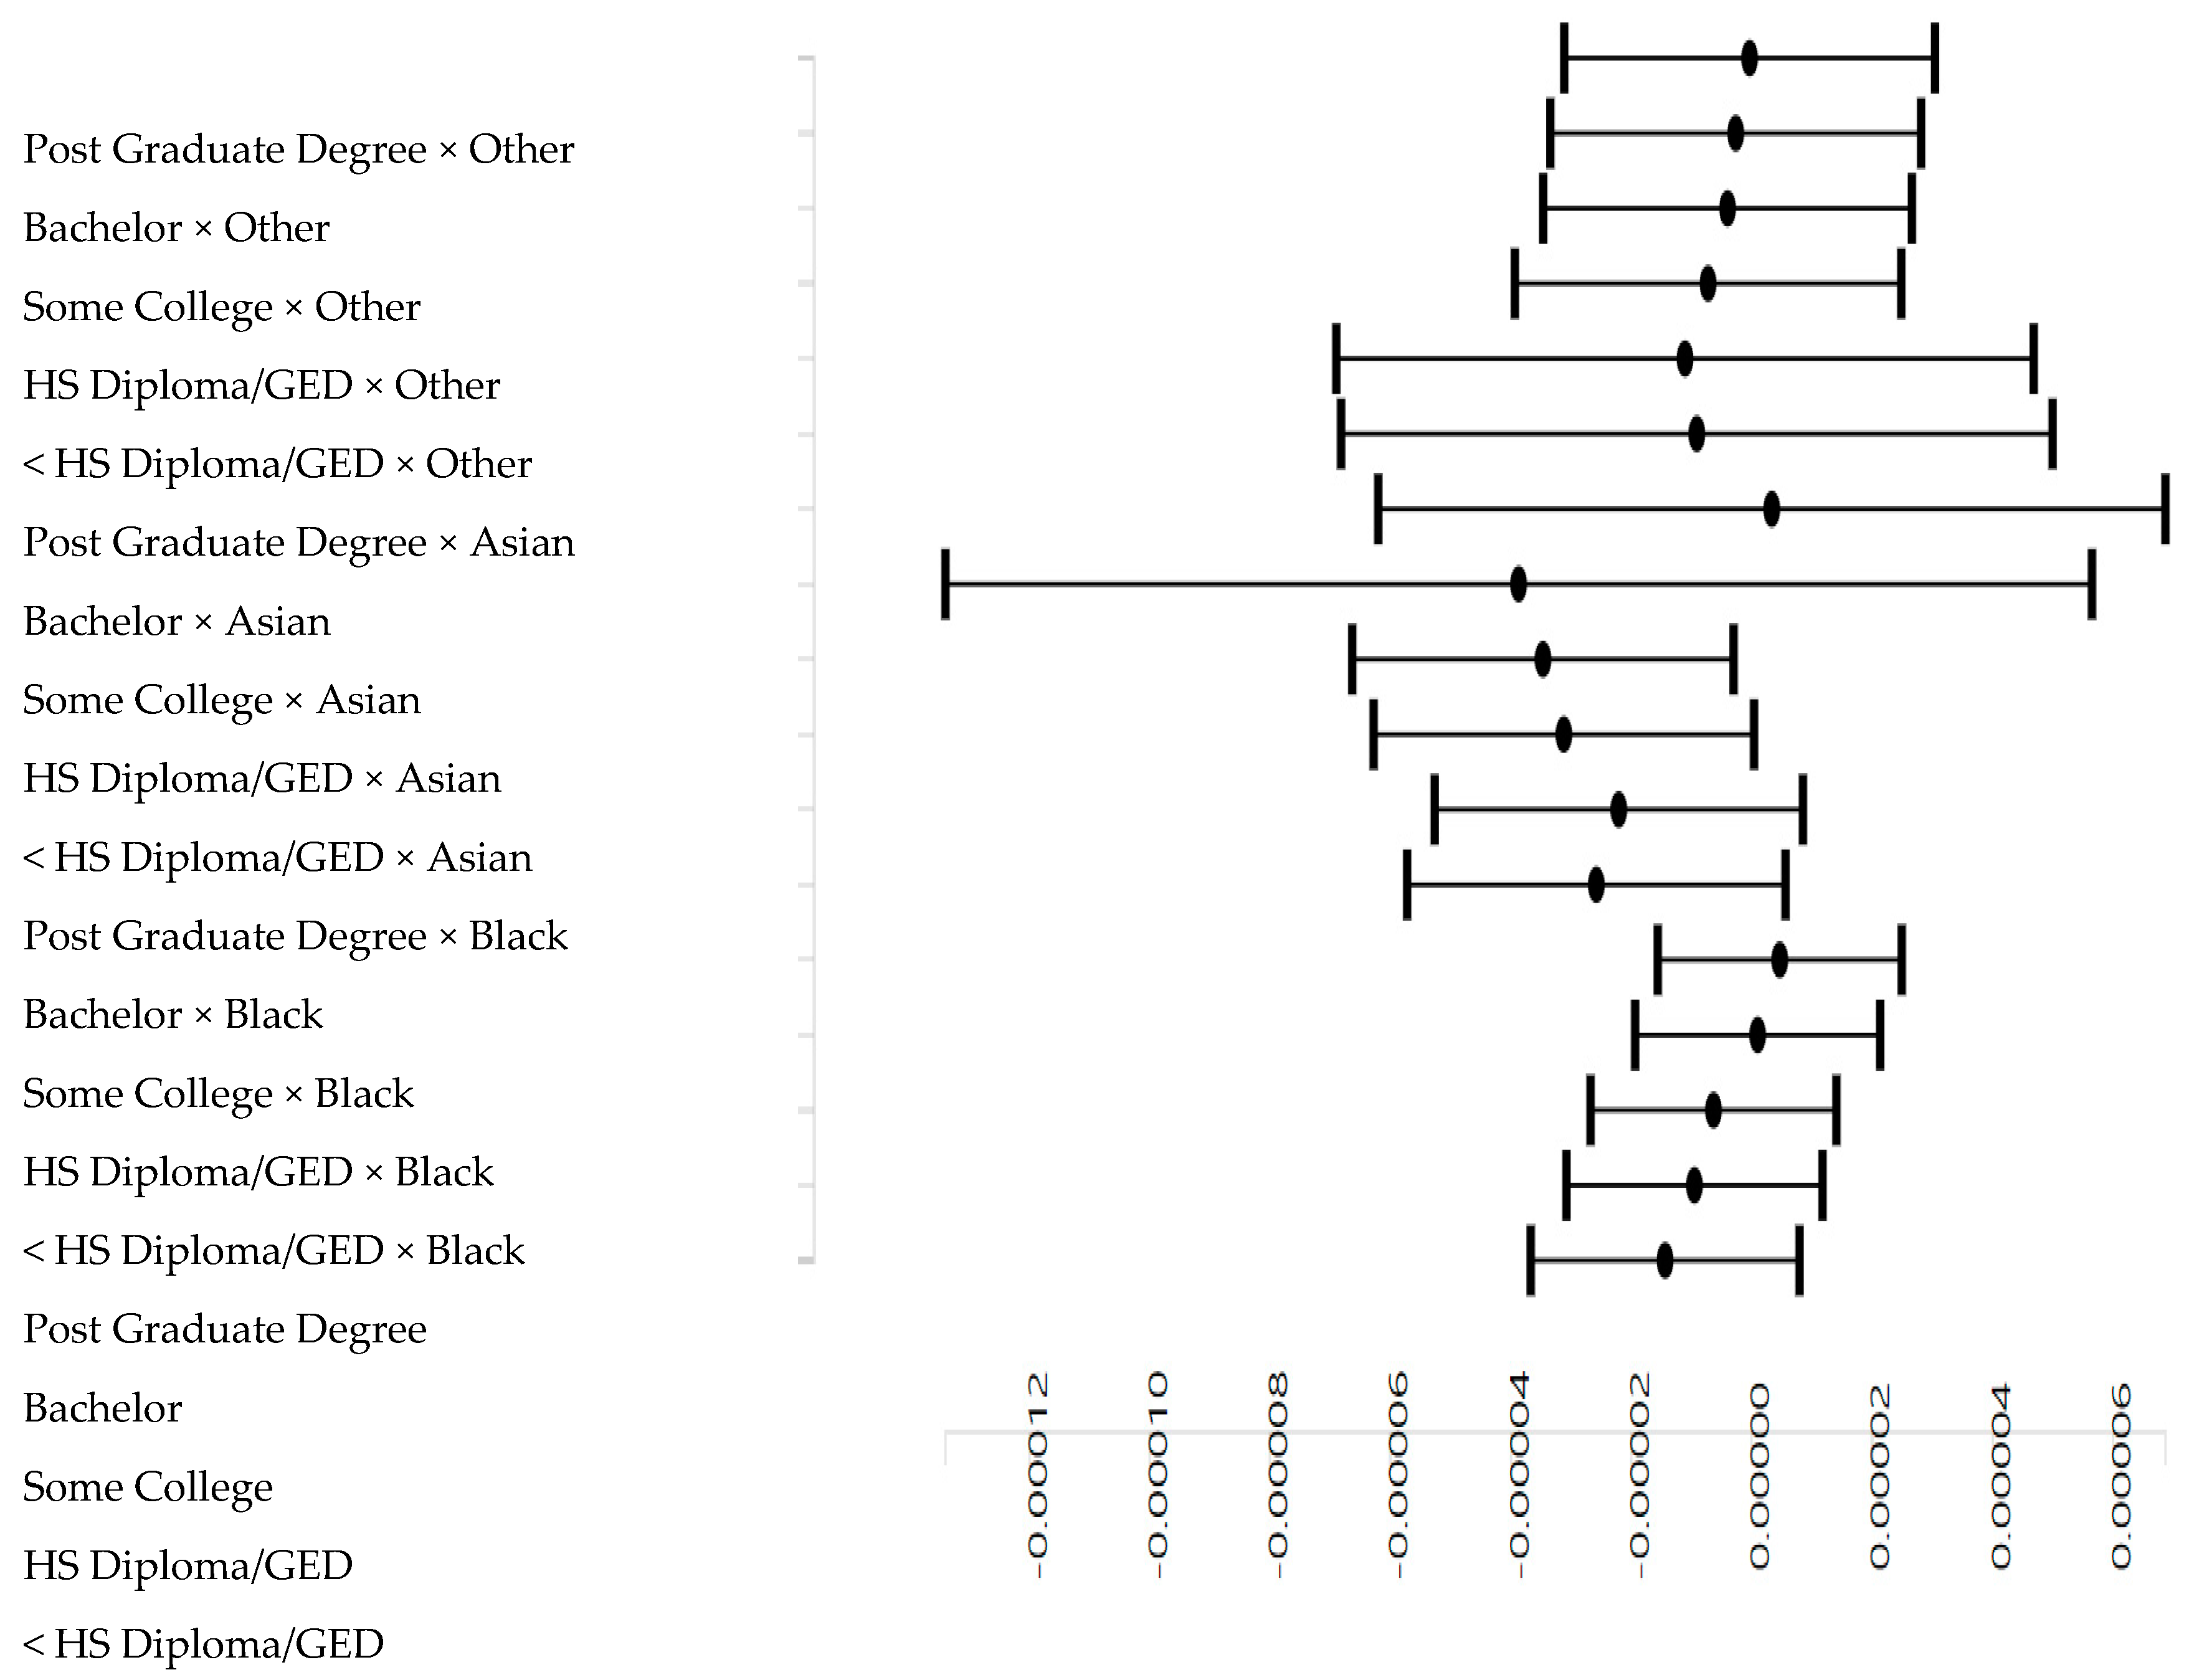
Table 3 presents the results of a mixed effects regression models in the overall sample. Model 2 showed an interaction between parental education and race on mental rotation. This interaction indicated that the boosting effect of parental education on mental rotation is weaker for Black than White children (Figure 2).
4. Discussion
This study showed a positive association between parental education and mental rotation overall; however, this was stronger for White than for Black children. That is, while parental education boosts the mental rotation for American children, this effect is weaker in Black than White families. As a result, Black children with highly educated parents remain at low mental rotation, a pattern absent for White children. For White children, children with highly educated parents show highest levels of mental rotation. We did not see similar interactions with other racial groups.
Our finding is in line with MDRs of parental education on mental rotation for Black children. This is fully in line with what is already established on the MDRs of family SES on impulsivity [52], reward responsiveness [53], impulsivity [27], inhibitory control [54], attention [32], and ADHD [38]. Similar MDRs are also reported for the effects of family SES indicators such as parental education, household income, and marital status on behavioral risk such as aggression [26], and substance use [26], as well as mental health risk such as anxiety [35], depression [30], and suicide [40]. These are all diminishing returns of family SES indicators for Black compared to White youth [14,20,55,56]. It is unknown why these MDRs are present for Black children but could not be seen for other racial groups.
These MDRs are not specific to one specific domain or outcome, suggesting that they are due to society but not culture, behavior, or biology. Thus, age does not have a weaker effect on mental rotation of Blacks than Whites because Blacks are innately weaker than Whites. Similarly, the diminished slope is not because Blacks and Whites are biologically different. This is evident because similar MDRs are shown for all marginalized groups with a range of marginalizing identities [12,13]. Thus, they are not specific to Blacks [28] but also Hispanics [14,15,16,17], Asian Americans [18], Native Americans [19], LGBTQs [20], immigrants [21], or even marginalized Whites [22]. They are also not specific to a particular age group, as documented for children [27,28,31], adults [55], and older adults [57]. Finally, these MDRs are relevant to economic resources such as SES [14,27,35,58,59], and non-economic assets such as self-efficacy [60,61]. This paper extends the previous work on MDRs to the area of cognitive function.
A wide range of sociological and economic mechanisms explain the MDRs of human capital and economic resources on mental rotation for Black related to White families. Black families experience high levels of stress across all SES levels [62]. Social mobility is more taxing for Black than White families [63]. At all SES levels, exposure [64,65,66,67,68] and vulnerability [58] to discrimination is high for Black families. While low SES Black families struggle with food insecurity and poverty and neighborhood disorder, high SES Black families experience discrimination due to proximity to Whites [64,65]. As discrimination reduces the chance of healthy brain development [58,67,69], Black children may remain at risk of impulsivity across the whole SES spectrum. As a result, age, the main driver of development, shows weaker effects for Black than White children.
While low SES and poor outcomes are two types of disadvantage in Black communities, MDRs reflect a qualitatively different set of disadvantage [12,13]. While the former is reflective of unequal outcomes and opportunities, the latter is reflective of low response to the presence of individual level resources. It is due to the latter that policymakers may observe sustained inequality despite investments. To address the latter, there is a need to address systemic causes of inequalities. As a result of these two jeopardies, Blacks are experiencing a double disadvantage, where not only resources are scarce, the influence of the individual level resources and assets are dampened, given the environment [12,70].
Multilevel economic and environmental mechanisms are in play that reduce the marginal returns of family SES. MDRs are attributed to social stratification, racism, and marginalization. These processes function across multiple societal institutions [12,70]. Racial injustice, prejudice, and discrimination have historically interfered with the gain of resources and assets for the Black communities [71,72,73]. One of many causes of MDRs may be childhood poverty [74]. As a result of such environmental and structural injustice, we observe MDRs across resources, assets, outcomes, settings, and age groups.
Limitations
The current study has some methodological shortcomings. First, because of a cross-sectional design, it is inappropriate for us to draw any causal inferences. However, age is a known determinant of brain development. So, the direction of the association between age and mental rotation is from age to cognitive performance not vice versa. Still, the findings reported here are correlations, not causes. To established stronger causal evidence, we need to use longitudinal data and map changes in cognitive function with increase in age over time. Our expectation is that process of aging is better associated with cognitive enhancement for White than Black children. Similarly, we only tested the MDRs of parental education. Previous work had established MDRs of family SES on non-cognitive outcomes [27,33,52,53]. In addition, we only focused on family SES. It is imperative to control for contextual and neighborhood level indicators as well as health. Finally, we did not study how these MDRs change over time.
5. Conclusions
Relative to their White counterparts, Black children show weaker effects of parental education on mental rotation. This is important because mental rotation and cognitive function are drivers for a wide range of educational outcomes. To minimize the Black–White gap in brain development, there is a need to address societal barriers that cause MDRs of economic and non-economic resources in Black communities and families. We need economic, public, and social policies that go beyond individual-level risk factors and address systemic, structural, and societal causes of inequalities.
Funding
Shervin Assari is supported by the grants with the numbers CA201415 02, DA035811-05, U54MD007598, U54MD008149, D084526-03, and U54CA229974 by the National Institutes of Health (NIH). Data used in the preparation of this article were obtained from the Adolescent Brain Cognitive Development (ABCD) Study (https://abcdstudy.org), held in the NIMH Data Archive (NDA). The ABCD Study is supported by the National Institutes of Health (NIH) and additional federal partners under award numbers U01DA041022, U01DA041025, U01DA041028, U01DA041048, U01DA041089, U01DA041093, U01DA041106, U01DA041117, U01DA041120, U01DA041134, U01DA041148, U01DA041156, U01DA041174, U24DA041123, and U24DA041147. A full list of federal partners is available at https://abcdstudy.org/federal-partners.html. A listing of participating sites and a complete listing of the study investigators can be found at https://abcdstudy.org/principal-investigators.html. This manuscript reflects the views of the authors and may not reflect the opinions or views of the NIH or ABCD consortium investigators. ABCD consortium investigators designed and implemented the study and/or provided data but did not necessarily participate in analysis or writing of this report. Author Funding: Shervin Assari is supported by the National Institutes of Health (NIH) grants 5S21MD000103, D084526-03, CA201415 02, DA035811-05, U54MD008149, U54MD007598, and U54CA229974. DEAP Funding: DEAP is a software provided by the Data Analysis and Informatics Center of ABCD located at the UC San Diego with generous support from the National Institutes of Health and the Centers for Disease Control and Prevention under award number U24DA041123. The DEAP project information and links to its source code are available under the resource identifier RRID: SCR_016158.
Conflicts of Interest
The author declares no conflict of interest.
Appendix A
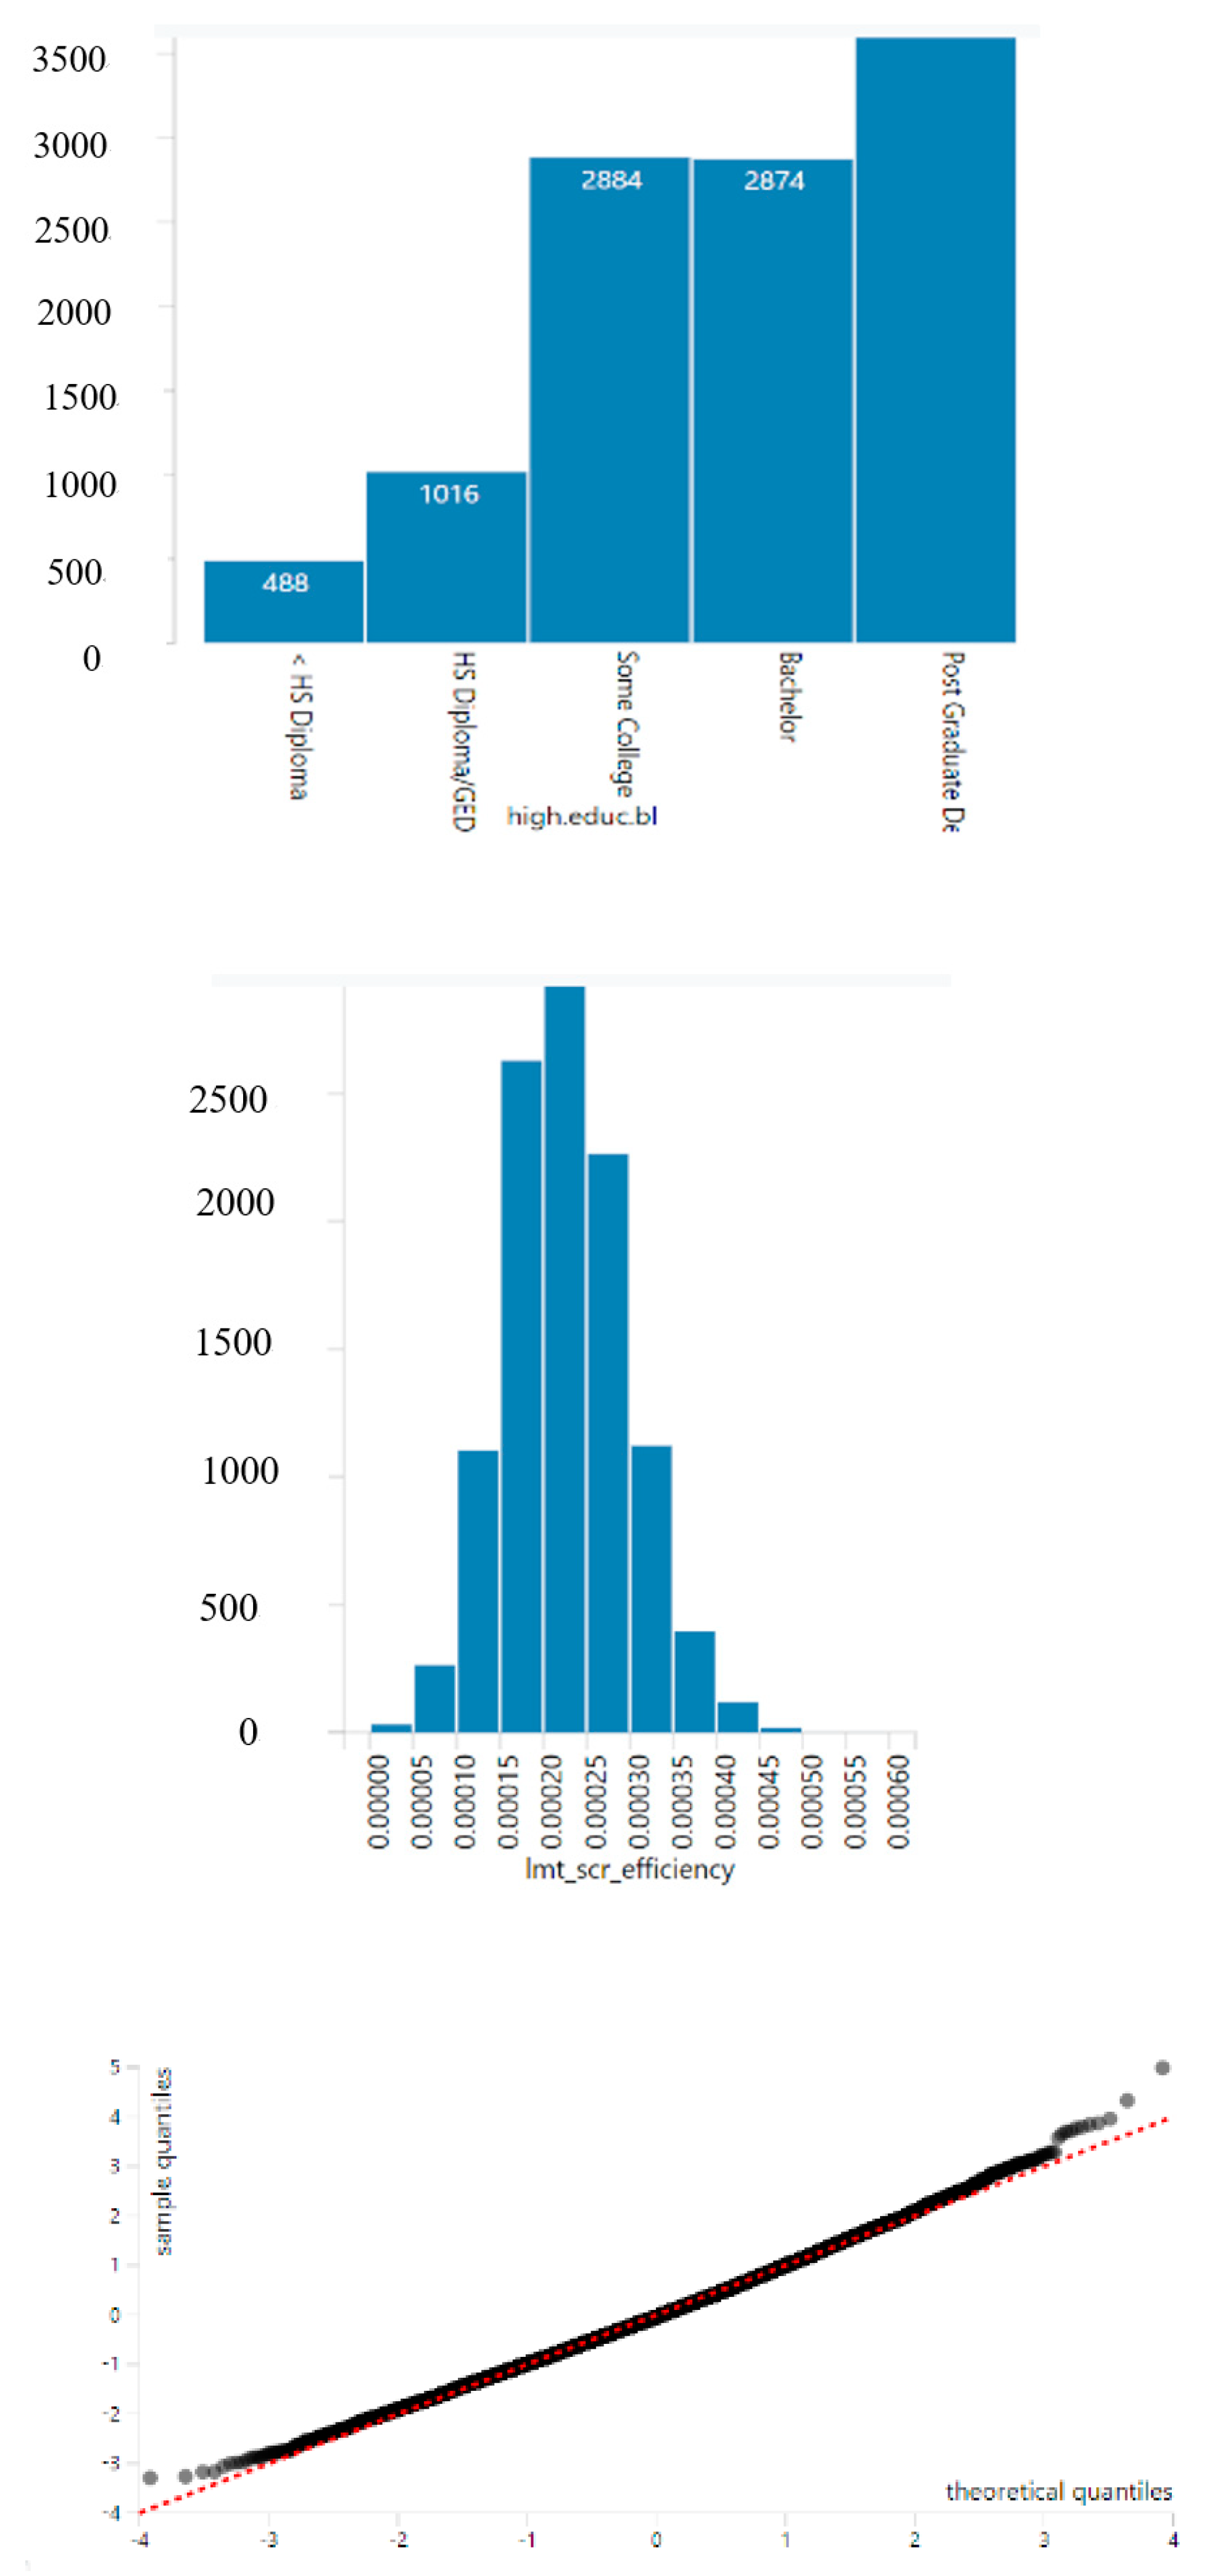
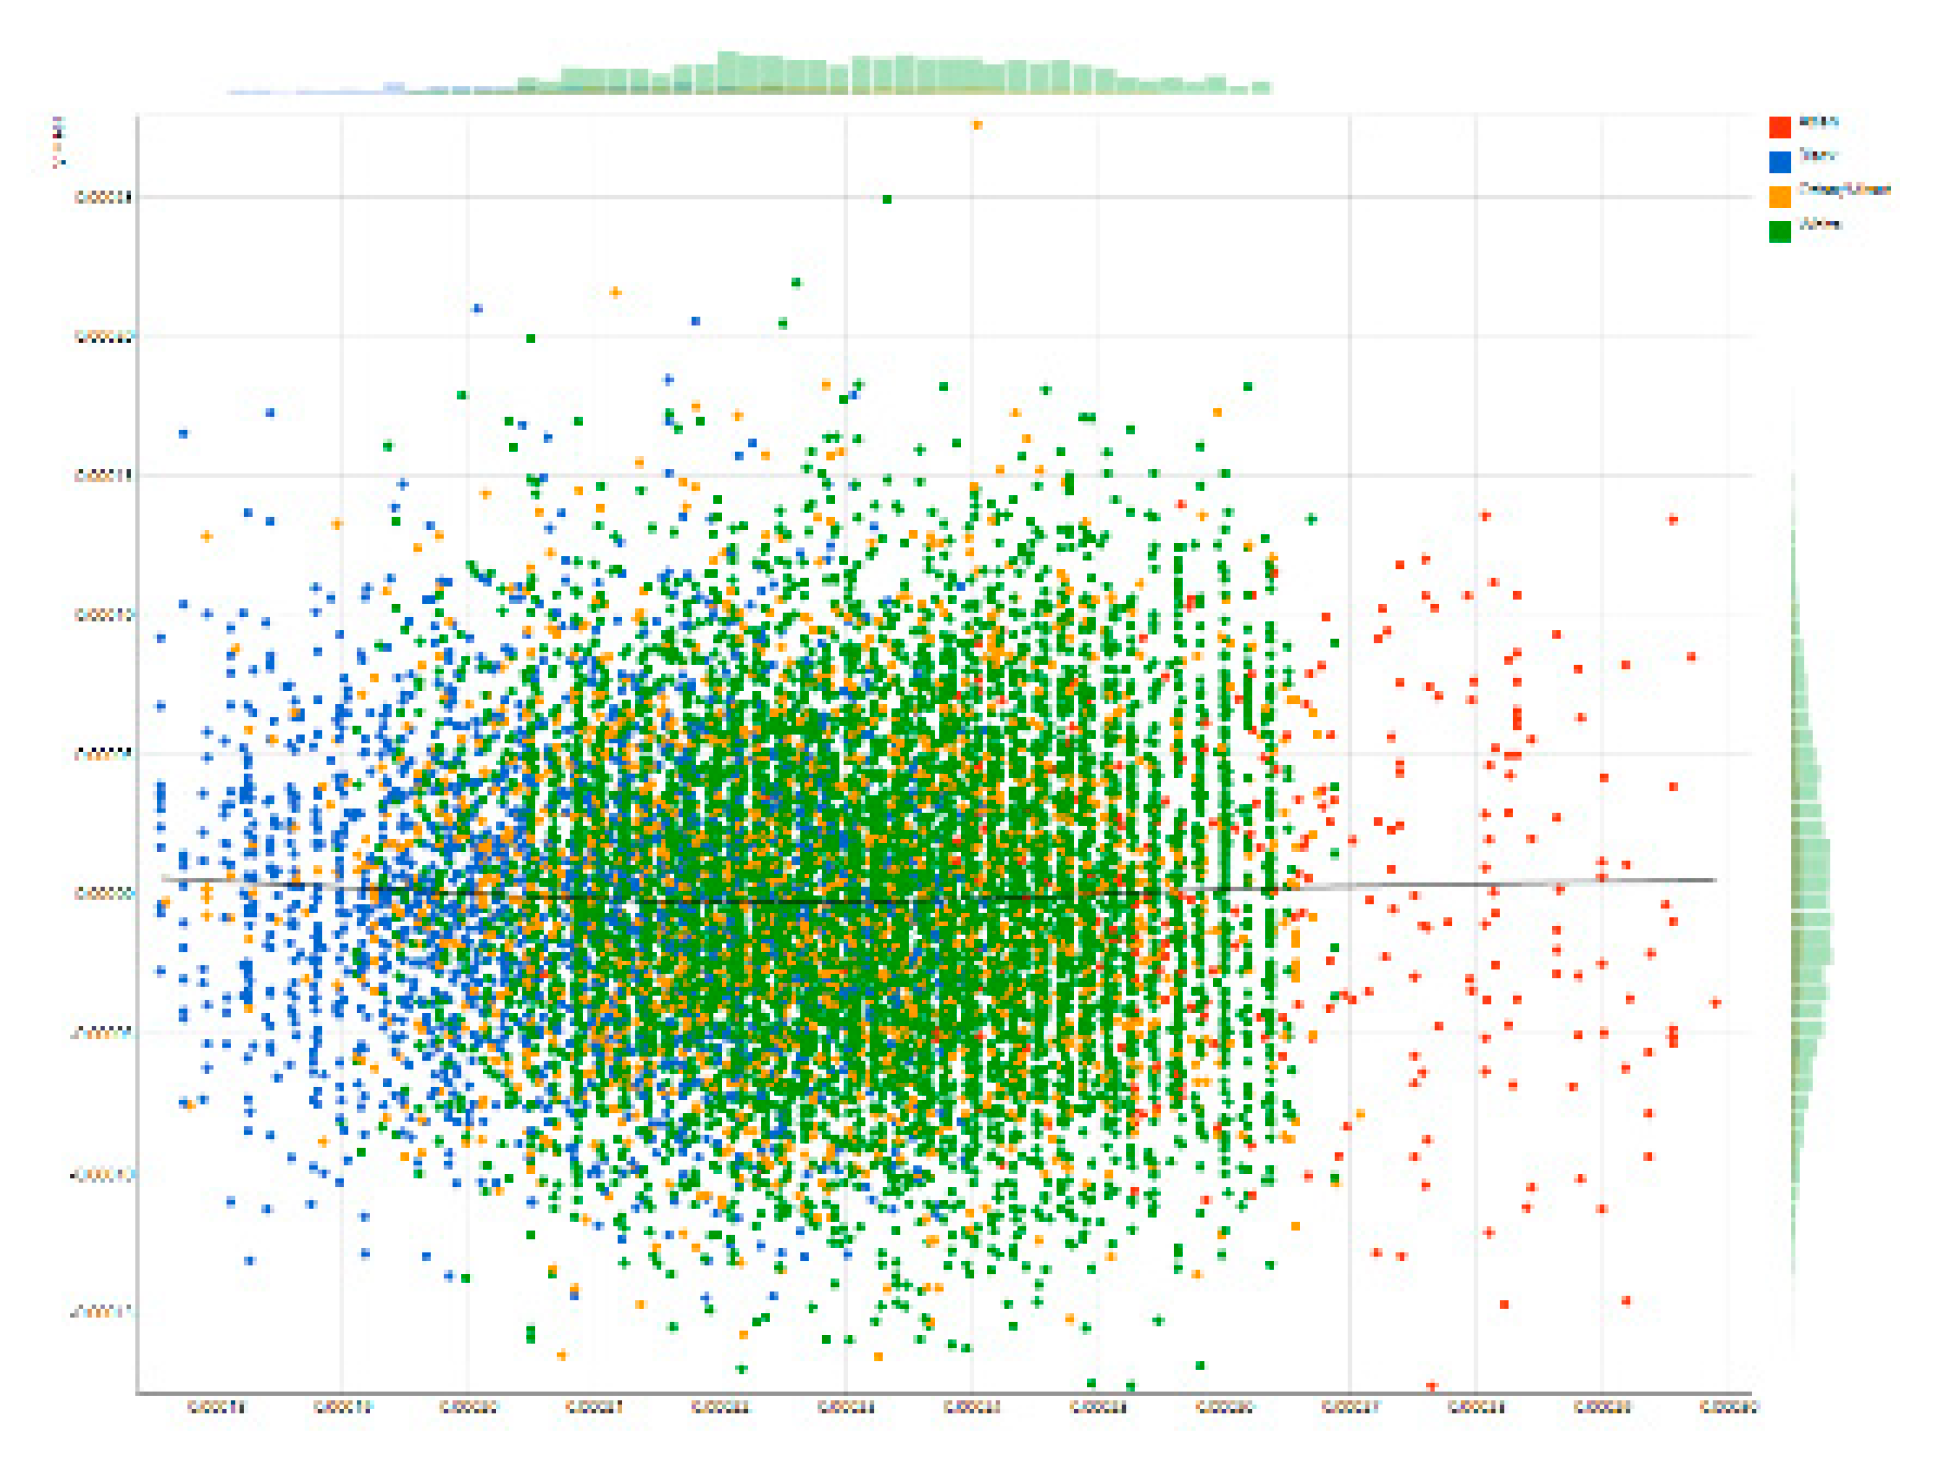
Figure A1.
Distribution of predictor, outcome, quantiles, and residuals.


Box A1. Model Formula.
Model 1
lmt_scr_efficiency ~ high.educ.bl + race.4level + sex + married.bl + age + hisp
Random: ~(1|rel_family_id)
Model 2
lmt_scr_efficiency ~ high.educ.bl + race.4level + sex + married.bl + age + hisp + race.4level high.educ.bl
Random: ~(1|rel_family_id)
References
- Zacks, J.M. Neuroimaging studies of mental rotation: A meta-analysis and review. J. Cogn. Neurosci. 2008, 20, 1–19. [Google Scholar] [CrossRef] [PubMed]
- Corballis, M.C. Mental rotation and the right hemisphere. Brain Lang. 1997, 57, 100–121. [Google Scholar] [CrossRef] [PubMed]
- Metzler, J.; Shepard, R.N. Transformational studies of the internal representation of three-dimensional objects. In Theories in Cognitive Psychology: The Loyola Symposium; Solso, R.L., Ed.; Lawrence Erlbaum: Mahwah, NJ, USA, 1974. [Google Scholar]
- Puglisi, J.T.; Morrell, R.W. Age-related slowing in mental rotation of three-dimensional objects. Exp. Aging Res. 1986, 12, 217–220. [Google Scholar] [CrossRef] [PubMed]
- McWilliams, W.; Hamilton, C.; Muncer, S. On mental rotation in three dimensions. Percept. Mot. Ski. 1997, 85, 297–298. [Google Scholar] [CrossRef] [PubMed]
- Shepard, R.N.; Metzler, J. Mental rotation of three-dimensional objects. Science 1971, 171, 701–703. [Google Scholar] [CrossRef] [Green Version]
- Tapley, S.M.; Bryden, M. An investigation of sex differences in spatial ability: Mental rotation of three-dimensional objects. Can. J. Psychol. Rev. Can. Psychol. 1977, 31, 122. [Google Scholar] [CrossRef] [PubMed]
- Herrnstein, R.J.; Murray, C. The Bell Curve: Intelligence and Class Structure in American Life; Simon and Schuster: New York, NY, USA, 2010. [Google Scholar]
- Nisbett, R. Race, IQ, and scientism. In The Bell Curve Wars; Free Press: New York, NY, USA, 1995; pp. 36–57. [Google Scholar]
- Nisbett, R.E. Intelligence and How to Get It: Why Schools and Cultures Count; WW Norton & Company: New York, NY, USA, 2009. [Google Scholar]
- Assari, S. Cognitive test score and 25-Year mortality risk; Does race matter? J. Med. Res. Innov. 2020, 4, e000213. [Google Scholar] [CrossRef]
- Assari, S. Health Disparities due to Diminished Return among Black Americans: Public Policy Solutions. Soc. Issues Policy Rev. 2018, 12, 112–145. [Google Scholar] [CrossRef]
- Assari, S. Unequal Gain of Equal Resources across Racial Groups. Int. J. Health Policy Manag. 2017, 7, 1–9. [Google Scholar] [CrossRef] [Green Version]
- Assari, S.; Farokhnia, M.; Mistry, R. Education Attainment and Alcohol Binge Drinking: Diminished Returns of Hispanics in Los Angeles. Behav. Sci. 2019, 9, 9. [Google Scholar] [CrossRef] [Green Version]
- Shervin, A.; Ritesh, M. Diminished Return of Employment on Ever Smoking among Hispanic Whites in Los Angeles. Health Equity 2019, 3, 138–144. [Google Scholar] [CrossRef] [Green Version]
- Assari, S. Socioeconomic Determinants of Systolic Blood Pressure; Minorities’ Diminished Returns. J. Health Econ. Dev. 2019, 1, 1–11. [Google Scholar]
- Assari, S. Socioeconomic Status and Self-Rated Oral Health; Diminished Return among Hispanic Whites. Dent. J. 2018, 6, 11. [Google Scholar] [CrossRef] [PubMed] [Green Version]
- Assari, S.; Boyce, S.; Bazargan, M.; Caldwell, C.H. Mathematical Performance of American Youth: Diminished Returns of Educational Attainment of Asian-American Parents. Educ. Sci. 2020, 10, 32. [Google Scholar] [CrossRef] [Green Version]
- Assari, S.; Bazargan, M. Protective Effects of Educational Attainment against Cigarette Smoking; Diminished Returns of American Indians and Alaska Natives in the National Health Interview Survey. Int. J. Travel Med. Glob. Health 2019, 7, 105. [Google Scholar] [CrossRef] [PubMed]
- Assari, S. Education Attainment and ObesityDifferential Returns Based on Sexual Orientation. Behav. Sci. 2019, 9, 16. [Google Scholar] [CrossRef] [PubMed] [Green Version]
- Assari, S. Income and Mental Well-Being of Middle-Aged and Older Americans: Immigrants’ Diminished Returns. Int. J. Travel Med. Glob. Health 2020, 8, 37–43. [Google Scholar] [CrossRef]
- Assari, S.; Boyce, S.; Bazargan, M.; Caldwell, C.H.; Zimmerman, M.A. Place-Based Diminished Returns of Parental Educational Attainment on School Performance of Non-Hispanic White Youth. Front. Educ. 2020, 5. [Google Scholar] [CrossRef]
- Hudson, D.L.; Puterman, E.; Bibbins-Domingo, K.; Matthews, K.A.; Adler, N.E. Race, life course socioeconomic position, racial discrimination, depressive symptoms and self-rated health. Soc. Sci. Med. 2013, 97, 7–14. [Google Scholar] [CrossRef]
- Bailey, Z.D.; Krieger, N.; Agénor, M.; Graves, J.; Linos, N.; Bassett, M.T. Structural racism and health inequities in the USA: Evidence and interventions. Lancet 2017, 389, 1453–1463. [Google Scholar] [CrossRef]
- Gee, G.C.; Ford, C.L. Structural Racism and Health Inequities: Old Issues, New Directions. Du Bois Rev. 2011, 8, 115–132. [Google Scholar] [CrossRef] [PubMed] [Green Version]
- Assari, S.; Caldwell, C.H.; Bazargan, M. Association Between Parental Educational Attainment and Youth Outcomes and Role of Race/Ethnicity. JAMA Netw. Open 2019, 2, e1916018. [Google Scholar] [CrossRef] [PubMed] [Green Version]
- Assari, S.; Caldwell, C.H.; Mincy, R. Family Socioeconomic Status at Birth and Youth Impulsivity at Age 15; Blacks’ Diminished Return. Children 2018, 5, 58. [Google Scholar] [CrossRef] [PubMed] [Green Version]
- Assari, S.; Thomas, A.; Caldwell, C.H.; Mincy, R.B. Blacks’ Diminished Health Return of Family Structure and Socioeconomic Status; 15 Years of Follow-Up of a National Urban Sample of Youth. J. Urban Health 2018, 95, 21–35. [Google Scholar] [CrossRef] [PubMed]
- Assari, S.; Bazargan, M. Being Married Increases Life Expectancy of White but Not Black Americans. J. Fam. Reprod. Health 2019, 13, 132–140. [Google Scholar] [CrossRef]
- Assari, S.; Caldwell, C.H. High Risk of Depression in High-Income African American Boys. J. Racial Ethn. Health Disparit. 2018, 5, 808–819. [Google Scholar] [CrossRef] [PubMed]
- Assari, S.; Caldwell, C.H.; Mincy, R.B. Maternal Educational Attainment at Birth Promotes Future Self-Rated Health of White but Not Black Youth: A 15-Year Cohort of a National Sample. J. Clin. Med. 2018, 7, 93. [Google Scholar] [CrossRef] [PubMed] [Green Version]
- Assari, S.; Boyce, S.; Bazargan, M. Subjective Family Socioeconomic Status and Adolescents’ Attention: Blacks’ Diminished Returns. Children 2020, 7, 80. [Google Scholar] [CrossRef] [PubMed]
- Assari, S. Parental Education and Youth Inhibitory Control in the Adolescent Brain Cognitive Development (ABCD) Study: Blacks’ Diminished Returns. Brain Sci. 2020, 10, 312. [Google Scholar] [CrossRef]
- Assari, S. Social Determinants of Delayed Gratification Among American Children. Casp. J. Neurol. Sci. 2020, 6, 181–189. [Google Scholar] [CrossRef]
- Assari, S.; Caldwell, C.H.; Zimmerman, M.A. Family Structure and Subsequent Anxiety Symptoms; Minorities’ Diminished Return. Brain Sci. 2018, 8, 97. [Google Scholar] [CrossRef] [PubMed] [Green Version]
- Assari, S. Parental Educational Attainment and Academic Performance of American College Students; Blacks’ Diminished Returns. J. Health Econ. Dev. 2019, 1, 21–31. [Google Scholar]
- Assari, S.; Caldwell, C.H. Parental Educational Attainment Differentially Boosts School Performance of American Adolescents: Minorities’ Diminished Returns. J. Fam. Reprod. Health 2019, 13, 7–13. [Google Scholar] [CrossRef]
- Assari, S.; Caldwell, C.H. Family Income at Birth and Risk of Attention Deficit Hyperactivity Disorder at Age 15: Racial Differences. Children 2019, 6, 10. [Google Scholar] [CrossRef] [Green Version]
- Assari, S.; Boyce, S.; Bazargan, M.; Mincy, R.; Caldwell, C.H. Unequal Protective Effects of Parental Educational Attainment on the Body Mass Index of Black and White Youth. Int. J. Environ. Res. Public Health 2019, 16, 3641. [Google Scholar] [CrossRef] [Green Version]
- Assari, S.; Boyce, S.; Bazargan, M.; Caldwell, C.H. African Americans’ Diminished Returns of Parental Education on Adolescents’ Depression and Suicide in the Adolescent Brain Cognitive Development (ABCD) Study. Eur. J. Investig. Health Psychol. Educ. 2020, 10, 656–668. [Google Scholar] [CrossRef] [PubMed]
- Alcohol Research: Current Reviews Editorial Staff. NIH’s Adolescent Brain Cognitive Development (ABCD) Study. Alcohol. Res. 2018, 39, 97. [Google Scholar]
- Casey, B.J.; Cannonier, T.; Conley, M.I.; Cohen, A.O.; Barch, D.M.; Heitzeg, M.M.; Soules, M.E.; Teslovich, T.; Dellarco, D.V.; Garavan, H.; et al. The Adolescent Brain Cognitive Development (ABCD) study: Imaging acquisition across 21 sites. Dev. Cogn. Neurosci. 2018, 32, 43–54. [Google Scholar] [CrossRef]
- Karcher, N.R.; O’Brien, K.J.; Kandala, S.; Barch, D.M. Resting-State Functional Connectivity and Psychotic-like Experiences in Childhood: Results from the Adolescent Brain Cognitive Development Study. Biol. Psychiatry 2019, 86, 7–15. [Google Scholar] [CrossRef]
- Lisdahl, K.M.; Sher, K.J.; Conway, K.P.; Gonzalez, R.; Feldstein Ewing, S.W.; Nixon, S.J.; Tapert, S.; Bartsch, H.; Goldstein, R.Z.; Heitzeg, M. Adolescent brain cognitive development (ABCD) study: Overview of substance use assessment methods. Dev. Cogn. Neurosci. 2018, 32, 80–96. [Google Scholar] [CrossRef]
- Luciana, M.; Bjork, J.M.; Nagel, B.J.; Barch, D.M.; Gonzalez, R.; Nixon, S.J.; Banich, M.T. Adolescent neurocognitive development and impacts of substance use: Overview of the adolescent brain cognitive development (ABCD) baseline neurocognition battery. Dev. Cogn. Neurosci. 2018, 32, 67–79. [Google Scholar] [CrossRef] [PubMed]
- Auchter, A.M.; Hernandez Mejia, M.; Heyser, C.J.; Shilling, P.D.; Jernigan, T.L.; Brown, S.A.; Tapert, S.F.; Dowling, G.J. A description of the ABCD organizational structure and communication framework. Dev. Cogn. Neurosci. 2018, 32, 8–15. [Google Scholar] [CrossRef] [PubMed]
- Garavan, H.; Bartsch, H.; Conway, K.; Decastro, A.; Goldstein, R.Z.; Heeringa, S.; Jernigan, T.; Potter, A.; Thompson, W.; Zahs, D. Recruiting the ABCD sample: Design considerations and procedures. Dev. Cogn. Neurosci. 2018, 32, 16–22. [Google Scholar] [CrossRef] [PubMed]
- Nixon, S.J.; Paul, R.; Phillips, M. Cognitive efficiency in alcoholics and polysubstance abusers. Alcohol. Clin. Exp. Res. 1998, 22, 1414–1420. [Google Scholar] [CrossRef] [PubMed]
- Tomasino, B.; Toraldo, A.; Rumiati, R.I. Dissociation between the mental rotation of visual images and motor images in unilateral brain-damaged patients. Brain Cogn. 2003, 51, 368–371. [Google Scholar] [CrossRef]
- Farah, M.J.; Hammond, K.M. Mental rotation and orientation-invariant object recognition: Dissociable processes. Cognition 1988, 29, 29–46. [Google Scholar] [CrossRef]
- Acker, W.L.; Acker, C. Bexley Maudsley Automated Psychological Screening and Bexley Maudsley Category Sorting Test Manual; NFER-Nelson, for the Institute of Psychiatry: London, UK, 1982. [Google Scholar]
- Assari, S.; Akhlaghipour, G.; Boyce, S.; Bazargan, M.; Caldwell, C.H. African American Children’s Diminished Returns of Subjective Family Socioeconomic Status on Fun Seeking. Children 2020, 7, 75. [Google Scholar] [CrossRef]
- Assari, S.; Boyce, S.; Akhlaghipour, G.; Bazargan, M.; Caldwell, C.H. Reward Responsiveness in the Adolescent Brain Cognitive Development (ABCD) Study: African Americans’ Diminished Returns of Parental Education. Brain Sci. 2020, 10, 391. [Google Scholar] [CrossRef]
- Assari, S.; Boyce, S.; Bazargan, M. Subjective Socioeconomic Status and Children’s Amygdala Volume: Minorities’ Diminish Returns. NeuroSci 2020, 1, 59–74. [Google Scholar] [CrossRef]
- Assari, S. Blacks’ Diminished Return of Education Attainment on Subjective Health; Mediating Effect of Income. Brain Sci. 2018, 8, 176. [Google Scholar] [CrossRef] [Green Version]
- Assari, S. Family Income Reduces Risk of Obesity for White but Not Black Children. Children 2018, 5, 73. [Google Scholar] [CrossRef] [PubMed] [Green Version]
- Assari, S.; Lankarani, M.M. Education and Alcohol Consumption among Older Americans; Black-White Differences. Front. Public Health 2016, 4, 67. [Google Scholar] [CrossRef] [PubMed] [Green Version]
- Assari, S.; Preiser, B.; Lankarani, M.M.; Caldwell, C.H. Subjective Socioeconomic Status Moderates the Association between Discrimination and Depression in African American Youth. Brain Sci. 2018, 8, 71. [Google Scholar] [CrossRef] [PubMed] [Green Version]
- Assari, S. Life Expectancy Gain Due to Employment Status Depends on Race, Gender, Education, and Their Intersections. J. Racial Ethn. Health Disparit. 2018, 5, 375–386. [Google Scholar] [CrossRef] [PubMed]
- Assari, S. General Self-Efficacy and Mortality in the USA; Racial Differences. J. Racial Ethn. Health Disparit. 2017, 4, 746–757. [Google Scholar] [CrossRef]
- Assari, S.; Lankarani, M.M. Reciprocal Associations between Depressive Symptoms and Mastery among Older Adults; Black-White Differences. Front. Aging Neurosci. 2016, 8, 279. [Google Scholar] [CrossRef]
- Bowden, M.; Bartkowski, J.; Xu, X.; Lewis, R., Jr. Parental occupation and the gender math gap: Examining the social reproduction of academic advantage among elementary and middle school students. Soc. Sci. 2017, 7, 6. [Google Scholar] [CrossRef] [Green Version]
- Chetty, R.; Hendren, N.; Kline, P.; Saez, E. Where is the land of opportunity? The geography of intergenerational mobility in the United States. Q. J. Econ. 2014, 129, 1553–1623. [Google Scholar] [CrossRef] [Green Version]
- Assari, S.; Gibbons, F.X.; Simons, R. Depression among Black Youth; Interaction of Class and Place. Brain Sci. 2018, 8, 108. [Google Scholar] [CrossRef] [Green Version]
- Assari, S.; Gibbons, F.X.; Simons, R.L. Perceived Discrimination among Black Youth: An 18-Year Longitudinal Study. Behav. Sci. 2018, 8, 44. [Google Scholar] [CrossRef] [Green Version]
- Assari, S. Does School Racial Composition Explain Why High Income Black Youth Perceive More Discrimination? A Gender Analysis. Brain Sci. 2018, 8, 140. [Google Scholar] [CrossRef] [PubMed] [Green Version]
- Assari, S.; Lankarani, M.M.; Caldwell, C.H. Does Discrimination Explain High Risk of Depression among High-Income African American Men? Behav. Sci. 2018, 8, 40. [Google Scholar] [CrossRef] [PubMed] [Green Version]
- Assari, S.; Moghani Lankarani, M. Workplace Racial Composition Explains High Perceived Discrimination of High Socioeconomic Status African American Men. Brain Sci. 2018, 8, 139. [Google Scholar] [CrossRef] [PubMed] [Green Version]
- Assari, S.; Caldwell, C.H. Social Determinants of Perceived Discrimination among Black Youth: Intersection of Ethnicity and Gender. Children 2018, 5, 24. [Google Scholar] [CrossRef] [PubMed] [Green Version]
- Assari, S. Understanding America: Unequal Economic Returns of Years of Schooling in Whites and Blacks. World J. Educ. Res. 2020, 7, 78–92. [Google Scholar] [CrossRef]
- Hudson, D.L.; Bullard, K.M.; Neighbors, H.W.; Geronimus, A.T.; Yang, J.; Jackson, J.S. Are benefits conferred with greater socioeconomic position undermined by racial discrimination among African American men? J. Mens. Health 2012, 9, 127–136. [Google Scholar] [CrossRef] [PubMed] [Green Version]
- Hudson, D.L.; Neighbors, H.W.; Geronimus, A.T.; Jackson, J.S. The relationship between socioeconomic position and depression among a US nationally representative sample of African Americans. Soc. Psychiatry Psychiatr. Epidemiol. 2012, 47, 373–381. [Google Scholar] [CrossRef] [Green Version]
- Hudson, D.; Sacks, T.; Irani, K.; Asher, A. The Price of the Ticket: Health Costs of Upward Mobility among African Americans. Int. J. Environ. Res. Public Health 2020, 17, 1179. [Google Scholar] [CrossRef] [Green Version]
- Bartik, T.J.; Hershbein, B. Degrees of Poverty: The Relationship between Family Income Background and the Returns to Education; Upjohn Institute: Kalamazoo, MI, USA, 2018. [Google Scholar]
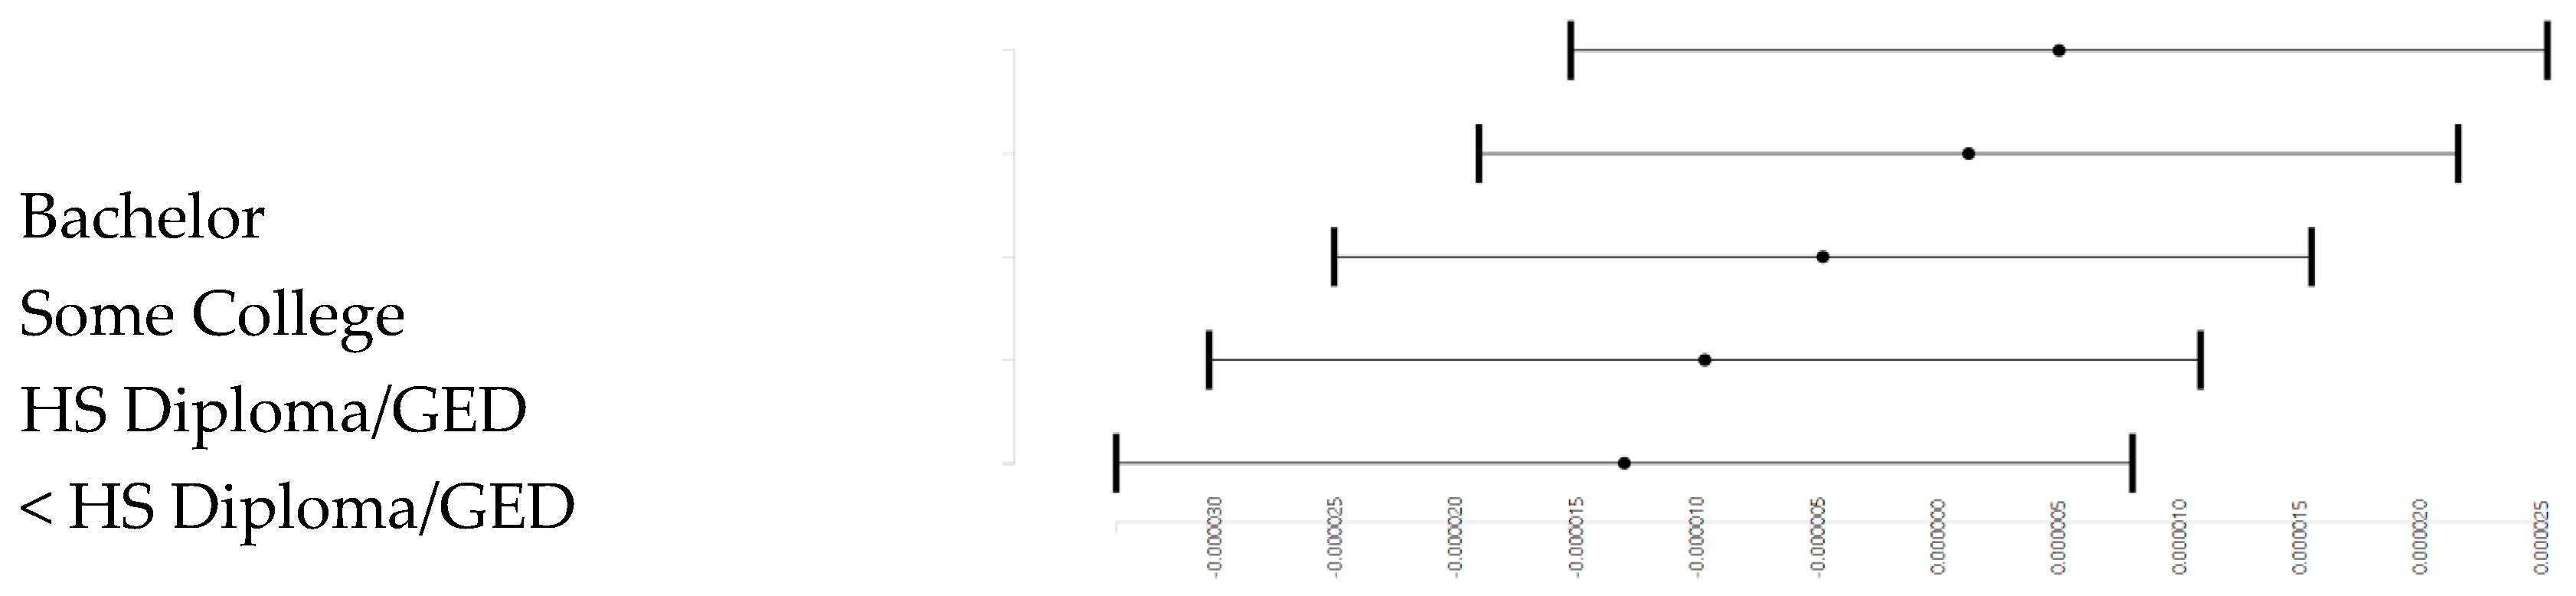
Figure 1.
Association between parental education and mental rotation overall.

Figure 2.
Association between parental education and mental rotation by race.


Table 1.
Descriptive characteristics overall and by race (n = 11,135).
| Level | All | White | Black | Asian | Other/Mixed | p | |
|---|---|---|---|---|---|---|---|
| n | 11,135 | 7212 | 1743 | 263 | 1917 | ||
| Parental Education | <HS Diploma | 488 (4.4) | 200 (2.8) | 147 (8.4) | 7 (2.7) | 134 (7.0) | <0.001 |
| HS Diploma/GED | 1016 (9.1) | 369 (5.1) | 422 (24.2) | 3 (1.1) | 222 (11.6) | ||
| Some College | 2884 (25.9) | 1524 (21.1) | 689 (39.5) | 17 (6.5) | 654 (34.1) | ||
| Bachelor | 2874 (25.8) | 2114 (29.3) | 250 (14.3) | 74 (28.1) | 436 (22.7) | ||
| Post Graduate Degree | 3873 (34.8) | 3005 (41.7) | 235 (13.5) | 162 (61.6) | 471 (24.6) | ||
| Sex | Female | 5339 (47.9) | 3389 (47.0) | 885 (50.8) | 137 (52.1) | 928 (48.4) | 0.017 |
| Male | 5796 (52.1) | 3823 (53.0) | 858 (49.2) | 126 (47.9) | 989 (51.6) | ||
| Married Family | No | 3529 (31.7) | 1527 (21.2) | 1224 (70.2) | 36 (13.7) | 742 (38.7) | <0.001 |
| Yes | 7606 (68.3) | 5685 (78.8) | 519 (29.8) | 227 (86.3) | 1175 (61.3) | ||
| Hispanic | No | 8941 (80.3) | 5921 (82.1) | 1663 (95.4) | 243 (92.4) | 1114 (58.1) | <0.001 |
| Yes | 2194 (19.7) | 1291 (17.9) | 80 (4.6) | 20 (7.6) | 803 (41.9) | ||
| Mean (SD) | Mean (SD) | Mean (SD) | Mean (SD) | Mean (SD) | |||
| Age | 118.97 (7.47) | 119.04 (7.50) | 118.88 (7.29) | 119.46 (7.75) | 118.69 (7.47) | 0.196 | |
| Mental Rotation | 0.00 (0.00) | 0.00 (0.00) | 0.00 (0.00) | 0.00 (0.00) | 0.00 (0.00) | <0.001 |
Table 2.
Mixed effects regressions overall (Model 1).
| Characteristics | b | SE | t | p |
|---|---|---|---|---|
| Parental Education (HS Diploma/GED) | 0e + 00 | 0.00 | 0.88 | 0.380 |
| Parental Education (Some College) | 1e-05 * | 0.00 | 2.41 | 0.016 |
| Parental Education (Bachelor) | 1e-05 *** | 0.00 | 4.02 | <0.001 |
| Parental Education (Post Graduate Degree) | 2e-05 *** | 0.00 | 5.09 | <0.001 |
| Race (Black) | −2e-05 *** | 0.00 | −7.38 | <0.001 |
| Race (Asian) | 3e-05 *** | 0.00 | 7.70 | <0.001 |
| Race (Other/Mixed) | 0e + 00 | 0.00 | -0.84 | 0.402 |
* p < 0.05. ** p < 0.01. *** p < 0.001.
Table 3.
Mixed effects regressions overall (Model 2).
| Characteristics | b | SE | t | p |
|---|---|---|---|---|
| Parental Education (HS Diploma/GED) | 0e + 00 | 0.00 | 0.81 | 0.419 |
| Parental Education (Some College) | 1e-05 | 0.00 | 1.54 | 0.125 |
| Parental Education (Bachelor) | 2e-05 ** | 0.00 | 2.93 | 0.003 |
| Parental Education (Post Graduate Degree) | 2e-05 *** | 0.00 | 3.66 | 0.000 |
| Race (Black) | 0e + 00 | 0.00 | −0.54 | 0.589 |
| Race (Asian) | 3e-05 | 0.00 | 1.11 | 0.268 |
| Race (Other/Mixed) | −1e-05 | 0.00 | −1.59 | 0.113 |
| Parental Education (HS Diploma/GED) × Race (Black) | −1e-05 | 0.00 | −1.28 | 0.200 |
| Parental Education (Some College) × Race (Black) | −1e-05 | 0.00 | −0.95 | 0.344 |
| Parental Education (Bachelor) × Race (Black) | −2e-05 | 0.00 | −1.90 | 0.057 |
| Parental Education (Post Graduate Degree) × Race (Black) | −2e-05 * | 0.00 | −2.28 | 0.022 |
| Parental Education (HS Diploma/GED) × Race (Asian) | −2e-05 | 0.00 | −0.52 | 0.603 |
| Parental Education (Some College) × Race (Asian) | 2e-05 | 0.00 | 0.58 | 0.562 |
| Parental Education (Bachelor) × Race (Asian) | 1e-05 | 0.00 | 0.19 | 0.846 |
| Parental Education (Post Graduate Degree) × Race (Asian) | 0e+00 | 0.00 | 0.13 | 0.900 |
| Parental Education (HS Diploma/GED) × Race (Other/Mixed) | 1e-05 | 0.00 | 0.75 | 0.455 |
| Parental Education (Some College) × Race (Other/Mixed) | 1e-05 | 0.00 | 1.26 | 0.208 |
| Parental Education (Bachelor) × Race (Other/Mixed) | 1e-05 | 0.00 | 1.39 | 0.163 |
| Parental Education (Post Graduate Degree) × Race (Other/Mixed) | 1e-05 | 0.00 | 1.69 | 0.092 |
| Race (Other/Mixed) | 0e + 00 | 0.00 | −0.84 | 0.402 |
* p < 0.05. ** p < 0.01. *** p < 0.001.
Publisher’s Note: MDPI stays neutral with regard to jurisdictional claims in published maps and institutional affiliations. |
© 2020 by the author. Licensee MDPI, Basel, Switzerland. This article is an open access article distributed under the terms and conditions of the Creative Commons Attribution (CC BY) license (http://creativecommons.org/licenses/by/4.0/).
Share and Cite
MDPI and ACS Style
Assari, S. Mental Rotation in American Children: Diminished Returns of Parental Education in Black Families. Pediatr. Rep. 2020, 12, 130-141. https://0-doi-org.brum.beds.ac.uk/10.3390/pediatric12030028
AMA Style
Assari S. Mental Rotation in American Children: Diminished Returns of Parental Education in Black Families. Pediatric Reports. 2020; 12(3):130-141. https://0-doi-org.brum.beds.ac.uk/10.3390/pediatric12030028
Chicago/Turabian StyleAssari, Shervin. 2020. "Mental Rotation in American Children: Diminished Returns of Parental Education in Black Families" Pediatric Reports 12, no. 3: 130-141. https://0-doi-org.brum.beds.ac.uk/10.3390/pediatric12030028