
Comparison of Sympathetic Skin Response (SSR) between Electrical and Acoustic Stimuli in a Healthy Pediatric Population

 ,
,
Abstract
:1. Introduction
2. Materials and Methods
- Disposable pregellated electrodes
- Electroconducting paste
- Abrasive paste
- Pediatric fork stimulator
- Audiometric headphones
2.1. Procedures
2.2. Statistical Analysis
3. Results
4. Discussion
Limitations
5. Conclusions
Author Contributions
Funding
Institutional Review Board Statement
Informed Consent Statement
Data Availability Statement
Conflicts of Interest
References
- Tarchanoff, G. Ber die galvanischen Erscheinungen an der Haut des Menchen bei Reizung der Sinnesorgane und bei verschiedenen Formen der physischen Thtigkeit. Pflug. Arch. Ges. Physiol. 1890, 46, 46–55. [Google Scholar] [CrossRef]
- Shahani, B.T.; Halperin, J.J. Sympathetic skin response—A method of assessing unmyelinated axon dysfunction in peripheral neuropathies. J. Neurol. Neurosurg. Psychiatry 1984, 47, 536–542. [Google Scholar] [CrossRef] [PubMed] [Green Version]
- Knezevic, W.; Bajada, S. Peripheral autonomic surface potential: A quantitative technique for recording sympathetic conduction in man. J. Neurol. Sci. 1985, 67, 239–251. [Google Scholar] [CrossRef]
- Bianchi, F.; Squintani, G.M. Neurophysiology of the pelvic floor in clinical practice: A systematic literature review. Funct. Neurol. 2017, 22, 173–193. [Google Scholar] [CrossRef] [PubMed]
- Low, P.A. Quantitation of autonomic responses. In Peripheral Neuropathy; Dyck, P.J., Thomas, P.K., Lambert, E.H., Bunge, R., Eds.; W.B. Saunders: Philadelphia, PA, USA, 1984; pp. 1139–1159. [Google Scholar]
- Deguchi, K.; Takeuchi, H. Signifcance of cognitive function in the elicitation of sympathetic skin response in healthy humans. J. Auton. Nerv. Syst. 1996, 61, 123–127. [Google Scholar] [CrossRef]
- Critchley, H.D.; Elliott, R. Neural Activity Relating to Generation and Representation of Galvanic Skin Conductance Responses: A Functional Magnetic Resonance Imaging Study. J. Neurosci. 2000, 20, 3033–3040. [Google Scholar] [CrossRef] [Green Version]
- LeDoux, J.E.; Sakaguchi, A.; Reis, D.J. Subcortical efferent projections of the medial geniculate nucleus mediate emotional responses conditioned to acoustic stimuli. J. Neurosci. 1984, 4, 683–698. [Google Scholar] [CrossRef] [Green Version]
- Toyokura, M. Waveform and habituation of sympathetic skin response. Electroencephalogr. Clin. Neurophysiol. Electromyogr. Mot. Control. 1998, 109, 178–183. [Google Scholar] [CrossRef]
- Aramaki, S.; Yasuhiko, K. A study of the normale values and habituation phenomenon of sympathetic skin response. Am. J. Phys. Med. Rehabil. 1997, 76, 2–7. [Google Scholar] [CrossRef]
- Niakan, E.; Harati, Y. Sympathetic skin response in diabetic peripheral neuropathy. Muscle Nerve 1988, 11, 261–274. [Google Scholar] [CrossRef]
- Soliven, B.; Maselli, R. Sympathetic skin response in diabetic neuropathy. Muscle Nerve 1987, 10, 711–716. [Google Scholar] [CrossRef] [PubMed]
- Fusina, S.; Conte, S. Sympathetic skin response asymmetry in early stage idiopathic Parkinson’s disease. Clin. Neurophysiol. 1999, 110, 358–366. [Google Scholar] [CrossRef]
- Jost, W.H.; Kirchhöfer, U. Parkinson-Syndrom. Nervenarzt 1995, 66, 777–780. [Google Scholar] [PubMed]
- Haapaniemi, T.H.; Korpelainen, J.T. Suppressed sympathetic skin response in Parkinson disease. Clin. Auton. Res. 2000, 10, 337–342. [Google Scholar] [CrossRef] [PubMed]
- Deniliè, M.; Meh, D. Sympathetic skin response in Parkinsonian patients. Electromyogr. Clin. Neurophysiol. 1996, 36, 231–235. [Google Scholar]
- Braune, H.J.; Korchounov, A.M. Autonomic dysfunction in Parkinson’s disease assessed by sympathetic skin response: A prospective clinical and neurophysiological trial on 50 patients. Acta Neurol. Scand. 1997, 95, 293–297. [Google Scholar] [CrossRef]
- Yokota, T.; Matsunaga, T. Sympathetic skin response in patients with multiple sclerosis compared with patients with spinal cord transection and normal controls. Brain 1991, 114, 1381–1394. [Google Scholar] [CrossRef]
- Zakrzewska-Pniewska, B.; Kaminska, A. Sympathetic skin response (SSR) in multiple sclerosis. Neurol. Neurochir. Pol. 1996, 3, 121–128. [Google Scholar]
- Dettmers, C.; Fatepour, D. Sympathetic skin response abnormalities in amyotrophic lateral sclerosis. Muscle Nerve 1993, 16, 930–934. [Google Scholar] [CrossRef]
- Nair, K.P.; Taly, A.B. Sympathetic skin response in myelopathies. Clin. Auton. Res. 1998, 8, 207–211. [Google Scholar] [CrossRef] [PubMed]
- Masur, H.; Schulte-Oversohl, U. Involvement of the autonomic nervous system in patients with syringomyelia: A study with the sympathetic skin response. Electromyogr. Clin. Neurophysiol. 1996, 36, 43–47. [Google Scholar] [PubMed]
- Hilz, M.J.; Axelrod, F.B. Sympathetic skin response following thermal, electrical, acoustic, and inspiratory gasp stimulation in familial dysautonomia patients and healthy persons. Clin. Auton. Res. 1999, 9, 165–177. [Google Scholar] [CrossRef]
- Solders, G.; Andersson, T. Central conduction and autonomic nervous function in HMSN I. Muscle Nerve 1991, 14, 1074–1079. [Google Scholar] [CrossRef] [PubMed]
- Hilz, M.J.; Stemper, B. Sympathetic skin response differentiates hereditary sensory autonomic neuropathies III and IV. Neurology 1999, 52, 1652–1657. [Google Scholar] [CrossRef] [PubMed]
- Arai, H.; Tanabe, Y. Finger cold-induced vasodilatation, sympathetic skin response, and R-R interval variation in patients with progressive spinal muscular atrophy. J. Child Neurol. 2005, 20, 871–875. [Google Scholar] [CrossRef]
- Wiertel-Krawczuk, A.; Hirschfeld, A.S. Sympathetic skin response following single and combined sound and electrical stimuli in young healthy subjects. J. Med. Sci. 2016, 85, 106–113. [Google Scholar] [CrossRef] [Green Version]
- Shapiro Test Calculator. Available online: https://scistatcalc.blogspot.com/2013/10/shapiro-wilk-test-calculator.html (accessed on 12 July 2021).
- Wilcoxon Test Calculator. Available online: https://ccb-compute2.cs.uni-saarland.de/wtest (accessed on 12 July 2021).
- T-Test Paired Calculator. Available online: https://www.graphpad.com/quickcalcs/ttest1 (accessed on 12 July 2021).
- Reitz, A.; Schmid, D.M. Sympathetic sudomotor skin activity in human after complete spinal cord injury. Auton. Neurosci. 2002, 102, 78–84. [Google Scholar] [CrossRef]
- Akyuz. G.; Turkdogan-Sozuer, D. Normative data of sympathetic skin response and RR interval variation in Turkish children. Brain Dev. 1999, 21, 99–102. [Google Scholar] [CrossRef]
- Cariga, P.; Catley, M. Characteristics of habituation of the sympathetic skin response to repeated electrical stimuli in man. Clin. Neurophysiol. 2001, 112, 1875–1880. [Google Scholar] [CrossRef]
- Elie, B.; Guiheneuc, P. Sympathetic skin response: Normal results in different experimental conditions. Electroencephalogr. Clin. Neurophysiol. 1990, 76, 258–267. [Google Scholar] [CrossRef]
- Opsomer, R.J.; Boccasena, P. Sympathetic skin responses from the limbs and the genitalia: Normative study and contribution to the evaluation of neurourological disorders, Electroencephalogr. Clin. Neurophysiol. 1996, 101, 25–31. [Google Scholar] [CrossRef]
- Uncini, A.; Pullman, S.L. The sympathetic skin response: Normal values, elucidation of afferent components and application limits. J. Neurol. Sci. 1988, 87, 299–306. [Google Scholar] [CrossRef]
- Toyokura, M. Sympathetic skin responses: The influence of electrical stimulus intensity and habituation on the waveform. Clin. Auton. Res. 2006, 16, 130–135. [Google Scholar] [CrossRef]
- Toyokura, M. Influence of stimulus intensity on waveform of sympathetic skin response evoked by magnetic stimulation. Clin. Neurophysiol. 2003, 114, 1423–1430. [Google Scholar] [CrossRef]
- Toyokura, M. Within-subject consistency of sympathetic-skin-response waveform across different modalities of stimulation. Auton. Neurosci. 2012, 169, 135–138. [Google Scholar] [CrossRef] [PubMed]
- Hoeldtke, R.D.; Davis, K.M. Autonomic surface potential analysis: Assessment of reproducibility and sensitivity. Muscle Nerve 1992, 15, 926–931. [Google Scholar] [CrossRef]


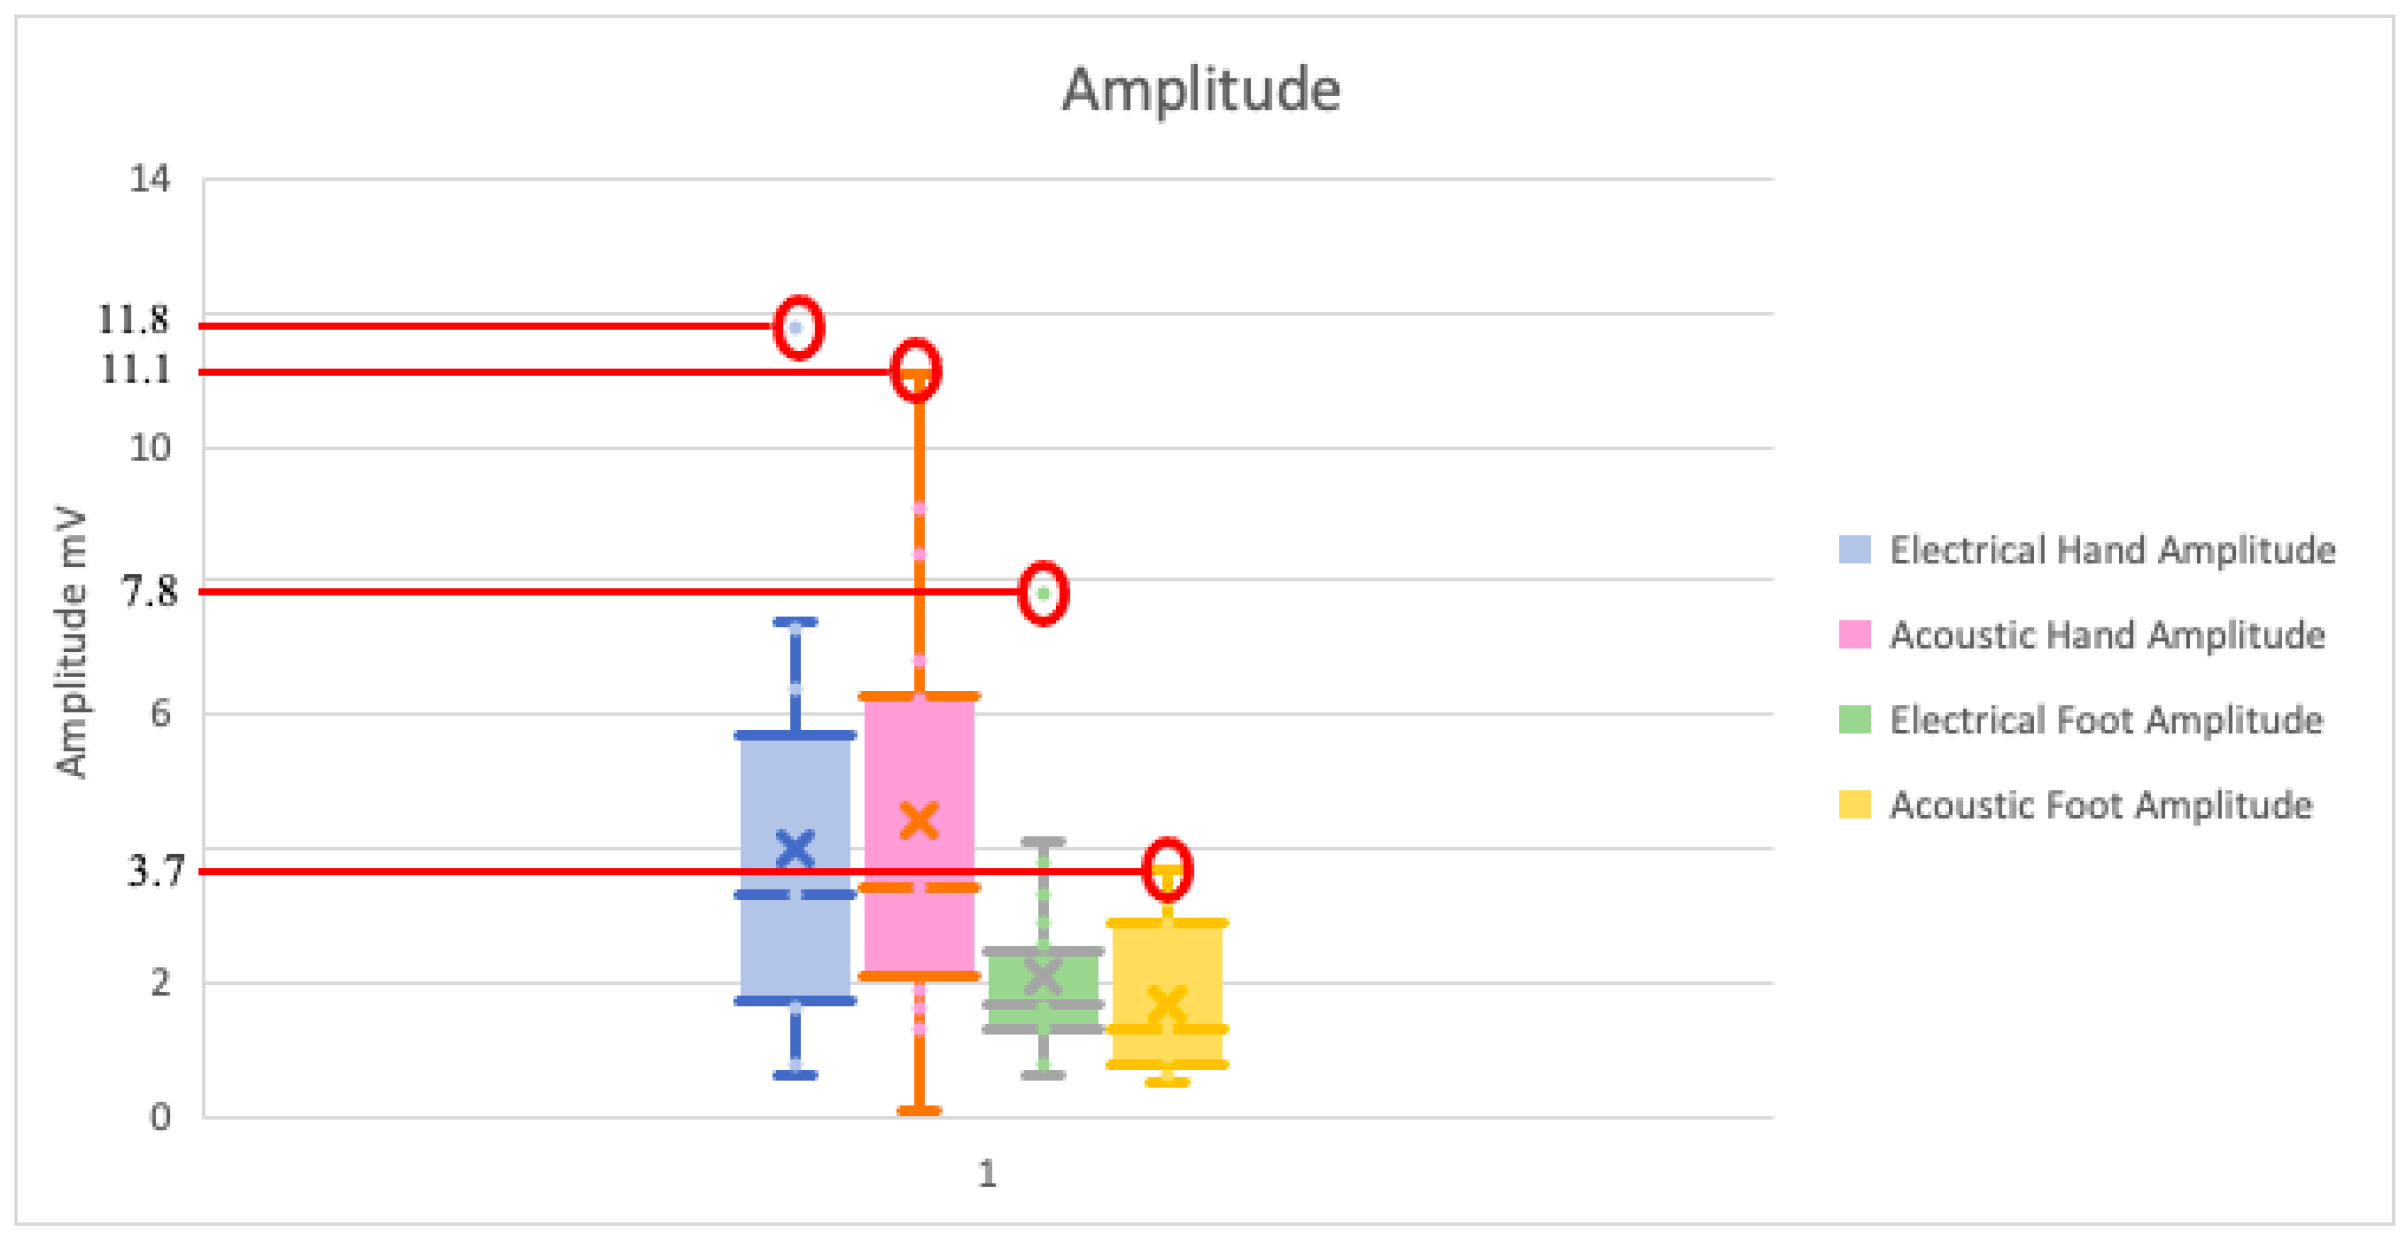
| Amplitude (mV) | Hand | Foot | ||||||
|---|---|---|---|---|---|---|---|---|
| Electrical Stimulus | Acoustical Stimulus | Electrical Stimulus | Acoustical Stimulus | |||||
| Left | Right | Left | Right | Left | Right | Left | Right | |
| Maximum | 7.4 | 11.8 | 11.1 | 9.1 | 4.10 | 7.8 | 3.7 | 3.4 |
| Minimum | 1.6 | 0.6 | 1.3 | 0.1 | 0.8 | 0.6 | 0.6 | 0.5 |
| Mean | 4.25 | 3.82 | 5.0 | 3.8 | 1.93 | 2.26 | 1.75 | 1.66 |
| Median | 4.50 | 3.00 | 4.90 | 2.90 | 1.70 | 1.70 | 1.30 | 1.25 |
| Standard Deviation | 2.21 | 2.98 | 3.33 | 2.59 | 1.00 | 1.81 | 1.16 | 1.03 |
| Lower confidence value | 1.6 | 0.6 | 1.3 | 0.1 | 0.8 | 0.6 | 0.6 | 0.5 |
| Upper confidence value | 7.4 | 11.8 | 11.1 | 9.1 | 4.10 | 7.8 | 3.7 | 3.4 |
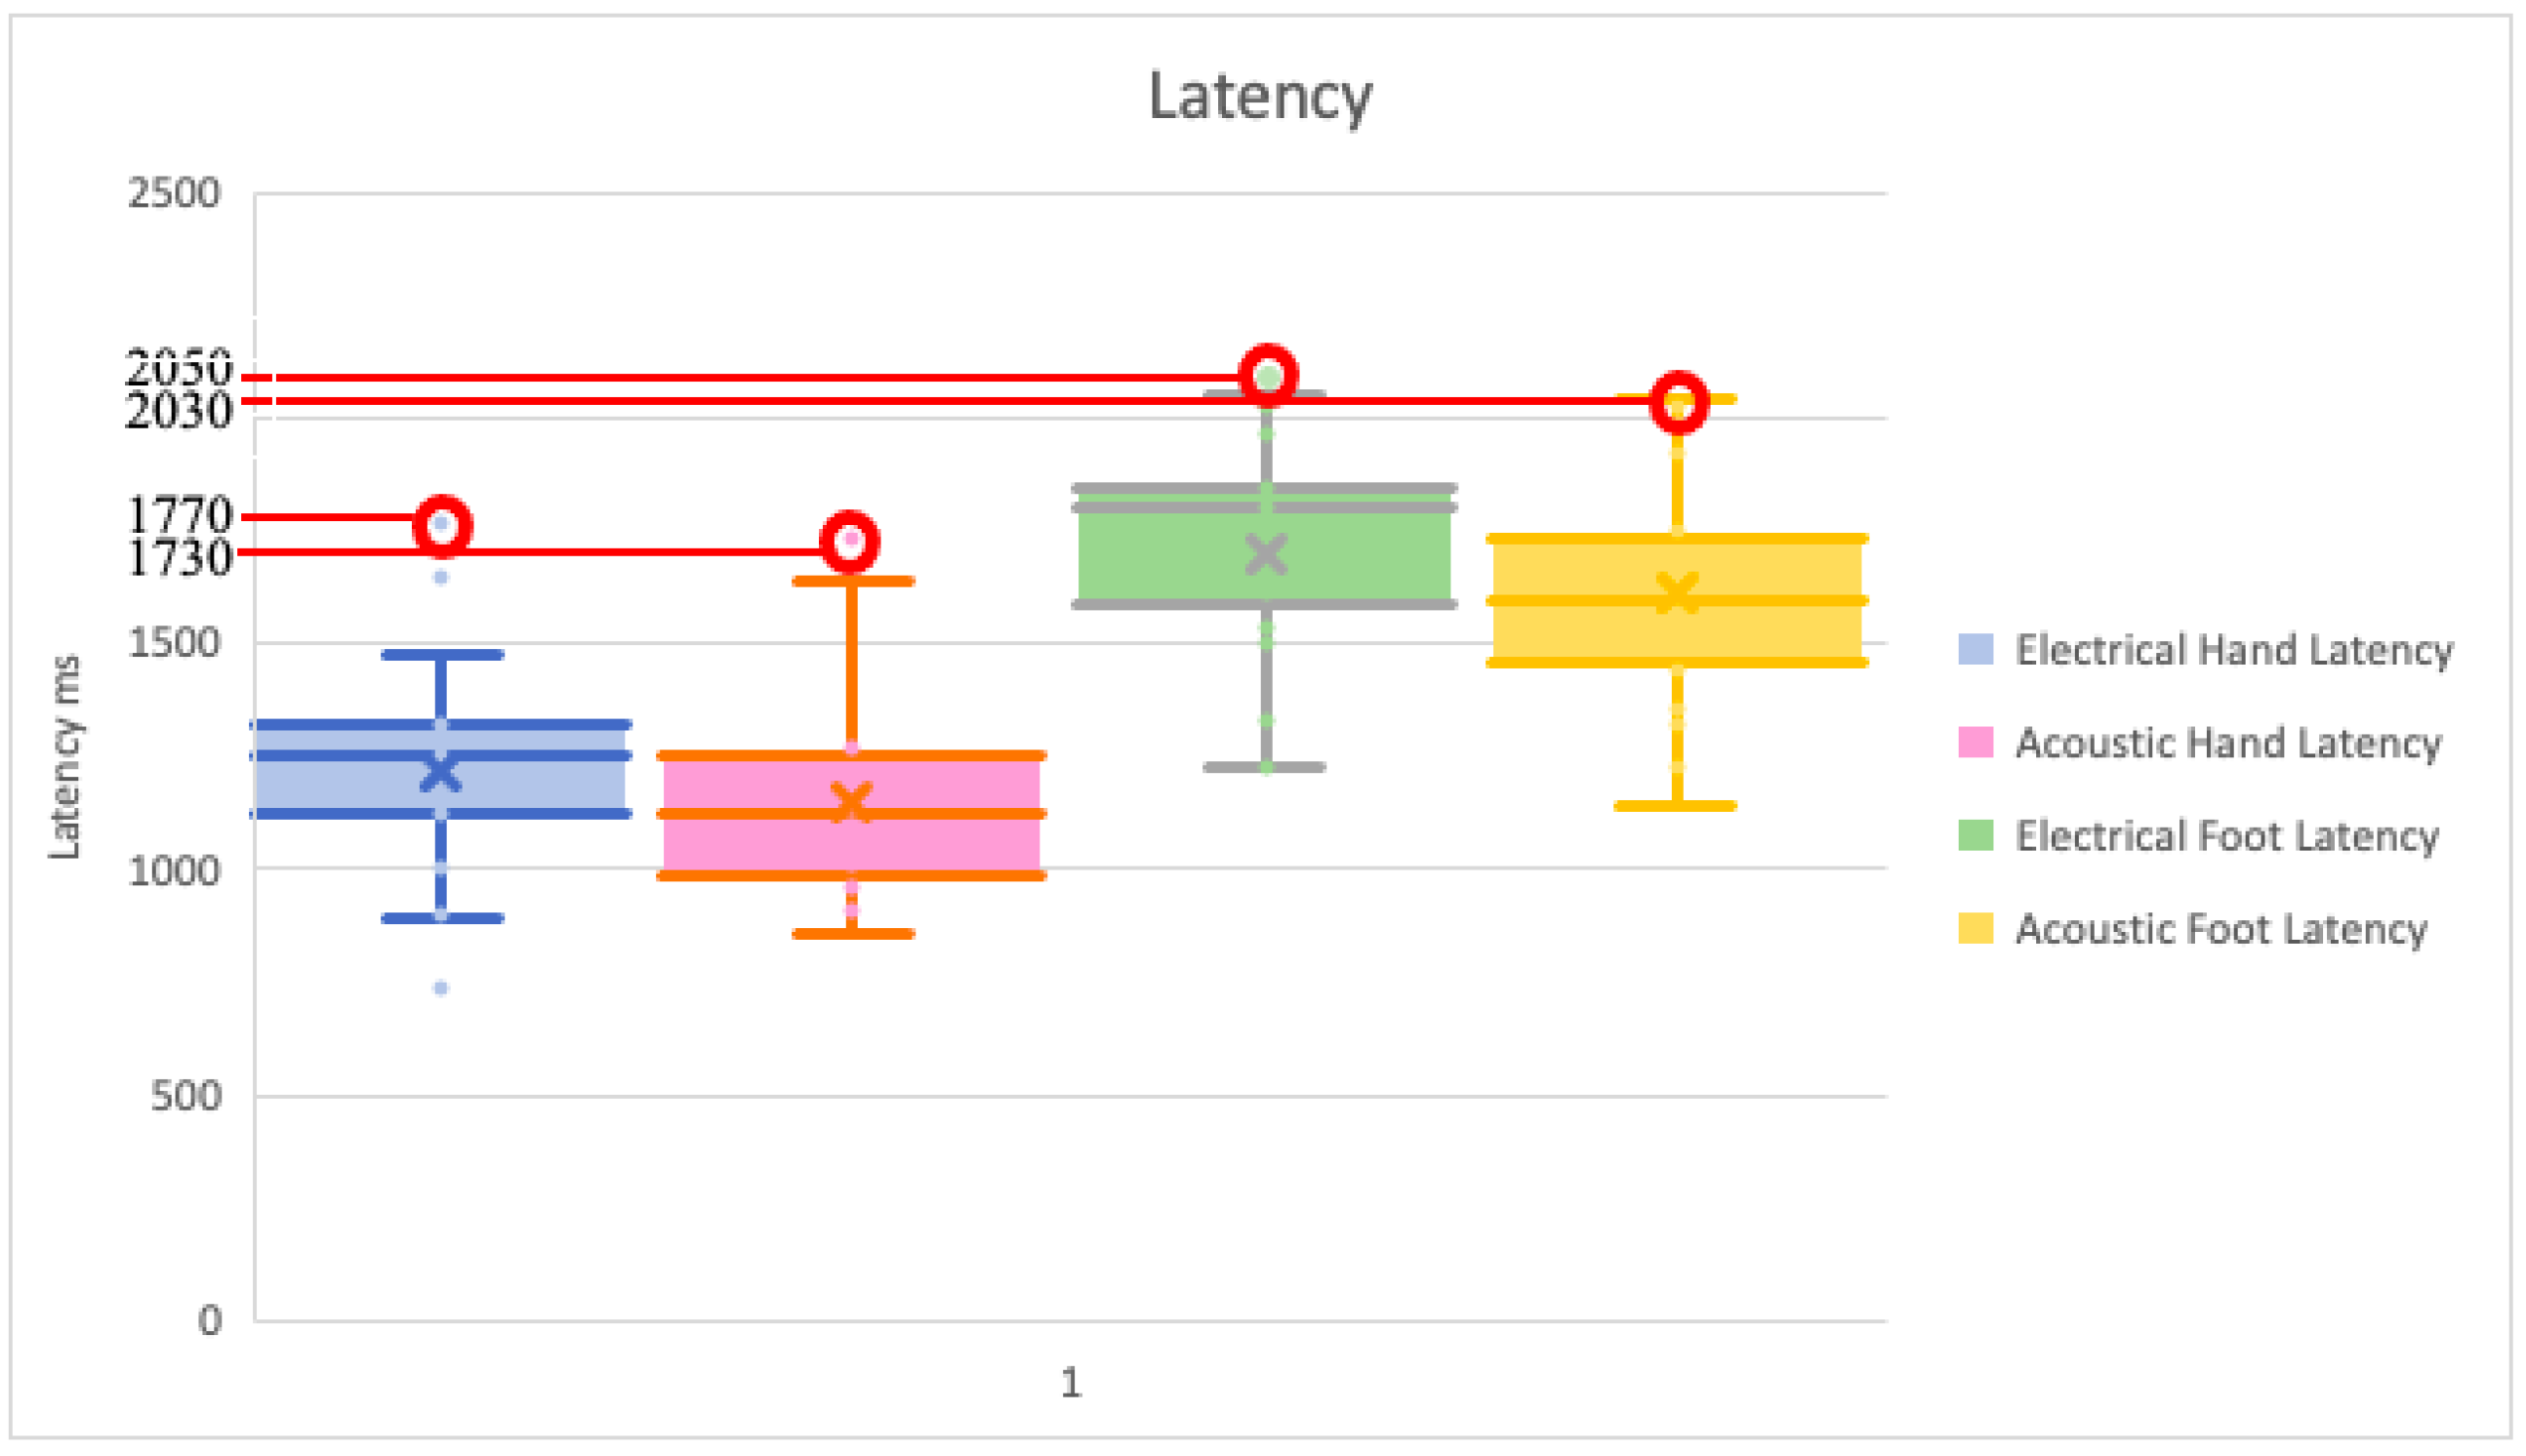
| Latency (ms) | Hand | Foot | ||||||
|---|---|---|---|---|---|---|---|---|
| Electrical Stimulus | Acoustical Stimulus | Electrical Stimulus | Acoustical Stimulus | |||||
| Left | Right | Left | Right | Left | Right | Left | Right | |
| Maximum | 1770 | 1650 | 1640 | 1730 | 2030 | 2050 | 2040 | 2030 |
| Minimum | 1130 | 740 | 970 | 970 | 1540 | 1330 | 1320 | 1230 |
| Mean | 1322.22 | 1226.36 | 1224.44 | 1177.27 | 1757.78 | 1740 | 1671.11 | 1630.91 |
| Median | 1280 | 1260 | 1200 | 1120 | 1800 | 1810 | 1660 | 1680 |
| Standard Deviation | 180.95 | 245 | 183.04 | 213.22 | 161.92 | 202.04 | 224.25 | 248.21 |
| Lower confidence value | 1130 | 740 | 970 | 970 | 1540 | 1330 | 1320 | 1230 |
| Upper confidence value | 1770 | 1650 | 1640 | 1730 | 2030 | 2050 | 2040 | 2030 |
Publisher’s Note: MDPI stays neutral with regard to jurisdictional claims in published maps and institutional affiliations. |
© 2021 by the authors. Licensee MDPI, Basel, Switzerland. This article is an open access article distributed under the terms and conditions of the Creative Commons Attribution (CC BY) license (https://creativecommons.org/licenses/by/4.0/).
Share and Cite
Cavaliere, S.; Bertini, G.; Cossu, C.; Bastianelli, M.; Gabbanini, S.; Mei, C.; Lori, S. Comparison of Sympathetic Skin Response (SSR) between Electrical and Acoustic Stimuli in a Healthy Pediatric Population. Pediatr. Rep. 2021, 13, 520-529. https://0-doi-org.brum.beds.ac.uk/10.3390/pediatric13030060
Cavaliere S, Bertini G, Cossu C, Bastianelli M, Gabbanini S, Mei C, Lori S. Comparison of Sympathetic Skin Response (SSR) between Electrical and Acoustic Stimuli in a Healthy Pediatric Population. Pediatric Reports. 2021; 13(3):520-529. https://0-doi-org.brum.beds.ac.uk/10.3390/pediatric13030060
Chicago/Turabian StyleCavaliere, Sara, Giovanna Bertini, Cesarina Cossu, Maria Bastianelli, Simonetta Gabbanini, Cristina Mei, and Silvia Lori. 2021. "Comparison of Sympathetic Skin Response (SSR) between Electrical and Acoustic Stimuli in a Healthy Pediatric Population" Pediatric Reports 13, no. 3: 520-529. https://0-doi-org.brum.beds.ac.uk/10.3390/pediatric13030060