Association of a Self-Paid Medically Supervised Weight Management Program with Reversal of Obesity-Associated Impaired Fasting Glucose


Abstract
:1. Introduction
2. Methods
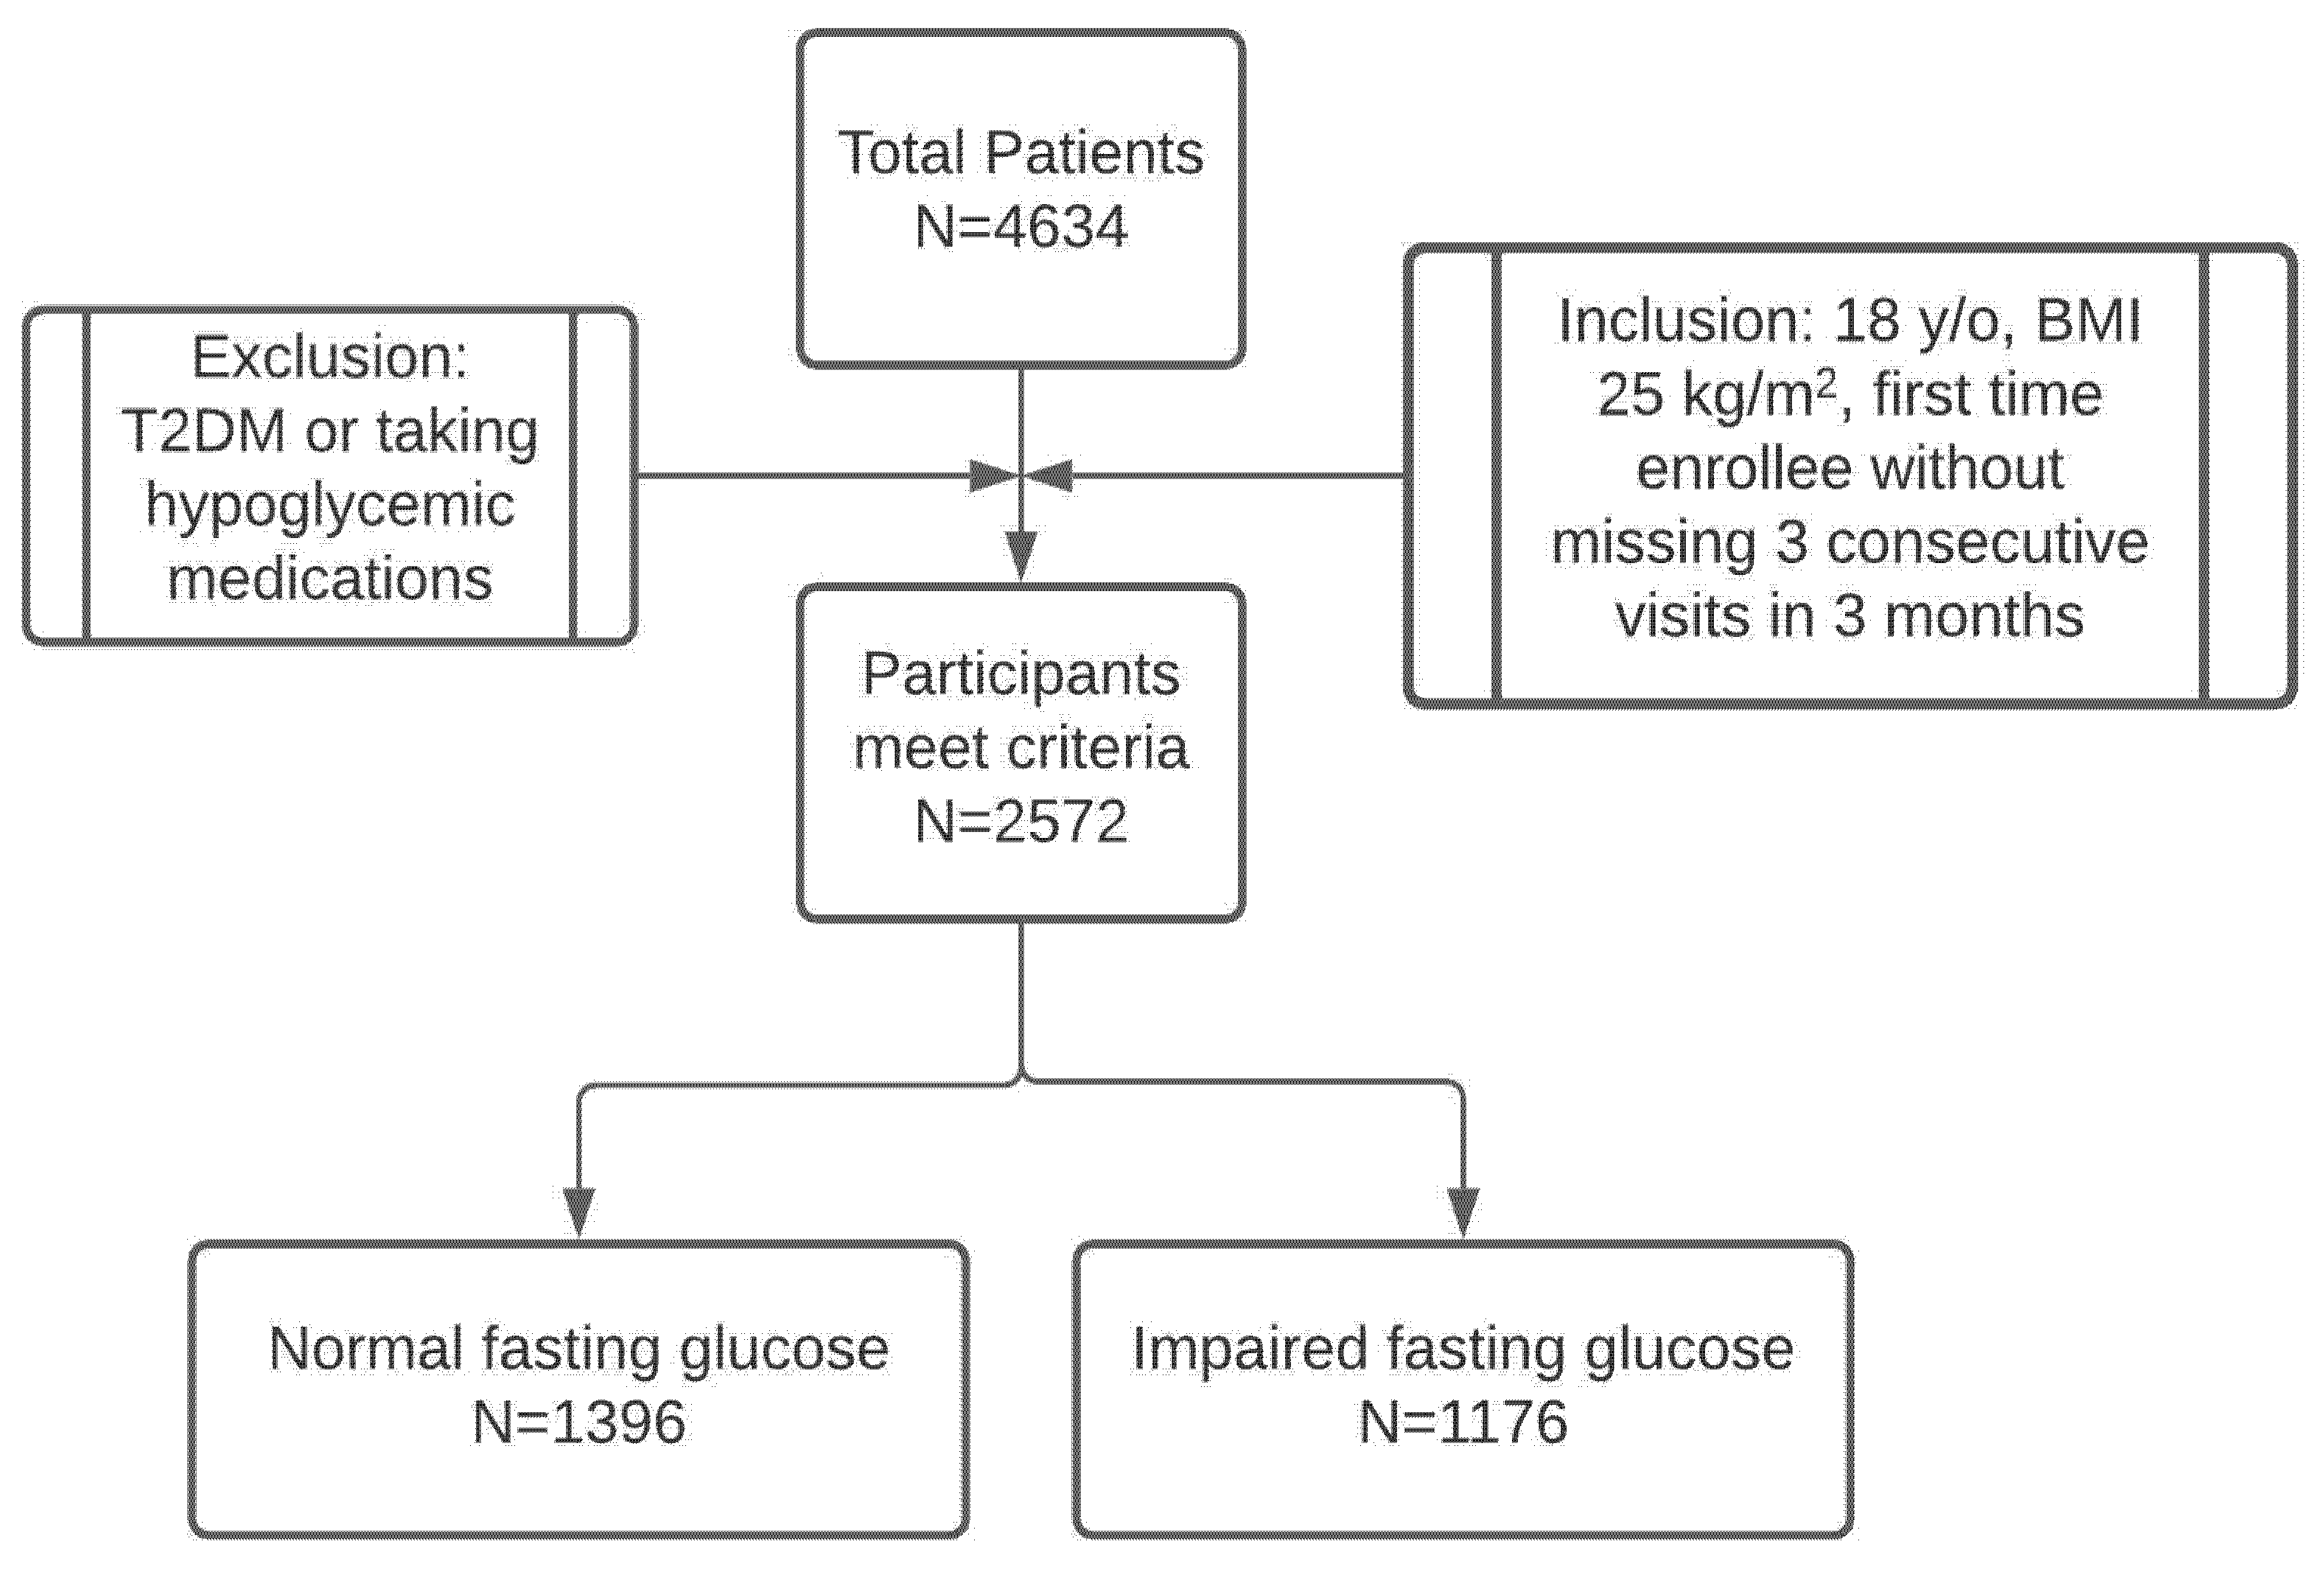
2.1. Subjects
2.2. Clinical Program
2.3. Outcome Measures
2.4. Statistical Analysis
3. Results
3.1. Patient Population
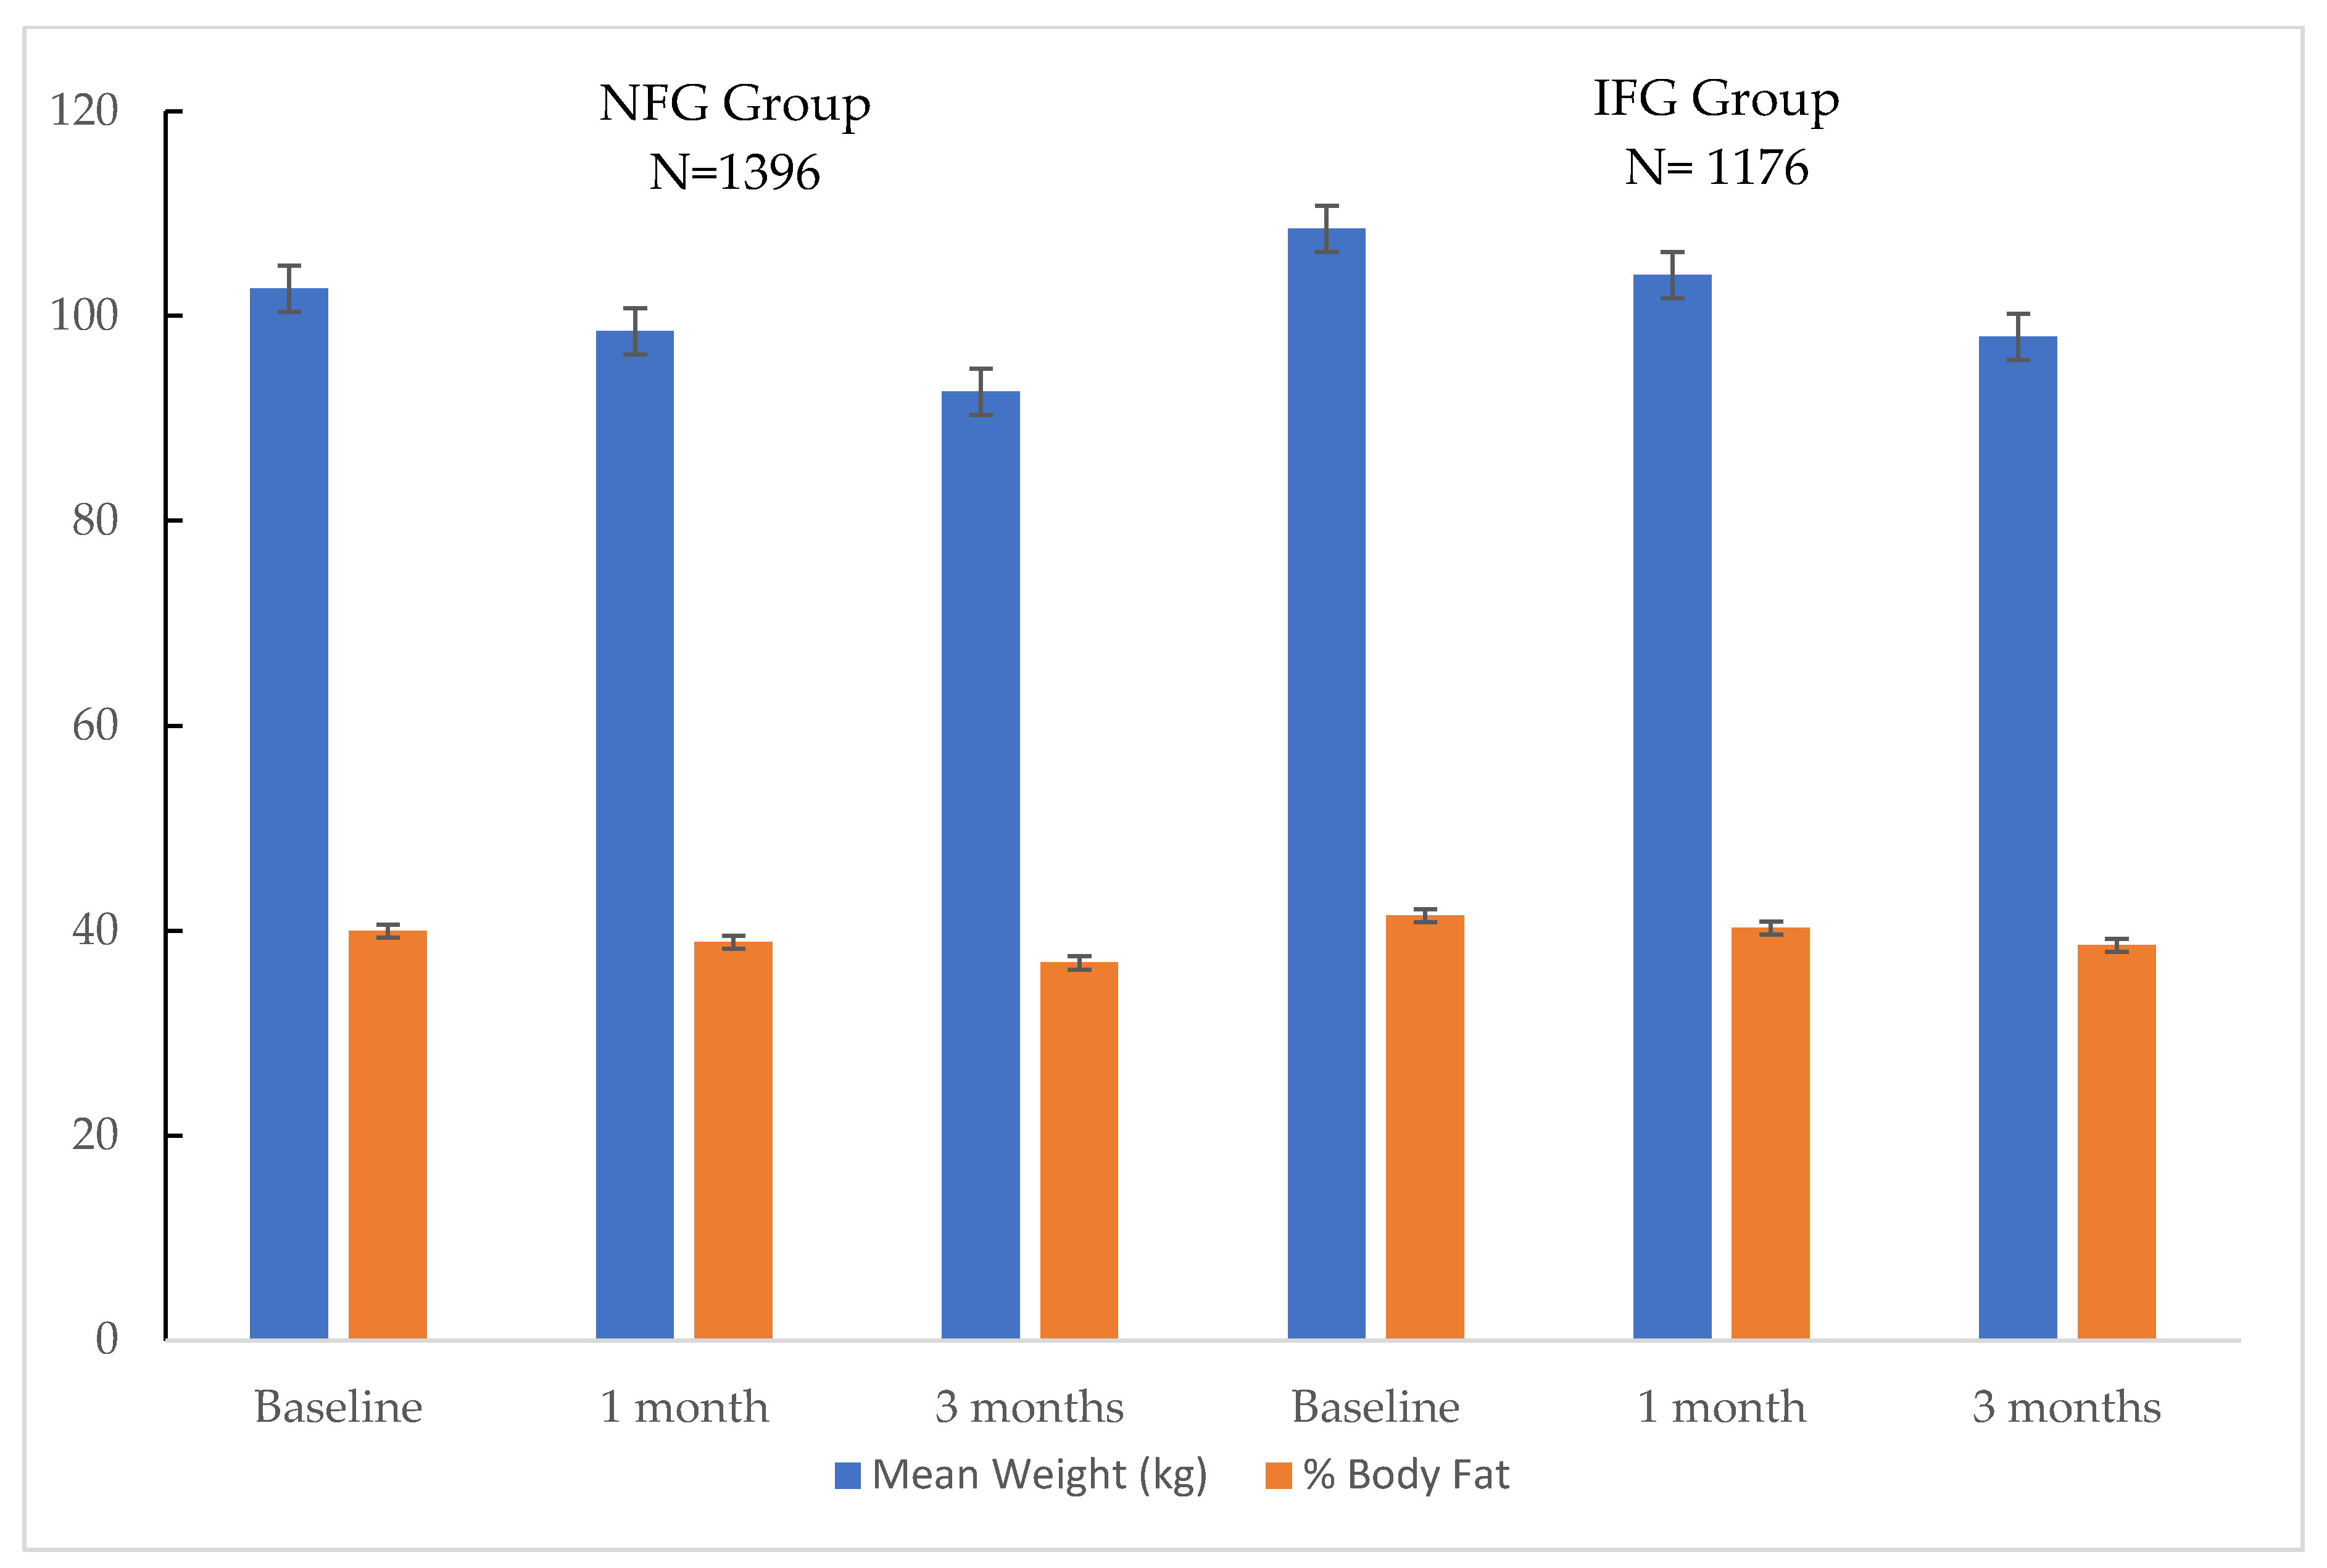
3.2. Body Weight and Body Composition
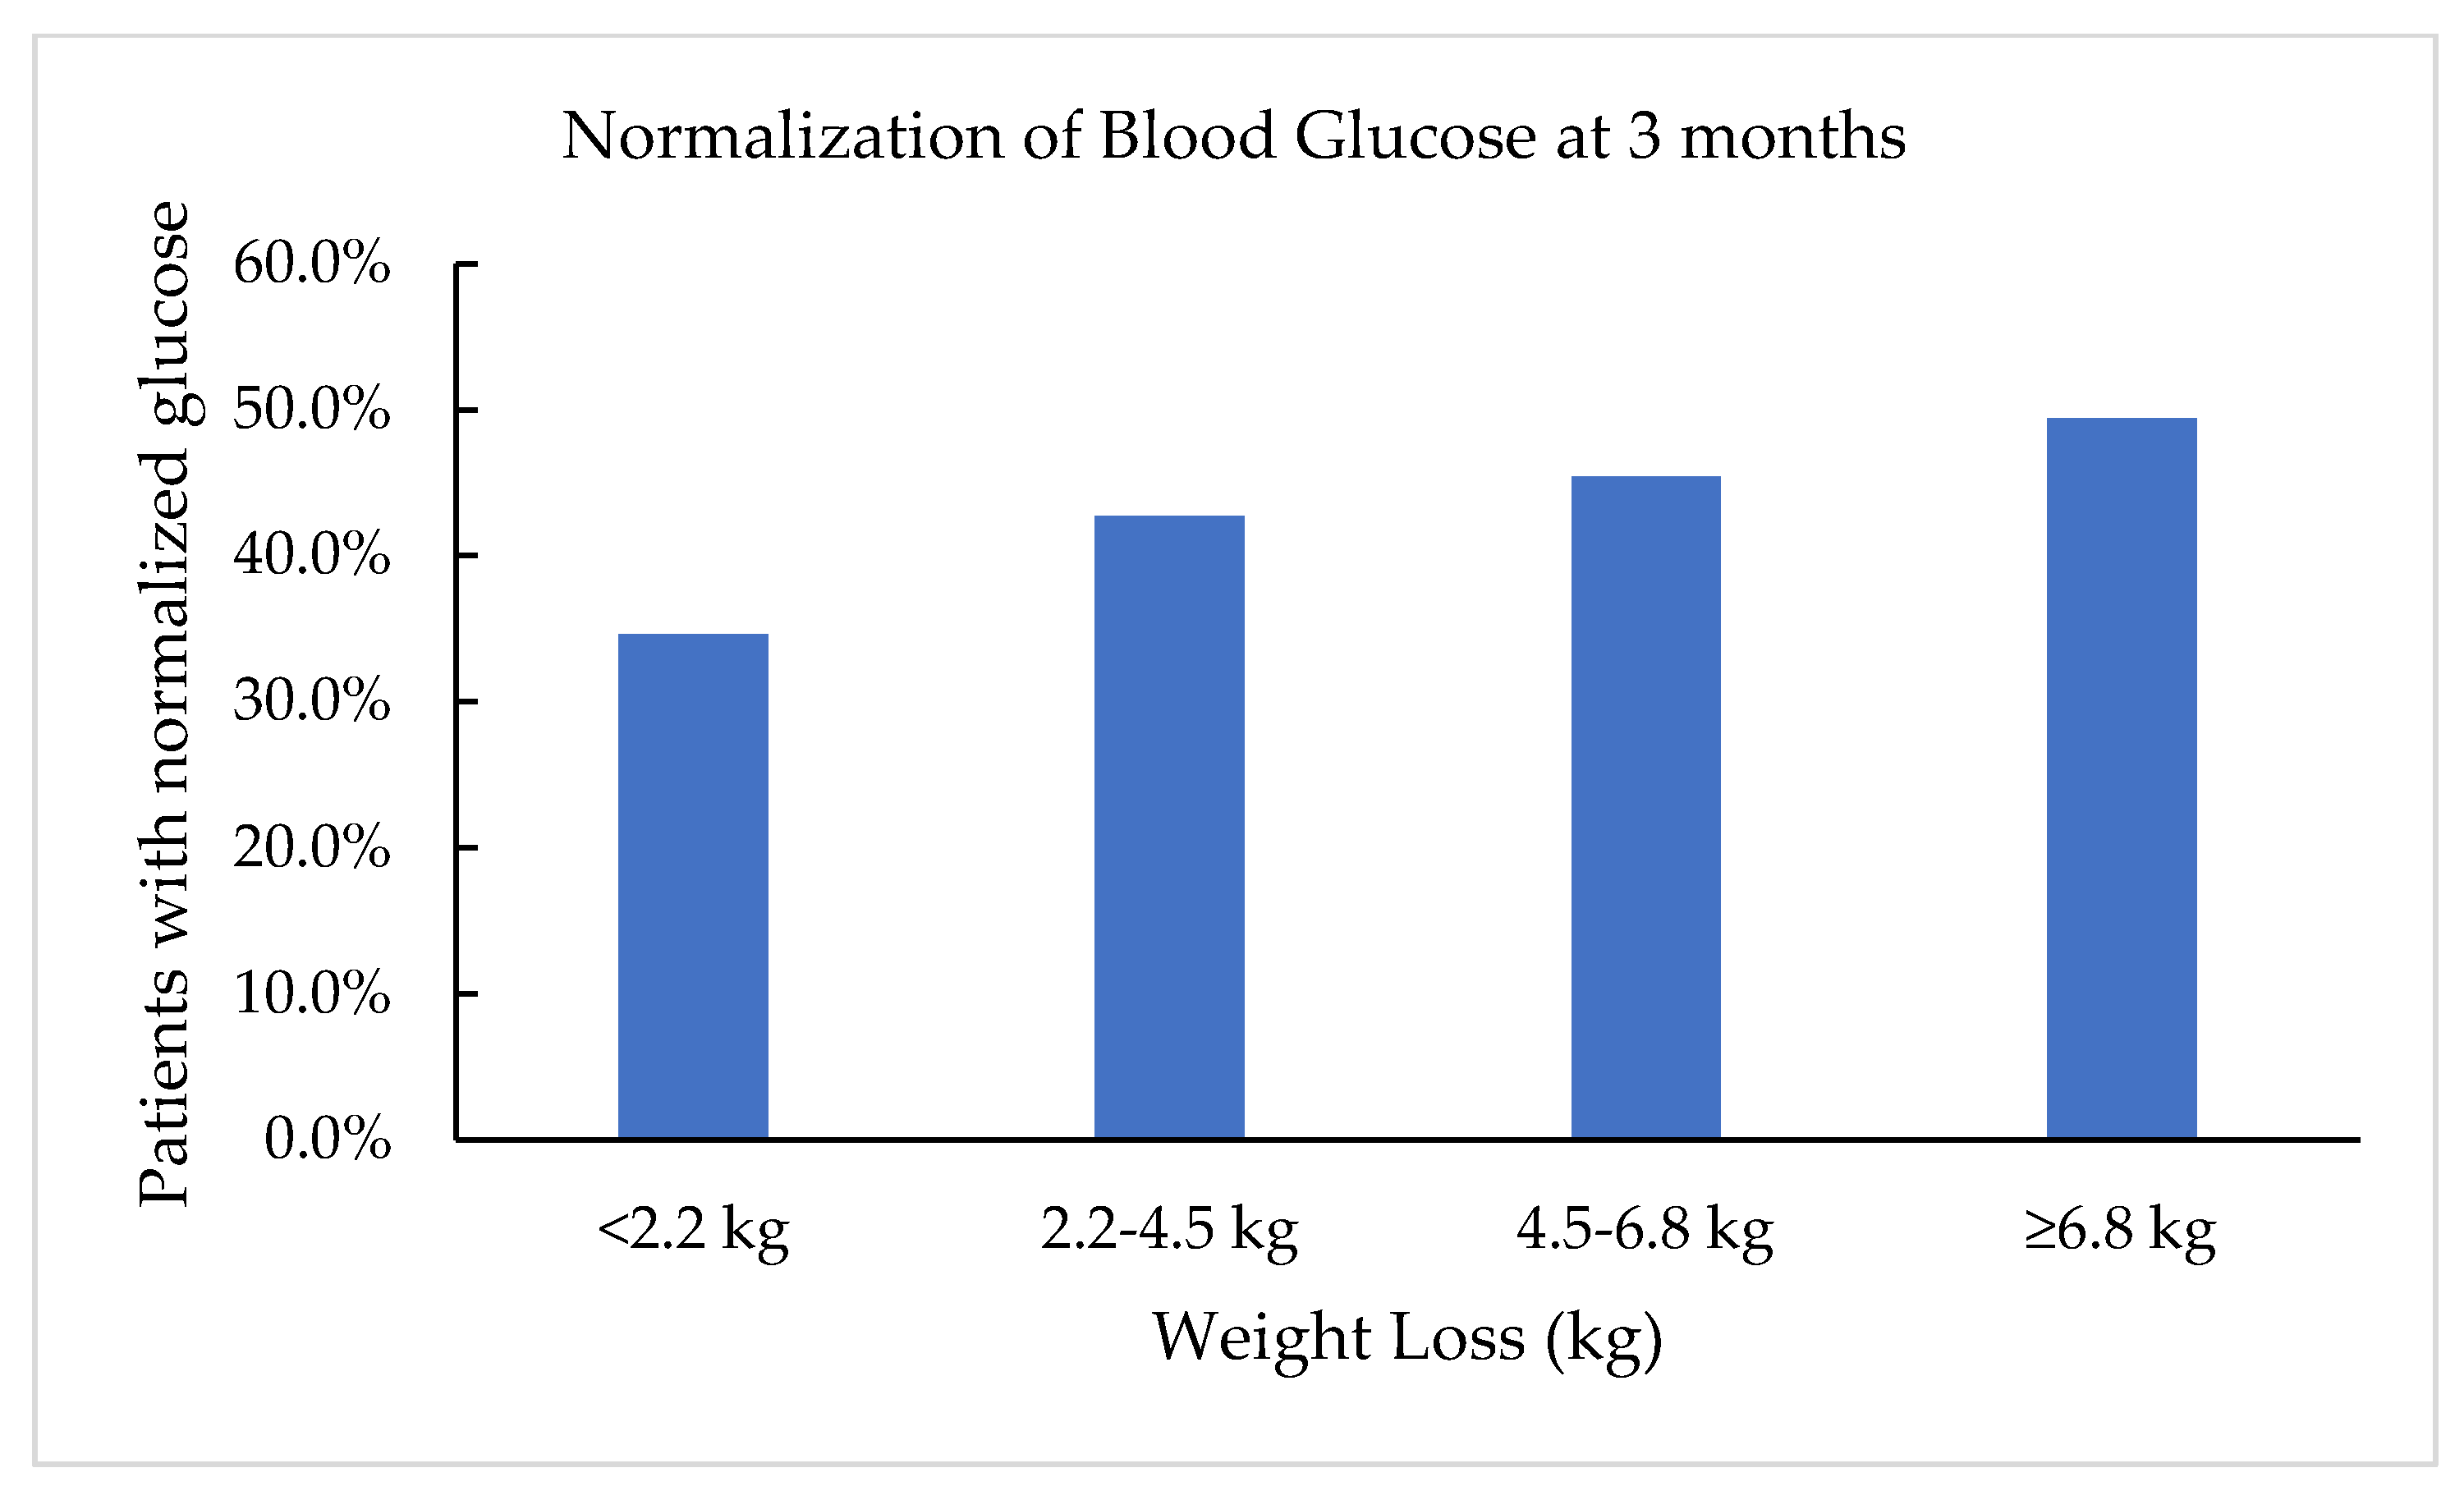
3.3. Fasting Blood Glucose
3.4. Lipids
3.5. Blood Pressure
4. Discussion
5. Conclusions
Author Contributions
Funding
Institutional Review Board Statement
Informed Consent Statement
Conflicts of Interest
Abbreviations
| BIA | bioimpedance analysis |
| BMI | body mass index |
| DPP | diabetes prevention program |
| HDL | high-density lipoproteins |
| IFG | impaired fasting glucose |
| LCD | low calorie diet |
| LDL | low-density lipoproteins |
| NFG | normal fasting glucose |
| VLCD | very low calorie diet |
| T2DM | type 2 Diabetes Mellitus |
References
- Centers for Disease Control and Prevention. National Diabetes Statistics Report: Estimates of Diabetes and Its Burden in the United States; U.S. Department of Health and Human Services CfDCaP: Atlanta, GA, USA, 2020.
- Gerstein, H.C.; Santaguida, P.; Raina, P.; Morrison, K.M.; Balion, C.; Hunt, D.; Yazdi, H.; Booker, L. Annual incidence and relative risk of diabetes in people with various categories of dysglycemia: A systematic overview and meta-analysis of prospective studies. Diabetes Res. Clin. Pract. 2007, 78, 305–312. [Google Scholar] [CrossRef]
- Buysschaert, M.; Medina, J.L.; Bergman, M.; Shah, A.; Lonier, J. Prediabetes and associated disorders. Endocrine 2014, 48, 371–393. [Google Scholar] [CrossRef]
- Wilson, M.L. Prediabetes: Beyond the Borderline. Nurs. Clin. N. Am. 2017, 52, 665–677. [Google Scholar] [CrossRef] [PubMed]
- Ford, E.S.; Zhao, G.; Li, C. Pre-Diabetes and the Risk for Cardiovascular Disease. J. Am. Coll. Cardiol. 2010, 55, 1310–1317. [Google Scholar] [CrossRef] [Green Version]
- Ogata, S.; Watanabe, M.; Kokubo, Y.; Higashiyama, A.; Nakao, Y.M.; Takegami, M.; Nishimura, K.; Nakai, M.; Kiyoshige, E.; Hosoda, K.; et al. Longitudinal Trajectories of Fasting Plasma Glucose and Risks of Cardiovascular Diseases in Middle Age to Elderly People Within the General Japanese Population: The Suita Study. J. Am. Heart Assoc. 2019, 8, e010628. [Google Scholar] [CrossRef] [PubMed] [Green Version]
- Dybjer, E.; Nilsson, P.M.; Engström, G.; Helmer, C.; Nägga, K. Pre-diabetes and diabetes are independently associated with adverse cognitive test results: A cross-sectional, population-based study. BMC Endocr. Disord. 2018, 18, 91. [Google Scholar] [CrossRef] [PubMed] [Green Version]
- Rosenzweig, J.L.; Bakris, G.L.; Berglund, L.F.; Hivert, M.-F.; Horton, E.S.; Kalyani, R.R.; Murad, M.H.; Vergès, B.L. Primary Prevention of ASCVD and T2DM in Patients at Metabolic Risk: An Endocrine Society* Clinical Practice Guideline. J. Clin. Endocrinol. Metab. 2019, 104, 3939–3985. [Google Scholar] [CrossRef] [Green Version]
- Diabetes Prevention Program Research Group. 10-year follow-up of diabetes incidence and weight loss in the Diabetes Prevention Program Outcomes Study. Lancet 2009, 374, 1677–1686. [Google Scholar] [CrossRef] [Green Version]
- Unick, J.L.; Beavers, D.; Jakicic, J.M.; Kitabchi, A.E.; Knowler, W.C.; Wadden, T.A.; Wing, R.R. Effectiveness of Lifestyle Interventions for Individuals With Severe Obesity and Type 2 Diabetes: Results from the Look AHEAD trial. Diabetes Care 2011, 34, 2152–2157. [Google Scholar] [CrossRef] [Green Version]
- Gong, Q.; Zhang, P.; Wang, J.; Ma, J.; An, Y.; Chen, Y.; Zhang, B.; Feng, X.; Li, H.; Chen, X.; et al. Morbidity and mortality after lifestyle intervention for people with impaired glucose tolerance: 30-year results of the Da Qing Diabetes Prevention Outcome Study. Lancet Diabetes Endocrinol. 2019, 7, 452–461. [Google Scholar] [CrossRef]
- Crandall, J.P.; Knowler, W.C.; Kahn, S.E.; Marrero, D.; Florez, J.C.; Bray, G.A.; Haffner, S.M.; Hoskin, M.; Nathan, D.M. The prevention of type 2 diabetes. Nat. Clin. Pract. Endocrinol. Metab. 2008, 4, 382–393. [Google Scholar] [CrossRef]
- Campbell, M.D.; Sathish, T.; Zimmet, P.Z.; Thankappan, K.R.; Oldenburg, B.; Owens, D.R.; Shaw, J.E.; Tapp, R.J. Benefit of lifestyle-based T2DM prevention is influenced by prediabetes phenotype. Nat. Rev. Endocrinol. 2020, 16, 395–400. [Google Scholar] [CrossRef]
- Tomah, S.; Mahmoud, N.; Mottalib, A.; Pober, D.M.; Tasabehji, M.W.; Ashrafzadeh, S.; Hamdy, O. Frequency of self-monitoring of blood glucose in relation to weight loss and A1C during intensive multidisciplinary weight management in patients with type 2 diabetes and obesity. BMJ Open Diabetes Res. Care 2019, 7, e000659. [Google Scholar] [CrossRef] [Green Version]
- American Diabetes Association. Economic Costs of Diabetes in the U.S. in 2017. Diabetes Care 2018, 41, 917–928. [Google Scholar] [CrossRef] [PubMed] [Green Version]
- Khademi, A.; Shi, L.; Nasrollahzadeh, A.A.; Narayanan, H.; Chen, L. Comparing the Lifestyle Interventions for Prediabetes: An Integrated Microsimulation and Population Simulation Model. Sci. Rep. 2019, 9, 1–8. [Google Scholar] [CrossRef] [PubMed]
- Rees, S.; Williams, A. Promoting and supporting self-care management for adults living in the community with physical chronic illness: The effectiveness and meaningfulness of the patient-practitioner encounter. JBI Evid. Synth. 2008, 6 (Suppl. 4), 1–12. [Google Scholar]
- Association, A.M. Obesity is a Disease. In Proceedings of the American Medical Association Annual Meeting, Chicago, IL, USA, 15–19 June 2013. [Google Scholar]
- Hu, F.B. Globalization of Diabetes: The role of diet, lifestyle, and genes. Diabetes Care 2011, 34, 1249–1257. [Google Scholar] [CrossRef] [Green Version]
- Li, Z.; Tseng, C.-H.; Li, Q.; Deng, M.L.; Wang, M.; Heber, D. Clinical efficacy of a medically supervised outpatient high-protein, low-calorie diet program is equivalent in prediabetic, diabetic and normoglycemic obese patients. Nutr. Diabetes 2014, 4, e105. [Google Scholar] [CrossRef] [PubMed] [Green Version]
- Cicero, A.F.G.; Benelli, M.; Brancaleoni, M.; Dainelli, G.; Merlini, D.; Negri, R. Middle and Long-Term Impact of a Very Low-Carbohydrate Ketogenic Diet on Cardiometabolic Factors: A Multi-Center, Cross-Sectional, Clinical Study. High Blood Press. Cardiovasc. Prev. 2015, 22, 389–394. [Google Scholar] [CrossRef] [PubMed] [Green Version]
- Chaudhry, Z.W.; Doshi, R.S.; Mehta, A.K.; Jacobs, D.K.; Vakil, R.M.; Lee, C.J.; Bleich, S.N.; Kalyani, R.R.; Clark, J.M.; Gudzune, K.A. A systematic review of commercial weight loss programmes’ effect on glycemic outcomes among overweight and obese adults with and without type 2 diabetes mellitus. Obes. Rev. 2016, 17, 758–769. [Google Scholar] [CrossRef] [Green Version]
- Centers for Disease Control and Prevention. National Diabetes Statistics Report: Estimates of Diabetes and Its Burden in the United States, 2014; U.S. Department of Health and Human Services: Atlanta, GA, USA, 2014.
- Mokdad, A.H.; Ford, E.S.; Bowman, B.A.; Dietz, W.H.; Vinicor, F.; Bales, V.S.; Marks, J.S. Prevalence of Obesity, Diabetes, and Obesity-Related Health Risk Factors, 2001. JAMA 2003, 289, 76–79. [Google Scholar] [CrossRef] [PubMed]
- Finkelstein, E.A.; Trogdon, J.G.; Cohen, J.W.; Dietz, W. Annual Medical Spending Attributable To Obesity: Payer-And Service-Specific Estimates. Health Aff. 2009, 28, w822–w831. [Google Scholar] [CrossRef] [Green Version]
- Reduction in the Incidence of Type 2 Diabetes with Lifestyle Intervention or Metformin. N. Engl. J. Med. 2002, 346, 393–403. [CrossRef] [PubMed]
- Gudzune, K.A.; Doshi, R.S.; Mehta, A.K.; Chaudhry, Z.W.; Jacobs, D.K.; Vakil, R.M.; Lee, C.; Bleich, S.N.; Clark, J.M. Efficacy of Commercial Weight-Loss Programs. Ann. Intern. Med. 2015, 162, 501–512. [Google Scholar] [CrossRef] [PubMed] [Green Version]


| Normal Fasting Glucose (<100 mg/dL) | Impaired Fasting Glucose (100–126 mg/dL) | t-Test p-Value | |
|---|---|---|---|
| Patient number | 1396 | 1176 | – |
| Variables | Median (IQR) | Median (IQR) | – |
| Age (years) | 55.7 (45.4, 64.4) | 61.1 (51.8, 68.5) | <0.001 |
| Weight (kg) | 99.6 (85.4, 118) | 105.8 (90.1, 126.7) | <0.001 |
| BMI (kg/m2) | 35.2 (31.1, 40.7) | 37.2 (32.7, 43.0) | <0.001 |
| Gender: Male | 310 (22.2%) | 316 (26.9%) | 0.007 |
| Variable | Normal Fasting Glucose | Impaired Fasting Glucose | ||||
|---|---|---|---|---|---|---|
| Baseline | 3 Months | p-Value (Compared to Baseline) | Baseline | 3 Months | p-Value (Compared to Baseline) | |
| Subjects (N) | 1396 | 843 | – | 1176 | 755 | – |
| SBP (mmHg) | 123.8 ± 11.6 | 118.9 ± 11.7 | <0.001 | 127.2 ± 12.2 | 121.3 ± 11.3 | <0.001 |
| DBP (mmHg) | 79.5 ± 7.2 | 75.5 ± 6.9 | <0.001 | 81.9 ± 7.4 | 77.3 ± 6.9 | <0.001 |
| Glucose (mg/dL) | 89.77 ± 6.61 | 91.12 ± 8.50 | 0.15 | 107.49 ± 6.40 | 101.29 ± 9.41 | <0.001 |
| LDL (mg/dL) | 180.13 ± 37.85 | 167.86 ± 33.20 | <0.001 | 179.97 ± 41.20 | 169.68 ± 36.76 | <0.001 |
| Triglycerides (mg/dL) | 138.50 ± 84.06 | 104.28 ± 57.26 | <0.001 | 161.63 ± 84.36 | 119.27 ± 58.83 | <0.001 |
| HDL (mg/dL) | 60.31 ± 16.25 | 56.21 ± 14.60 | <0.001 | 56.95 ± 13.52 | 53.32 ± 12.30 | <0.001 |
Publisher’s Note: MDPI stays neutral with regard to jurisdictional claims in published maps and institutional affiliations. |
© 2021 by the authors. Licensee MDPI, Basel, Switzerland. This article is an open access article distributed under the terms and conditions of the Creative Commons Attribution (CC BY) license (https://creativecommons.org/licenses/by/4.0/).
Share and Cite
Surampudi, V.; Zhou, X.; Tseng, C.-H.; Heber, D.; Li, Z. Association of a Self-Paid Medically Supervised Weight Management Program with Reversal of Obesity-Associated Impaired Fasting Glucose. Clin. Pract. 2021, 11, 386-394. https://0-doi-org.brum.beds.ac.uk/10.3390/clinpract11020053
Surampudi V, Zhou X, Tseng C-H, Heber D, Li Z. Association of a Self-Paid Medically Supervised Weight Management Program with Reversal of Obesity-Associated Impaired Fasting Glucose. Clinics and Practice. 2021; 11(2):386-394. https://0-doi-org.brum.beds.ac.uk/10.3390/clinpract11020053
Chicago/Turabian StyleSurampudi, Vijaya, Xinkai Zhou, Chi-Hong Tseng, David Heber, and Zhaoping Li. 2021. "Association of a Self-Paid Medically Supervised Weight Management Program with Reversal of Obesity-Associated Impaired Fasting Glucose" Clinics and Practice 11, no. 2: 386-394. https://0-doi-org.brum.beds.ac.uk/10.3390/clinpract11020053