Article

Correlation of Medical Comorbidities and Upper Airway Measurements among Dental Patients at Risk of Developing Obstructive Sleep Apnea

School of Dentistry, International Medical University, Bukit Jalil, Kuala Lumpur 57000, Malaysia
*
Author to whom correspondence should be addressed.
Submission received: 23 March 2022 / Revised: 7 April 2022 / Accepted: 12 April 2022 / Published: 6 May 2022

Abstract

:
Obstructive Sleep Apnea (OSA) is a partial or total upper airway collapse resulting in sleep-breathing disturbances. There are many medical comorbidities associated with OSA; hence, this study is important as the prevalence of patients with medical comorbidities associated with OSA is increasing. The study aimed to correlate medical comorbidities and OSA symptoms of the patients along with their upper airway dimensions using Cone Beam Computed Tomography (CBCT) scans to identify patients at risk of developing OSA. This cross-sectional study included patients who had CBCT imaging taken between 2014 and 2020. A questionnaire was used to gather information on patients’ medical history and OSA symptoms. The upper airway dimensions of the CBCT scans were evaluated before logistic regression and Fisher’s exact test were carried out to determine the relationships between the variables. p ≤ 0.05 was considered statistically significant. Logistic regression revealed an association of longer length (p = 0.016), smaller total volume (p = 0.017) and width (p = 0.010) of upper airways with hypertension. Furthermore, loud snoring was seen in patients with hypertension, heart disease and obesity whereas difficulty concentrating during the day was present in subjects with deviated nasal septum, tonsillitis and depression. For upper airway dimensions, a smaller average volume was associated with loud snoring (p = 0.037), difficulty concentrating during the day (p = 0.002) and mood changes (p = 0.036). A larger anterior-posterior dimension was also associated with excessive daytime sleepiness (p = 0.042), difficulty concentrating during the day (p < 0.001) and mood changes (p = 0.009). Longer airway length was additionally found to be associated with loud snoring (p = 0.021). CBCT taken for dental investigations could be correlated with patients’ medical history and OSA symptoms to screen patients at risk of OSA.

1. Introduction

Obstructive Sleep Apnea (OSA) is a medical condition of increasing prevalence where there is partial or complete collapse of the airway which transports oxygen to our body [1,2]. This condition, which obstructs the upper airway, can cause a decrease in oxygen saturation in our body and may even cause abrupt arousals during sleep [3]. This may also lead to loud snoring or even cause breathing to stop momentarily [1]. According to the University of Toronto, more than 80% of OSA patients remain undiagnosed due to the lack of awareness of this condition [4].
There are many causes that can be associated with the occurrence of Obstructive Sleep Apnea. According to a literature review, the main cause of this condition is the weakening of the genioglossal muscle, leading to a reduction in the pharyngeal dilator muscles which expand the pharynx [5]. Other causes of this condition include additional tissues of the soft palate, hypertrophy of the tonsils or even an abnormal shape and size of the tongue. Macroglossia has been found to be one of the many causes of developing OSA [5]. In addition, patients who have certain skeletal abnormalities or changes in the soft tissue structures of the neck, most commonly found in obese patients, who also have increased amount of adipose tissue around the neck, may have an altered anatomy of the upper airway, predisposing them to OSA [5,6]. Other risk factors of OSA are the male gender, frequent use of alcohol, smoking and habitual snoring [1,7].
Patients who have OSA may complain of excessive sleepiness during the day, unrefreshing sleep, daytime fatigue and a lowered concentration span [3]. These can lead to behavioural irritability and may affect their memory. Night-time symptoms can include loud snoring, sudden awakening due to lack of oxygen and waking up with symptoms of dry mouth. Motor vehicle-related accidents have been reported by some due to the extreme drowsiness felt [3]. In addition to this, there are also many long-term effects which can affect individuals with OSA, such as increased heart rate, chronic increase in blood pressure, increased risk of heart-related diseases and stroke, decreased glucose tolerance and impaired insulin resistance [8].
Furthermore, OSA has also been found to be associated with other medical comorbidities such as cardiovascular and metabolic diseases [9]. Many studies have found strong evidence indicating the relationship between OSA and hypertension. Researchers believe this may be due to constant sleep disturbance and intermittent drops in oxygen levels, leading to chronic systemic hypertension or even arrhythmias, which may result in higher morbidity and mortality rates in these patients [4,7]. In addition, untreated OSA in diabetic patients may increase risk of neuropathy, diabetic retinopathy and diabetic nephropathy [9]. Incidence of Gastroesophageal Reflux Disease (GERD) was also found to be significantly elevated in patients with OSA. OSA has also been found to be associated with other conditions, such as COPD and asthma, which may cause reduction in overall quality of life [8].
As mentioned previously, OSA may become a dangerous condition if not diagnosed and managed in the early stages. Therefore, it is necessary to attempt to diagnose all patients with OSA to provide early intervention [4]. Dental professionals play an important role in being one of the first individuals in identifying patients with OSA [10]. A routine dental examination of patients may reveal risk factors for developing OSA and smaller upper airway dimensions on CT scans can guide provisional diagnosis for earlier referral. A simple screening tool can then be used to determine whether the patient is in fact at risk of OSA before further medical intervention can be carried out [10]. As this condition is becoming more prevalent, there may be many patients with undiagnosed OSA going to a dental clinic for regular dental treatment [11]. Therefore, it is advised that all dental healthcare professionals be educated and trained appropriately [12].
This study aims to evaluate the association between patients’ medical comorbidities, OSA symptoms and CBCT findings of upper airway dimensions among patients at risk of OSA. This study proves to be important as there is an increasing prevalence of patients with medical comorbidities associated with OSA [7].

2. Materials and Methods

Ethical approval was obtained from the IMU Research Review Committee prior to the commencement of this research. This cross-sectional study was carried out to evaluate the association between Cone Beam Computed Tomography (CBCT) findings of the upper airway dimensions and medical comorbidities among patients suspected with OSA. This study was carried out based on interpretation of patient’s CBCT scans from May 2014 to January 2020 in the Oral Health Centre of International Medical University (OHC, IMU). Inclusion criteria for this study were patients aged 18 years and above who have undergone CBCT scans for any past dental treatment in the Oral Health Centre (OHC, IMU). The size of the field of view of the CBCTs included in this study involved the nasopharynx and oropharynx region with proper tongue positioning. Exclusion criteria were edentulous patients, improper CBCT imaging displaying a posterior positioning of the tongue which may affect measurements and significant mandibular retrognathia or prognathia.
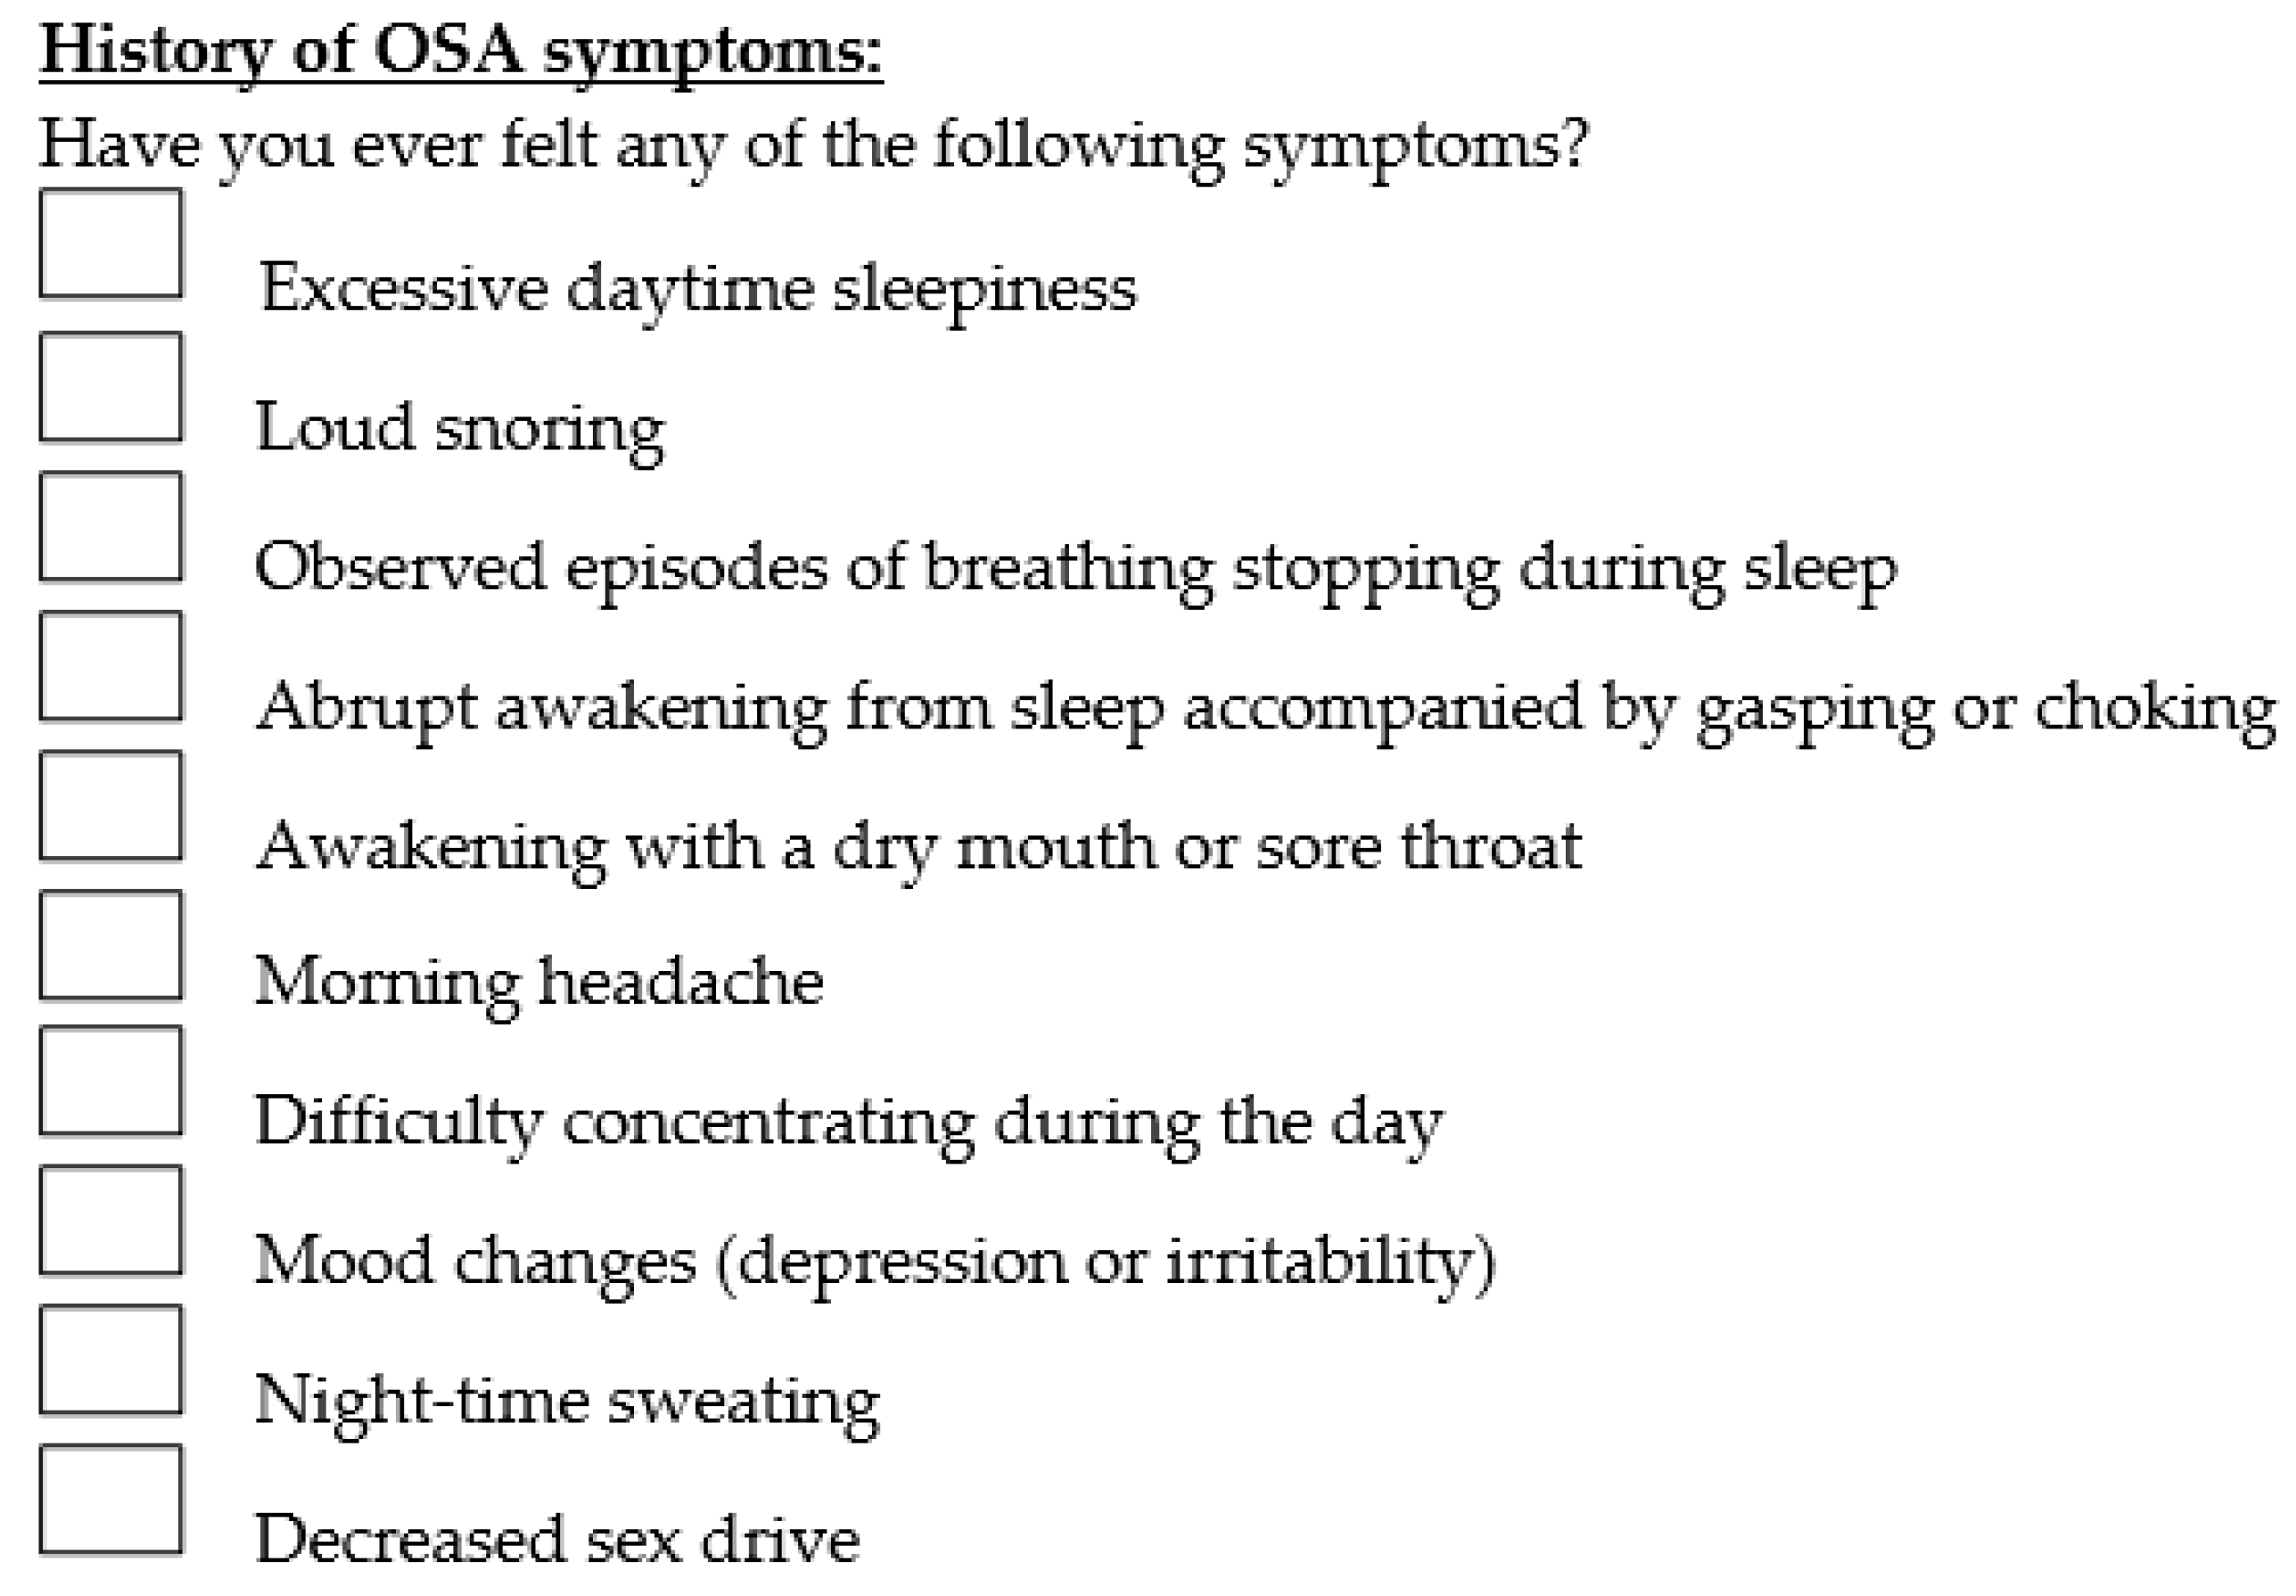
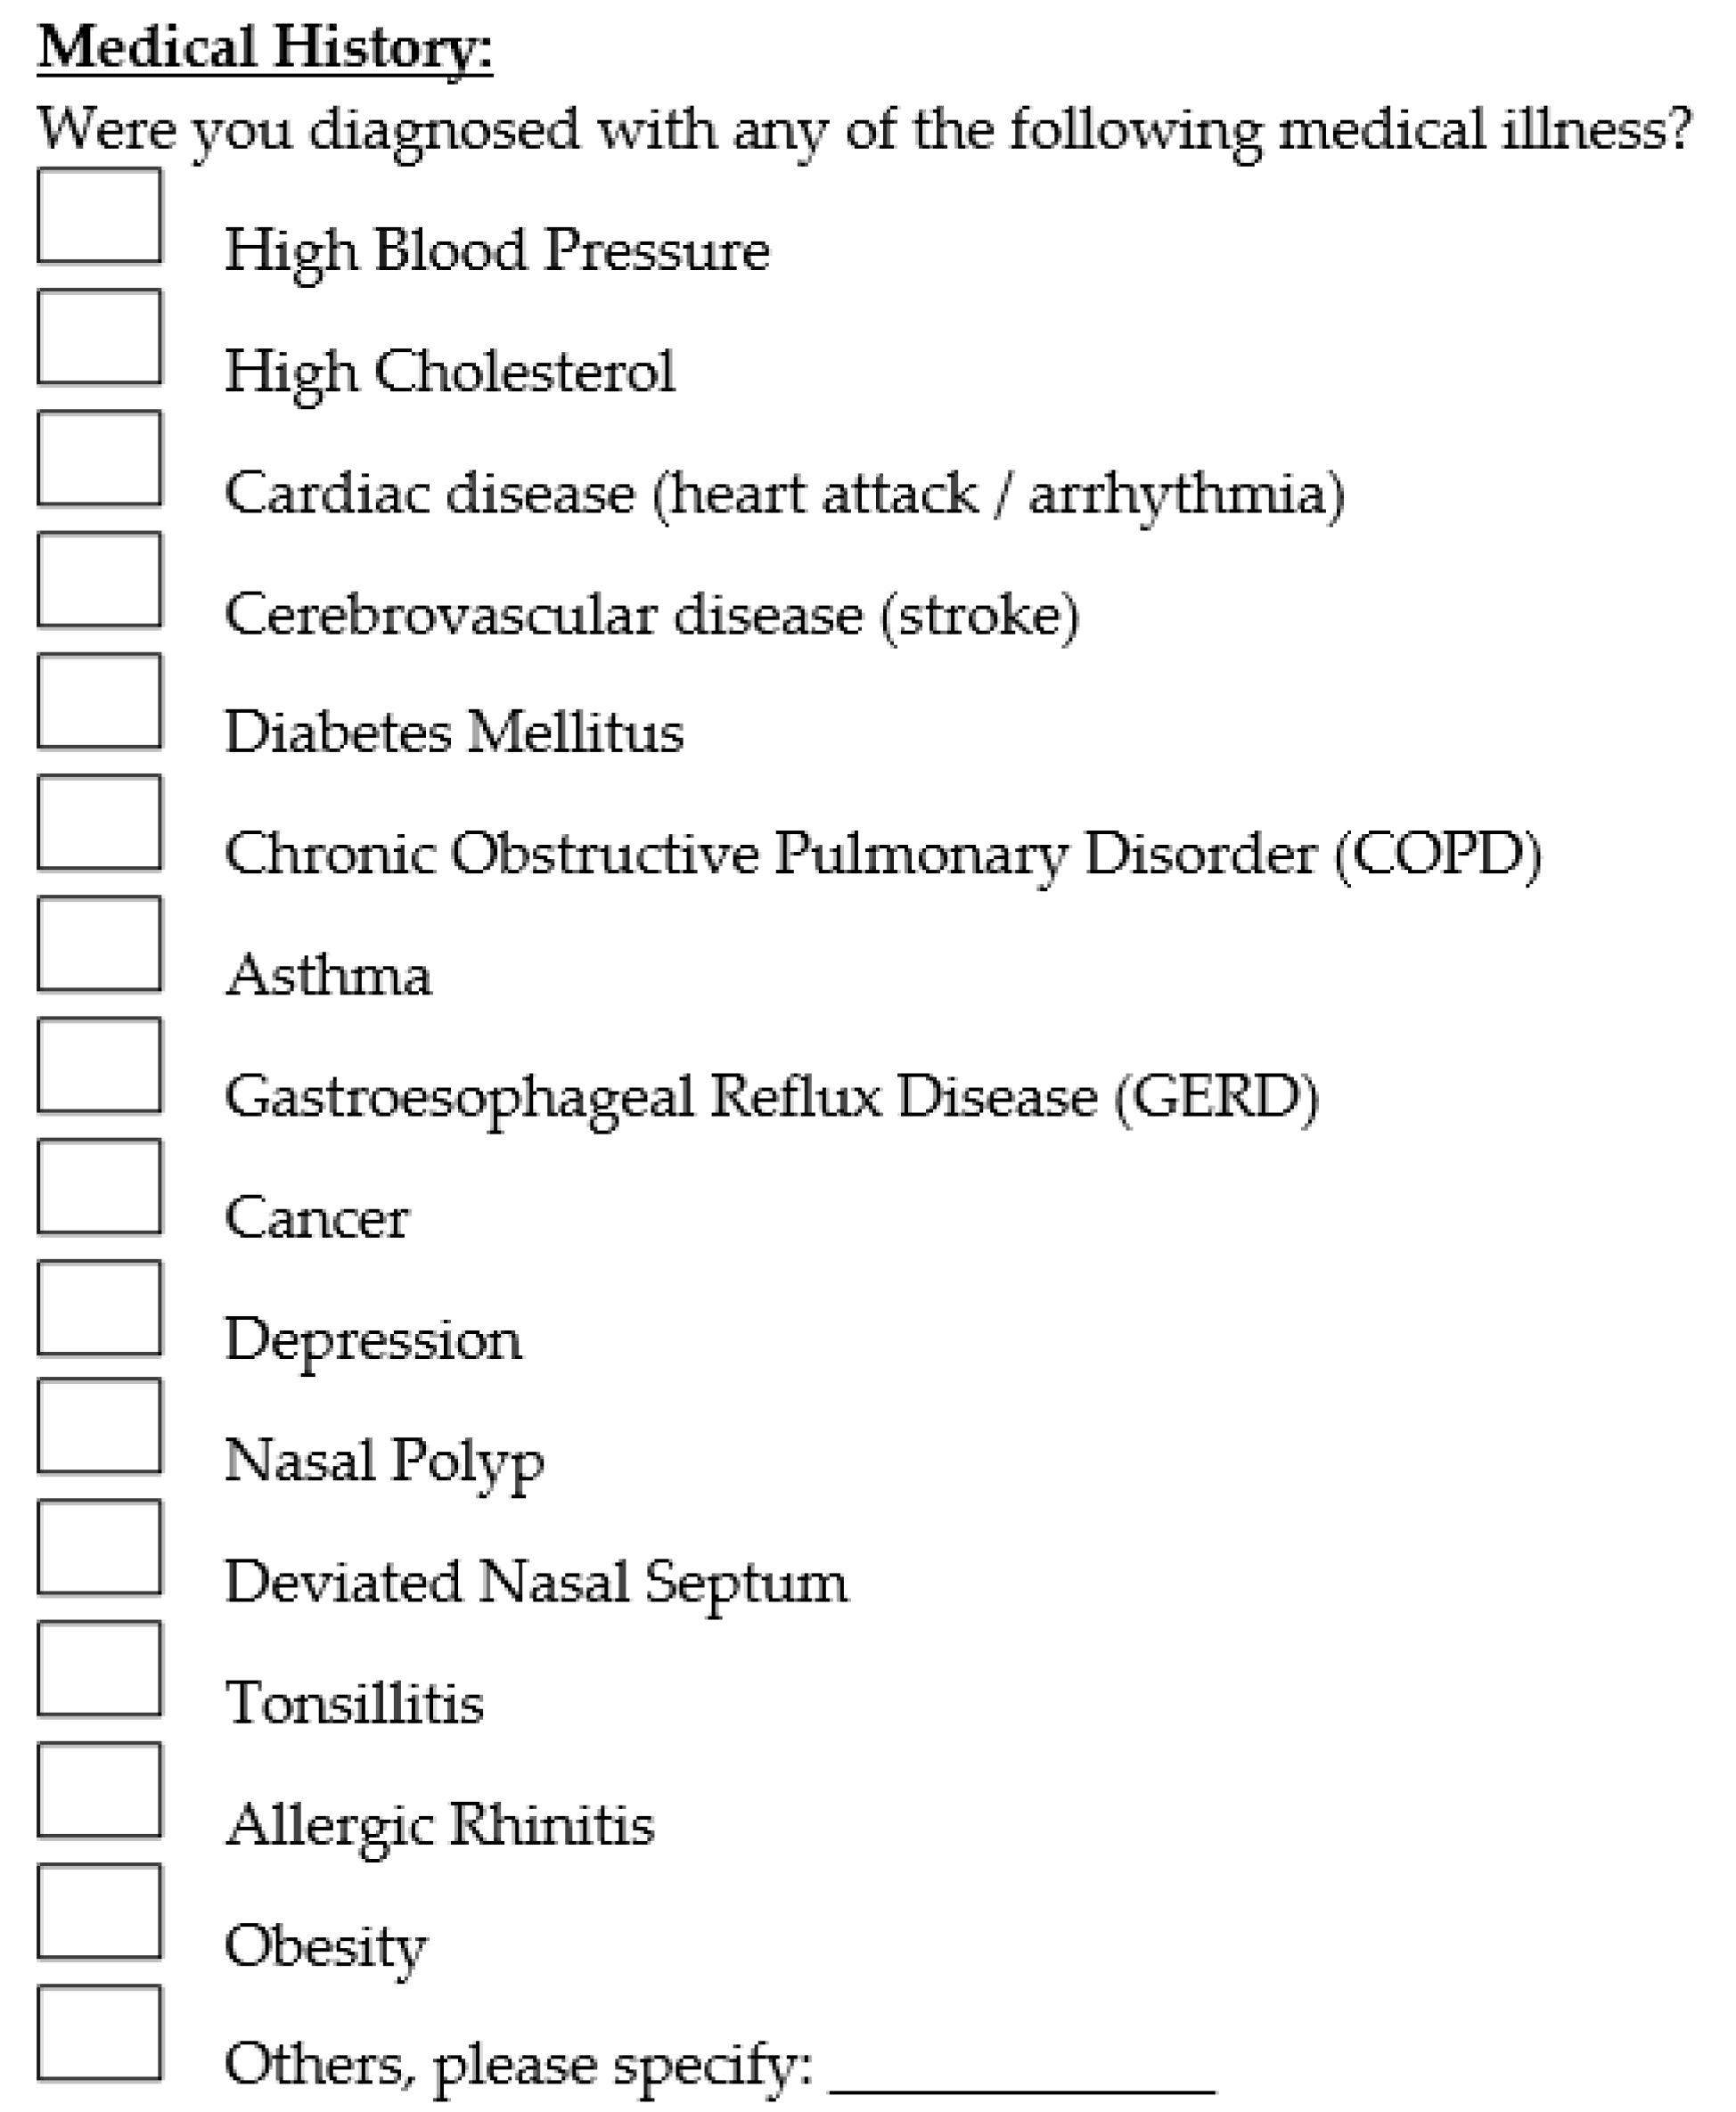
Questions regarding history of OSA symptoms included the presence of excessive daytime sleepiness, loud snoring, morning headache, etc. The medical illnesses included in the questionnaire were hypertension, hypercholesterolemia, cardiac disease, cerebrovascular disease, diabetes mellitus, Chronic Obstructive Pulmonary Disorder (COPD), asthma, Gastroesophageal Reflux Disease (GERD), cancer, depression, nasal polyp, deviated nasal septum, tonsillitis, allergic rhinitis and obesity. Patients were also asked to state whether they are currently taking any medications or supplements. Presence of any pre-existing OSA symptoms and comorbidity diagnoses were solely based on the responses obtained from the questionnaire. The questionnaire used is shown in Figure 1 and Figure 2 below.
1269 CBCT scans were obtained and these patients were contacted by e-mail. All patients were required to fill out an online questionnaire regarding the presence of any positive medical comorbidities and OSA-related symptoms. Along with this questionnaire, a consent form and a study information sheet were sent to the patients to obtain informed consent of their willingness to participate in this research study.
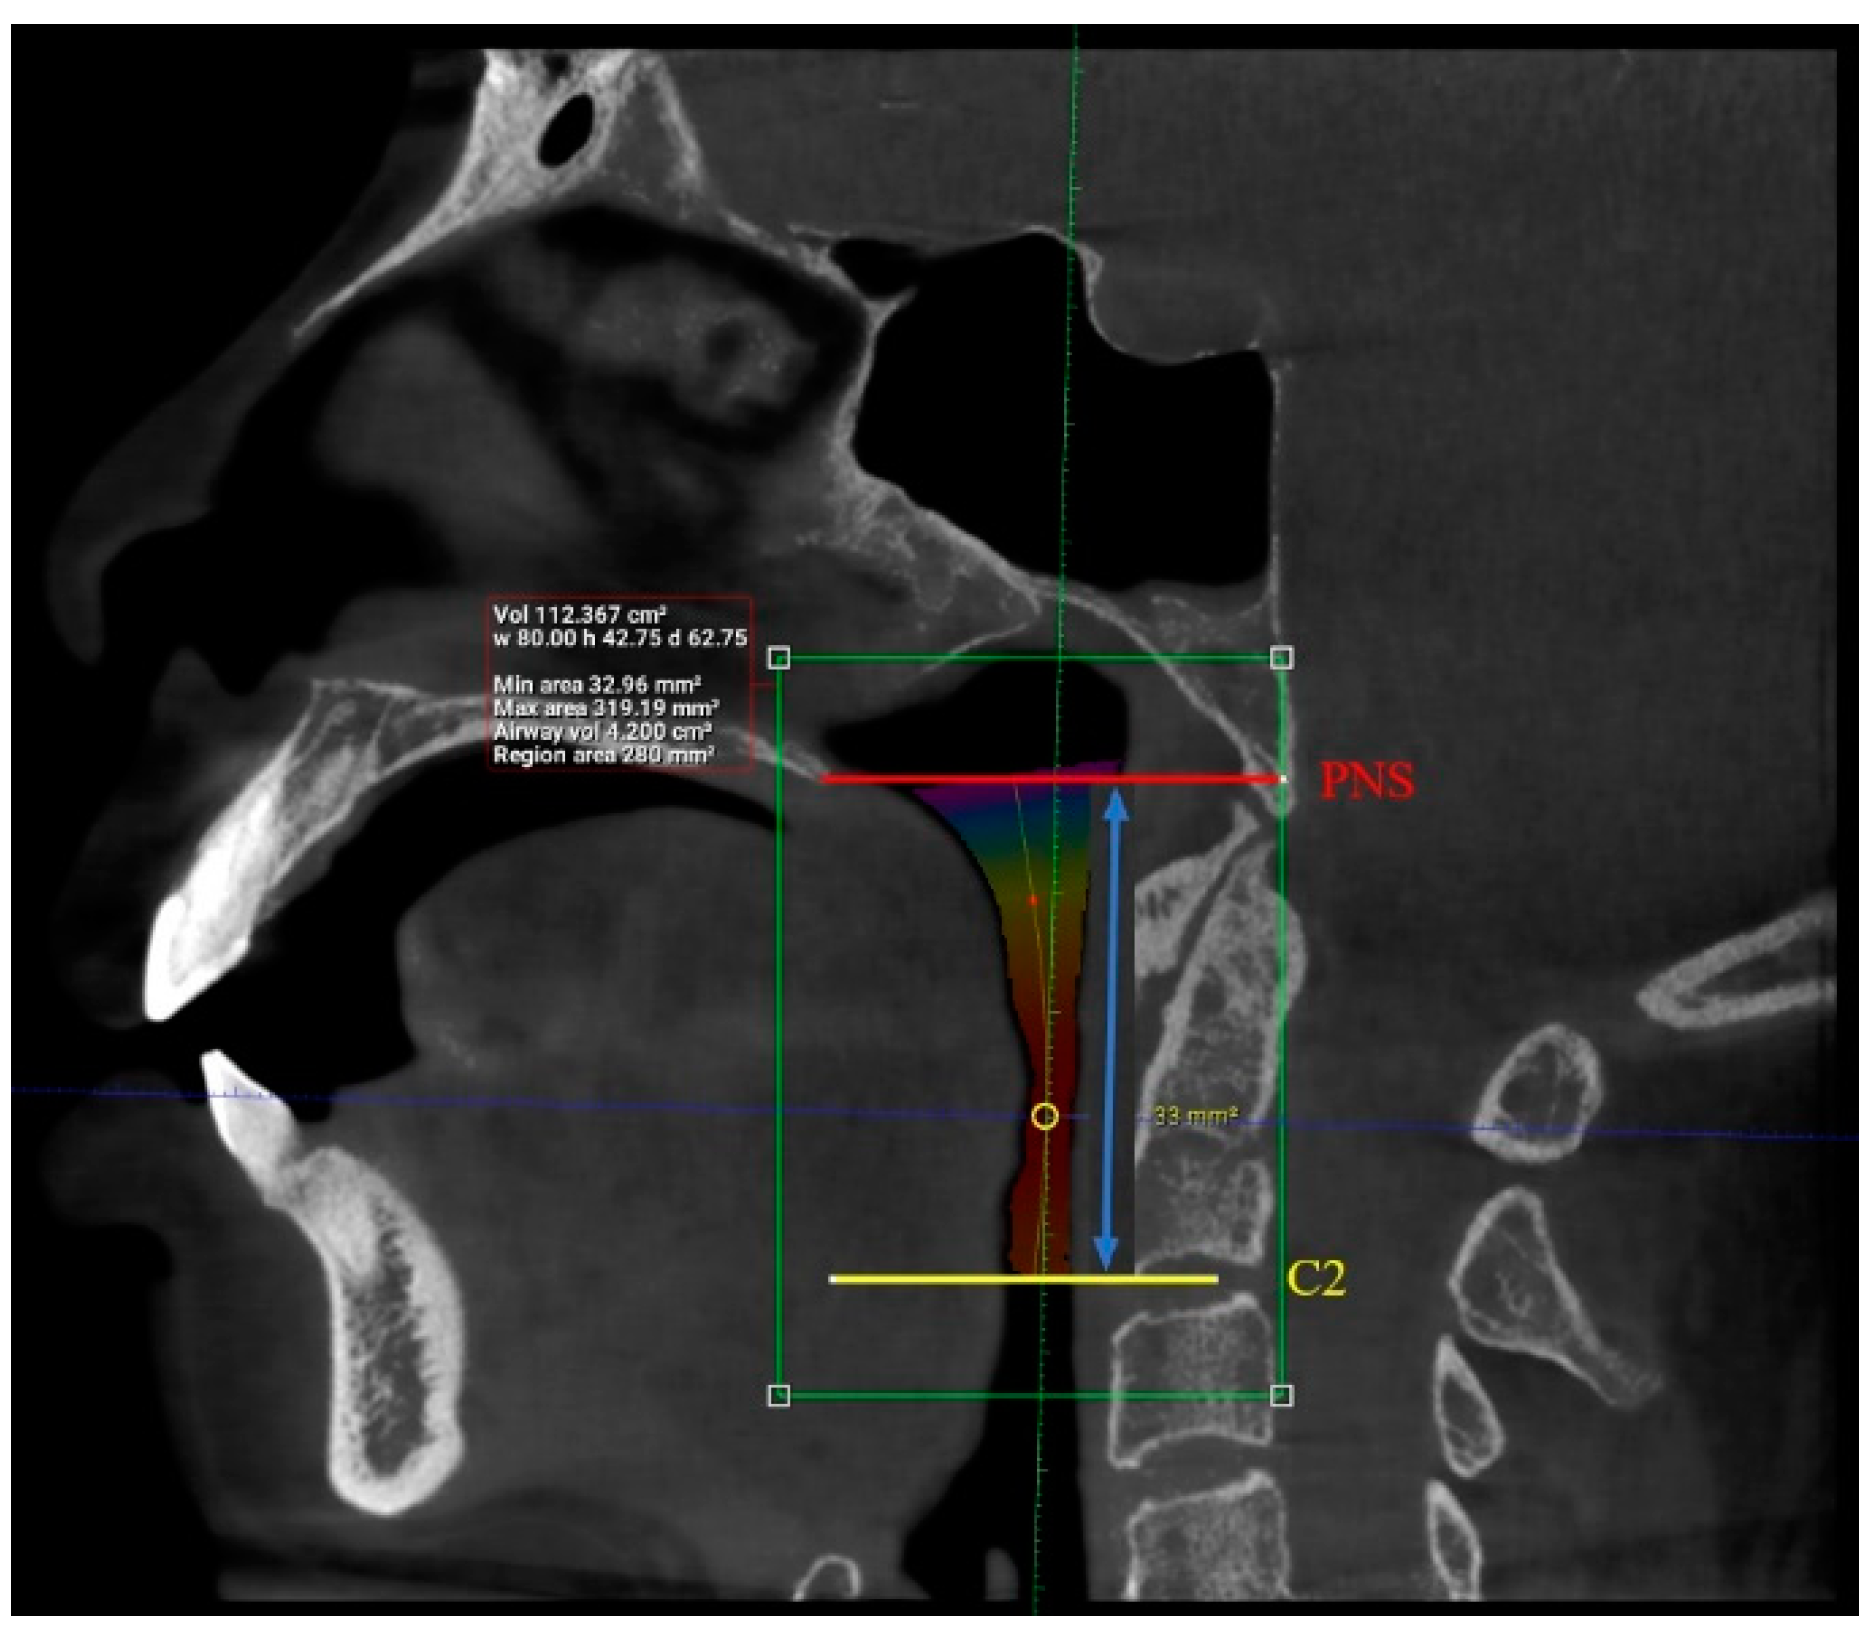
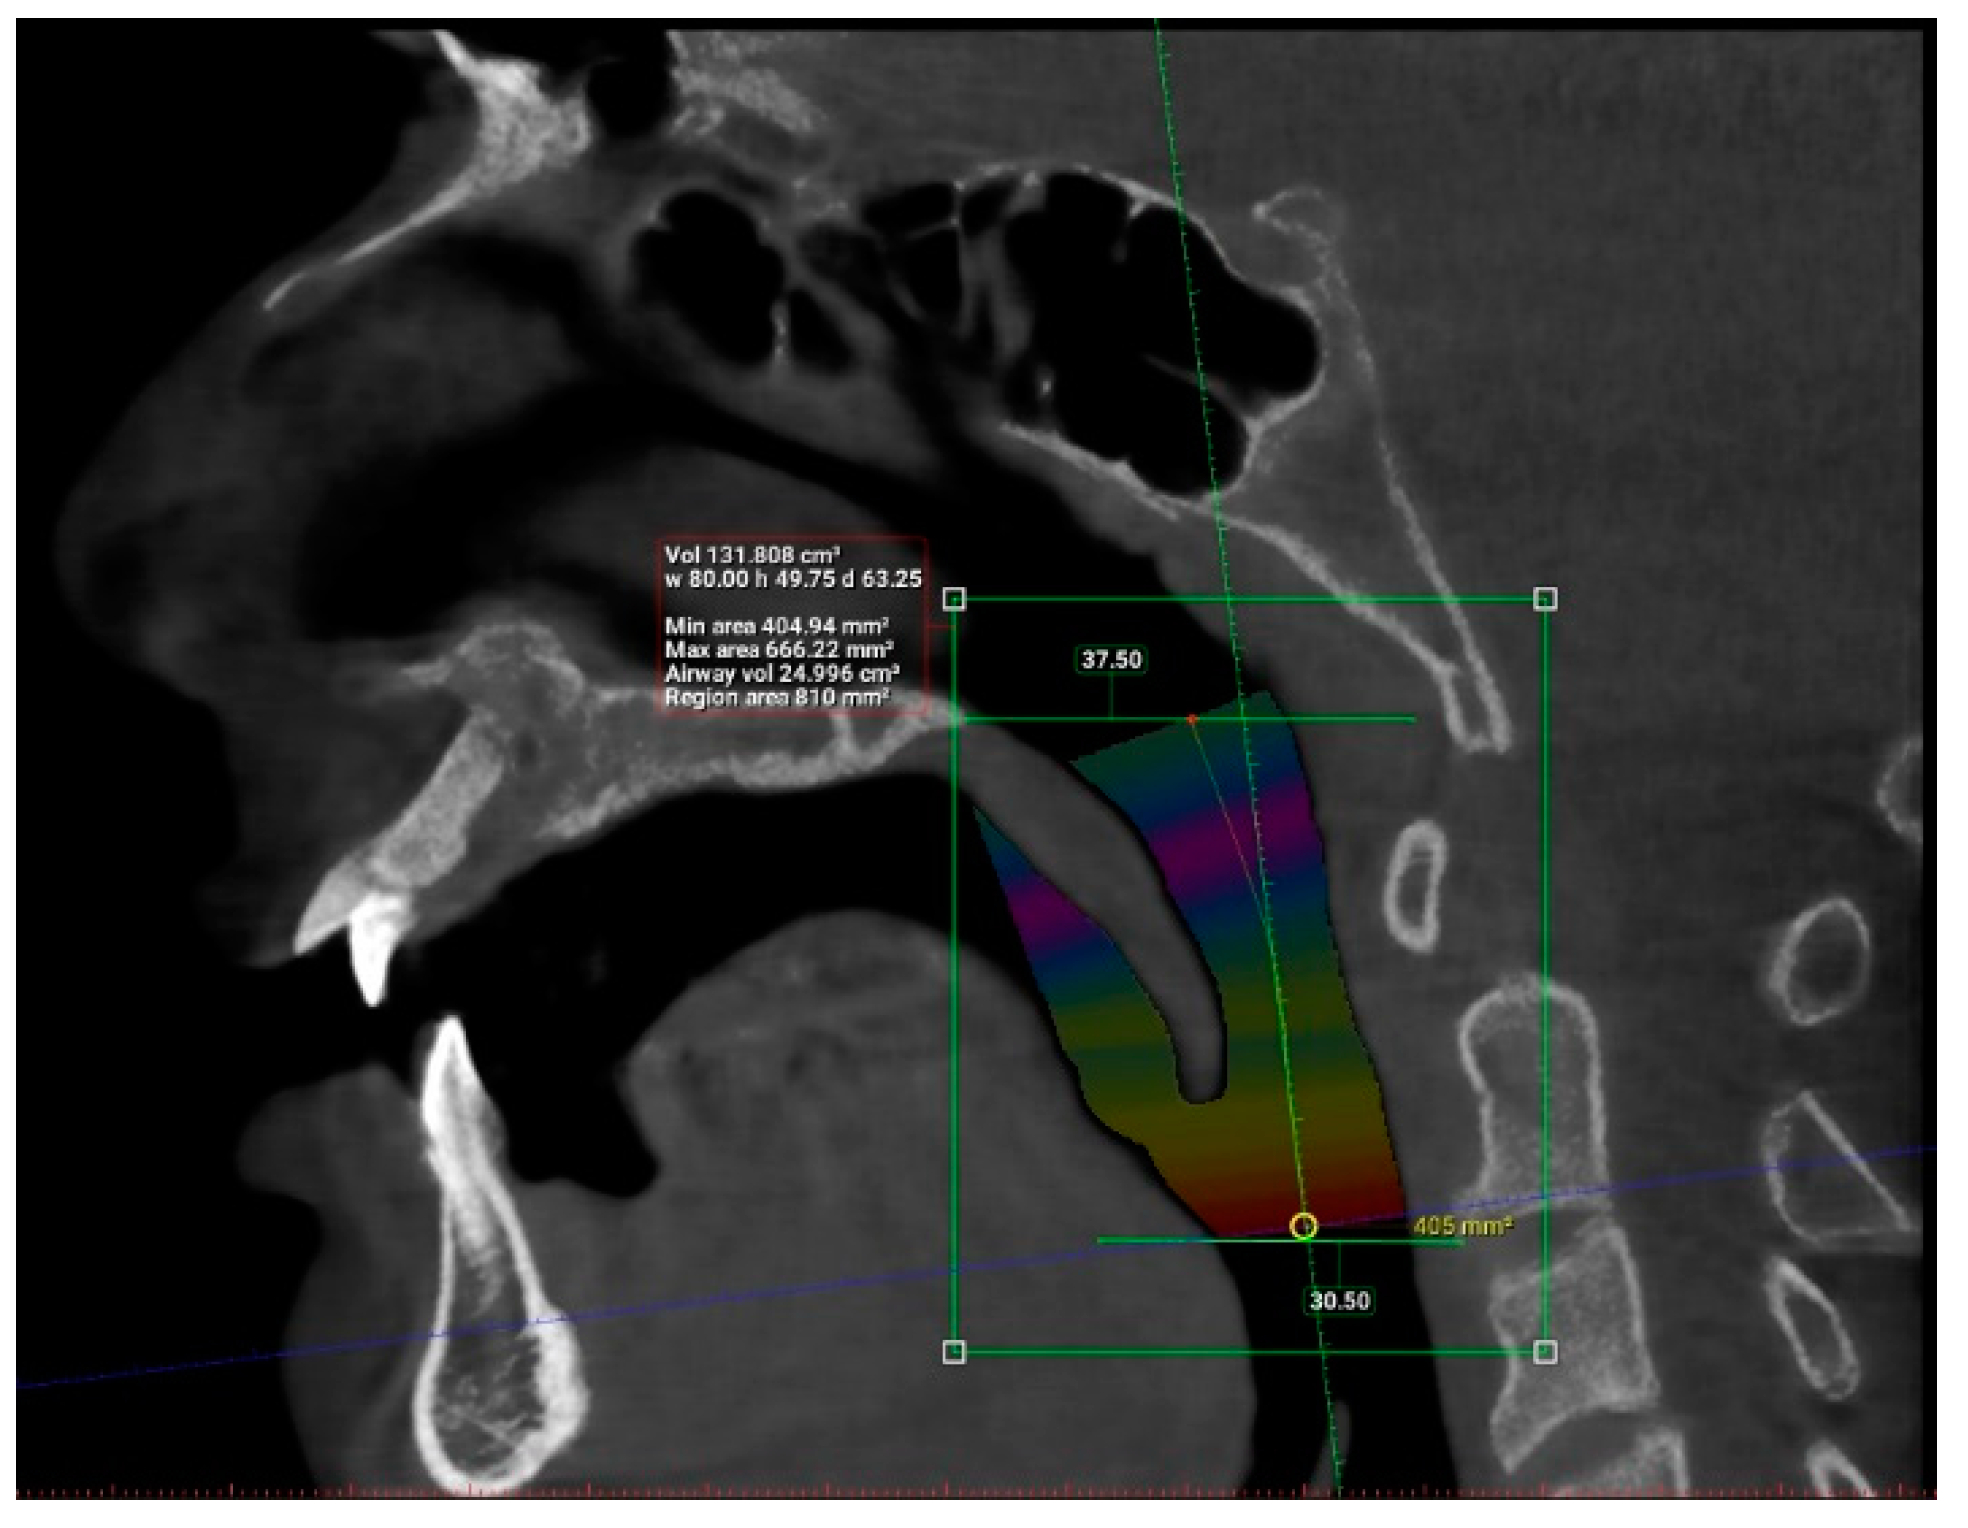
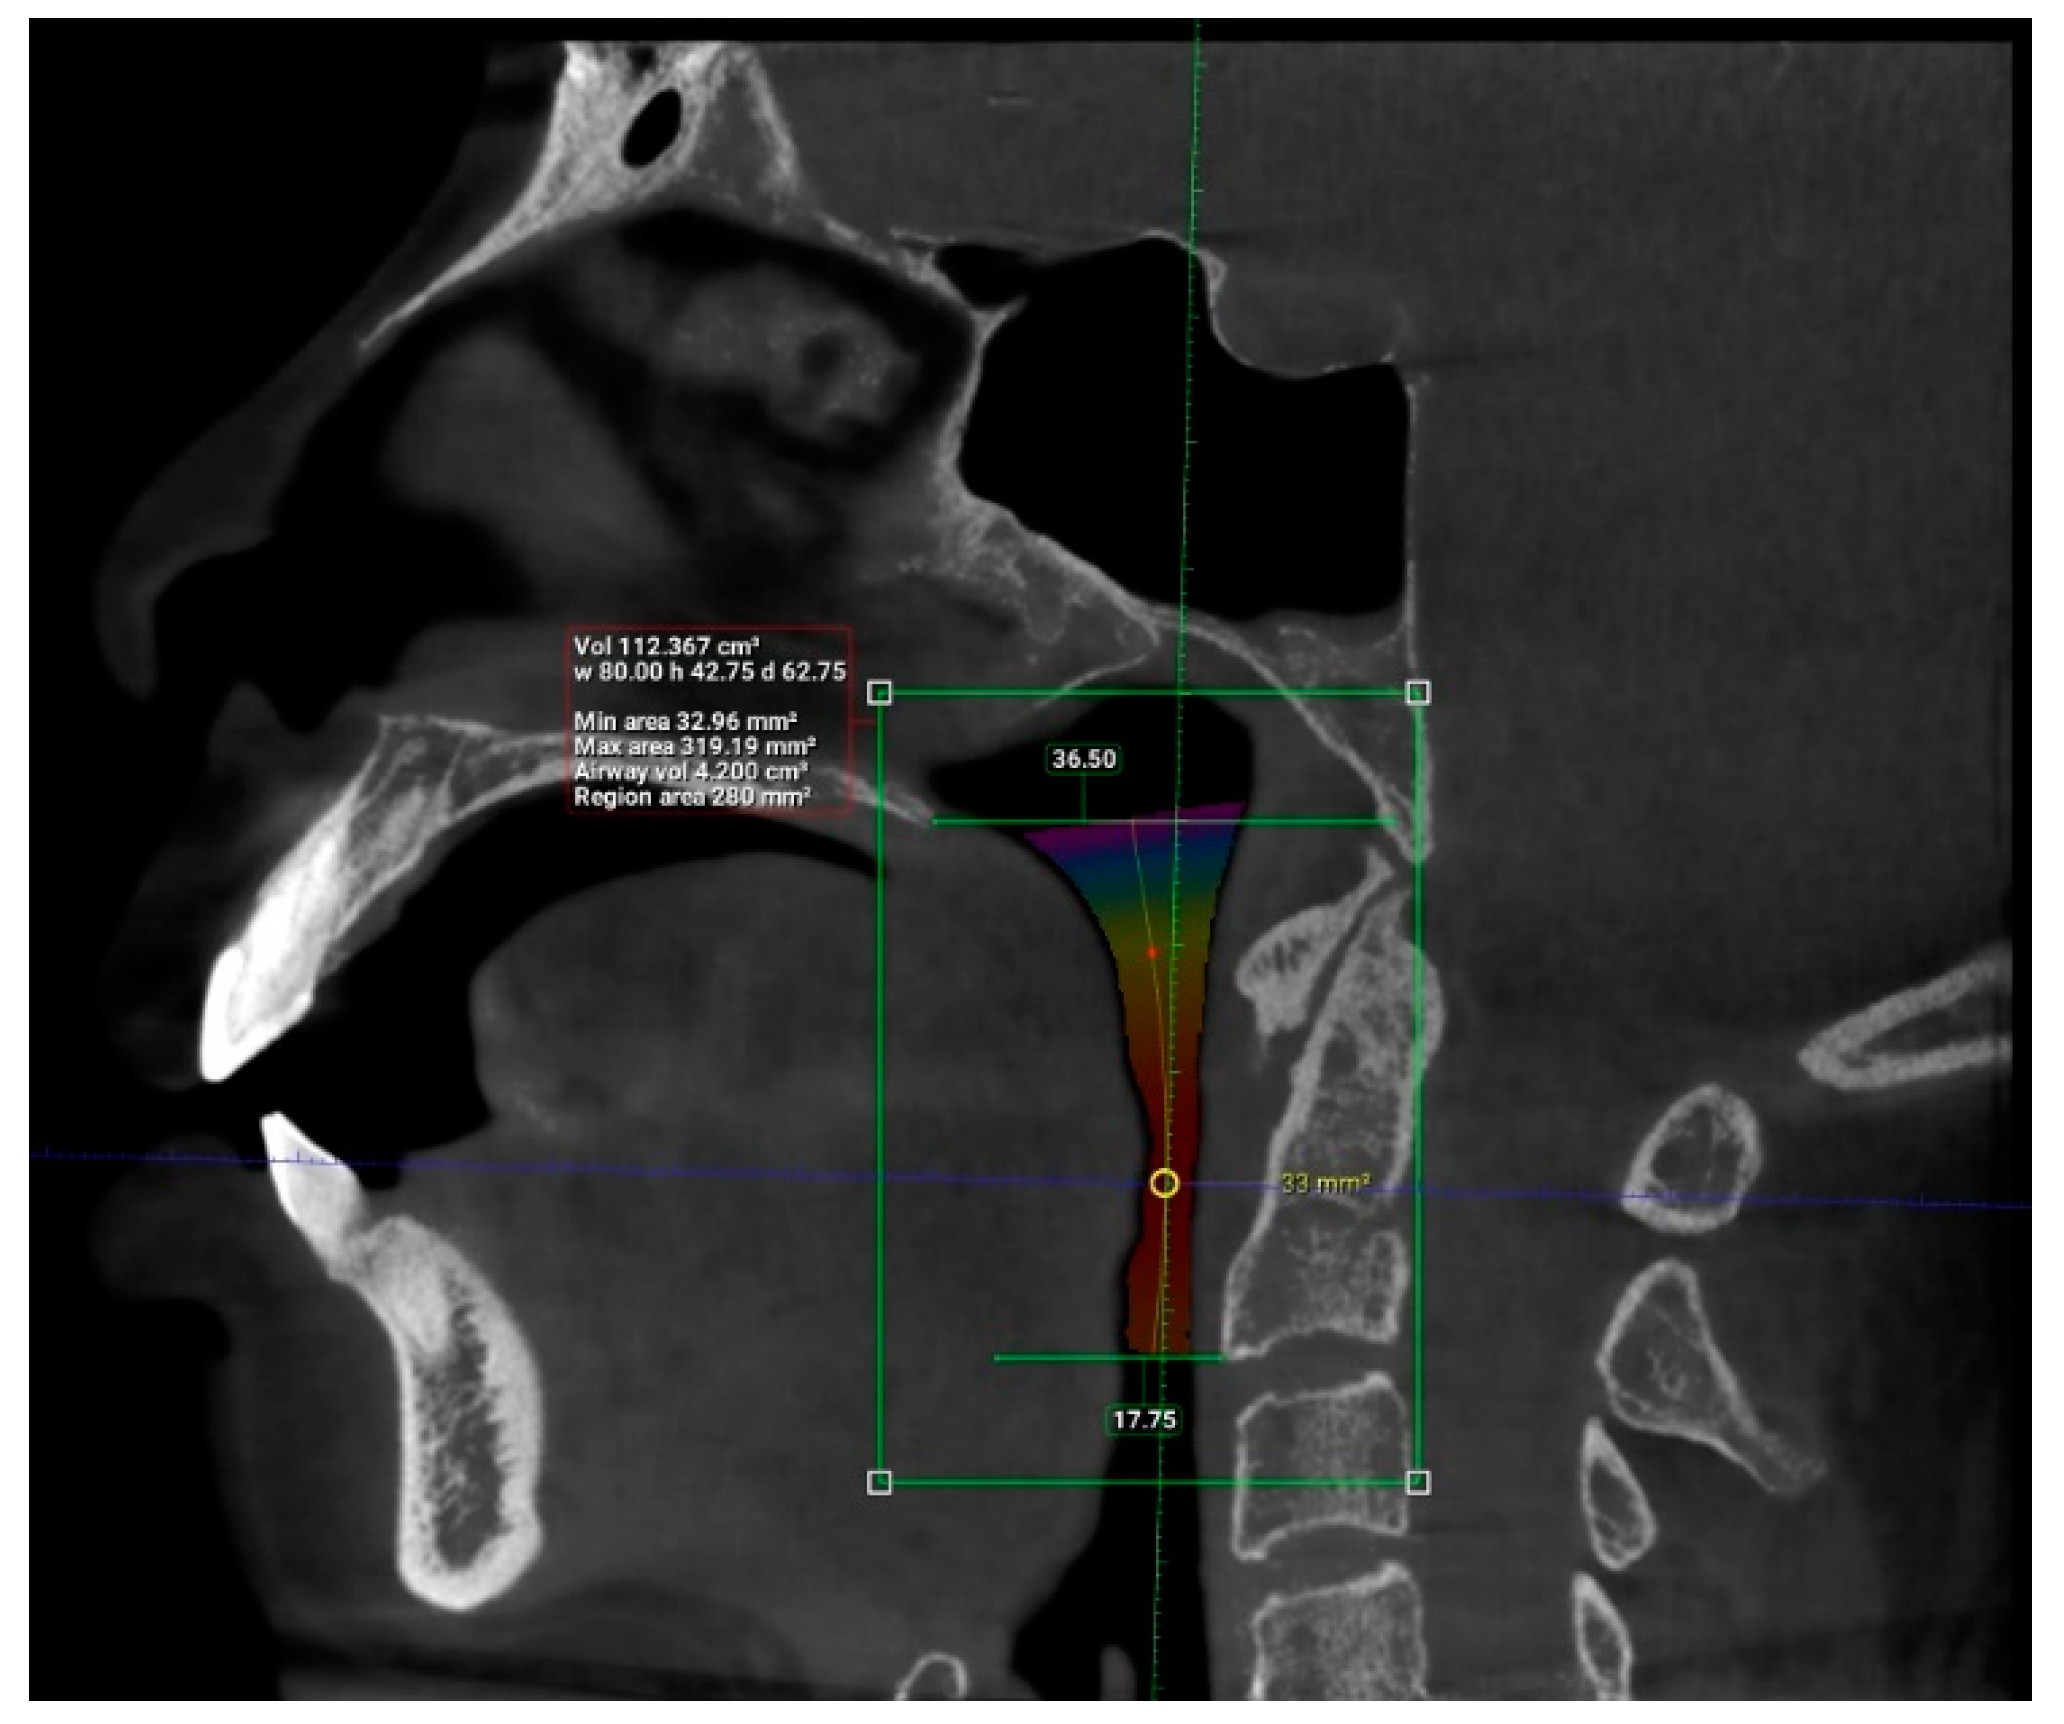
Interpretation of patients’ CBCT scans in OHC, IMU were carried out after they agreed to participate in the study and completed the online questionnaire. The upper airway dimensions in the CBCT scans were measured using Planmeca Romexis software. The oropharynx region beginning from the posterior nasal spine to cervical vertebrae C2 were isolated from the data and analyzed, as seen in 
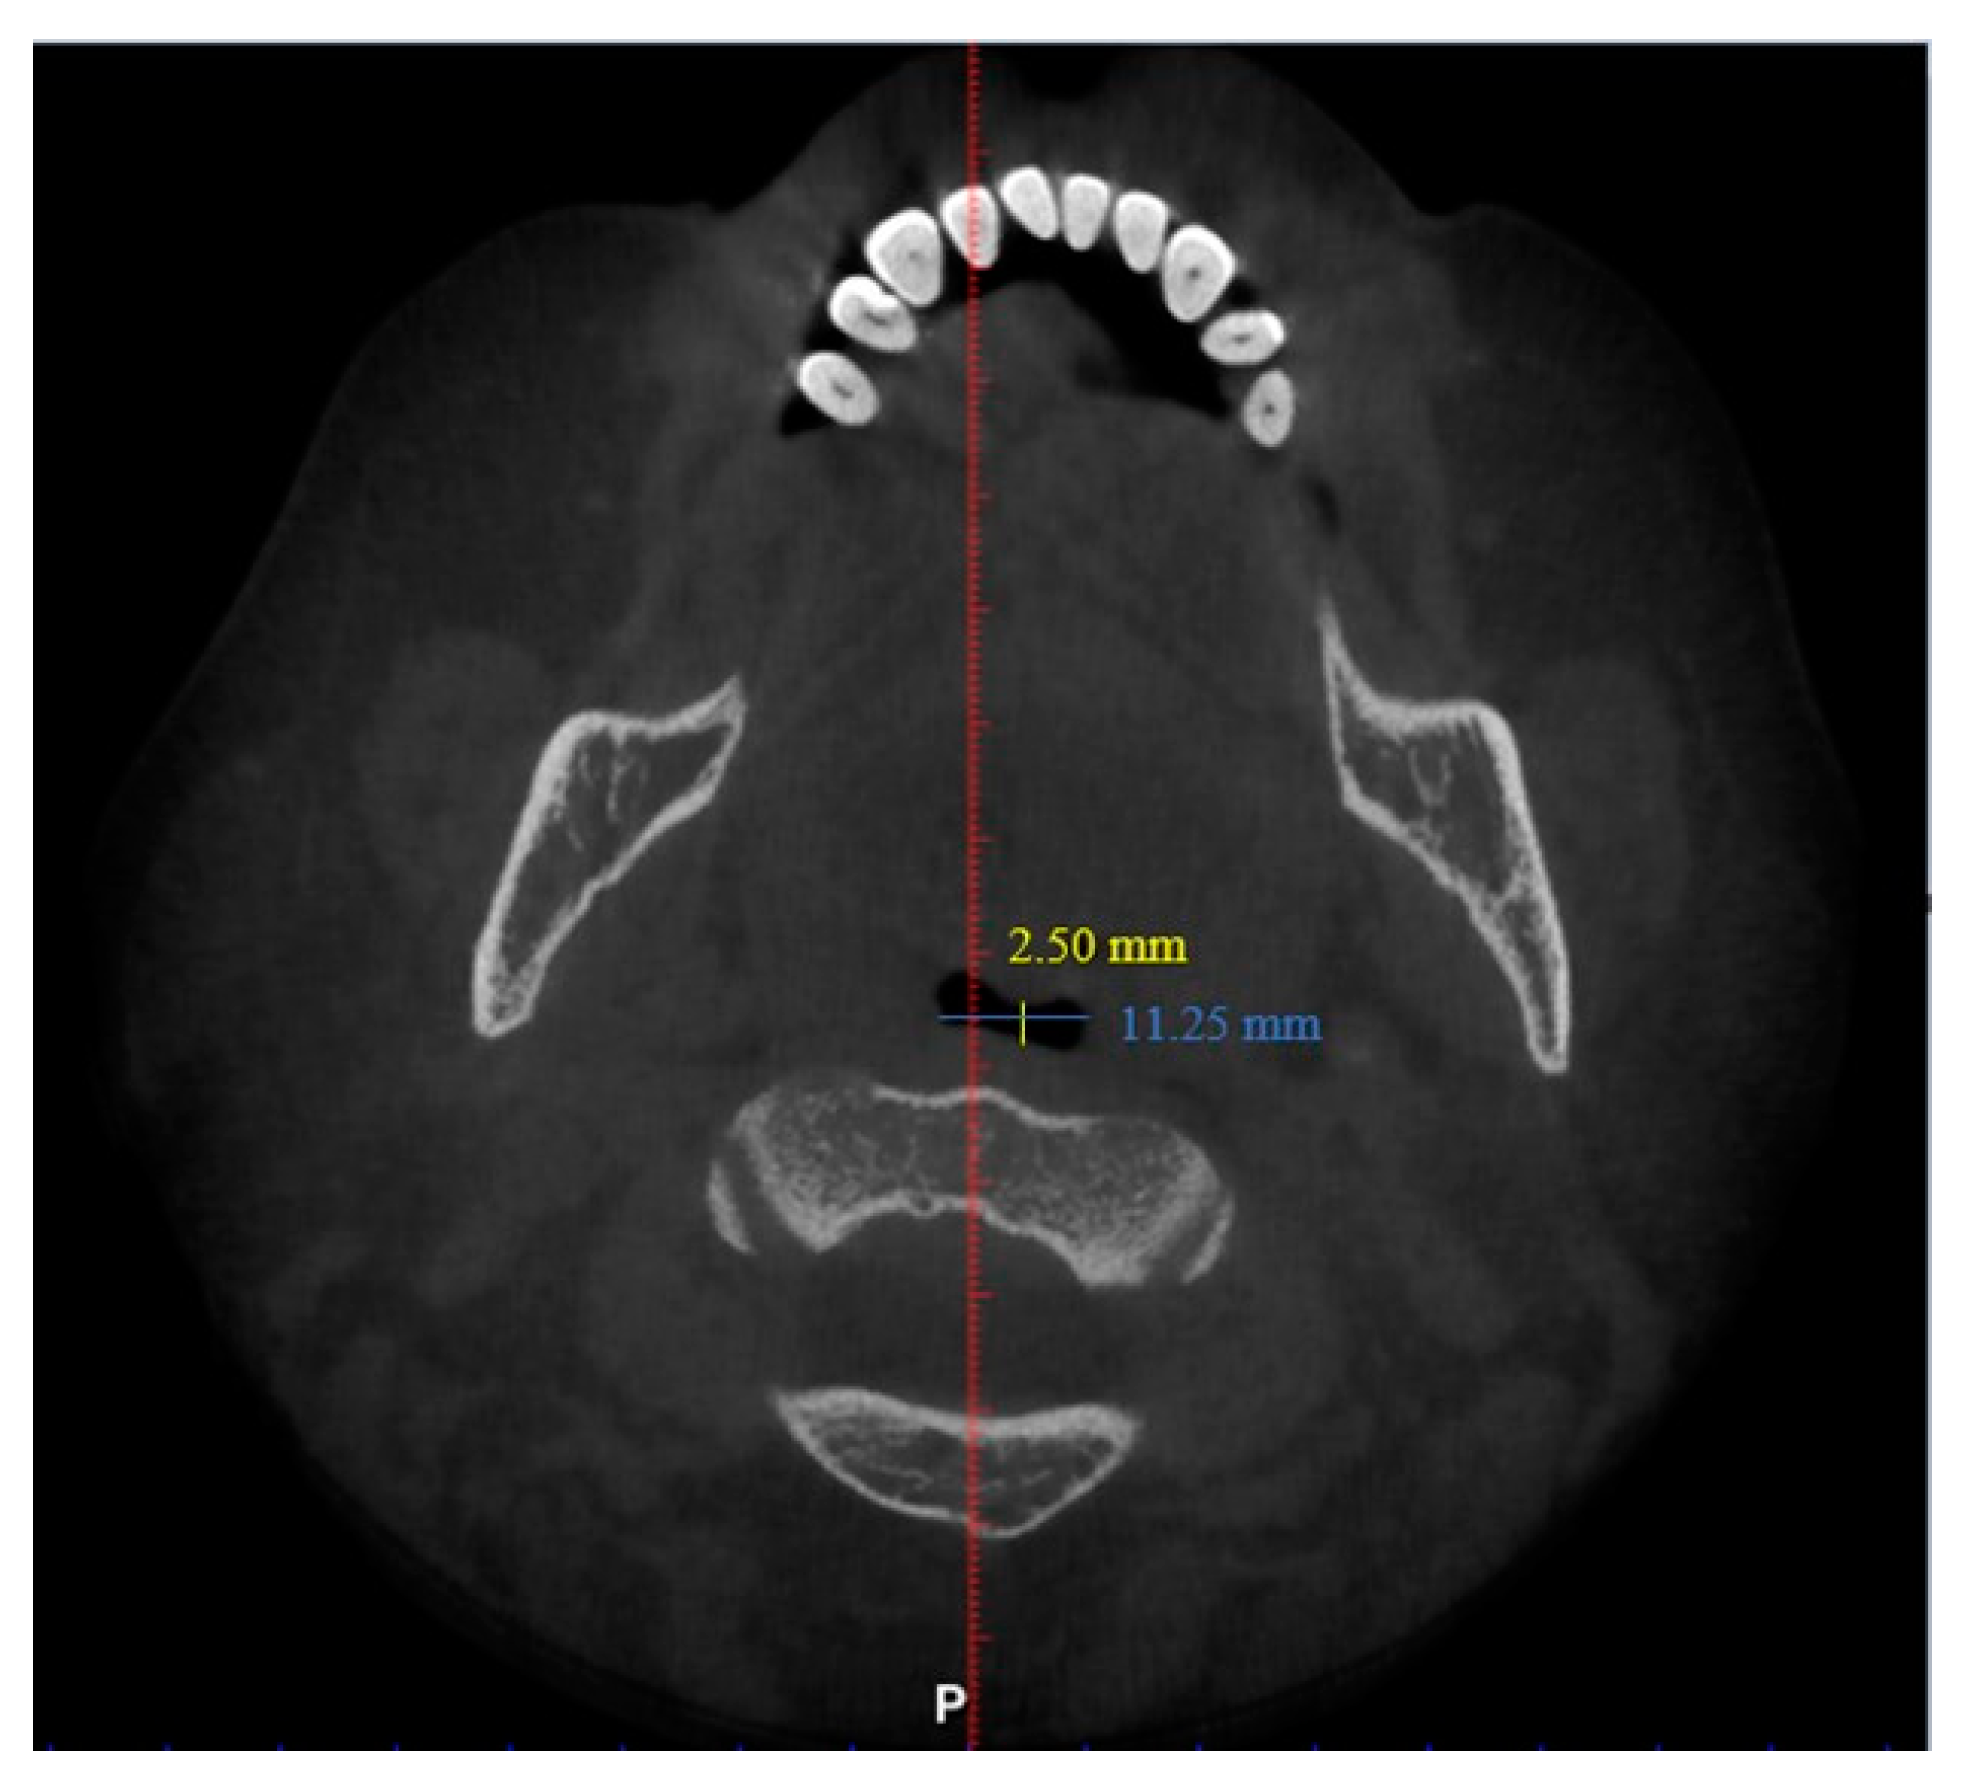
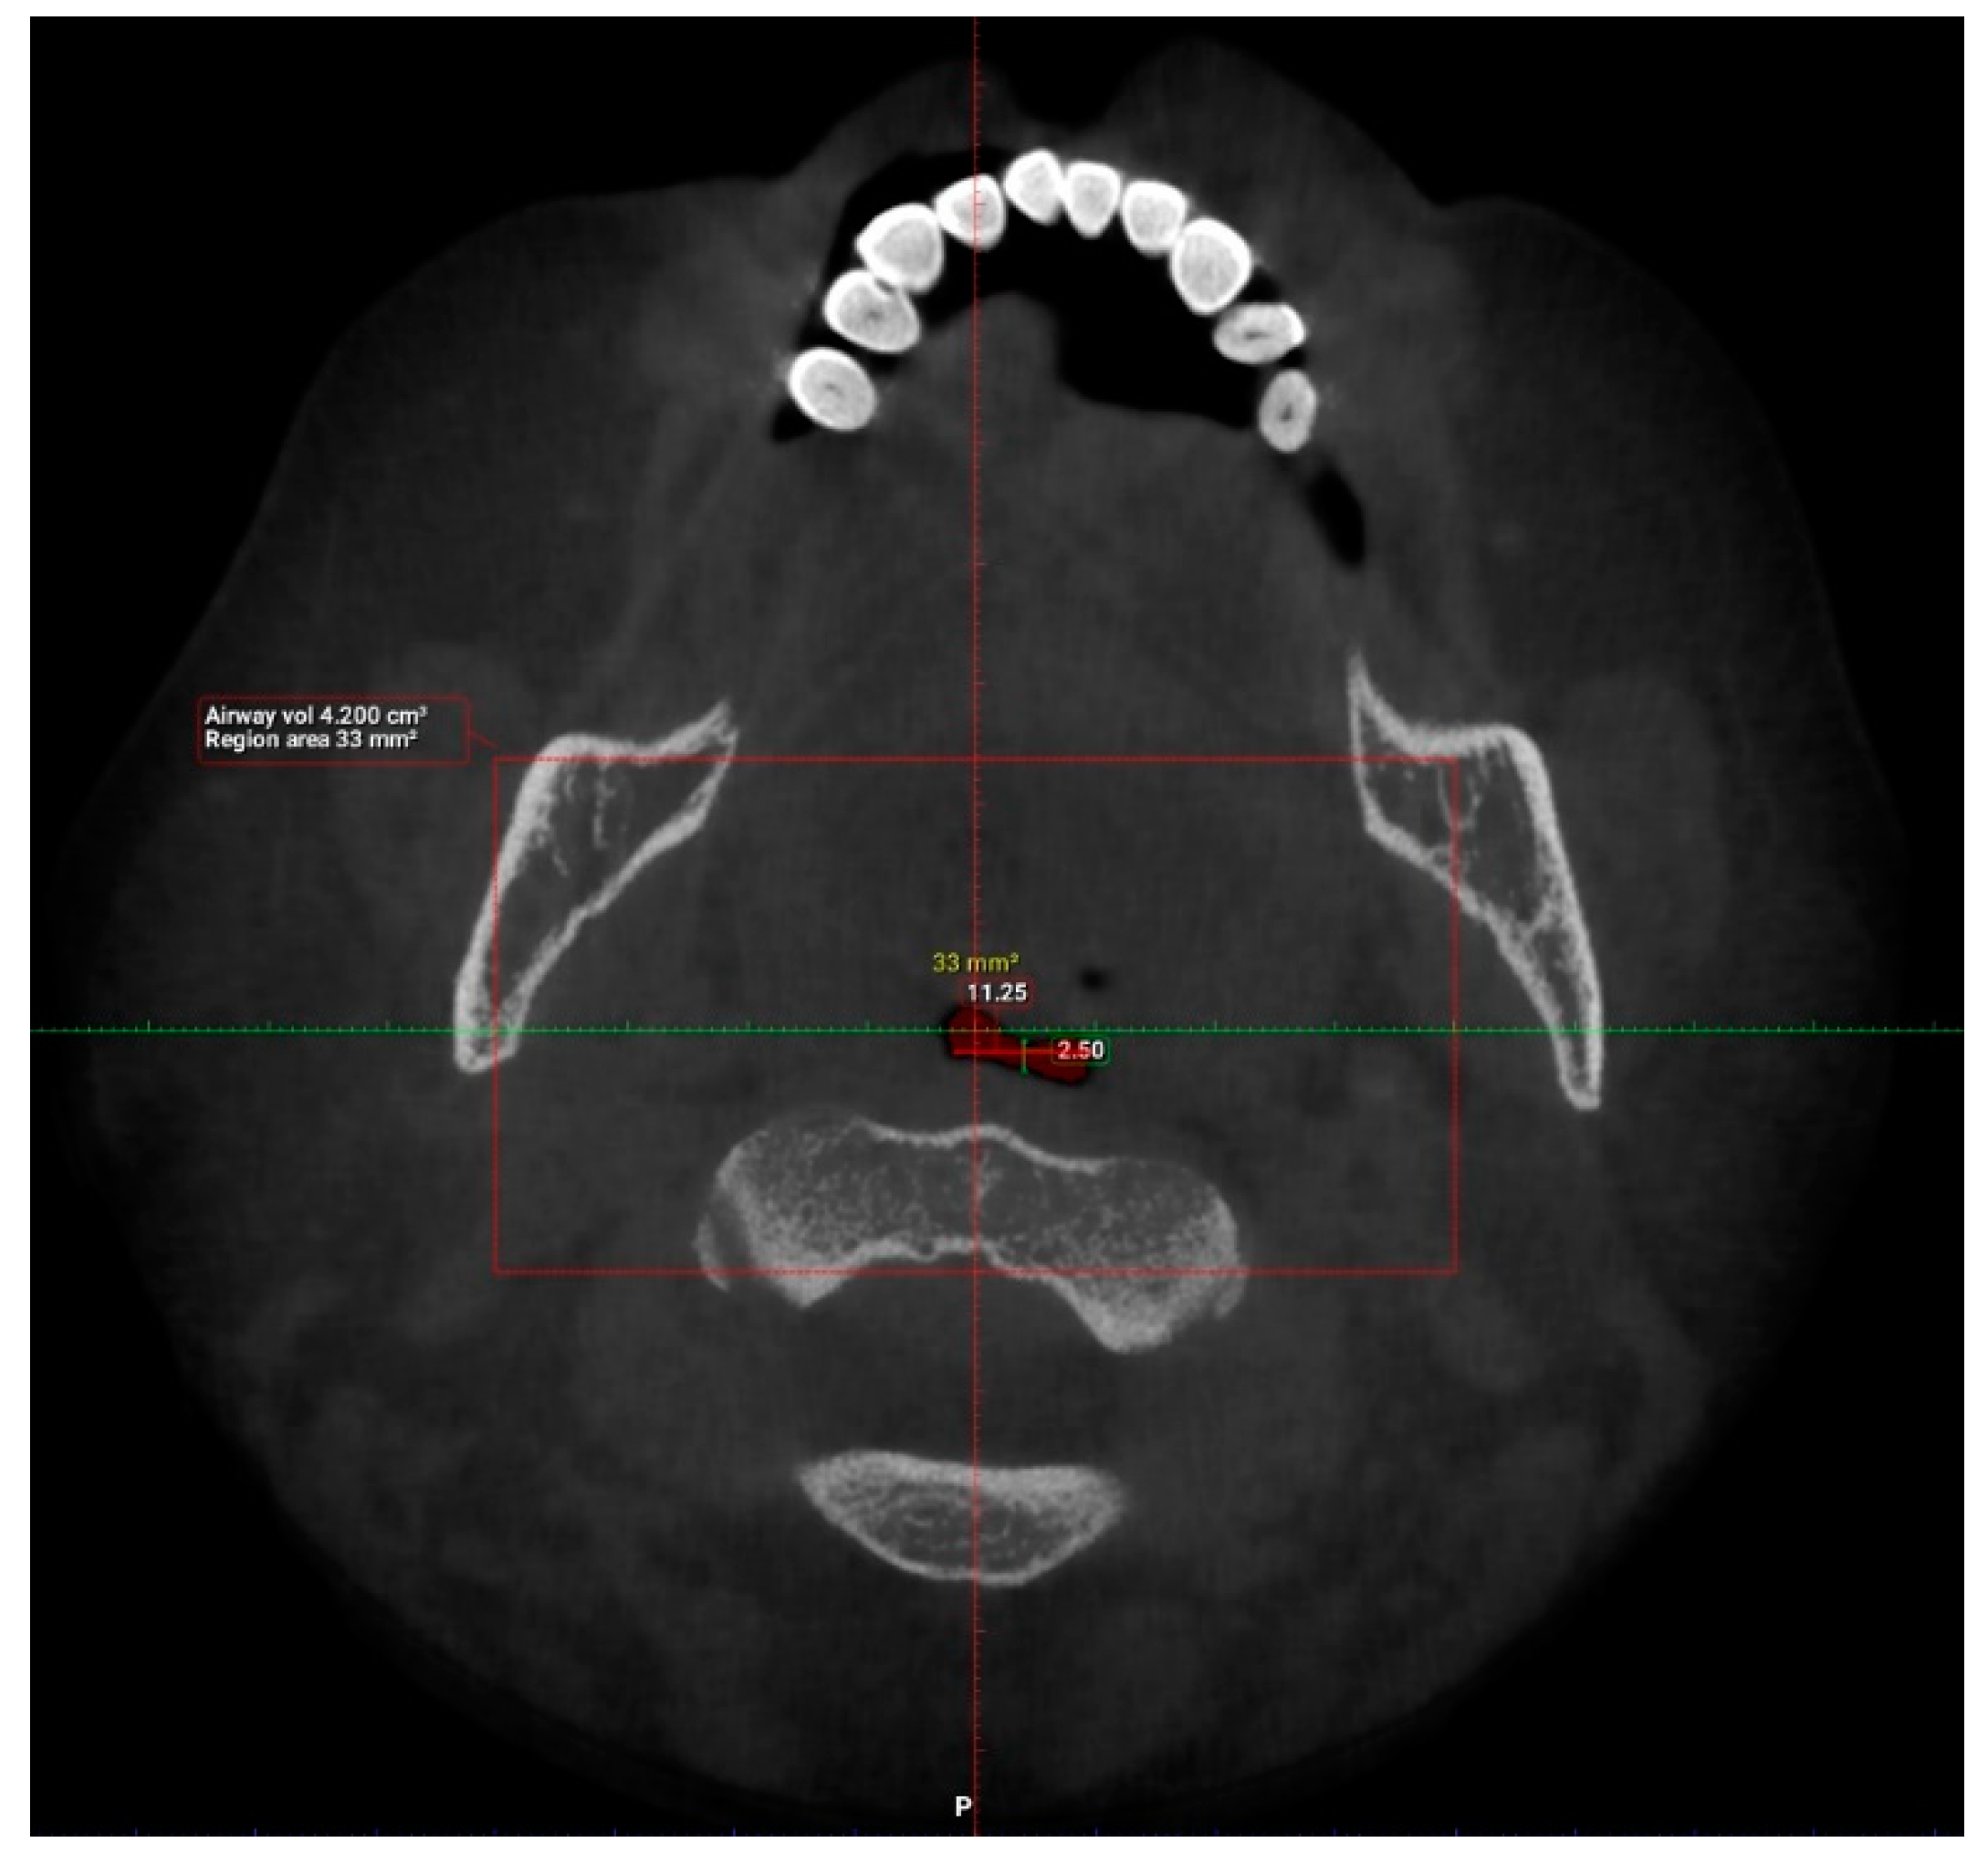
Figure 3. CBCT findings that were computed from the sagittal view included the length of the upper airway, total airway volume of the oropharynx and the average airway volume of the oropharynx. The anterior-posterior measurement and width of the upper airway were then measured using the narrowest portion of the upper airway in the axial view, as demonstrated in Figure 4.
Inter-examiner consistency was assessed using Intraclass Correlation (ICC) and demonstrated good to excellent reliability.
Among all the patients contacted, 101 patients agreed to participate in this research study, thereby achieving our targeted sample size of 100 patients. The targeted sample size was calculated based on Cochran’s sample size formula with Z value set at 1.96 for the confidence level of 95%, d = 0.05 and prevalence of 7% [13,14,15].
For data analysis, all the data were tabulated and analyzed using SPSS software version 22.0. Frequency distributions were determined for the demographic data, medical comorbidities and OSA symptoms. Descriptive statistics were then determined for the upper airway dimension parameters. A logistic regression test was carried out to predict the relationship between medical comorbidities and upper airway dimensions, as well as OSA symptoms and upper airway dimensions. Fisher’s exact test was also conducted to determine whether there was a significant relationship between medical comorbidities and OSA-related symptoms. p ≤ 0.05 was considered statistically significant for all tests.

3. Results

101 patients were included in the study, 46 males and 55 females, ranging from 18 to 77 years. Table 1 shows the frequency distribution of gender, age, race, medical comorbidities and OSA symptoms of the patients involved in this study.
The most common medical comorbidities of the patients involved in this study were hypertension and high cholesterol. Meanwhile, the majority of the patients involved experienced loud snoring, while other common symptoms included excessive sleepiness during the day and awakening often with dry mouth or sore throat.
After compiling the frequency distribution of each medical comorbidity and OSA symptom, all the data were then cross tabulated, bearing in mind that some patients diagnosed with a particular medical condition may have one or more OSA symptom. For example, out of all the people with hypertension, 9 (56.3%) had excessive daytime sleepiness, 7 (43.8%) experienced loud snoring, 1 (6.3%) respondent each experienced stopped breathing during sleep and was abruptly awakened from sleep due to gasping or choking, 5 (31.3%) awakened with dry mouth or sore throat in the morning, 2 (12.5%) each had morning headaches, experienced difficulty concentrating during the day and mood changes, and lastly 1 (6.3%) respondent each experienced night sweats and decreased sex drive. Table 2 shows the frequency distribution of those with medical comorbidities and history of OSA symptoms.
The upper airway of each patient was segmented and different parameters were measured in the sagittal and axial view, as demonstrated in Figure 5 and Figure 6 (patient without hypertension) and Figure 7 and Figure 8 (hypertensive patient).
The descriptive statistics for each of the parameters measured is displayed in Table 3.
Logistic regression analysis was carried out to predict the relationship between medical comorbidities and upper airway dimensions (Table 4) as well as OSA symptoms and upper airway dimensions (Table 5). From the results obtained, length (OR = 1.341; 95% CI: 1.056–1.705, p = 0.016) and total volume (OR = 0.896; 95% CI: 0.819–0.980, p = 0.017) of upper airway as well as width of the narrowest portion of the upper airway (OR = 0.781; 95% CI: 0.648–0.942, p = 0.010) were found to be associated with hypertension.
In addition to that, anterior-posterior dimension of the narrowest portion of the upper airway was found to be associated with excessive daytime sleepiness (OR = 1.243; 95% CI: 1.008–1.533, p = 0.042) while length (OR = 1.154; 95% CI: 1.022–1.304, p = 0.021) and average volume of upper airway (OR = 0.711; 95% CI: 0.515–0.980, p = 0.037) were associated with loud snoring in these patients. In addition, average volume of the upper airway (OR = 0.471; 95% CI: 0.291–0.765, p = 0.002) and anterior-posterior dimensions of the narrowest portion of the upper airway (OR = 2.097; 95% CI: 1.358–3.238, p < 0.001) were found to be associated with difficulty concentrating during the day, with high significance values. Similar parameters, average volume of the upper airway (OR = 0.729; 95% CI: 0.542–0.980, p = 0.036) and anterior-posterior dimensions of the narrowest portion of the upper airway (OR = 1.477; 95% CI: 1.103–1.979, p = 0.009), were found to be associated with mood changes.
Fisher’s exact test (Table 6) was then carried out to determine whether there was a significant association between all the medical comorbidities (hypertension, high cholesterol, heart disease, diabetes, asthma, GERD, cancer, depression, deviated nasal septum, tonsillitis, allergic rhinitis and obesity) and OSA symptoms. From the results obtained, it was found that hypertension (p = 0.016) and heart disease (p = 0.038) have significant associations with loud snoring. Depression had a significant relationship with awakening with dry mouth or sore throat (p = 0.033), concentration difficulties during the day (p = 0.050) and mood changes (p = 0.005). A deviated nasal septum was found to have a significant association with awakening with dry mouth or sore throat (p = 0.033), morning headache (p = 0.001) and difficulty concentrating during the day (p = 0.050). Tonsillitis was also found to have a significant association with morning headaches (p = 0.021) and difficulty concentrating during the day (p = 0.034). Lastly, obesity also had a significant relationship with loud snoring (p = 0.014).

4. Discussion

OSA has been found to be associated with certain medical comorbidities and its prevalence has been increasing in recent years. This study is important in correlating the association between medical comorbidities, OSA symptoms and upper airway dimensions, as seen in CBCT scans among dental patients at risk of developing OSA. According to the University of Toronto, OSA can be associated with several medical comorbidities such as cardiovascular disease, cerebrovascular disease, GERD, metabolic diseases and obesity [16]. Symptoms of OSA can range from daytime sleepiness, behavioural irritability such as depression, sexual dysfunction, heavy snoring, sudden awakening with noisy breathing and dry mouth [17]. OSA patients were also found to have narrower upper airway width, smaller anterior-posterior distance, smaller average volume and total volume, and larger airway length [18].
Results from our study indicated a significant relationship between hypertension and length of upper airway, total volume of upper airway and width of the narrowest portion of the upper airway. Results reveal that with every one unit increase in the length of the upper airway, the odds of being diagnosed with hypertension is 1.341. In addition, a one unit increase in total volume of airway or width will result in lowered odds of having hypertension by 0.896 and 0.781, respectively. From these results, an association can be established between hypertension and larger upper airway length, smaller total volume of airway and smaller width of upper airway, indicating an increased risk of developing OSA. It is important to note that, although these variables have associations with one another, the exact cause-and-effect relationship is not identified in this study. Results from our study proved the claim by Worsnop and colleagues which demonstrated an association between hypertension and OSA [19,20]. A study which used MRI to determine airway diameter also confirmed that patients with OSA had smaller upper airway width and concluded that this parameter can be used as an independent predictor of OSA [21]. This claim is also supported by Enciso and colleagues which determined that patients with narrow upper airway width were 3.9 times more likely to be diagnosed with OSA [22].
Several medical comorbidities were also found to have significant relationships with OSA symptoms. Hypertension, heart disease and obesity have significant effects on loud snoring, indicating that these patients may be at risk of developing OSA. A study by Silverberg stated that OSA is a medical condition that is commonly associated with hypertension and cardiovascular diseases [23]. Associations between heart disease and OSA have also been evident in middle aged men [24]. Clinical studies conducted by other researchers such as Gami and colleagues have revealed that OSA and obesity have a two-way relationship, such that obesity may predispose patients to OSA and OSA may itself lead to obesity in some patients, due to its symptoms of sleep deprivation and affected metabolism [25,26]. Other studies also found significant associations between obesity and OSA [26,27].
In addition, results from our study also indicate significant associations between loud snoring and upper airway length, as well as average volume. A one unit increase in upper airway length led to increased odds of loud snoring by 1.154. On the other hand, a one unit increase in average airway volume resulted in decreased odds of loud snoring by 0.711. This indicates that patients with loud snoring tend to have longer upper airway length and lower average airway volume, which puts them at increased risk of being diagnosed with OSA [18]. The results from our study supported the claim by Lugaresi that supine position during sleep may cause snoring and mild OSA in patients who have a history of heavy snoring. He claimed that snoring and OSA are two aspects of the same disorder, which may be worsened by abnormally narrow airways [28]. In a study by Woodhead and colleagues, it was also noted that 46% of participants who presented with snoring in their study had a high incidence of OSA [29].
Of the patients with deviated nasal septum, tonsillitis and depression in this study, 50% or more also had significant associations with daytime concentration difficulty, one of the symptoms of OSA, while 100% of the patients with depression also had significant mood changes. Deviated nasal septum and tonsillitis have been found to be related to OSA due to restricted nasal airflow and increased resistance to airflow [30,31]. Mood changes like irritability, depression and anxiety have also been identified in patients who have untreated OSA by previous researchers, which support the results from our study [7,32,33,34]. In addition, daytime concentration difficulty and mood changes also had significant associations with average airway volume and anterior-posterior dimensions of the upper airway. A one unit increase in average airway volume resulted in decreased odds of having concentration difficulty during the day and mood changes by 0.471 and 0.729, respectively; while for every one unit increase in anterior-posterior airway dimensions, odds of having difficulty concentrating during the day and mood changes increased by 2.097 and 1.477, respectively. In other words, patients who have difficulty concentrating during the day or frequent mood changes usually have a smaller average airway volume and bigger anterior-posterior airway dimensions. Smaller average airway volume is one of the indicators of OSA, as stated in a study by Buchanan, although anterior-posterior dimensions tended to be smaller in OSA patients, which differed from our study [18].
Previous clinical studies have also indicated that OSA may be associated with dyslipidemia such as high total cholesterol, high low density lipoprotein (LDL), high triglycerides (TG) and low high density lipoprotein (HDL) [35,36,37,38,39]. However, similar results were not reflected in our study as the analysis showed no significant relationship between high cholesterol and upper airway parameters or OSA symptoms. In a systematic review on common comorbidities associated with OSA, it was found that cancer, GERD and respiratory illnesses such as asthma were associated with OSA. They concluded that these medical comorbidities were frequently found in patients with OSA and appeared to be a potential trigger for poorer prognosis as it may cause chronic organ damage [7,9,39]. Several researchers have evaluated the possible association between allergic rhinitis and OSA and have found both conditions to be closely related due to reduced airway diameter in these patients [40,41,42]. In our study, only ≤10% of the patients had each of the medical condition stated above; hence, the results obtained were not significant as the sample size of each of these medical comorbidities was too small.
There are limitations to this study. The first is due to a modest sample size of patients and, secondly, lack of verification on the information obtained. The patients were selected based on their responses to the questionnaire regarding presence of any positive medical history and this information was not verified with a medical report from each patient. Another limitation was that intra-oral clinical examination was not conducted for these patients in the study. Better identification of risk of developing OSA could have been achieved if clinical findings and CBCT images were correlated with the patients’ medical histories. It is also important to note that this study demonstrated an association between certain medical comorbidities and OSA symptoms with patients at risk of being diagnosed with OSA. However, these patients should be referred to a medical practitioner for polysomnography (PSG) to be properly diagnosed.

5. Conclusions

Much research has been conducted on the relationship between medical comorbidities and risk of developing OSA as the prevalence of patients with OSA increases worldwide. This study demonstrates that hypertensive patients tend to have larger upper airway length, smaller total airway volume and smaller width of upper airway, predisposing them to the risk of developing OSA. Patients with hypertension, heart disease, obesity, deviated nasal septum, tonsillitis and depression experienced OSA symptoms, which were also significant with respect to increased upper airway length and lower average airway volume, increasing the risk of being diagnosed with OSA.
As the prevalence of OSA is increasing, dental practitioners should be equipped with basic knowledge about OSA, including its clinical features and related medical conditions in order to identify patients at risk of developing OSA. From the results obtained through our study, CBCT imaging taken for routine dental treatment, along with patients’ medical comorbidities and OSA symptoms proved to be useful in screening dental patients at risk of developing OSA; thus, early intervention can be provided to such patients.

Author Contributions

All authors (K.Y.L., P.Y.E., S.K. and S.Y.M.) were equally involved in carrying out this study up till its completion. All authors have read and agreed to the published version of the manuscript.

Funding

This study was funded by International Medical University under Project ID No. BDS I-01/2020(13).

Institutional Review Board Statement

This study was approved by the International Medical University (IMU) Research Review Committee.

Informed Consent Statement

Informed consent was obtained from all patients involved in this study.

Data Availability Statement

Data will be made available upon request to experts in the field.

Acknowledgments

This work was performed in fulfilment of requirement of the Special Study Module for the Bachelor of Dentistry Programme. Further, we thank the International Medical University (Malaysia) for taking care of the Article Processing Charge (APC).

Conflicts of Interest

The authors declare that there is no conflict of interest regarding the publication of this article.

References

  1. Slowik, J.M.; Collen, J.F. Obstructive Sleep Apnea; StatPearls Publishing: Treasure Island, FL, USA, 2019.
  2. Lee, W.; Nagubadi, S.; Kryger, M.H.; Mokhlesi, B. Epidemiology of Obstructive Sleep Apnea: A Population-Based Perspective. Expert Rev. Respir. Med. 2008, 2, 349–364. [Google Scholar] [CrossRef] [PubMed] [Green Version]
  3. STOP-Bang Questionnaire. Available online: http://stopbang.ca/osa/screening.php (accessed on 19 October 2020).
  4. Pang, K.P.; Terris, D.J. Screening for obstructive sleep apnea: An evidence-based analysis. Am. J. Otolaryngol. 2006, 27, 112–118. [Google Scholar] [CrossRef] [PubMed]
  5. Calero, E.A.; Escalona, E.E.; Mora, J.M.B.; Carreras, J.M.L.; Reina, E.S. Obstructive Sleep Apnea Syndrome (OSAS). Review of the literature. Med. Oral Patol. Oral Cir. Bucal. 2012, 17, e925–e929. [Google Scholar] [CrossRef] [PubMed]
  6. Schwab, R.J.; Pasirstein, M.; Pierson, R.; Mackley, A.; Hachadoorian, R.; Arens, R.; Maislin, G.; Pack, A.I. Identification of upper airway anatomic risk factors for obstructive sleep apnea with volumetric magnetic resonance imaging. Am. J. Respir. Crit. Care Med. 2003, 168, 522–530. [Google Scholar] [CrossRef]
  7. Pinto, J.A.; Ribeiro, D.K.; Cavallini, A.F.D.S.; Duarte, C.; Freitas, G.S. Comorbidities Associated with Obstructive Sleep Apnea: A Retrospective Study. Int. Arch. Otorhinolaryngol. 2016, 20, 145–150. [Google Scholar] [CrossRef] [Green Version]
  8. Obstructive Sleep Apnea-Sleep Organization. Available online: https://aasm.org/resources/factsheets/sleepapnea.pdf (accessed on 19 October 2020).
  9. Bonsignore, M.R.; Baiamonte, P.; Mazzuca, E.; Castrogiovanni, A.; Marrone, O. Obstructive sleep apnea and comorbidities: A dangerous liaison. Multidiscip. Respir. Med. 2019, 14, 8. [Google Scholar] [CrossRef] [Green Version]
  10. Quan, S.F.; Nowara, W.S. The Role of Dentists in the Diagnosis and Treatment of Obstructive Sleep Apnea: Consensus and Controversy. J. Clin. Sleep Med. 2017, 13, 1117–1119. [Google Scholar] [CrossRef]
  11. Conley, R.S. Evidence for dental and dental specialty treatment of obstructive sleep apnoea. Part 1: The adult OSA patient and Part 2: The paediatric and adolescent patient. J. Oral Rehabil. 2011, 38, 136–156. [Google Scholar] [CrossRef] [Green Version]
  12. Bahammam, A.S. Sleep medicine in Saudi Arabia: Current problems and future challenges. Ann. Thorac. Med. 2011, 6, 3–10. [Google Scholar] [CrossRef]
  13. Mirrakhimov, A.E.; Sooronbaev, T.; Mirrakhimov, E.M. Prevalence of obstructive sleep apnea in Asian adults: A systematic review of the literature. BMC Pulm. Med. 2013, 13, 10. [Google Scholar] [CrossRef] [Green Version]
  14. Lam, B.; Lam, D.C.L.; Ip, M.S.M. Obstructive sleep apnoea in Asia. Int. J. Tuberc. Lung Dis. 2007, 11, 2–11. [Google Scholar] [PubMed]
  15. Mohd, A.K.; Cheong, L.T.; Syed, A.H. Snoring and breathing pauses during sleep in the Malaysian population. Respirology 2007, 12, 375–380. [Google Scholar] [CrossRef]
  16. Comorbidities. Available online: http://stopbang.ca/osa/comorbidities.php (accessed on 11 July 2021).
  17. Symptoms and Signs. Available online: http://stopbang.ca/osa/symptoms.php (accessed on 11 July 2021).
  18. Buchanan, A.; Cohen, R.; Looney, S.; Kalathingal, S.; Rossi, S.D. Cone-beam CT analysis of patients with obstructive sleep apnea compared to normal controls. Imaging Sci. Dent. 2016, 46, 9–16. [Google Scholar] [CrossRef] [PubMed] [Green Version]
  19. Worsnop, C.J.; Naughton, M.T.; Barter, C.E.; Morgan, T.O.; Anderson, A.I.; Pierce, R.J. The Prevalence of Obstructive Sleep Apnea in Hypertensives. Am. J. Respir. Crit. Care Med. 2003, 157, 111–115. [Google Scholar] [CrossRef]
  20. Millman, R.P.; Redline, S.; Carlisle, C.C.; Assaf, A.R.; Levinson, P.D. Daytime hypertension in obstructive sleep apnea. Prevalence and contributing risk factors. Natl. Libr. Med. 1991, 99, 861–866. [Google Scholar] [CrossRef]
  21. Hora, F.; Napolis, L.M.; Daltro, C.; Kodaira, S.K.; Tufik, S.; Togeiro, S.M.; Nery, L.E. Clinical, anthropometric and upper airway anatomic characteristics of obese patients with obstructive sleep apnea syndrome. Natl. Libr. Med. 2007, 74, 517–524. [Google Scholar] [CrossRef]
  22. Enciso, R.; Nguyen, M.; Shigeta, Y.; Ogawa, T.; Clark, G.T. Comparison of CBCT Parameters and Sleep Questionnaires in Sleep Apnea Patients and Controls. Oral Surg. Oral Med. Oral Pathol. Oral Radiol. Endod. 2010, 109, 285–293. [Google Scholar] [CrossRef] [Green Version]
  23. Silverberg, D.S.; Oksenberg, A.; Iaina, A. Sleep related breathing disorders are common contributing factors to the production of essential hypertension but are neglected, underdiagnosed, and undertreated. Am. J. Hypertens. 1997, 10 Pt 1, 1319–1325. [Google Scholar] [CrossRef] [Green Version]
  24. Torre, M.S.; Campos-Rodrigues, F.; Barbe, F. Obstructive sleep apnoea and cardiovascular disease. Lancet Respir. Med. 2013, 1, 61–72. [Google Scholar] [CrossRef]
  25. Gami, A.S.; Caples, S.M.; Somers, V.K. Obesity and obstructive sleep apnea. Endocrinol. Metab. Clin. N. Am. 2003, 32, 869–894. [Google Scholar] [CrossRef]
  26. Abel, R.C.; Caples, S.M.; Jimenez, F.L.; Somers, V.K. Interactions Between Obesity and Obstructive Sleep Apnea. Chest 2010, 137, 711–719. [Google Scholar] [CrossRef] [Green Version]
  27. Jehan, S.; Zizi, F.; Randi-Perumal, S.R.; Wall, S.; Auguste, E.; Myers, A.K.; Jean-Louis, G.; McFarlane, S.I. Obstructive Sleep Apnea and Obesity: Implications for Public Health. Sleep Med. Disord. 2017, 1, 00019. [Google Scholar] [PubMed]
  28. Lugaresi, E.; Cirignotta, F.; Montagna, P. Pathogenic aspects of snoring and obstructive apnea syndrome. Schweiz Med. Wochenschr. 1988, 118, 1333–1337. [Google Scholar] [PubMed]
  29. Woodhead, C.J.; Davies, J.E.; Allen, M.B. Obstructive sleep apnoea in adults presenting with snoring. Clin. Otolaryngol. Allied Sci. 1991, 16, 401–405. [Google Scholar] [CrossRef] [PubMed]
  30. Marc. Deviated Septum and Sleep Apnea: Cause, Diagnosis & Treatment. Available online: https://www.deviatedseptumsurgery.org/related-conditions/deviated-septum-and-sleep-apnea/ (accessed on 10 August 2020).
  31. Andre, D. Obstructive Sleep Apnea Risk May Be Linked to Enlarged Tongue, Tonsillitis. Available online: https://www.belmarrahealth.com/obstructive-sleep-apnea-risk-may-linked-enlarged-tongue-tonsillitis/ (accessed on 10 March 2016).
  32. Knechtle, B.; Economou, N.T.; Nikolaidis, P.T.; Valentza, L.; Kallianos, A.; Steiropoulas, P.; Koutsompolis, D.; Rosemann, T.; Trakada, G. Clinical Characteristics of Obstructive Sleep Apnea in Psychiatric Disease. J. Clin. Med. 2019, 8, 534. [Google Scholar] [CrossRef] [PubMed] [Green Version]
  33. Jackson, M.L.; Howards, M.E.; Barnes, M. Cognition and daytime functioning in sleep-related breathing disorders. Prog. Brain Res. 2011, 190, 53–68. [Google Scholar] [CrossRef]
  34. Sateira, M.J. Update on sleep and psychiatric disorders. Chest 2009, 135, 1370–1379. [Google Scholar] [CrossRef]
  35. Nadeem, R.; Mukesh Nida, M.; Waheed, I.; Khan, A.; Ahmed, S.; Naseem, J.; Champeau, D. Effect of obstructive sleep apnea hypopnea syndrome on lipid profile: A meta-regression analysis. J. Clin. Sleep Med. 2014, 10, 475–489. [Google Scholar] [CrossRef]
  36. Lin, Q.C.; Zhang, X.B.; Chen, G.P.; Huang, D.Y.; Din, H.B.; Tang, A.Z. Obstructive sleep apnea syndrome is associated with some components of metabolic syndrome in nonobese adults. Sleep Breath. 2012, 16, 571–578. [Google Scholar] [CrossRef]
  37. McArdle, N.; Hillman, D.; Beilin, L.; Watts, G. Metabolic risk factors for vascular disease in obstructive sleep apnea: A matched controlled study. Am. J. Respir. Crit. Care Med. 2007, 175, 190–195. [Google Scholar] [CrossRef]
  38. Tan, K.C.B.; Chow, W.S.; Lam, J.C.M.; Lam, B.; Wong, W.K.; Tam, S.; Ip, M.S. HDL dysfunction in obstructive sleep apnea. Atherosclerosis 2006, 184, 377–382. [Google Scholar] [CrossRef] [PubMed]
  39. Prasad, B.; Nyenhuis, S.M.; Weaver, T.E. Obstructive sleep apnea and asthma: Associations and treatment implications. Sleep Med. Rev. 2014, 18, 165–171. [Google Scholar] [CrossRef] [PubMed]
  40. Zheng, M.; Wang, X.; Zhang, L. Association between allergic and nonallergic rhinitis and obstructive sleep apnea. Curr. Opin. Allergy Clin. Immunol. 2018, 18, 16–25. [Google Scholar] [CrossRef] [PubMed]
  41. Chirakalwasan, N.; Ruxrungtham, K. The linkage of allergic rhinitis and obstructive sleep apnea. Asian Pac. J. Allergy Immunol. 2014, 32, 276–286. [Google Scholar]
  42. Michels, D.S.; Rodrigues, A.M.S.; Nakanishi, M.; Sampaio, A.L.L.; Venosa, A.R. Nasal Involvement in Obstructive Sleep Apnea Syndrome. Int. J. Otolaryngol. 2014, 2014, 717419. [Google Scholar] [CrossRef]
Figure 1. Questions regarding history of any OSA symptoms.
Clinpract 12 00034 g001
Figure 2. Questions regarding past medical history.
Clinpract 12 00034 g002
Figure 3. Sagittal view of the oropharynx region, isolating the region from the posterior nasal spine (PNS) to cervical vertebrae C2. The total length, total airway volume of the oropharynx and average airway volume of the oropharynx were measured. Yellow circle represents the narrowest portion of the upper airway.
Clinpract 12 00034 g003
Figure 4. Measurement of anterior-posterior dimension (yellow) and width (blue) of the narrowest axial slice of the upper airway.
Clinpract 12 00034 g004
Figure 5. Sagittal view of the upper airway of a patient without hypertension.
Clinpract 12 00034 g005
Figure 6. Narrowest axial portion of the upper airway of a patient without hypertension.
Clinpract 12 00034 g006
Figure 7. Sagittal view of the upper airway in a hypertensive patient.
Clinpract 12 00034 g007
Figure 8. Narrowest axial portion of the upper airway in a hypertensive patient.
Clinpract 12 00034 g008
Table 1. Frequency distribution of gender, age, race of the patients, medical comorbidities and OSA symptoms.
FactorFrequencyPercentage (%)
Gender
Male4645.5
Female5554.5
Age
18–27 years old3332.7
28–37 years old2423.8
38–47 years old1110.9
48–57 years old1110.9
58–67 years old1615.8
68–77 years old65.9
Race
Malay1110.9
Chinese7675.2
Indian98.9
Others55.0
Medical Comorbidities
Hypertension1615.8
High Cholesterol109.9
Heart Disease22.0
Diabetes65.9
Asthma65.9
GERD22.0
Cancer44.0
Depression33.0
Deviated Nasal Septum33.0
Tonsillitis65.9
Allergic Rhinitis98.9
Obesity98.9
OSA Symptoms
Excessive Daytime Sleepiness3736.6
Loud Snoring5756.4
Stopped Breathing During Sleep44.0
Sudden Awakening from Sleep with Gasping & Choking76.9
Awakening with Dry Mouth/Sore Throat3332.7
Morning Headache1211.9
Difficulty Concentrating During Daytime1413.9
Mood Changes1817.8
Night Sweat44.0
Decreased Sex Drive76.9
Table 2. Frequency distribution of medical comorbidities with OSA symptoms.
Excessive Daytime SleepinessLoud SnoringStopped Breathing during SleepSudden Awakening from Sleep with Gasping & ChokingAwakening with Dry Mouth/Sore Throat
Hypertension9 (56.3%)7 (43.8%)1 (6.3%)1 (6.3%)5 (31.3%)
High Cholesterol5 (50.0%)4 (40.0%)1 (10.0%)02 (20.0%)
Heart Disease1 (50.0%)2 (100.0%)01 (50.0%)2 (100.0%)
Diabetes4 (66.7%)2 (33.3%)1 (16.7%)03 (50.0%)
Asthma2 (33.3%)1 (16.7%)01 (16.7%)0
GERD1 (50.0%)1 (50.0%)001 (50.0%)
Cancer2 (50.0%)1 (25.0%)003 (75.0%)
Depression2 (66.7%)1 (33.3%)01 (33.3%)3 (100.0%)
Deviated Nasal Septum2 (66.7%)1 (33.3%)1 (33.3%)1 (33.3%)3 (100.0%)
Tonsillitis 3 (50.0%)1 (16.7%)01 (16.7%)4 (66.7%)
Allergic Rhinitis2 (22.2%)1 (11.1%)02 (22.2%)2 (22.2%)
Obesity3 (33.3%)5 (55.6%)002 (22.2%)
Morning HeadacheDifficulty Concentrating during DaytimeMood ChangesNight SweatDecreased Sex Drive
Hypertension2 (12.5%)2 (12.5%)2 (12.5%)1 (6.3%)1 (6.3%)
High Cholesterol1 (10.0%)2 (20.0%)2 (20.0%)1 (10.0%)1 (10.0%)
Heart Disease00000
Diabetes1 (16.7%)2 (33.3%)1 (16.7%)1 (16.7%)0
Asthma00000
GERD00000
Cancer01 (25.0%)1 (25.0%)1 (25.0%)0
Depression1 (33.3%)2 (66.7%)3 (100%)1 (33.3%)1 (33.3%)
Deviated Nasal Septum3 (100.0%)2 (66.7%)1 (33.3%)00
Tonsillitis3 (50.0%)3 (50.0%)3 (50.0%)01 (16.7%)
Allergic Rhinitis3 (33.3%)3 (33.3%)3 (33.3%)01 (11.1%)
Obesity1 (11.1%)2 (22.2%)2 (22.2%)1 (11.1%)1 (11.1%)
Abbreviations: GERD: Gastroesophageal Reflux Disease.
Table 3. Descriptive statistics of upper airway dimension as measured by CBCT imaging.
NMinimumMaximumMeanStd. Deviation
Length (mm)10129.9355.7542.636.24
Total volume (cm3)10194.58173.45131.6717.91
Average volume (cm3)1013.3432.0911.105.21
Antero-posterior (mm)1011.0014.506.443.19
Width (mm)1018.0037.0021.696.54
Valid N (listwise)101
Table 4. Logistic regression analysis between medical comorbidities and upper airway dimensions.
Length (mm)Total Volume (cm3)Average Volume (cm3)Anterior-Posterior (mm)Width (mm)
HypertensionOdds Ratio1.3410.8961.158- *0.781
95% CI1.056–1.7050.819–0.9800.893–1.503- *0.648–0.942
p-value0.0160.0170.269- *0.010
High Cholesterol Odds Ratio1.0770.9651.0771.0220.960
95% CI0.848–1.3670.891–1.0460.798–1.4530.744–1.4030.799–1.155
p-value0.5440.3830.6280.8940.668
Heart DiseaseOdds Ratio2.0830.7281.3000.9710.837
95% CI0.858–5.0570.519–1.0200.539–3.1360.338–2.7860.515–1.361
p-value0.1050.0650.5590.9560.473
DiabetesOdds Ratio1.1630.9191.1770.9180.845
95% CI0.834–1.6220.816–1.0350.762–1.8150.595–1.4150.659–1.085
p-value0.3730.1650.4630.6970.186
AsthmaOdds Ratio0.8411.0471.2970.9410.770
95% CI0.619–1.1420.951–1.1530.856–1.9640.632–1.4020.585–1.014
p-value0.2670.3470.2190.7660.062
GERDOdds Ratio22.0340.2710.0000.0000.766
95% CI0.000–2.5840.000–1.0200.0000.0000.000
p-value0.9900.9920.9930.9821.000
CancerOdds Ratio1.6940.8221.4130.7350.778
95% CI0.966–2.9710.671–1.0060.789–2.5280.403–1.3410.540–1.122
p-value0.0660.0580.2450.3160.179
DepressionOdds Ratio1.0530.9930.6931.3521.124
95% CI0.693–1.5990.870–1.1330.342–1.4020.770–2.3720.795–1.589
p-value0.8100.9180.3080.2940.507
Deviated Nasal SeptumOdds Ratio1.0390.9920.6371.5021.189
95% CI0.674–1.5990.865–1.1390.310–1.3070.847–2.6630.831–1.702
p-value0.8640.9140.2190.1640.344
TonsillitisOdds Ratio1.1241.0200.6711.1901.023
95% CI0.829–1.5230.932–1.1150.365–1.2310.750–1.8890.770–1.358
p-value0.4510.6680.1970.4610.876
Allergic RhinitisOdds Ratio0.8511.0290.8461.1991.112
95% CI0.655–1.1060.951–1.1130.577–1.2410.846–1.6980.903–1.368
p-value0.2270.4770.3920.3080.318
ObesityOdds Ratio1.1750.9531.0421.0860.792
95% CI0.876–1.5770.864–1.0510.687–1.5810.745–1.5830.619–1.014
p-value0.2820.3330.8450.6690.899
* Linearity of independent variables and log odds not achieved; hence, results obtained are not valid. Significant associations: p ≤ 0.05 and if 1 does not fall between lower bound and upper bound of CI are bold. Abbreviations: CI: Confidence Interval; GERD: Gastroesophageal Reflux Disease.
Table 5. Logistic regression analysis between OSA symptoms and upper airway dimensions.
Length (mm) Total Volume (cm3)Average Volume (cm3)Anterior-Posterior (mm)Width (mm)
Excessive Daytime SleepinessOdds Ratio1.1590.9790.8431.2431.010
95% CI0.998–1.3450.934–1.0260.679–1.0451.008–1.5330.893–1.142
p-value0.0530.3730.1180.0420.877
Loud SnoringOdds Ratio1.154- *0.7110.9081.052
95% CI1.022–1.304- *0.515–0.9800.692–1.1910.897–1.233
p-value0.021- *0.0370.4840.532
Observed episodes of breathing stopping during sleepOdds Ratio1.1180.9970.6261.0181.185
95% CI0.806–1.5510.901–1.1030.319–1.2310.582–1.7800.887–1.584
p-value0.5040.9550.1750.9500.251
Abrupt awakening from sleep accompanied by gasping or chokingOdds Ratio0.9851.0530.8401.0571.111
95% CI0.764–1.2690.9760.557–1.2670.723–1.5450.876–1.409
p-value0.9061.1370.4060.7750.386
Awakening with a dry mouth or sore throatOdds Ratio1.1190.9820.928- *1.029
95% CI0.976–1.2830.937–1.0300.791–1.089- *0.917–1.155
p-value0.1070.4580.362- *0.627
Morning headacheOdds Ratio1.1080.9880.7961.3331.118
95% CI0.889–1.3820.921–1.0590.579–1.0950.971–1.8280.929–1.344
p-value0.3610.7330.1610.0750.237
Difficulty concentrating during the dayOdds Ratio1.2751.0140.4712.0971.252
95% CI0.994–1.6370.945–1.0890.291–0.7651.358–3.2380.995–1.576
p-value0.0560.6960.002<0.0010.056
Mood changesOdds Ratio1.1011.0150.7291.4771.133
95% CI0.912–1.3300.958–1.0750.542–0.9801.103–1.9790.960–1.339
p-value0.3160.6190.0360.0090.141
Night-time sweatingOdds Ratio1.4210.9160.5331.5991.160
95% CI0.872–2.3160.786–1.0670.245–1.1590.871–2.9370.847–1.588
p-value0.1580.2600.1120.1300.356
Decreased sex driveOdds Ratio1.1430.9640.6471.5001.144
95% CI0.841–1.5520.873–1.0640.392–1.0660.995–2.2610.899–1.457
p-value0.3930.4660.0870.0530.274
* Linearity of independent variables and log odds not achieved; hence, the results obtained are not valid. Significant associations: p ≤ 0.05 and if 1 does not fall between lower bound and upper bound of CI are bold.
Table 6. Fisher’s exact test (p-value) between medical comorbidities and OSA symptoms.
Excessive Daytime SleepinessLoud SnoringStopped Breathing During SleepSudden Awakening from Sleep with Gasping & ChokingAwakening with Dry Mouth/Sore Throat
Hypertension0.0930.0160.5041.0001.000
High Cholesterol0.4910.1060.3451.0000.492
Heart Disease1.0000.0381.0000.1340.105
Diabetes0.1880.3400.2201.0000.389
Asthma1.0001.0001.0000.3580.174
GERD1.0000.3581.0001.0000.549
Cancer0.6221.0001.0001.0000.101
Depression0.5520.4881.0000.1960.033
Deviated Nasal Septum0.5520.4880.1150.1960.033
Tonsillitis 0.6661.0001.0000.3580.087
Allergic Rhinitis0.4800.6841.0000.1180.714
Obesity1.0000.0141.0001.0000.714
Morning HeadacheDifficulty Concentrating during DaytimeMood ChangesNight SweatDecreased Sex Drive
Hypertension1.0001.0000.7300.5041.000
High Cholesterol1.0000.6261.0000.3450.529
Heart Disease1.0001.0001.0001.0001.000
Diabetes0.5410.1931.0000.2201.000
Asthma1.0000.5920.5881.0001.000
GERD1.0001.0001.0001.0001.000
Cancer1.0000.4550.5500.1511.000
Depression0.3190.0500.0050.1150.196
Deviated Nasal Septum0.0010.0500.4491.0001.000
Tonsillitis0.0210.0340.0681.0000.358
Allergic Rhinitis0.0720.1080.1981.0000.491
Obesity1.0000.6080.6600.3160.491
Significant associations (p ≤ 0.05) are bold. Abbreviations: GERD: Gastroesophageal Reflux Disease.
Publisher’s Note: MDPI stays neutral with regard to jurisdictional claims in published maps and institutional affiliations.

