Article

Linkage-Based Frameworks for Sustainability Assessment: Making a Case for Driving Force-Pressure-State-Exposure-Effect-Action (DPSEEA) Frameworks

Faculty of Engineering and Applied Science, Memorial University, St. John’s, Newfoundland, A1B 3X5, Canada
*
Author to whom correspondence should be addressed.
Sustainability 2009, 1(3), 441-463; https://0-doi-org.brum.beds.ac.uk/10.3390/su1030441
Submission received: 18 June 2009 / Accepted: 5 August 2009 / Published: 10 August 2009
(This article belongs to the Special Issue Advanced Forum for Sustainable Development)

Abstract

:
The main objective of this paper is to discuss different approaches, identify challenges, and to select a framework for delivering effective sustainability assessments.Sustainable development is an idealistic concept and its assessment has always been a challenge. Several approaches, methodologies and conceptual frameworks have been developed in various disciplines, ranging from engineering to business and to policy making. The paper focuses mainly on various linkage-based frameworks and demonstrates that the driving force-state-exposure-effect-action (DPSEEA) framework can be used to achieve sustained health benefits and environmental protection in accordance with the principles of sustainable development, especially because of its resemblance to the environmental risk assessment and management paradigms. The comparison of linkage-based frameworks is demonstrated through an example of sustainability in a higher educational institution.

Graphical Abstract

1. Introduction

1.1. Definition

The main objective of this paper is to provide an overview of different approaches, identify challenges, and to select a framework for delivering effective sustainability assessments. Sustainable development aims to meet human needs while preserving the natural environment so that these needs can be met not only in the present but also indefinitely in the future. Since the aftermath of the Brundtland report in 1987, sustainable development has offered the world a new perspective on how to protect environmental systems for the present as well as for the future generations. The Brundtland Commission, named after former Norwegian Prime Minister Harlem Brundtland, originally proposed the most oft-used definition of sustainability that states development that meets the needs of the present without compromising the ability of future generations to meet their own needs [1].
The above definition provides the basis for the “sustainable development” paradigm in various economies at various levels, and implicitly argues for the rights of future generations to raw materials (natural resources) and to vital ecosystem services. This universally accepted concept has permeated into various disciplines and is widely adopted and (or) encouraged by many organizations (e.g., [2]). Much has been written about principles or concepts of sustainability [2,3,4], however, the seven key concepts identified by Jabareen [5] to synthesize and assemble the theoretical framework for sustainable development are presented here. These seven concepts include equity, natural capital stock, utopia, eco-form, integrative management, global agenda, and ethical paradoxes. Each concept represents distinctive meanings that provide the theoretical foundations of sustainability as follows:
Equity represents the social aspect of sustainable development. The most common types of equity are inter- and intra-generational. Intra-generational equity refers to fairness in allocation of resources between competing interests at the present time. Inter-generational equity refers to the fairness in allocation of resources between current and future generations.
Natural capital stock represents the sustaining of natural material assets development where natural capital stock consists of three categories: non-renewable resources, such as mineral resources; the finite capacity of the natural system to produce ‘renewable resources’ such as food crops and water supplies; and the capacity of natural systems to absorb the emissions and pollutants that arise from human actions without suffering from side effects which imply heavy costs to be passed onto future generations. The condition of constant natural capital is normally termed ‘strong sustainability’. This concept is discussed later.
The concept of Utopianism represents a perfect society, where there is harmony between humans and nature, justice prevails, people are perfectly happy and content, life moves along smoothly without shortages.
The concept of Eco-form is one of the major contributors in bringing the global discourse on sustainability, and it deals with ecological design and form of human habitats such as the ecologically desired spatial form of cities, villages, and neighborhoods.
Integrative and holistic management represents a holistic view of social development, economic growth, and environmental protection. To preserve the natural capital stock for ecological and sustainable integrity, integrative and holistic management is essential.
Global political discourse means that political agenda has become one of the main drivers of sustainability as all major policies and programs around the globe are inspired by sustainability since 1990s.
Ethical paradoxes in sustainable development mean (1) characteristics of a state that can be maintained forever and (2) development or environmental modifications that intervene with nature and natural resources. The concept aims to mitigate and moderate the paradox between the two.
The central focus of sustainability is to provide a long-term performance. All above concepts aim to increase the quality of life for humans and other ecological entities, enhance economic activities, and reduce the impacts on ecological systems with special emphasis on major global problems like climate change, depletion of fossil fuels, emerging technologies, genetically modified food, and spread of diseases [3,6,7]. These concepts ensure that all developments must be undertaken with great sensitivity to avoid/minimize environmental impacts; therefore all possible alternatives must be considered comprehensively.

1.2. Sustainable Development

It has been argued by Becker [3] and Sahely et al. [6] that “sustainable development” is about achieving a balance among three objectives or dimensions—environmental, economic, and social—over time and spatial horizons. However, it is emphasized by AwwaRF and CSIRO [2] and Gibson [4] that sustainable development deals with enviro-socio-economic issues of inter- and intra-generations in a holistic way and should not be considered as an add-on to the existing management systems of organizations as it requires stewardship of all resources. The reason is if we focus on any single objective or dimension alone while deciding on least burdening practices, it will allow all other effects to grow unchecked. As a result burdens can merely shift from one effect to another effect, instead of an overall desirable decrease of burdens.
Sustainability paradigm requires multidisciplinary actions and involvements of all stakeholders in the decision making process [8]. Sustainability implies paying attention to comprehensive outcomes of events and actions as far as they can be anticipated at present. This is known as “environmental accounting”. This kind of accounting assumes that all aspects of a system can be measured and audited. Environmental accounting can be a limited biological interpretation as the case for “ecological footprint analysis”, or may include social factors as in the case of Triple Bottom Line (TBL) analysis. TBL is about identifying improvement in the environment, social, and economic performance as a result of short- and long-term policy decisions. In TBL analysis, the environment relates to the impacts of policy decisions on the natural environment (e.g., natural resources, flora, and fauna); economy relates to the impacts on financial sustainability, and society relates to impact on the community as a whole (e.g., public health and safety, social equity, culture).
The concept of sustainability can be defined as “weak” or “strong”. In case of weak sustainability, it is assumed that we can replace (or duplicate) natural materials and services with manufactured goods and services. This is also known as substitutability paradigm, whereas in case of strong sustainability it is assumed that the natural materials and services cannot be duplicated or natural capital stays constant over time [9] as mentioned earlier in the natural capital stock concept in the previous section. Strong sustainability is also known as non-substitutability paradigm. The problem with the concept of weak sustainability is that one can easily assign a monetary value to the manufactured goods, however assigning a monetary value to the natural materials and services can be very difficult or impossible. Similarly, ozone layer, wetland, ocean fishery, and a river full of salmon are irreplaceable. To further elaborate consider a case where one has to determine the worth of a forest full of trees. One way is to assign a monetary value to all trees by assuming that they are turned into furniture or paper. However, the forest provides a home for wildlife that provides food for hunters. It also provides a place for hikers to enjoy the natural environment. These intangible benefits are not possible to be duplicated by any monetary value. Contrarily, the concept of strong sustainability emphasizes on functions that only nature (environment) can perform and cannot be duplicated by humans. The ozone layer is one example of an ecosystem service that is difficult for humans to duplicate.
Sustainability assessment is an emerging concept and one of the typical questions raised by sustainable assessment is that how do we measure sustainability? The following section explains these questions in more detail.

2. Sustainability Metrics

Quantitative measurement and assessment of sustainability has always been a challenge. Sustainability assessments may require various tiers of information that may include objectives, assessment criteria, indices, indicators, and performance data/variables/parameters (Table 1). The objectives describe the broad goals set by the decision-makers and by the public or by the user of the service. Major sustainability objectives are generally set by TBL i.e., environment, social, and economic performance. Assessment criteria, sometimes also referred to as “indices” or “indicators” provide principles to establish that specified objectives have been met. Assessment criteria provide yardsticks against which sustainability objectives are measured. Various assessment criteria can be identified, depending on the context and the level of the study. For example, in any engineering project, health, safety, economic development, social equity, environmental quality, ecology, and technical feasibility can be major assessment criteria.
There are two approaches to define performance assessment criteria, i.e., a bottom-up approach and a top-down approach [4]. In the bottom-up approach, the objectives are defined in relation to the baseline conditions. In other words, criteria are generated by assuming that the state of sustainability can be defined by environmental, social, and economic objectives and proposed criteria are developed under these categories. For example, environment is a category and resource utilization is a proposed criteria. Triple bottom line is considered a bottom-up approach. On the other hand, a top-down approach assumes sustainability as a state to which society aspires, and then moves on to define this state in terms of sustainability criteria. Top-down approach is also called principles-based approach in which assessment criteria are derived from sustainability principles [10]. For instance, under sustainability principle of biodiversity and ecological integrity criteria, it should improve biodiversity and ecological integrity and builds life support. It is argued by Gibson [4] and Pope et al. [10] that the top-down or principles-based approach outweighs the bottom-up or TBL approach as it emphasizes interconnections and interdependencies between the sustainability dimensions rather than promoting conflicts and trade-offs, besides avoiding some of the inherent limitations of the TBL approach to sustainability. However, literature review shows that extensive research has been done using both approaches (e.g., urban infrastructure systems [6] and river basin management [11]).
Table 1. Sustainability matrices–an example in terms of TBL objectives.
Data/VariablesIndicatorsIndicesPerformance assessment criteria (C)Objectives (O)
Environment (O1)Economics (O2)Society (O3)
Basic data that can be directly measured or monitored.Each performance indicator derived from aggregation of various basic parametersEach performance criteria derived from aggregation of various indicatorsHealth (C1)
Safety (C2)
Economic development (C3)
Social equity (C4)
Environmental quality (C5)
Ecology (C6)
Technical feasibility (C7)
* indicates the possible relationship between a given criterion and objective
Performance indicators/indices are derived from variables as they measure the effectiveness of a decision in satisfying the assessment criteria. They can refer to the context, conditions, means, activities or performance. Indicators are useful for monitoring and measuring the state of environment by considering a manageable number of variables or characteristics. Performance indicators can be single valued (i.e., derived from one variable) or composite (i.e., obtained by the aggregation of two or more variables). Indicators can also be based on quantitative or qualitative performance data. Indicators, especially environmental, could be (i) use-based (early warning), subject- or issue-based (water quality, noise pollution), and position-based as in linkage-based frameworks described later in this paper [12]. Aggregation is required to combine performance variables and derive indicators/indices using multi-criteria decision-making techniques such as weighted averaging, AHP (analytic hierarchy process), and ordered weighted averaging (OWA). The intention of aggregation is to simplify the presentation and provide realistic interpretation of a large number of performance variables in an effective manner.
Alegre [13] listed the basic characteristics of performance indicators/indices as:
encompassing all relevant aspects of sustainability performance
non-overlapping (i.e., mutually exclusive)
easy to understand and interpret
as few in numbers as possible
verifiable
defined for a given time period, and
universal enough to be measured in diverse conditions.
If the chosen indicators are not relevant and hard to measure or monitor, it leads to erroneous analyses and conclusions. Extensive lists of indicators for sustainability measurement have been provided in several studies related to the planning and management at urban, regional, and national levels (e.g., [14,15,16,17]). Edwin [18] explored the challenge of choosing appropriate indicators to measure environmental progress in the automotive industry. The author proposed two main challenges: (1) developing and evaluating appropriate normalized and functionally related indicators, and (2) integrating indicators into the design and decision process (using multi-objective approaches). The author found that the use of multi-objective decision-making could be problematic in sustainability assessment, if the indicators are not comparable or not fully applicable.
In the last decade, several attempts have been made to create aggregate measures for various aspects of sustainability by using indices to convey better information on countries and corporate performance in fields such as environment, economy, society, or for technological improvement. Some of the most prominent attempts include: Human Development Index (HDI) of the United Nations Development Programme (UNDP); Environmental Sustainability Index (ESI) and the Environmental Performance Index (EPI) of the World Economic Forum (WEF). Singh et al. [19] have provided a detailed overview of various sustainability indices applied in policy practice. A summarized version of their work indicating broad classification of indices and categories is presented in Table 2. However, many special categories of environmental indices like air quality index and water quality index are not discussed here.
Table 2. Summary of sustainability indices (modified after [19]).
AreasName of Index ApproachCategories
Innovative, knowledge and technology indicesSummary innovation index
  • Human resources
  • Knowledge creation
  • Transmission and application of new knowledge
  • Innovation finance
Development indicesHuman development index (HDI)
  • Health
  • Knowledge
  • GDP per capita
Index of sustainable and economic welfare
  • Economics
  • Human Welfare
Market and economy-based indicesGreen Net National Product (EDP) and System of integrated Environmental and Economic Accounting (SEEA)
  • Natural resources
  • Economics
  • Environment state, pressure and destruction
Eco-system based indicesSustainability performance index (SPI)
  • Technical
  • Ecological
  • Human resources
Eco-index methodology
  • Economics
  • Life cycle impact data
Living Planet index
  • Biodiversity
  • Ecosystem
Ecological Footprint (EF)
  • Natural resources
  • National consumption
Composite sustainability performance indices for industriesComposite Sustainable Development Index
  • Economics
  • Environment
  • Social performance
Composite Sustainability Performance index
  • Corporate citizenship
  • Environment
  • Economics
G score method
  • Voluntary environment
  • Health
  • Safety
ITT Flgyt Sustainability Index
  • Corporate contribution
  • Sustainable policies and commitment
Product-based sustainability indicesLife Cycle Index (LInx)
  • Environment
  • Cost
  • Technology
  • Socio-political
Environmental indices for policies, nations and regionsEnvironmental Sustainability Index
  • Environmental systems
  • Stresses
  • Human vulnerability
  • Societal and institutional capacity
  • Global steward ship
Environmental Quality Index
  • Environmental factors
Environmental Performance Index
  • 6 policy categories
Environmental Vulnerability Index
  • Hazards
  • Resistance
  • Damage measurement
Environmental indices for industriesEco-indicator 99
  • Human health
  • Ecosystem quality
  • Resources, minerals and fossil fuels
Green Pro-1 [20-21]
  • Environmental
  • Technological
  • Economical

3. Sustainability Assessment Frameworks

Since sustainable development became a catchphrase in the international arena, several approaches and conceptual frameworks have been proposed and developed in various disciplines, ranging from engineering to business and to policy making. Each of these frameworks has limited capability to deal with different issues of sustainability comprehensively and lack flexibility to be used in various disciplines with a unified interpretation. The schemes to classify various sustainability frameworks may also vary, e.g., based on application discipline, methodology, mathematical techniques and tools, and the level of study. In engineering literature [6,8,22], sustainability assessment is generally viewed as a multi-objective optimization or multi-criteria decision-making problem. Based on detailed literature search (e.g., [2,22,23]), we have classified the sustainability assessment frameworks into following six categories:
Objective-based (e.g., strategic environmental assessment (SEA))
Impact-based (e.g., environmental impact assessment (EIA), sustainability impact assessment (SIA), TBL assessment)
Influence-based (e.g., Transport Canada framework [24])
Process-based or stakeholder-based (e.g., USDOE “Ten Steps to Sustainability” [25])
Material flow accounting and Life cycle assessment (e.g., LInX [26])
Linkages-based (e.g., pressure-state-response (PSR), driving force-pressure-state-impact-response ( DPSIR))
A majority of the above frameworks were developed in the last 10 to 20 years and did not evolve beyond the experimental stage [27]. The main features of these frameworks include 1) setting objectives and assessment criteria based on the principles of sustainability, and 2) defining a set of measurable indicators under each assessment criterion. Various multi-criteria decision-making methods have been used for aggregating, ranking alternatives, and carrying out assessment process with a group of stakeholders [2].
Sustainability assessment frameworks help to focus and clarify what to measure, what to expect from measurement and what kind of indicators to use. A framework serves, at a high-level, direct reference to the basic concepts of sustainable development. Underlying any sustainable development framework is usually a conceptual model that helps identify and organize the issues that will define what should be measured. The main differences among frameworks are the way in which they conceptualize the main dimensions of sustainable development, the inter-linkages between these dimensions, the way they group the issues to be measured, and the concepts by which they justify the selection and aggregation of indicators. Table 3 provides a brief overview and main features of the above frameworks.

3.1. Objective-Based Frameworks

Objective-based frameworks have a proactive approach, and aim to ensure that a particular initiative contributes to a defined state of sustainability. Defining a sustainable state is a challenge. This approach can assess the extent to which an initiative contributes to a defined goal. The majority of the current frameworks, such as strategic environmental assessment (SEA) and life cycle assessment, are objective based and proactive in nature.

3.2. Impact-Based Frameworks

As the name suggests, the impact-based frameworks focus on the impacts of various actions on the sustainability of a particular system. It is a win-lose scenario. A typical example is environmental impact assessment (EIA) driven sustainability assessment, often referred to as sustainability impact assessment (SIA). It means that an initiative may have positive outcomes in one dimension of sustainability, such as economic performance, but negative results in social or environmental dimensions. Defining permissible or threshold limits can minimize the adverse situations. This framework has been used in various engineering disciplines such as transportation [21,28]; water and sewer systems [29]; building infrastructure [30]. Hacking and Guthrie [31] have reported that both EIA and SEA are established frameworks for sustainability assessment. A matrix has been developed by Pope et al. [10] that compares objective-based and impact-based frameworks against aim, focus, and contribution to sustainability and target limitations.
A common impact-based framework is three-dimensional framework of indicators based on environment, economics, and social impacts. It is known as triple-bottom line (TBL) framework. Pope et al. [10] considered that TBL employs a reductionist approach to sustainability, which divides the holistic concept of sustainability into three pillars and invariably runs the risk of the sum of the parts being less than the whole. This is particularly true if the interrelations between the three pillars are not adequately understood and described. Some analysts also tried to add technical and/or institutional dimensions in sustainability (e.g., [26]). Many initiatives undertaken by various institutions using this framework are provided in [23]. It has been observed that when sustainability problems are divided into dimensions, it is much easier to use multi-criteria decision-making methods for sustainability assessment (e.g., [6]).
Table 3. Main features of sustainability frameworks.
FrameworksMain Features
Objective-based
  • Proactive framework
  • Ensures that a particular initiative contributes to a defined state of sustainability
  • Form a part of majority of present frameworks (for example, strategic environmental assessment (SEA))
Impact-based
  • Reactive in nature
  • Reductionist approach to sustainability
  • Focuses on the impacts of various actions on sustainability of particular system
  • Typical example is triple-bottom line (TBL) analysis (e.g., Global reporting initiative with five dimensions, UN-CSD with four dimensions. Also used in various engineering discipline, e.g., Transportation [21, 28]; water and sewer system [29]; building infrastructure [30]
Influence-based
  • Indicators categorized by their level of influence on sustainability of an organization or institution
  • Used by Transport Canada [24]
Process/stakeholder-based
  • Involves extensive planning process that engages stakeholders
  • Used for developing consensus [25]
  • Extensively used for planning involving community projects
Material flow assessment/Life cycle assessment
  • Material exchanges between economy and natural environment
  • Cradle to grave (or gate) assessment of environmental impacts
  • Commonly used in chemical industry [26]
Linkage-based
  • Uses concept of causality (cause-effect) [22]
  • Different forms include pressure-state-response (PSR), driving force-pressure-state-impact-response (DPSIR), driving force-pressure-state-exposure-effect-action (DPSEEA)
  • Can be tied to sustainability through certain assumptions

3.3. Influence-Based Frameworks

Influence-based frameworks categorize indicators based on their level of influence on sustainability. This framework is used by Transport Canada [24]. These frameworks identify three levels of basic indicators, namely, state, behavioral, and operational [22]. “State” indicators define the overall vision for obtaining sustainable system and measure the performance of the system against goals or vision. “Behavioral” indicators relate to the activities of the actors or stakeholders whose actions influence the state of the system. “Operational” indicators correspond to the actions of the organization itself.

3.4. Process- or Stakeholder-Based Frameworks

A process-based framework involves a planning process that effectively engages stakeholders in creating their vision for sustainability. Environmental sustainability kit proposed by Environmental Defense [25] explains that process-based frameworks are based on a decision aiding process for developing consensus, involving all the representatives from various constituencies within a community. Jeon et al. [22] suggested that the involvement of stakeholders is essential when the planning for communities is being undertaken or when incorporating sustainability into local policy (e.g., Environmental Sustainability kit [25]. This is indeed an important and critical component to achieve sustainability objectives.
Sustainable development initiatives at various university campuses around the world also use this framework, as the involvement of various stakeholders is a major component of these sustainability initiatives (such as the Talloires Declaration [31]). Velazquez et al. [32] have proposed models that offer a clear perspective about how people responsible for sustainability initiatives affect collective behavioral change by educating stakeholders and promoting consensus-based sustainability goals for sustainable institutions such as universities.

3.5. Material Flow/Accounting and Life Cycle Assessment Framework

Material flow analysis is a framework to analyze the flows of a material in a well-defined system. It is referred to as Material Flow Accounting (MFA) when performed on a national or regional scale. In this framework the material exchanges between an economy and natural environment are analyzed. Indicators and indices are calculated to assess the level of resource intensity of the system and processes are optimized in such a way that materials and energy are used in the most efficient manner [34]. The basic mantra is to focus on producing more with less.
The Life Cycle Assessment (LCA) framework is one step further to MFA as it uses the same principles but also tries to account for the environmental impacts of a technology, product, process, project or a service throughout their life cycles from raw materials extraction through end of life. Therefore, it is also referred to as cradle to grave (sometimes cradle to gate) approach [34,35]. It comprises four steps [26,36]:
Define goal and scope helps to understand the purpose and the scope of the study and requires using system boundaries.
Inventory analysis accounts for energy and raw material and discharges from all activities, products, and processes.
Impact analysis determines the environmental impacts due to activities, products, and processes.
Improvement assessment identifies the possibilities for improving the performance of the system.
Khan et al. [26] developed a new indexing system LInX, which aims to facilitate the LCA application in process and product evaluation and decision-making. The LInX consists of four categories/dimensions, namely, environment, health and safety, cost, technical feasibility, and socio-political factors.
Another nuance of LCA, called Life Cycle Costing (LCC) is a method used in multi-criteria decision-making, when the monetary values are assigned to various activities in LCA. The discussion on this topic is beyond the scope of this paper.

3.6. Linkage-Based Frameworks

The linkage-based frameworks use the concept of “causality” or cause-effect relationships. These frameworks provide linkages between each component of the framework by defining indicators for each component and recognizing effective actions to control and prevent the impacts. Three types of linkage-based frameworks are discussed in detail in the next section.

4. Types of Linkage-Based Frameworks

A widely known example of a linkage-based framework is the Pressure-State-Response (PSR) framework. This framework can facilitate better understanding of actions and activities that are affecting the state of the system, and appropriate response for addressing them both for the agency and stakeholders [22]. In addition to PSR, other common linkage-based frameworks are DPSIR and DPSEEA.

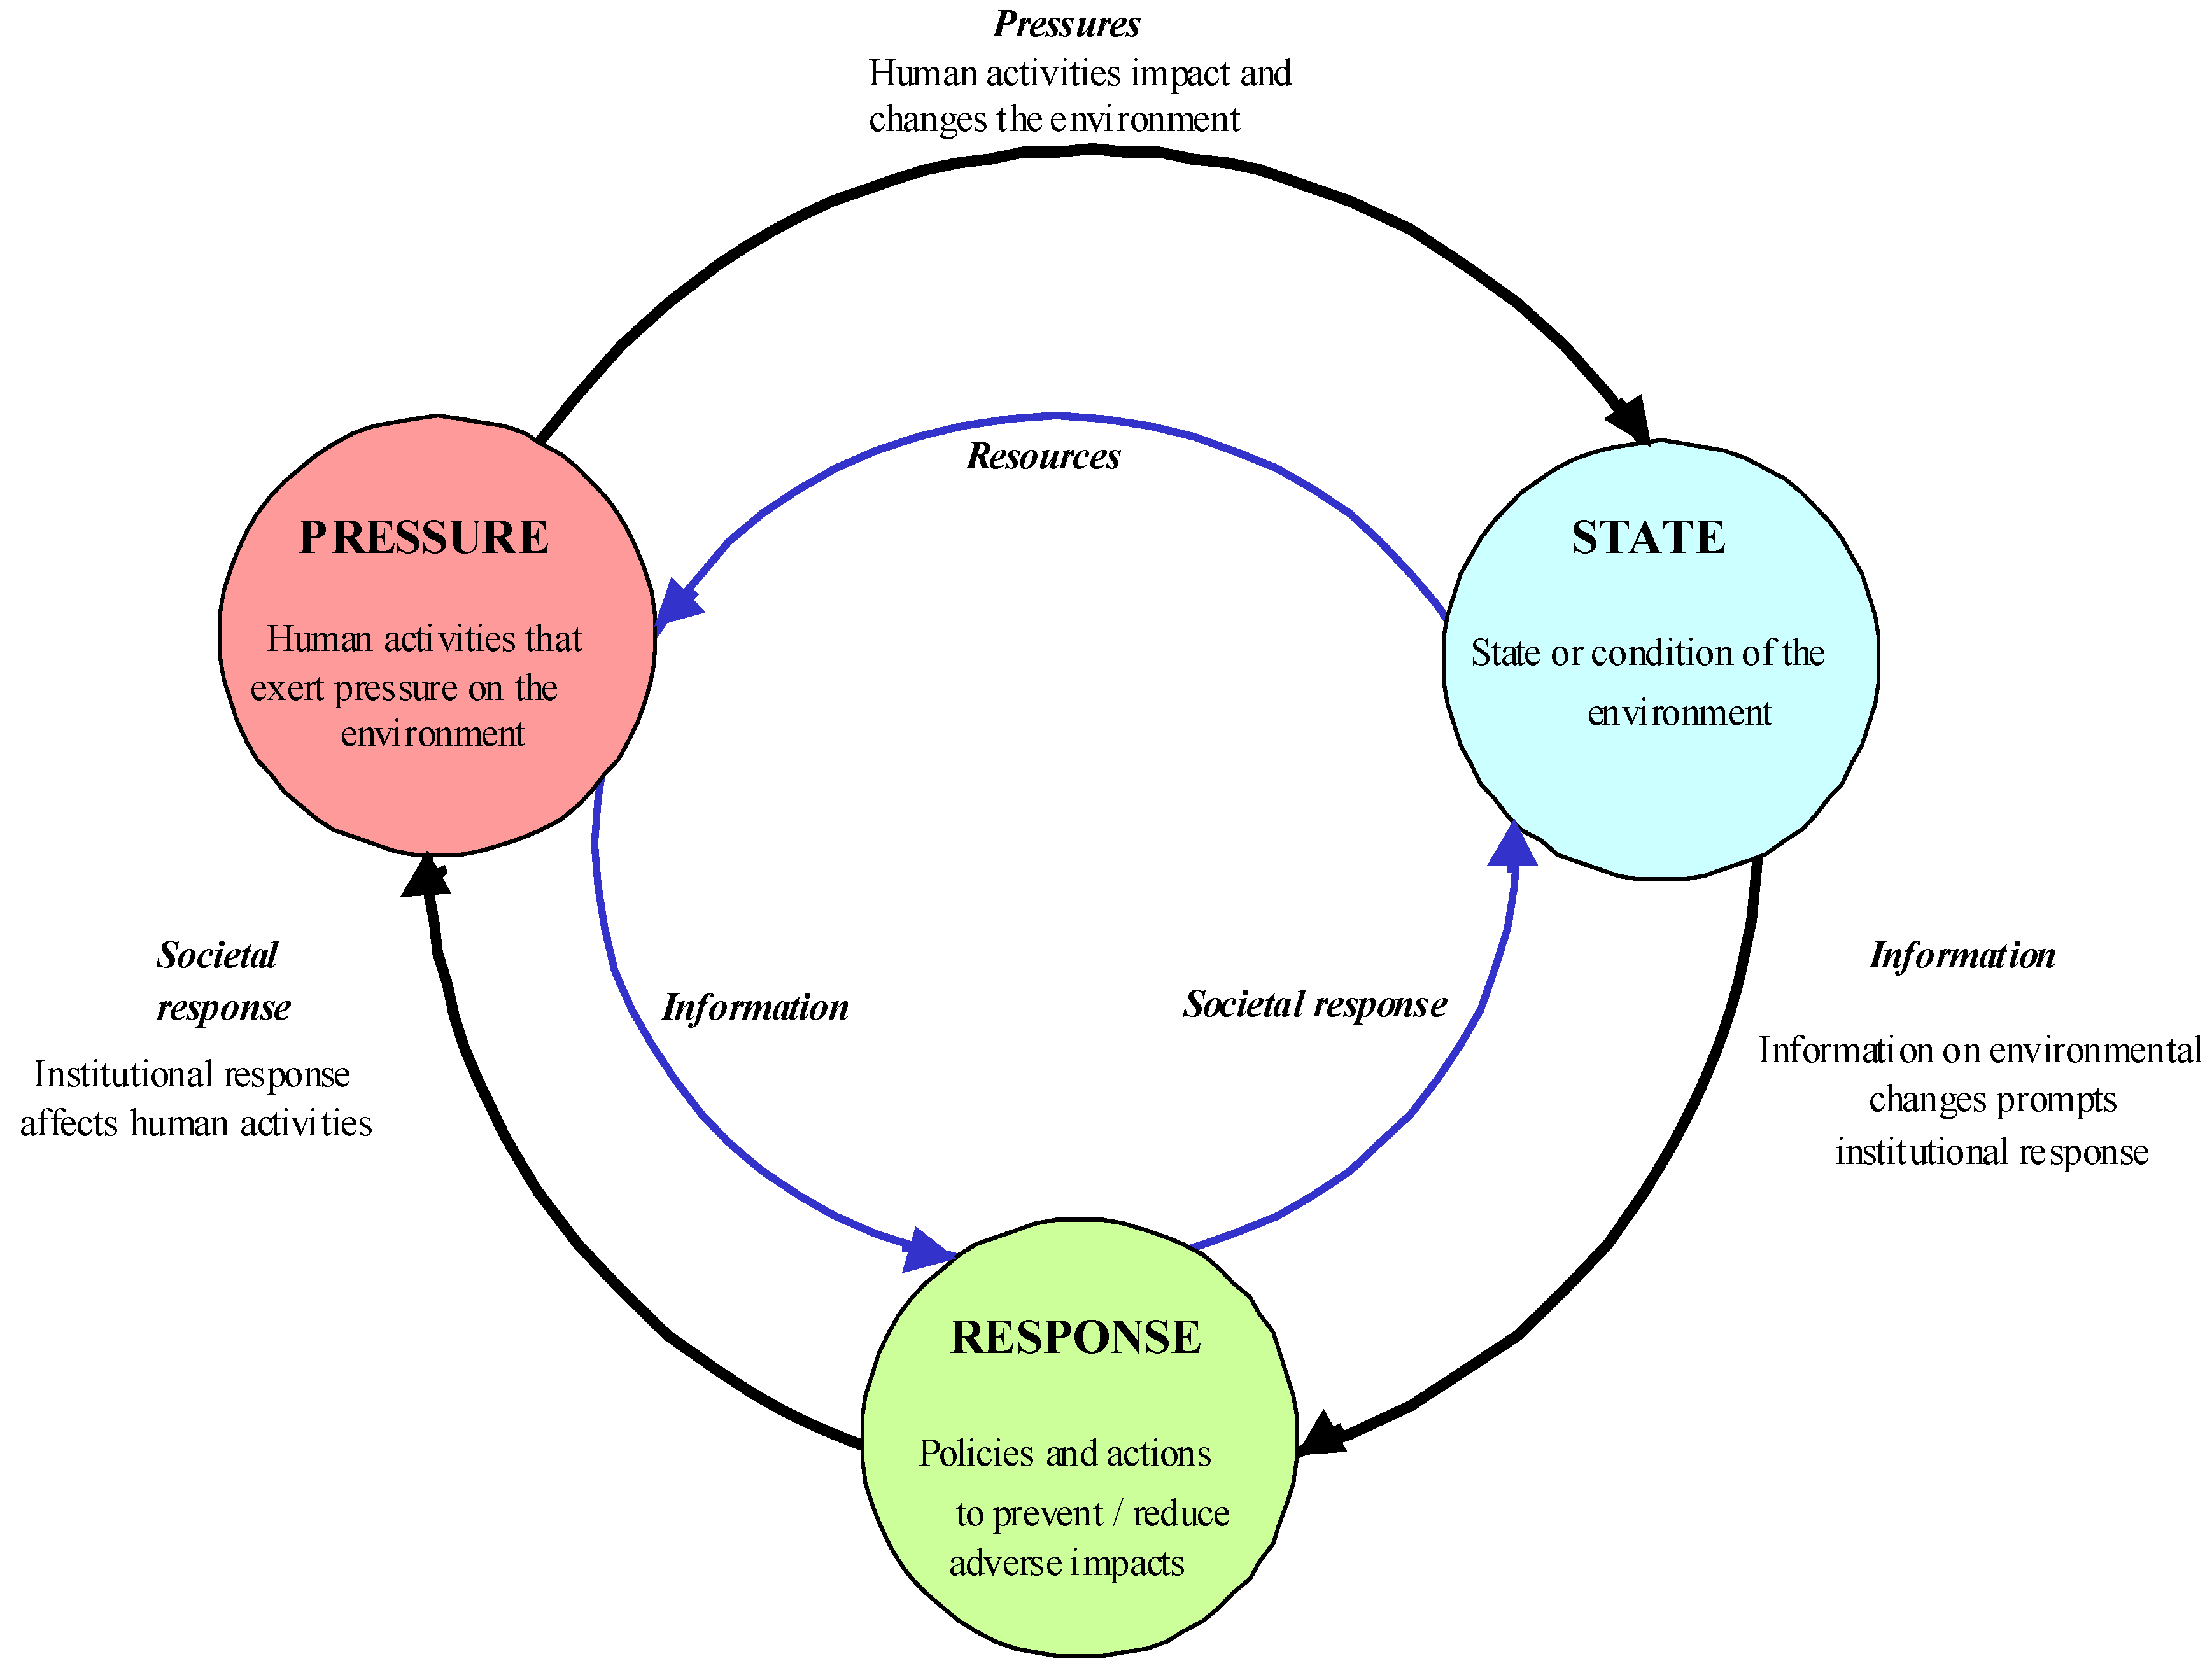
4.1. Pressure-State-Response

The Pressure-State-Response (PSR) framework was conceived by Statistics Canada [37], then further developed and adopted internationally in many countries (e.g., [38]). The Organization for Economic Cooperation and Development (OECD) [39] later adopted this framework for environmental reporting. A typical example of a PSR framework is shown in Figure 1.
Figure 1. Pressure-state-response (PSR) framework (adapted from [40]).
Sustainability 01 00441 g001
A PSR framework states that human activities exert pressure (such as pollution emissions or land use changes) on the environment, which can induce changes in the state of the quality and quantity of the environment (such as changes in ambient pollutant levels, habitat diversity, water flows). Society then responds to the changes in the pressures or the state with environmental and economic policies/programs intended to prevent, reduce or mitigate pressures and/or environmental damage. PSR framework highlights these (causal) linkages, and helps decision-makers and the public to see environmental and other interconnected issues [40]. Based on its wide usage, the PSR framework can be identified as a commonly agreed upon framework by many organizations and agencies for environmental reporting (e.g., [41,42,43,44]).

4.2. Driver-Pressure-State-Impact-Response

The United Nations Commission on Sustainable Development (UNCSD) modified the PSR framework and called it Driving force-State-Response (DSR) and it was used in the categorization of a first set of 134 Sustainable Development Indicators (SDIs) [45]. The OECD further modified the DSR framework and called it the Driver-Pressure-State-Impact-Response (DPSIR) framework. The DPSIR framework has been used to structure environmental information by most member states of the European Union (EU) and by many international organizations including the European Environmental Agency and EUROSTAT, the statistical office for the European Communities [46]. A more recent example is the Environmental Sustainability Index (ESI) developed in collaborative work of the World Economic Forum (WEF), Yale and Columbia Universities (http://sedac.ciesin.columbia.edu/es/ESI/).

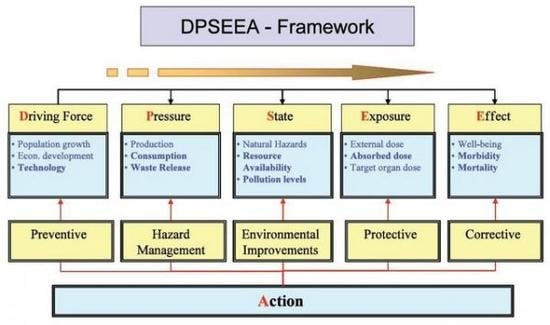
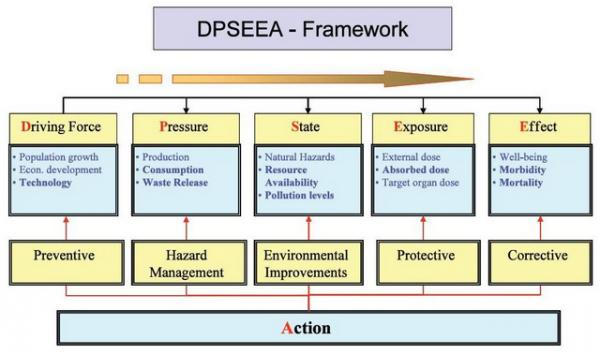
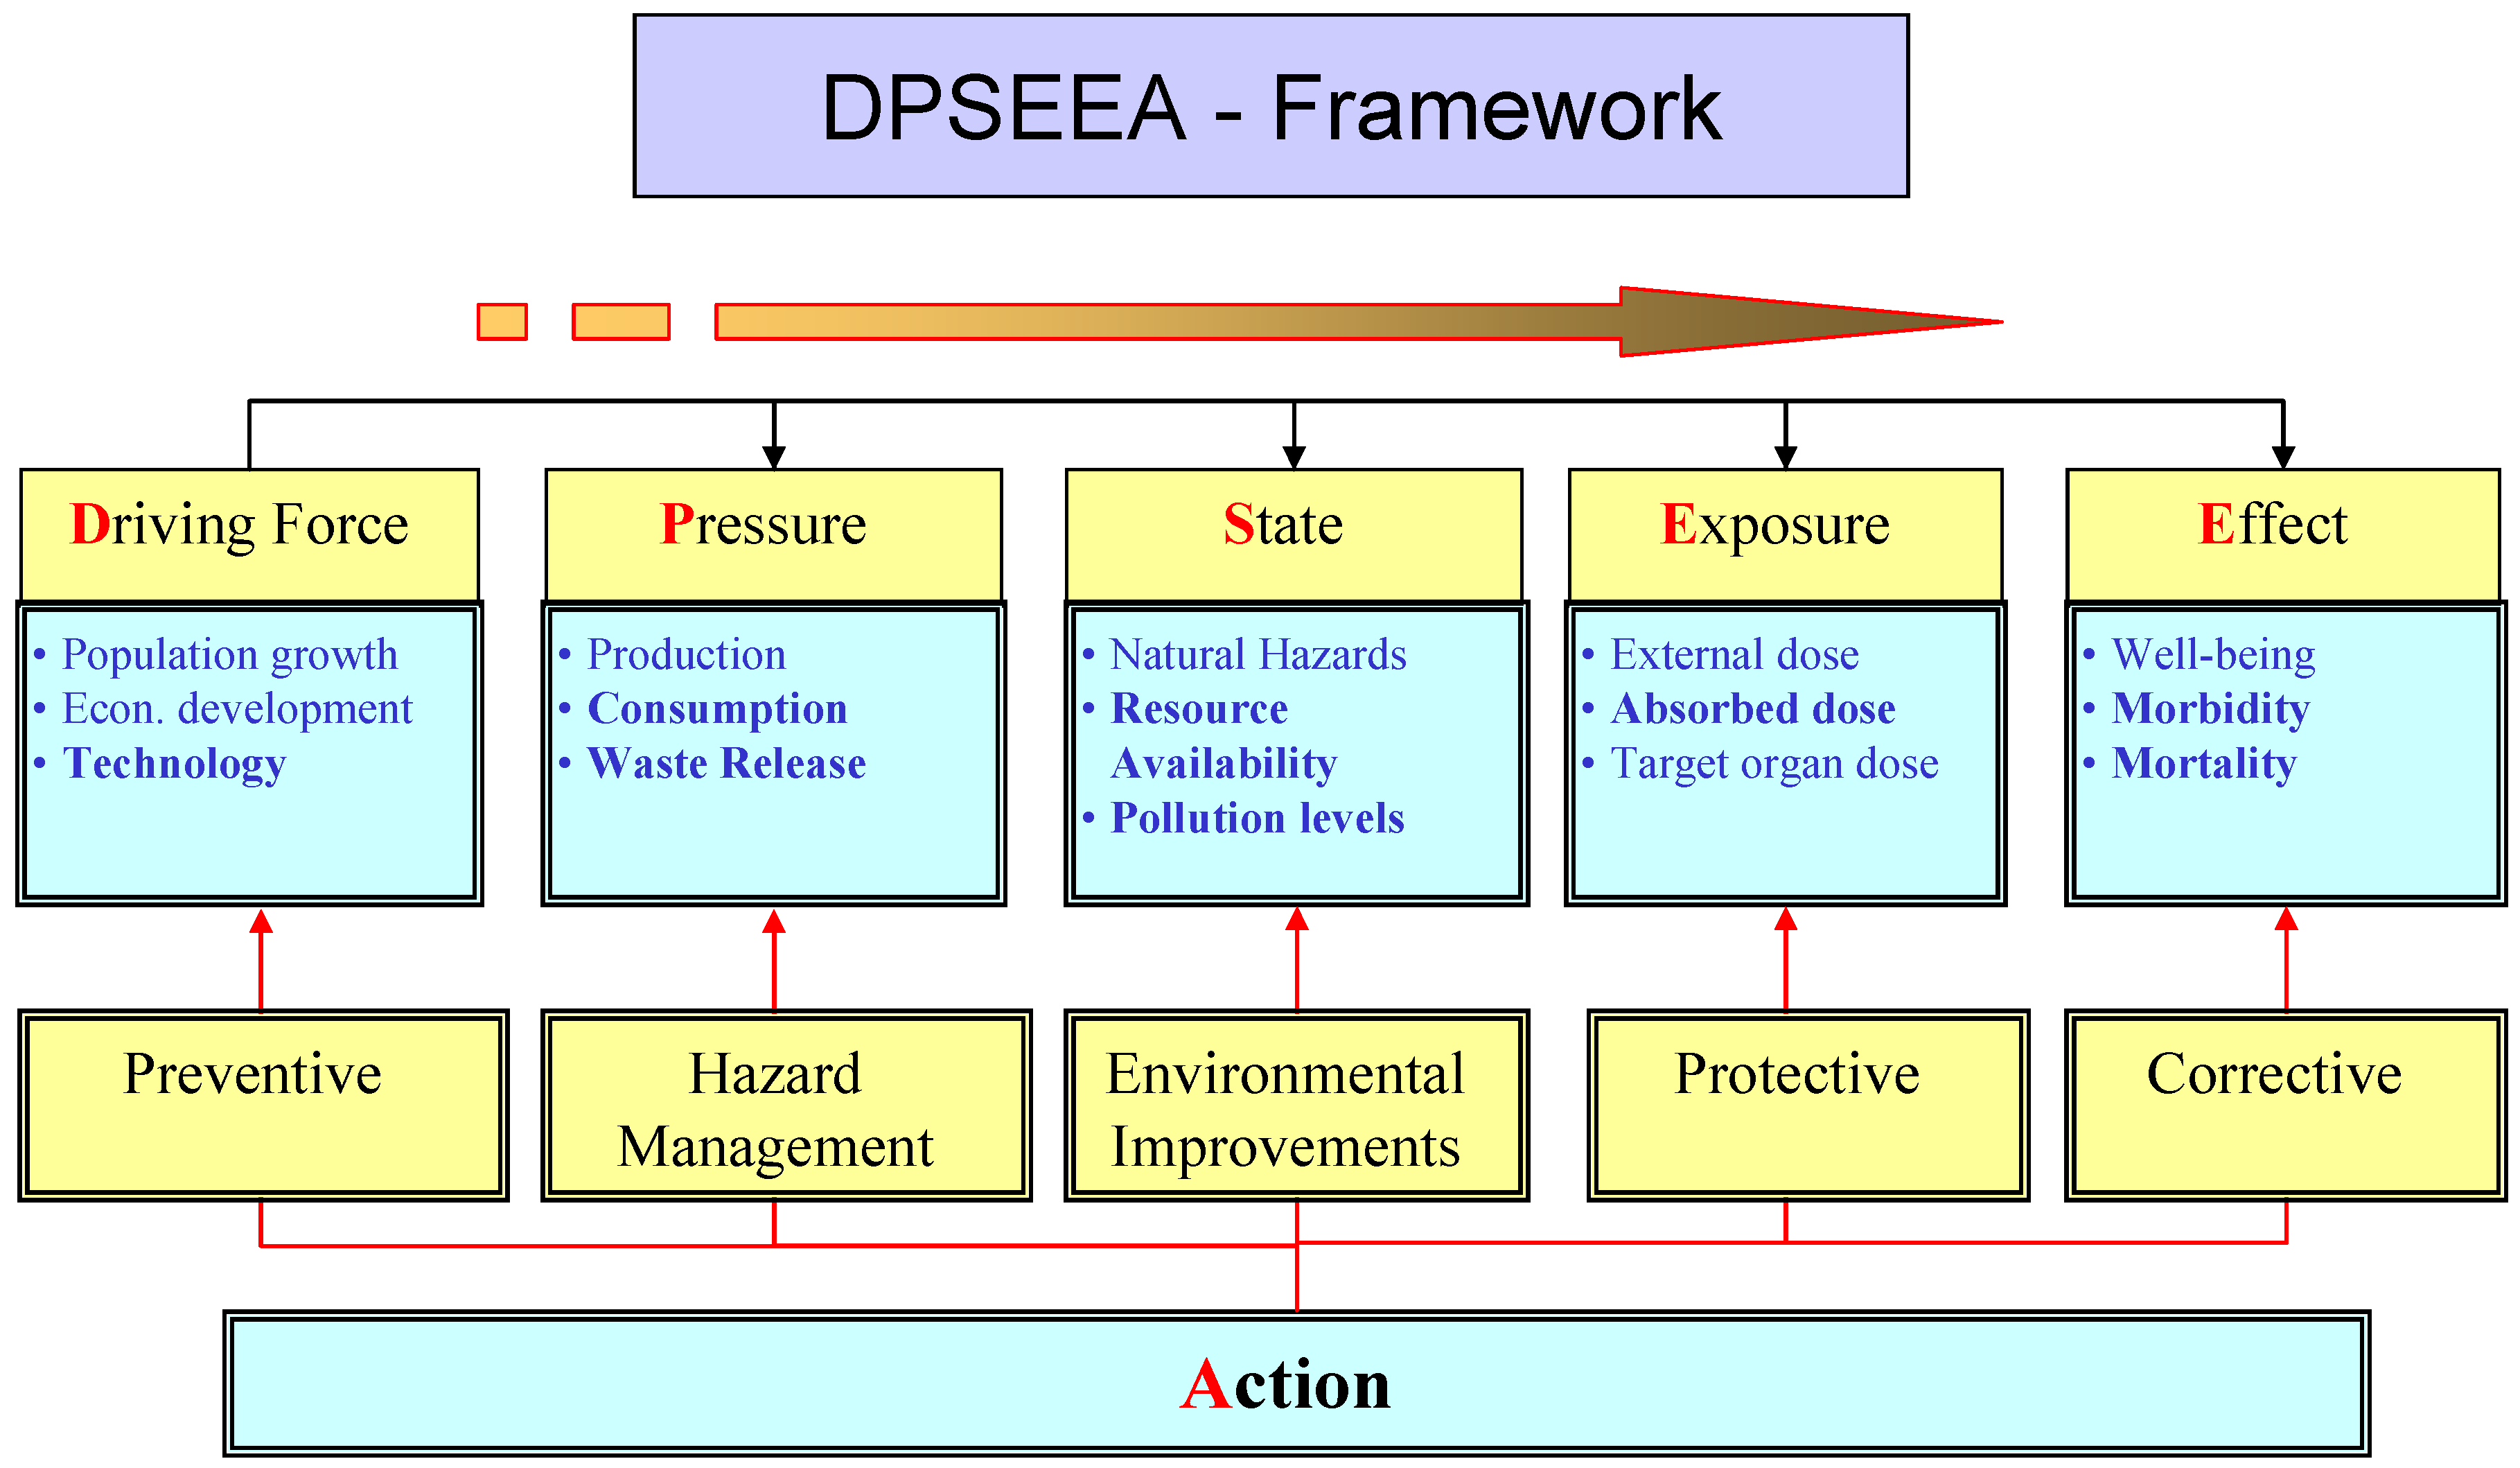
4.3. Driving Force-Pressure-State-Exposure-Effects-Action (DPSEEA)

The World Health Organization (WHO) took a broader approach to include the impacts of macro driving forces and pressures on both health and the environment [17]. The framework was called the Driving Force-Pressure-State-Exposure-Effect-Action (DPSEEA). The DPSEEA framework (Figure 2) is useful as it covers the full spectrum of cause and effect relationships starting from potential forces and required actions and brings together professionals, practitioners, and managers from both environmental and public health fields to help orient them in the larger scheme of the problem. Corvalán et al. [47] discussed the links among health, environment, and sustainable development. They presented DPSEEA framework to extend epidemiological domain to the policy domain.
Figure 2. Driving Force-Pressure-State-Exposure-Effect-Action (DPSEEA) framework.
Sustainability 01 00441 g002
The DPSEEA framework has been widely used in the environmental health sector [7]. This framework is very useful in understanding the continuum starting from drivers of environmental change (such as technology and population) to pressures (such as production, consumption and waste releases) to changes in environmental state (such as pollution levels) to exposure (such as external, internal and target organ doses) to effects on health, environment and overall sustainability. All sectors including government, private sector and individuals can take action to the outcomes at all levels, and this information can be used to provide feedback at all levels (Figure 2). In combination with multi-criteria decision-making, this framework has a great potential to contribute significantly to sustainability analysis.
The main advantage of DPSEEA is its flexibility and applicability. Its usefulness depends on the context in which it is used, e.g., health in sustainable development planning. The WHO and Europe and New Zealand Ministries of Health [48,49] have used the framework to develop environmental health indicators. In February 2001, the first meeting on the guidelines to assess the health impacts of climate change was attended by the representatives of WHO, Health Canada, and UNEP in Victoria (Canada); and they endorsed the DPSEEA as a viable conceptual framework for this purpose (http://www.euro.who.int/document/e74639.pdf).
Seven sustainability concepts proposed by Jabareen [5], as discussed earlier in Section 1.1, are the main theme of DPSEEA (and other linkage-based frameworks). These concepts ensure that the resources (e.g., materials and energy) are used efficiently and effectively at the cost of minimal triple bottom line impacts. These concepts lead to improved system performance (i.e., minimizing “effect”) without compromising socio-economic development (driving force) through optimal remedial “actions”.

5. Proposed Integrated Framework for Sustainability Assessment

Various frameworks presented earlier (Section 3 and Section 4) have some advantages and disadvantages (discussed later in Section 7). There is no single ideal framework for sustainability assessment. For example, impact-based methods are largely useful for assessing impacts of an activity on the economy, environment and on general social well-being. These impacts are measured on the natural environment through system effectiveness and efficiency. Process-based frameworks involve community representatives and other stakeholders in planning, and present opportunities to educate the public and influence collective behaviours. The MFA and LCA are also very popular and have extensively been used for sustainability assessment. Finally, the linkage-based frameworks use causal indicators that present a complete range of metrics to identify and measure a cause that create particular conditions affecting sustainability, the impacts of these causes, and the corrective actions that can be taken to address them. Jeon et al. [22] suggested that an integrated causal framework helps to refine visions through developing policies, planning procedures and measurement, and monitoring systems for achieving sustainable systems for any corporation or an institution.
An integrated linkage-based framework is proposed here to emphasize the need to evaluate specific monitoring programs where goals and objectives are clearly defined. The health/environmental monitoring programs driven by the goals and objectives consider the factors involved in greater detail leading to the pressures on a system ([47] and [50] called them “driving forces”), at the states or responses within the system (e.g., external dose, internal dose and effects at the organism, cellular or molecular level), or at actions taken to combat adverse impacts (e.g., government emission control legislations). Therefore, for example, depending upon the differences in the focus of two frameworks, what one framework defines as a “hazard”, may be referred to as an “external dose” in the other framework or what one framework terms as “pressure”, may be defined as a “state” in the others.
The causality frameworks have significant benefits in sustainability assessment. These frameworks, through a clearly structured organization of the indicators, enable clear and concise communication to decision-makers. They help expose how the information provided by the indicators is related to various processes and how specific policy or management actions can address human-induced environmental problems. Additionally, a uniform approach for reporting indicators helps to link up different but related assessment areas (e.g., transport and environment, agriculture and environment). Figure 3 proposes DPSEEA framework to evaluate sustainability index using TBL. It can be noticed that at different levels of causality (in each dimension of sustainability) indicators are defined that can be combined using multi-criteria decision-making tools.
Figure 3. Integrated DPSEEA and TBL framework.
Sustainability 01 00441 g003
Linkages-based frameworks—PSR, DPSIR, and DPSEEA—emphasize the importance of causality. Driving force-Pressure-State-Exposure-Effect-Action (DPSEEA) framework is the broadest approach as it includes the impacts of macro driving forces and pressures on both health and the environment. However, the reliance on simple unidirectional linkages (chains) at the same time is not very conducive to understand and describe the complexity of the processes behind sustainability assessment. This limits the usefulness of these frameworks for environmental (and health risk) assessments. Like all other linkage-based frameworks, the DPSEEA has the following limitations:
It cannot work effectively if the evidence for causal linkages is missing or vague
It leads to oversimplification of spatial and temporal interactions that results in poorly informed management decisions
It oversimplifies inter-linkages among issues and factors. Often, it is ambiguous as to whether the issue measured by an indicator represents a driving force or a pressure. Sometimes there are multiple pressures for most states, and multiple states arising from most pressures, creating difficulties in identifying indicators.

6. Linkage-Based Frameworks: An Example of Universities

The use and application of linkage based frameworks is not new as mentioned earlier, what we want to do here is to briefly compare the three linkage based frameworks using the original causal frameworks only for environmental categories but also for social, economic, and educational categories. It is our intention to explore the uni-directional links for PSR, DPSIR, and DPSEEA as a first step to identify the factors that may affect the case (universities) in hand. What is novel in the approach taken here is the integration of the concept of causal frameworks and triple bottom line approach and development of indicators for each category.
Universities, like other public institutions, are also facing the challenges of integrating sustainability in their strategic planning and development. Since the Talloires Declaration in 1990, International Association of Universities (IAU) is very active in promoting sustainability in universities and creating proactive leadership towards lessening the demise of the global environment. IAU continues to exert pressure through other declarations such as the Halifax and Swansea Declarations [51] and Kyoto Declaration [52], and as a result of this pressure, signed commitments and voluntary decisions, several universities have embarked on projects and initiatives to incorporate sustainability into their systems. However, sustainable development is a still a relatively new and innovative idea for many universities. As universities are considered as institutions that promote and inculcate change through interactions of thousands of individuals on campus and outreach, in an ideal world, the concept of sustainable development should be integrated into the policies, approaches, and learning of all stakeholders. But in practice there are many hindrances in the adoption of sustainable development in a university system, such as: (i) environmental protection is required for not only from lecture halls and laboratories but also from administration areas to bring financial and social gains; (ii) lack of legal bindings/regulations or even incentives to integrate sustainable development in university policies; and (iii) many universities have initiated measures to improve environmental friendliness but a comprehensive resource-saving (sustainability) concept is still lacking.
There is no single best way of organizing and viewing the relationships between socio-economic development, environmental impacts, and human health indicators that captures all important interactions. Assessment of sustainability for universities is a complex and challenging process. Literature suggests that several frameworks and methodologies have been proposed and implemented, Lozano [53] recommends that to apply or design any sustainability framework one must consider not only the environmental, social, and economic dimensions (categories) but also the educational performance with following indictors: (i) Education (courses and curricula), (ii) Research (basic and applied), (iii) Campus operations, and (iv) Community outreach. Table 4 presents comparison matrix of categories (i) environment, (ii) social, (iii) economics and (iv) educational performance along with their indicators for the conceptual frameworks of PSR, DPSIR and DPSEEA. For causal or linkage based frameworks, a combination of subject-based indicators in terms of position along the linkage-based framework is by far the most widely used indicator reporting method [12]. The indicators are developed by using frameworks for linkages between health, environment, and development [17].
The list of these indicators at various causal stages (elements) of the frameworks is not exhaustive or even not comprehensive. The purpose here is to demonstrate that how various causal frameworks assign the same indicators to various causal stages. It can be noticed that indicators belong to various categories of sustainability in each causal element. It should be noted from Table 4 that in PSR one cannot benefit from the information about drivers or exposures or effects and in DPSIR one cannot benefit from indicators of exposure (represented in dark gray color in Table 4), where effects are termed as impact. The advantage of DPSEEA is it provides better continuum from drivers to the effects in whether it’s environmental, socio-economic, or educational aspect. One cannot deny that linkage-based frameworks and in particular DPSEEA framework provides clear and concise communication to decision-makers through a clearly structured organization of the indicators. They help expose how the information provided by the indicators is related to various processes and how specific policy or management actions can address human-induced environmental, social, economic and educational problems [12].

7. Discussion and Conclusions

Various sustainability frameworks presented in the previous section have many advantages and disadvantages. They can be used alone or in combination with other frameworks. Comparison of impact and objective-based frameworks by Pope et al. [10] reveals that impact-based framework focus on minimizing the impacts, while objective-based frameworks maximize TBL outcomes. TBL or other dimensions of sustainability approaches even though criticized as reductionist approaches, make decision-making easier through multi-criteria decision-making techniques. Process-based frameworks by involving stakeholders in the decision-making process are usually crucial for articulating the right vision for a community at the local, state, national, or international levels [22]. Life cycle assessment is the most widely used framework in various disciplines for sustainability assessment. Major limitations of LCA are that it focuses mainly on environmental impacts while reporting on social and economic aspects of sustainability is not easy. Moreover, LCA analysis is complex and time-consuming and also requires large data and boundary definitions [6], but its cradle to grave approach encompasses all phases of a product or a system and hence makes it the most desirable framework used.
Table 4. Comparison of linkage-based frameworks–an example of sustainability in a university.
DPSEEADPSIRPSRFactors
Driving forceDriverN/A
  • International research and development trends or advancement
  • Institutional enhancement
  • Energy requirements
  • Economic development
  • Health & safety issues
  • Social equity
  • Sustainability education
PressurePressurePressure
  • Production of Greenhouse gases
  • Production and consumption of ozone depleting substances
  • Emission, effluents, and waste
  • Product and services
  • Amount of energy used
  • Amount of water supplied and distributed, and collected for purification
  • Transport
  • Education cost
  • Operational and maintenance cost
  • Labour practices and decent work
  • Quality of management
  • Human rights
  • Curriculum and courses
  • Research (basic and applied)
StateStateState
  • Climate change
  • Concentration of emissions, effluents and waste load
  • State of responsible procurement
  • Depletion of energy resources
  • Water demand and quality
  • Percentage daily commute by car
  • Exceedance of noise level on roads from standards
  • Percentage of expenditure
  • Facilities and infrastructure costs
  • Existing health, safety and security situation
  • State of Quality management
  • Social equity
  • No. & percent of courses on sustainability and administrative support
  • Grants, publications/products, programs and centers
  • Community activity and learning service
ExposureN/AN/A
  • Changes in environmental conditions
  • Proportion exposed to poor air conditions
  • Proportion exposed to poor water quality
  • Proportion of people exposed to hazardous waste
  • Proportion of people exposed to high noise levels
  • Impact on energy resources
  • Existing state and cost
  • Facilities planning
  • Social impacts
  • Proportion of research support for sustainability
  • Proportion of multi-/inter-/intra disciplinary programs and curriculum
  • Proportion of programs involving community and university
EffectImpact
  • Human health risk
  • Ecological risk
  • Effect on biodiversity
  • Percentage of revenues through educational cost and investments
  • Reduced maintenance costs
  • Social risk
  • Educational performance
ActionResponseResponse
  • Sustainability strategy and plans
  • Economic policies and plans
  • Policies and plans to make a sustainable community and ensure social equity and justice
Of all the frameworks discussed in this paper, the introduction of the causal-chain frameworks within environmental, social, economic and other specific industry relevant indicators has been extremely useful. Niemeijer and de Groot [12] stated that PSR and DPSIR can capture causality in overall management and policy-making. However, DPSEEA is even one step ahead as it breaks impact into exposure and effect, which enhances decision making with regards to environmental as well as economic and social aspects. Another important observation in DPSEEA framework is its similarity with ecological and human health risk assessment and risk management paradigms as demonstrated by the University example discussed earlier.
Despite the drawbacks, the linkage-based frameworks (including DPSEEA) have been successfully applied for sustainability assessment in various disciplines such as health sector, agriculture, and mining. It has been shown [7,47,48,49] that the linkage-based frameworks either alone or in combination with other analytical methods such as life cycle analysis, multi-criteria decision-making methods and risk analysis techniques are successful for sustainability assessment. Linkage-based frameworks with other frameworks like Triple Bottom Line and integrative impact assessment can be useful for planning and decision-making for sustainable development [54,55]. Integrated DPSEEA framework provided earlier in Figure 3 can help better to understand complexities and overcome some of the earlier-mentioned limitations.
Niemeijer and de Groot [12] suggest that a causal network, rather than a causal unidirectional link is a more appropriate concept to effectively deal with the complexity of real world interactions and they have developed a causal network for environmental assessment using DPSIR. But we are exploring the application of DPSEEA framework for universities (for educational performance) in detail not only for developing the cause-effect model for broad and (or) overall sustainability assessment but also for detailed analysis, where these have not been employed before.
The authors of this paper are working on a continuing research on how DPSEEA framework can be used to evaluate quantitatively sustainability index for a higher education institution and enhance informed decision-making [56].

Acknowledgements

The authors would like to thank Dr. Rehan Sadiq for his suggestions and technical support.

References

  1. WCED. Our Common Future (The Brundtland Report); Oxford University Press: Oxford, UK, 1987. [Google Scholar]
  2. Kenway, S.; Howe, C.; Maheepala, S. Triple Bottom Line Reporting of Sustainable Water Utility Performance; IWA Publishing: London, UK, 2007. [Google Scholar]
  3. Becker, B. Sustainability assessment: A review of values, concepts, and methodological approaches. The World Bank: Washington, DC, USA, 1997; p. 66. [Google Scholar]
  4. Gibson R.B. Specification of Sustainability-Based Environmental Assessment Decision Criteria and Implications for Determining ‘‘Significance’’ in Environmental Assessment; Canadian Environmental Assessment Agency, 2000. Available online: http://www.ceaa.gc.ca/015/001/009/1_e.htm (accessed December 12, 2008).
  5. Jabareen, Y. A new conceptual framework for sustainable development. Environ. Dev. Sustain. 2008, 10, 179–192. [Google Scholar] [CrossRef]
  6. Sahely, H.R.; Kennedy, C.A.; Adams, B.A. Developing sustainability criteria for urban infrastructure systems. Can. J. Civ. Eng. 2005, 32, 72–85. [Google Scholar] [CrossRef]
  7. Toxic chemicals and children’s health in North America: a call for efforts to determine the sources, levels of exposure, and risks that industrial chemicals pose to children’s health; Commission for Environmental Cooperation: Montréal, Canada, 2006.
  8. Loucks, D.P.; Stakhiv, E.Z.; Martin, L.R. Sustainable water resources management. J. Water Res. Planning Manage. 2000, 126, 43–47. [Google Scholar] [CrossRef]
  9. Pearce, D.; Turner, R.K. Economics of Natural Resources and the Environment; Johns Hopkins University Press: Baltimore, MD, USA, 1990; p. 44. [Google Scholar]
  10. Pope, J.; Annandale, D.; Morrison-Saunders, A. Conceptualizing sustainability assessment. Environ. Impact Asses. Rev. 2004, 24, 595–616. [Google Scholar] [CrossRef]
  11. Barrera-Roldan, A.; Saldivar-Valdes, A. Proposal and application of a sustainable development index. Ecol. Indic. 2002, 2, 251–256. [Google Scholar] [CrossRef]
  12. Niemeijer, D.; de Groot, R. Framing environmental indicators: moving from causal chains to causal networks. Environ. Dev. Sus. 2008, 10, 89–106. [Google Scholar] [CrossRef]
  13. Alegre, H. Performance Indicators for Water Supply Systems–Current Trends and On-going Projects, Drought Management Planning in Water Supply Systems; Carbera, E., Garcia-Serra, J., Eds.; Kluwer Academic Publishers: the Netherlands, 1999; pp. 148–178. [Google Scholar]
  14. Foxon, T.J.; McIlkenny, G.; Gilmour, D.; Oltean-Dumbrava, C.; Souter, N.; Ashley, R.; Butler, D.; Pearson, P.; Jowitt, P.; Moir, J. Sustainability criteria for decision support in the UK water industry. J. Environ. Planning Manage. 2002, 45, 285–301. [Google Scholar] [CrossRef]
  15. Maclaren, V. Developing Indicators of Urban Sustainability: A Focus on the Canadian Experience; Intergovernmental Committee on Urban and Regional Research (ICURR) Press: Toronto, ON, Canada, 1996. [Google Scholar]
  16. Alberti, M. Measuring urban sustainability. Environ. Impact Assess. Rev. 1996, 16, 381–424. [Google Scholar] [CrossRef]
  17. Linkage Methods for Environment and Health Analysis. General Guidelines; WHO/EHG/95.26. World Health Organization: Geneva, Switzerland, 1996. Available online: http://www.who.int/ mediacentre/events/IndicatorsChapter7.pdf (accessed December 7, 2008).
  18. Edwin, K.L.T. Challenges in using environmental indicators for measuring sustainability practices. J. Environ. Eng. Sci. 2002, 1, 417–425. [Google Scholar] [CrossRef]
  19. Singh, R.S.; Murty, H.R.; Gupta, S.K.; Dikshit, A.K. An overview of sustainability assessment methodologies. Ecol. Indic. 2009, 9, 189–212. [Google Scholar] [CrossRef]
  20. Sadiq, R.; Khan, F.I.; Veitch, B. Greenpro-I: a risk-based life cycle assessment methodology for green and clean process selection and design decision-making. Comput. Chem. Eng. 2005, 29, 1023–1039. [Google Scholar] [CrossRef]
  21. Khan, F.I.; Sadiq, R.; Husain, T. GreenPro-I: A risk-based life cycle assessment and decision-making methodology for process plant design. Environ. Model. Software. 2002, 17, 669–691. [Google Scholar] [CrossRef]
  22. Jeon, C.M.; ASCE, S.M.; Sdjo Amekudzi, M. Addressing sustainability in transportation system: definitions, indicators, and metrics. J. Infr. Syst. ASCE 2005, 11, 31–50. [Google Scholar] [CrossRef]
  23. Guio-Torres, D.M. Sustainability Indicators for Assessment of Urban Water Systems: The Need for A Common Ground. First SWITCH Scientific Meeting; University of Birmingham: Birmingham, UK, 9–10 January 2006. Available online: http://www.switchurbanwater.eu/outputs/pdfs/WP1-1_PAP_Sustainability_indicators_ for_assessment_of_UWS.pdf (accessed December 15, 2008).
  24. Sustainable Development Strategy 2001–2003; Transport Canada: Ottawa, OM, Canada, 2001. Available online: http://www.tc.gc.ca/pol/en/acs/SD/sds0406/appendixC.htm (accessed December 15, 2008).
  25. Environmental Defense. Environmental Sustainability Kit; Pollution Prevention Alliance: New York, NY, USA, 1999. [Google Scholar]
  26. Khan, F.I.; Sadiq, R.; Veitch, B. Life cycle index (LInX): a new indexing procedure for process, and product design and decision-making. J. Cleaner Prod. 2004, 12, 59–76. [Google Scholar] [CrossRef]
  27. Pintér, L.; Hardi, P.; Bartelmus, P. Indicators of Sustainable Development: Proposals for a Way Forward (Discussion Paper Prepared under a Consulting Agreement on behalf of the UN Division for Sustainable Development); International Institute for Sustainable Development (IISD): New York, NY, USA, 2005. [Google Scholar]
  28. Litman, T. Sustainable Transportation Indicators - A Recommended Research Program for Developing Sustainable Transportation Indicators and Data; Victoria Transport Policy Institute (VTPI), 2008. Available online: http://www.vtpi.org/sustain/sti.pdf (accessed December 15, 2008).
  29. Ashley, R.; Hopkinson, P. Sewer systems and performance indicators—Into the 21st century. Urban Water. 2002, 4, 123–135. [Google Scholar] [CrossRef]
  30. Pearce, A.R.; Vanegas, J.A. Defining sustainability for built environment systems. Int. J. Environ. Technol. Manage. 2002, 2, 94–113. [Google Scholar] [CrossRef]
  31. Hacking, T.; Guthrie, P. A framework for clarifying the meaning of Triple Bottom Line, Integrated, and Sustainability Assessment. Environ. Impact Assess. Rev. 2008, 28, 73–89. [Google Scholar] [CrossRef]
  32. The Talloires Declaration; UNESCO: Talloires, France, 1990.
  33. Velazquez, L.; Munguia, N.; Platt, A.; Taddei, J. Sustainable university: what can be the matter? J. Cleaner Prod. 2006, 14, 810–819. [Google Scholar] [CrossRef]
  34. Wernick, I.K.; Irwin, F.H. Material Flow Accounts: A Tool for Making Environmental Policy; WRI Material Resource project: Washington, DC, USA, 2005. Available online: http://pdf.wri.org/WRI_MFA_Policy.pdf (accessed December 10, 2008).
  35. A Technological Framework for Life Cycle Assessment; Society of Environmental Toxicology and chemistry (SETAC): Washington, DC, USA, 1991.
  36. Khan, F.I.; Raveender, V.; Husain, T. Effective environmental management through life cycle assessment. J. Loss Prev. Process Ind. 2002, 15, 455–466. [Google Scholar] [CrossRef]
  37. Friend, A.; Rapport, D. Towards a Comprehensive Framework for Environmental Statistics: a Stress-Response Approach, Statistics Canada, 1979.
  38. Concepts and Methods of Environment Statistics: Statistics of the Natural Environment–A Technical Report; United Nations: New York, NY, USA, 1991.
  39. Environmental Indicators: A Preliminary Set; OECD: Paris, France, 1991.
  40. Towards Sustainable Development: Indicators to Measure Progress. Organisation for Economic Co-operation and Development (OECD) Conference, Rome, Italy, December 15–17, 1999.
  41. Environment in the European Union at the Turn of the Century; Report 2; European Environment Agency: Copenhagen, Denmark, 1999.
  42. Environmental Signals; Report 8; European Environment Agency: Copenhagen, Denmark, 2001.
  43. Draft Report on the Environment; Report EPA 260-R-02-006; United States Environmental Protection Agency: Washington, DC, USA, 2003.
  44. World Resources 2005: The Wealth of the Poor, Managing Ecosystems to Fight Poverty; World Resources Institute: Washington, DC, USA, 2005.
  45. Indicators of Sustainable Development—Framework and Methodologies; United Nations: New York, NY, USA, 1996.
  46. Gilbert, R.; Tanguay, H. Brief Review of Some Relevant Worldwide Activity and Development of an Initial Long List of Indicators; Sustainable Transportation Performance Indicators (STPI) Project, Center for Sustainable Transportation (CST): Toronto, ON, Canada, 2000. [Google Scholar]
  47. Corvalán, C.F.; Kjellström, T.; Smith, K.R. Health, environment, and sustainable development—Identifying links and indicators to promote action. Epidemiology 1999, 10, 656–660. [Google Scholar] [CrossRef] [PubMed]
  48. Environment and Health Indicators for Europe. A Pilot Indicator-Based Report; WHO Regional Office for Europe: Copenhagen, Denmark, 2004.
  49. Developing National Environmental Health Indicators for New Zealand. Khan, R.; Voice, T.; Philips, D. (Eds.) Ministry of Health New Zealand: Auckland, 2005.
  50. von Schirnding, Y. Health in Sustainable Development Planning: the Role of Indicators; World Health Organisation: Geneva, Switzerland, 2002. [Google Scholar]
  51. The Swansea Declaration; UNESCO: Kyoto, Japan, 1993.
  52. Kyoto Declaration; The 9th round table meeting of IAU. UNESCO: Kyoto, Japan, 1993. Available online: www.unesco.org/iau/sd/sd_dkyoto.html (accessed December 18, 2008).
  53. Lozano, R. A tool for a graphical assessment of sustainability in universities (GASU). J. Cleaner Prod. 2006, 14, 963–972. [Google Scholar] [CrossRef]
  54. Sadler, B. A Framework for Environmental Sustainability Assessment and Assurance. In Handbook of Environmental Impact Assessment; Petts, J., Ed.; Blackwell: Oxford, UK, 1999; Vol. 1, pp. 12–32. [Google Scholar]
  55. Wilkinson, D.; Fergusson, M.; Bowyer, C.; Brown, J.; Ladefoged, A.; Monkhouse, C.; Zdanowicz, A. Sustainable Development in the European Commission’s Integrated Impact Assessments for 2003; Institute for European Environmental Policy: London, UK, 2004; Available online: http://www.ieep.eu/publications/pdfs/2004/sustainabledevelopmentineucommission.pdf (accessed December 17, 2008).
  56. Waheed, B.; Khan, F.; Veitch, B. A quantitative assessment of sustainability for higher education institutions: an application of DPSEEA framework. J. Cleaner Prod. 2009. (in review). [Google Scholar]

