Article

An Overview of Energy and Exergy Analysis to the Industrial Sector, a Contribution to Sustainability

by
Raúl Arango-Miranda
1,*,
Robert Hausler
1,†,
Rabindranarth Romero-López
2,†,
Mathias Glaus
1,† and
Sara Patricia Ibarra-Zavaleta
3,†
1
Station Expérimentale des Procédés Pilotes en Environnement, École de Technologie Supérieure, Université du Québec, 1100, rue Notre-Dame Ouest Local A-1500, Montréal, QC H3C 1K3, Canada
2
Unidad de Investigación Especializada en Hidroinformática y Tecnología Ambiental, Facultad de Ingeniería Civil, Universidad Veracruzana, Lomas del Estadio s/n, Zona Universitaria, Xalapa 91000, Veracruz, México
3
Instituto de Biotecnología y Ecología Aplicada, Universidad Veracruzana. Av. de las Culturas Núm.101, col. Emiliano Zapata. Xalapa 91090, Veracruz, México
*
Author to whom correspondence should be addressed.
These authors contributed equally to this work.
Sustainability 2018, 10(1), 153; https://0-doi-org.brum.beds.ac.uk/10.3390/su10010153
Submission received: 30 November 2017 / Revised: 23 December 2017 / Accepted: 4 January 2018 / Published: 10 January 2018

Abstract

:
Globally, industry remains one of the main consumers of fossil fuels; hence, it is one of the prime sources of greenhouse gases (GHG). Exergy analysis methods can be applied to detect the processes inefficiencies. To enhance the interconnection of the exergy and the environment theories, renewable share and exergy efficiency are suggested, in a contribution to sustainability. Exergy analysis is proposed and lifted to study the industrial sector. Even though exergy analysis has been applied to study societies, few studies have been conducted to study emerging-market economies. In 2015, Mexico’s crude oil production was the 12th biggest worldwide, therefore fossil fuels are still the main source to produce energy for the domestic and productive sectors of the Mexican society. Consequently, a prospective study case in Mexico is suggested. The industrial sectorial exergy consumption amounts 1350 PJ in 2000, increasing to 1591 PJ in 2015. Both energy and exergy efficiencies show similar results along the 16 years, with average energy and exergy efficiencies of 78% and 23%, respectively. In comparison with results of similar studies, Mexican exergy efficiency falls within the ranges, yet below the average of 48%. Thus, poor efficiency is still occurring in the sector. Our proposal could provide significant opportunities to become a more sustainable sector, based on the exergetic renewable share and the exergy efficiency.

Graphical Abstract

1. Introduction

Nowadays, the rates of worldwide economic development indicate that increased energy demand at all sectoral levels may represent a threat to the achievement of global reduction objectives for 2050 [1]. The industrial sector plays a key role in terms of energy use and air emissions. Characterized by easy dispersion, persistence over time and historic load, industrial atmospheric pollution from fossil fuels is the third largest source of global warming [2]. The growing consumption trends of the industrial sector, which remains the main source of energy worldwide, and rising concerns in terms of energy supply security make the prevention of the consumption of fossil fuels extremely relevant [3]. Since the early 1970s, environmental assessment and tools derived from it have been developed to decrease the danger of industrial activities. Conventional environmental impact evaluation methodologies, however, have shown relative effectiveness. In addition, several environmental measures have been implemented since the 1990s.
In parallel, after the 1973 oil embargo, the first studies of exergy were developed focusing on energy savings when governmental agencies of industrialized countries were forced to study exergy in a deeper way [4]. Exergy can be used to detect the inefficiencies of a process by locating the degradation of energy. Availability or exergy was defined by Reistad as “the thermodynamic property that measures the potential of a system to do work when restricted by the inevitable surroundings and Po (dead state temperature and pressure)” [5]. Recently, Boroumandjazi defines exergy as “the maximum amount of work that can be produced by a system or a flow of matter or energy in equilibrium with its surroundings” [6]. Since the late 1970s, towards the late 1990s, researchers such as Rosen, Dincer and others, have been working in the field of exergy accounting and exergy societies [7,8]. In parallel, exergy analysis was also studied regarding the environment and sustainability [8,9,10].
In 2007, Sciubba summarized the evolution of exergy [11] since the first theoretical developments of Reistad [5], as a concept to resource accounting [7,12], energy conservations [13], efficiency improvements in industrial equipment or power cycles and its components [14], environmental applications [8,15,16], complex systems analysis [17,18], sectors and extended exergy analysis in societies or countries [19,20,21,22,23], mainly including conversion, transportation, residential and agricultural sectors [24,25]. The available evidence seems to suggest that exergy efficiencies are more suitable to evaluate systems and detect areas in need of improvement, even those on a large scale such as the economic sectors of a country or an entire society. Gong established that “to improve energy and material conversion processes, the exergy concept should be applied. Thus, exergy and exergy analysis are necessary tools to create and maintain a sustainable or rather a vital society” [26]. Researchers also claim that exergy brings opportunities in decision-making to increase energy efficiency [18] and energy conservation [27]. Exergy analysis has been developed in the industry covering three fundamental categorizations: by sector, by type of industry and by equipment.
Qualitative research has been conducted in the field of exergy to study the industrial sector [6,12,28,29,30,31,32,33,34,35,36,37], but there have been few studies in developing countries or emerging economies. According to the World Bank, to pay attention to the economical–social–environmental challenges of the future, the upper-middle income countries need to be assessed deeply. In the case of Mexico, exergy analyses are scarce, mainly by its economic or social sectors [38,39,40,41]. Energy analysis has been widely used by the academics and Mexican government agencies. However, it needs to be employed with care due its limitations as criteria to assess energy-related projects. Thus, Hammond [42] has argued that it is important to employ exergy analysis based as a complement to the existing methods to develop official reports and environmental and energetic strategies. Little is known about the Mexican society and its industrial sector despite its relevance due to its growing market and its strategic geographic location in between North and South America. The aim of this work is to explore the energy and exergy consumption rates as well as the changes of the efficiency of energy (η) and exergy (ψ) utilization of the industrial sector to detect areas in need of improvement. Additionally, exergetic renewable share and exergy efficiency are computed and then proposed as sustainability indicators with the goal to enhance the interconnection of the exergy concept with environmental issues. A study case was performed over the period from 2000 to 2015 over the industrial sector energy consumption data, thus addressing the gap about the Mexican Industrial Sector (MIS). These improvements could potentially provide significant opportunities for energy savings, withstand by the exergetic renewable share and exergy efficiency, and, in this manner, determine to what extent the resource supply is renewable, and, in effect, more sustainable.

2. Methodology

This section describes the useful exergy analysis accounting methodology applied to develop an energy and exergy analysis of the industrial sector. A case study in Mexico, over the period from 2000 to 2015, was developed. The necessary statistical data have been taken from the Mexican official reports of SENER (National Minister of Energy) from 2010 to 2015. To complete the research data, statistics from IEA (International Energy Agency) website were analyzed. Total final consumptions of energy and exergy were analyzed. The thermodynamic energy and exergy efficiencies of the industrial sector were computed. Besides, the exergetic renewable share was analyzed, and proposed jointly with the exergy efficiency as indicators of sustainability. Finally, a comparison with other countries was established.
In some respects, the current work is analogous to the energy and exergy analysis to assess the energy utilization efficiency in the Turkish industrial sector performed by Utlu in 2007 as a part of a newer study based on the approach of Reistad in 1975 and the previous work of Rosen in Canada in 1992. This energy strategy for Canada and Turkey had a great influence on energy planning elsewhere in the industrialized world. This study draws on research conducted by Rosen [24] and Utlu [28]. A proposal to update the exergy analysis method applied to the industrial sector was completed, thus process heating temperatures, electricity and fossil fuels efficiencies were modified, in the assessment of energy and exergy efficiencies.

2.1. Theoretical Background

Previously, scholars have been studying exergetic techniques on a large-scale. Dincer [43] evaluated the energy consumption of the industrial sector in Turkey to increase its efficiency based on exergetic analyses. To formulate an exergy balance of a non-constant flow system (similar to mass or energy balances), a common scenario requires establishing a control volume as well as a reference environment; it is usually established through a temperature T0 = 25 °C and a P0 = 1 atm. [44]. The flow of exergy entering in a system can be best described as the sum of the totality of their exergies (physical, chemical, potential, kinetic and nuclear exergies) [45]:
E x e r g y   ( kJ / kg ) = E x e r g y P h y s i c a l + E x e r g y C h e m i c a l + E x e r g y K i n e t i c + E x e r g y D y n a m i c + E x e r g y N u c l e a r
If the components linked to the potential, kinetic and thermodynamic exergy are equal to zero in the system, then Equation (1) can be simplified as:
E x e r g y   ( kJ / kg ) E x e r g y C h e m i c a l
If a reversible process is carried out, then the exergy is conserved, otherwise, in an irreversible process, the exergy is always lost or degraded. It can be expressed as the subtraction between the exergy input and the exergy output from the whole system. Therefore, the general equation of the exergy balance is then expressed as:
E x e r g y   o u p u t E x e r g y   i n p u t = E x e r g y   l o s s
In large-scale exergy analyses, the flows of energy mainly include fossil fuels operating at standard conditions of temperature and pressure (25 °C and 1 atm., respectively). The specific chemical exergy of fuels in reference conditions of temperature and pressure (T0 and P0) are usually close or equal to its high heating value (HHV). Therefore, the physical exergy for these flows equals zero. Accordingly, if the total exergy consists of physical and chemical exergies, it is reduced to only the chemical exergy values (Equation (4)).
E x e r g y   ( kJ / kg ) + E x e r g y C h e m i c a l H H V
Examples of the most common values are shown in Table 1 [28,45]. To acquire the values for the Mexican mixture of crude oil, a combination of 50%/50% (by volume) was considered [46]. Then, the quality factors to convert energy to exergy values are determined by Equation (5).
γ = E x e r g y C h e m i c a l H H V

2.2. Computation of the Thermodynamic Efficiencies: Energy (η) and Exergy (ψ)

Previous studies applied different equations to obtain thermodynamic efficiencies to evaluate the control volume [4,15,47,48]. Energy and exergy heating efficiencies derive from the first and second laws of thermodynamics, respectively. Electric and fossil fuel heating processes were chosen to generate products heat Qp at a Tp (constant temperature) either from electrical energy We or fuel mass mf. Then, the efficiencies for electrical and fuel heating are [49]:
ψ e , h = [ ( 1 T 0 T p )   η e , h ]
ψ f , h = [ ( 1 T 0 T p )   η f , h ]
where T0 = 298 K, Low Tp = 315 K, Medium Tp = 414 K and High Tp = 859 K. Then, to compute the electric heating efficiencies, the following equations were applied:
ψ e , h = E x Q p / E x W e
ψ e , h = [ ( 1 T 0 T p )   Q p ] W e
Similarly, to compute the fossil fuels heating efficiencies, the following equations were applied:
ψ f , h = E x Q p / m f ψ f
ψ f , h = [ ( 1 T 0 T p )   Q p ] ( m f γ f H f )
The diversity and complexity characteristics of the industrial sector make the assessment of the accurate conditions of each process (temperature, pressure, thermodynamic properties, etc.) nearly unmanageable. In this paper, we propose to apply some differences to process heating temperatures, and electricity and fossil fuels efficiencies, according to the up-to-date conditions of the industrial sector. Essentially, the changes applied to Table 2 were the following: increasing Mean Tp by all sectors; raising the high range Electrical Heating η (%) from 70 to 75 and increasing the three ranges of Fuel Heating efficiencies (%) to 70, 85 and 100 [42]. To compute the energy and exergy efficiencies shown in Table 3, an extensive investigation was developed to find wider criteria and data of industrial end-use heating temperatures from different manufacturing activities [50,51,52,53]. We utilized the data from Table 2 and the quality factors from Table 1.
Process heating operations are the source of thermal energy to transform materials such as metal, plastic, rubber, limestone, etc., into a wide variety of industrial products. Process heating operations are mainly utilized to raise or maintain the temperature of substances involved in the manufacturing process. Industrial heating processes include drying, heat-treating, calcining, smelting, etc. Examples of process heating systems include furnaces, ovens, dryers, heaters, and kilns. Process heating accounts for nearly 70% of all the process energy (energy applied to convert material into manufactured products) used in the U.S. manufacturing sector [50]. Figure 1 shows that the MIS manufacturing process energy (fuel and electricity used on site at industrial facilities) rounded to 1601 PJ in 2015 with an estimated value of 75% energy sources used just for process heating. Values for U.S. Manufacturing in 2010 rounds to 70% of energy used for process heating, and those of Turkey in 2003 were 78% [28,50].
This work subdivides energy for process heating technologies based on the type of fuel consumed into two categories: fossil fuel and electric systems. Starting from the database of the processes, electrical heating, fuel heating, and heating efficiencies were computed (Table 2). The energetic and exergetic efficiencies were calculated by Equations (5) and (6). Comparing the electrical and heating efficiencies to those of fossil fuels, previous studies stated that the electrical efficiencies are mostly higher. Consequently, their process heating values are the highest (100-90-70 for High-Med-Low heating). To handle and analyze the performance of industrial activities based on the first and second laws of thermodynamics correctly, previous researchers have established approaches specifically designed for these scenarios [6]. The following restrictions were established to simplify the scope of this study:
(1)
Only the heating and mechanical sub-processes inside the facilities were considered once they were around 95% of the industrial energy uses.
(2)
Since fossil fuels and electricity were considered the sources with highest consumption rates inside the industrial plants (97.65% in MIS, 2015) [54], they were employed as the two main sources of energy carriers. In accordance with Utlu’s methodology [28], standard reference operation conditions of the industrial activities were divided into three different categories of Temperature Heating (TH) in terms of heating processes temperatures (Low (LTH), Medium (MTH), and High (HTH)) to be assessed. Table 2 summarizes the conditions and computing of the main methodological steps.

2.3. Computation of the Exergetic Renewable Share (ERS)

Once the exergetic renewable share is proposed as a sustainability indicator, it could be defined by means of the ratio of the renewable sources of the exergy fraction divided by the total amount of exergy consumed by the system, expressed in terms of percent [26]. According to Gong and Wall [55], both exergy efficiency and exergetic renewable share can be considered indicators of the sustainability of a system. Since they embody a relation of energy consumption or exergy in comparable units (PJ, kTOE, etc.), they are therefore dimensionally expressed in terms of the percentage (%). Gong defines the renewable fraction as “the fraction of resources that has a source of renewable energy among the total resources consumed in the system”. The development of exergy based indicators shows a relevant role in search of sustainable societies [56]. Agreeing with Dincer, Rosen, Haselli, et al., our proposal in this paper is based on the approach that, once exergy efficiency tends to increase, environmental impacts (air emissions) conversely decrease, and thereafter sustainability will increase [8,10,16,57,58,59]. One of the reasons behind the computation and comparison of the exergetic renewable share with the exergy efficiency in our study case was to observe their performance. While searching for the renewable share analysis of the MIS, due to the lack of reliable data sources, the previously quoted five SENER reports’ databases were analyzed to be consistent with the computed overall exergy efficiencies.

3. Study Case

3.1. Mexico, Economic, Energetic and Environmental Issues of the Industrial Sector

Mexico is a developing country, with a population of around 126 million inhabitants in 2015, living in nearly 2,300,000 km2 [60]. Its economy is the second largest in Latin America and the 15th largest in the world. Since 1994, it belongs to the Organization for Economic Co-operation and Development (OECD) and the North American Free Trade Agreement (NAFTA). The positive effect of these two keystones allows a constant economic growth [61]. Between 2000 to 2014, the MIS averaged 35% of Mexico’s GDP. In terms of oil power, in 2015, Mexico was the world’s tenth major producer of oil and holds approximately 11.1 billion barrels of oil reserves. Mexico remains as one of the ten non- Organization of Petroleum Exporting Countries (non-OPEC) major producers of oil, and has been for the last four decades [62,63].
Consequently, it is one of 20 countries with the highest global index of GHG production [64], since fossil fuels are still the major source of energy production for the domestic and productive sectors of the Mexican society. According to the energy ministry (SENER), the industrial sector is the second-largest consumer of energy, preceded only by the transportation and followed by the residential–commercial and agricultural sectors. In 2015, the MIS reached 32% of the total national consumption, a growth of 3.3% with respect to the previous year. Nearly 50% of the total consumption corresponds to the manufacturing industry. However, its environmental problems are also increasing [65]. Several studies report that the eco-performance of the MIS is unsatisfactory with limited and unrealistic goals and policies [66]. In terms of CO2 generation, at sectorial level, MIS was the third bigger contributor, preceded just by the Conversion (35.1%) and Transportation (34%) sectors in 2015. These sectors account for nearly 90% of the total amount of CO2 generation in Mexico [67]. There are ten main industrial and commercial corridors, where the highest polluting sources are located [68].
The Mexican government committed itself through the Special Climate Change Plan (PECC) to a goal of 50% reduction in the total emissions of CO2 by 2050. The industrial sector is a key player to achieve the goal to reduce 202 of the country 973 Mt CO2 eq by 2030 [69]. To solve this problem, it is essential to contribute to and improve the evaluation and reduction of GHG production of the MIS. Therefore, the relationship between the consumption of fossil fuels to produce energy and the generation of GHG requires the evolution of environmental and energetic policies concerning a strategic economic player such as the industry.

3.2. Data Source

According to International Energy Agency (IEA) reports, data from Mexico are available from 1971 onwards, although the Mexican authorities submitted data to IEA for the first time in 1992. Since then, they are frequently reviewed and projected for the previous years [70]. Therefore, statistics were selected from Mexican official reports [54,69,71,72,73], even though reliable statistics between 1990 and 2000 are hard to find, and tend to be inaccurate [74,75,76]. Due to the lack of reliability, a more trustworthy dataset was selected for the period from 2000 to 2015. However, some breaks in the time series may occur and the values of SENER compared with those of IEA may differ significantly. Then, in this study, databases from SENER were analyzed once they reflected the whole sector and all the sub-activities for the sixteen-year gap. Considering their patterns of consumption and their relevance for the industry in economic and social development, five of the main branches selected in the study are high energy-intensive industries (HEII) consumers. They encompass around 38% of the MIS in 2015 [54]. Figure 2 describes the Mexican Society Sectors, their whole interactions and the breakdown of the industrial activities (shaded components) reviewed in this paper.
The remaining industrial subsectors (contained within the other manufacturing activity) include nine types of manufacturing: glass manufacturing, pulp and paper, alcoholic and non-alcoholic beverages, automotive, etc. [75].

4. Results

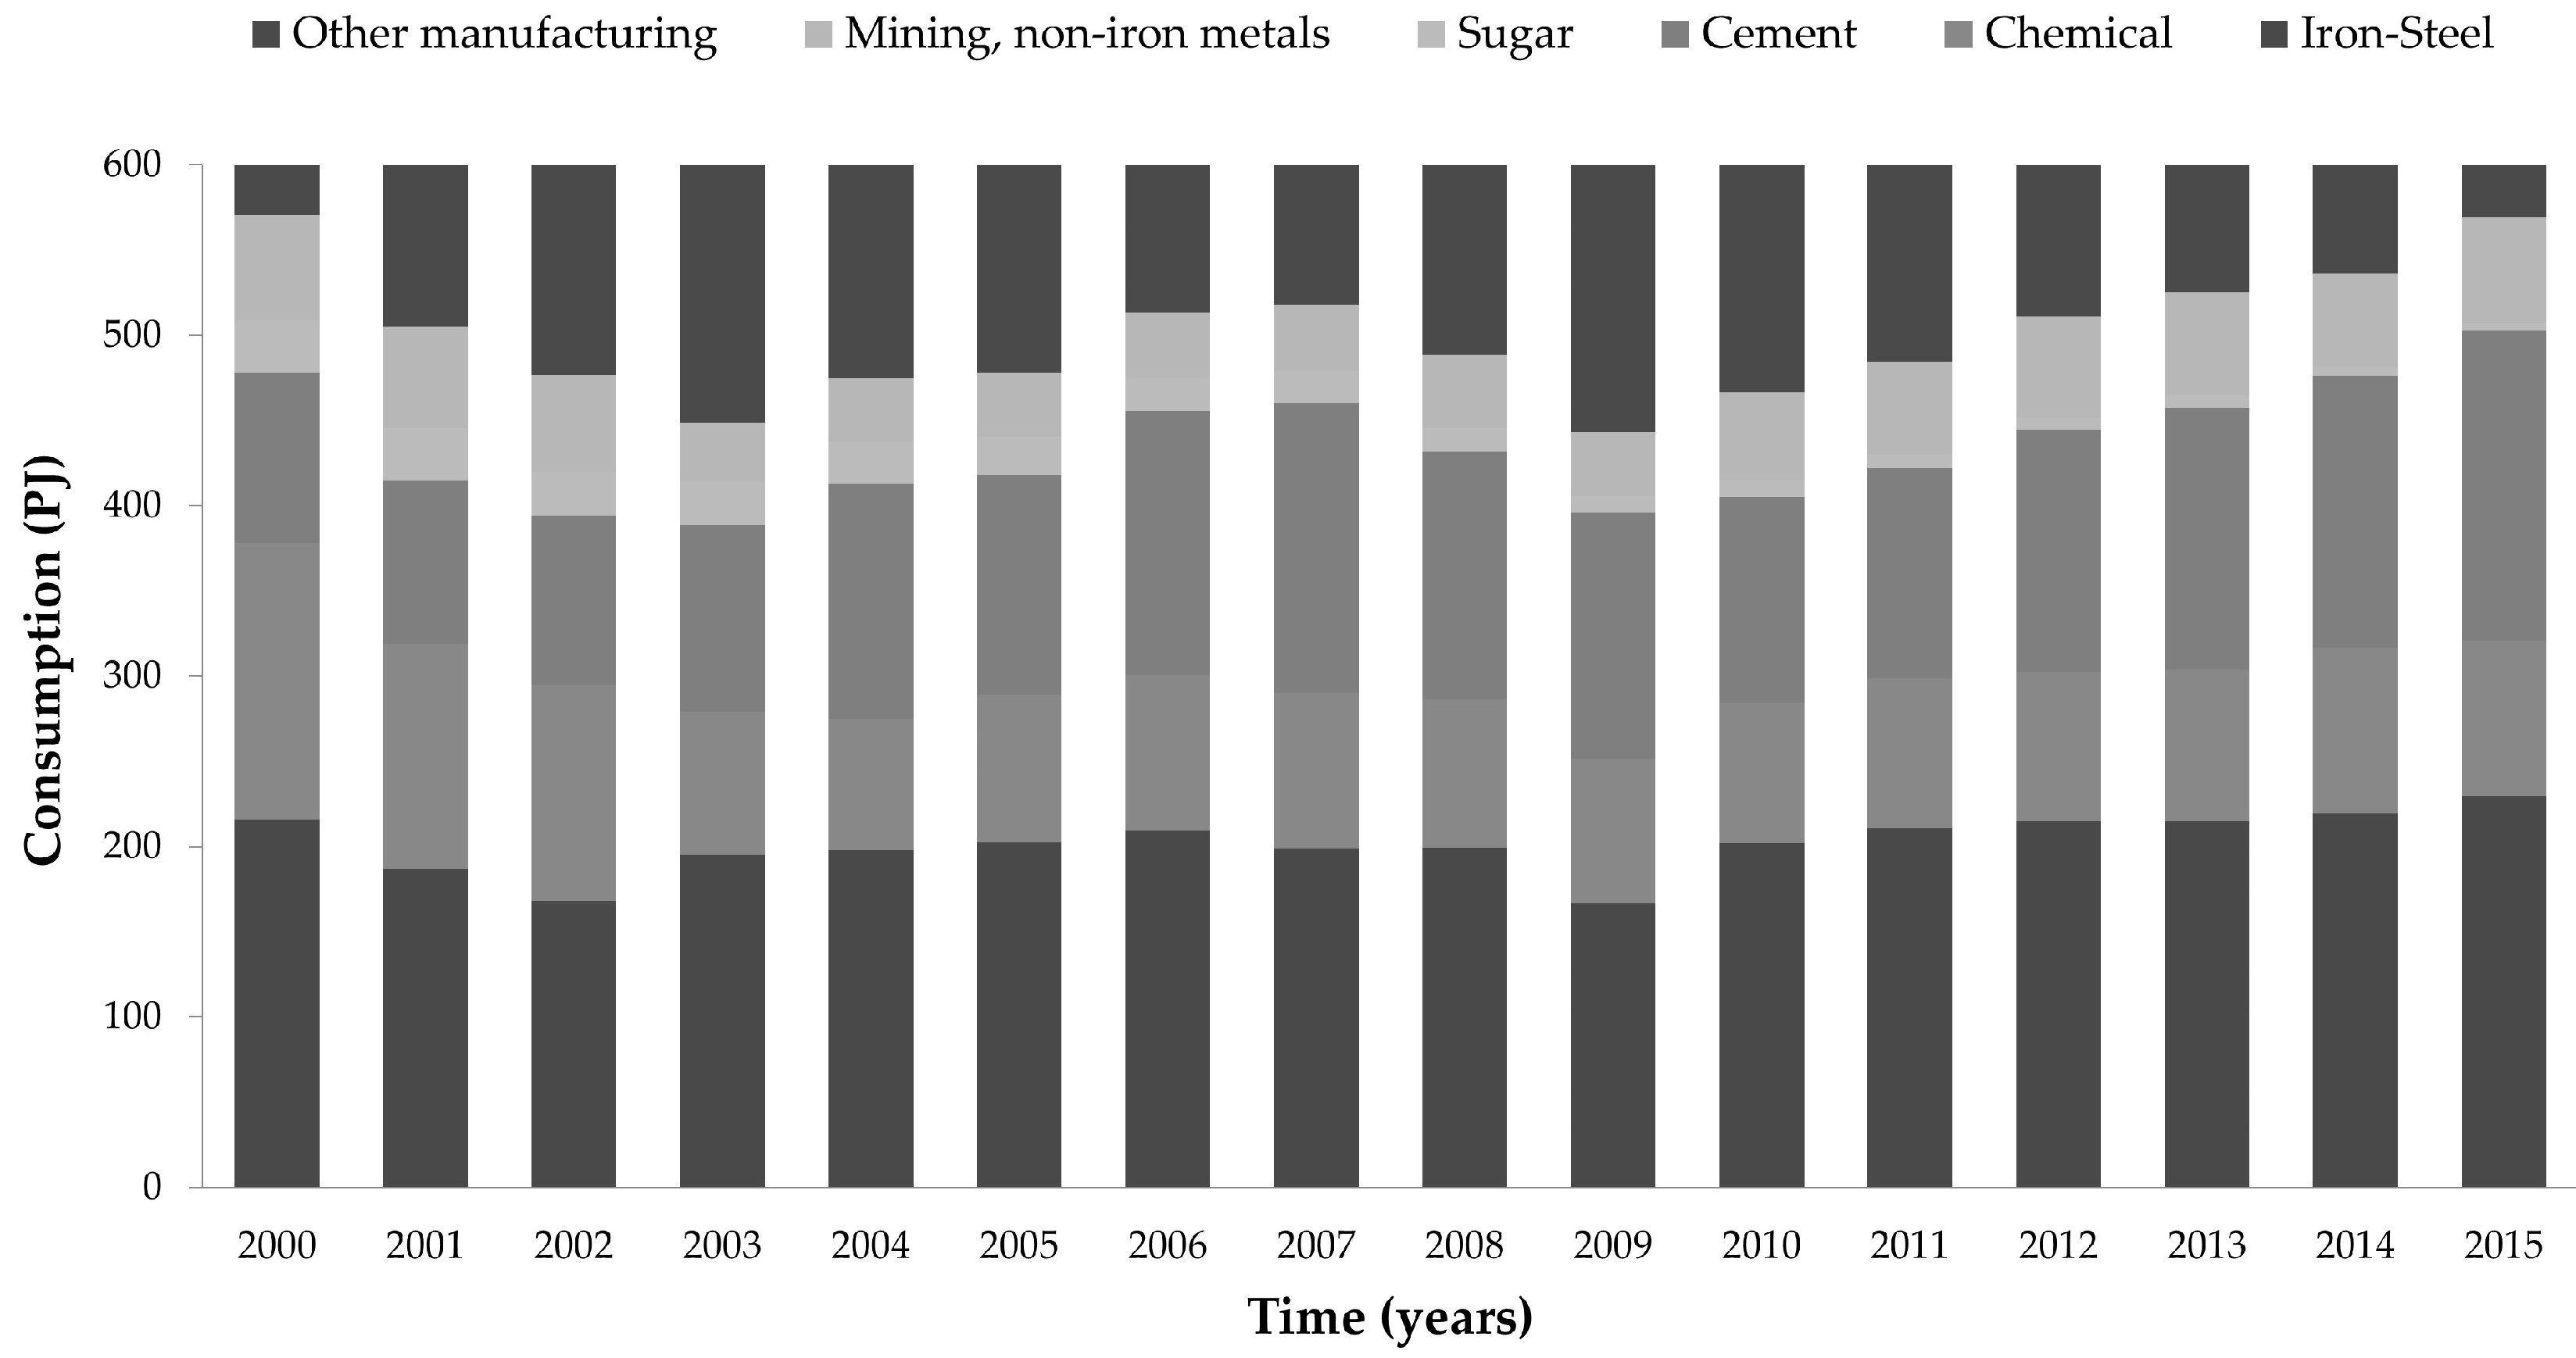
4.1. Mexican Industrial Sector (MIS) Exergy Consumption

Figure 1 shows the results of exergy input consumption (PJ) for the period under study considering fossil fuels and electricity as the two main sources of energy. Consumption of exergy during the whole period shows a general increasing pattern, from 1350 PJ in 2000 to 1591 PJ in 2015. By subsector, the same increasing trend was depicted, except for the sugar subsector with an extreme decrease of 86% of exergy consumption. This trend is similar to the energy consumption reported by SENER, since they keep a direct proportion of the energy inputs and the quality factors expressed in Table 1. Regarding its historical evolution along the 16-year span, a marked downward variation between 2009 and 2010 is observed in two subsectors: iron and steel and Cement.

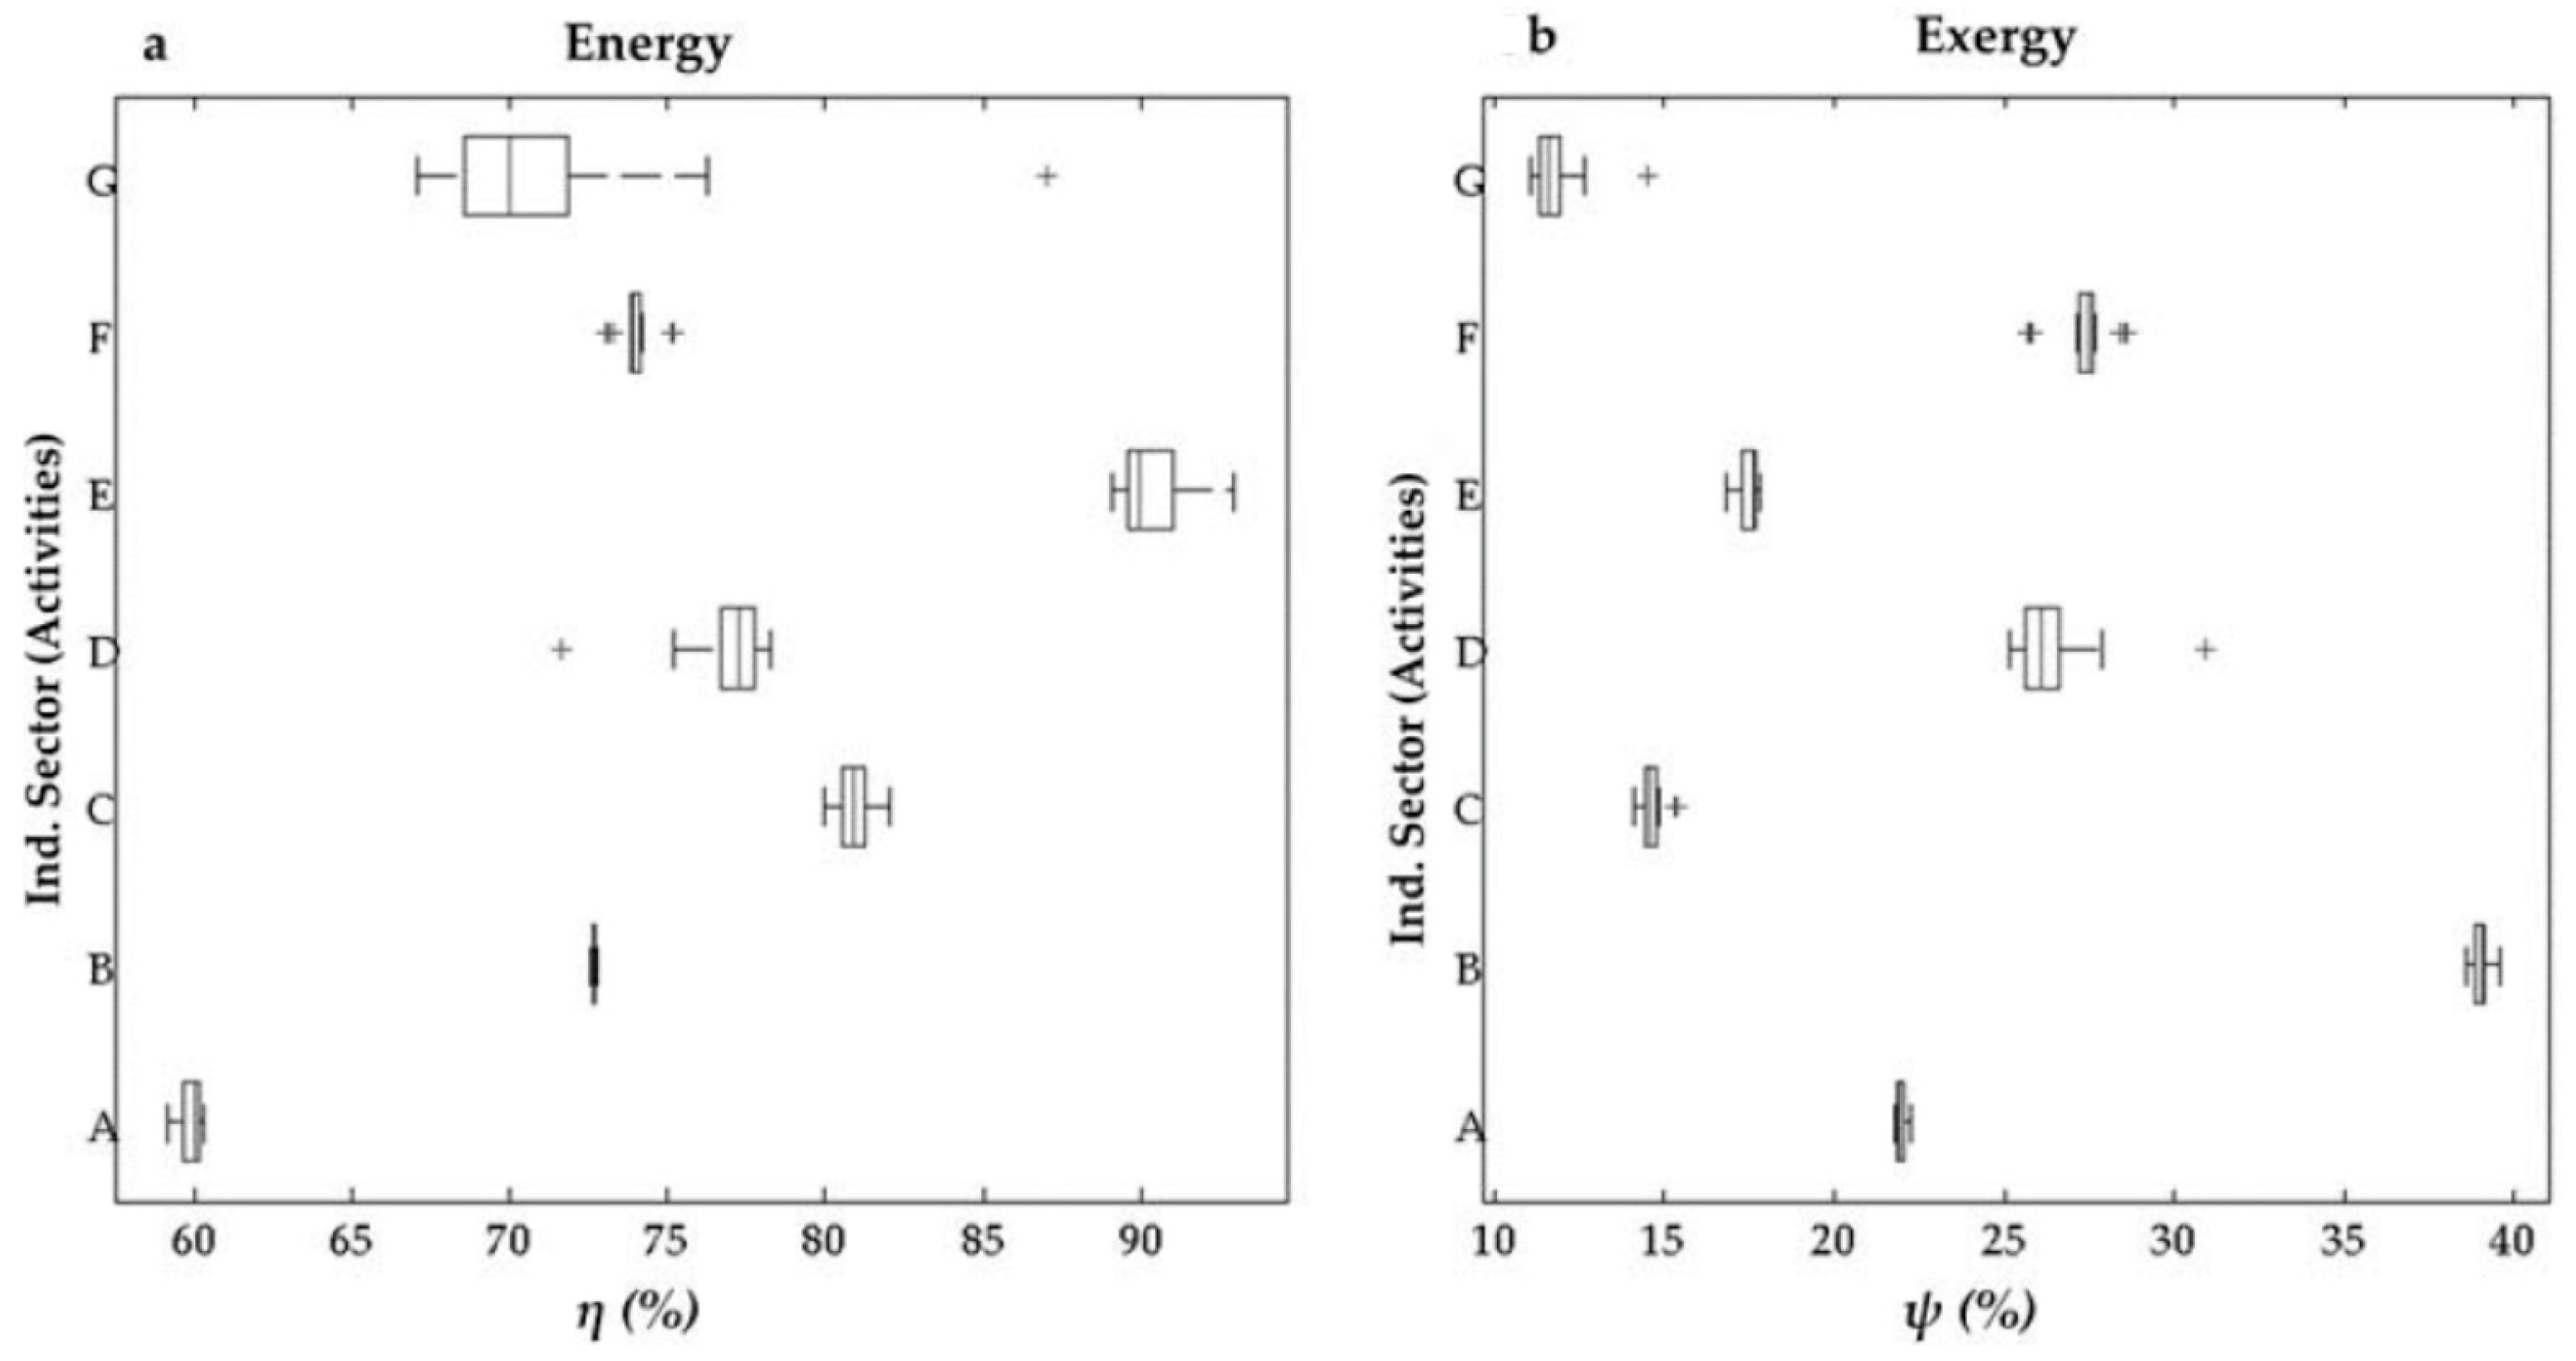
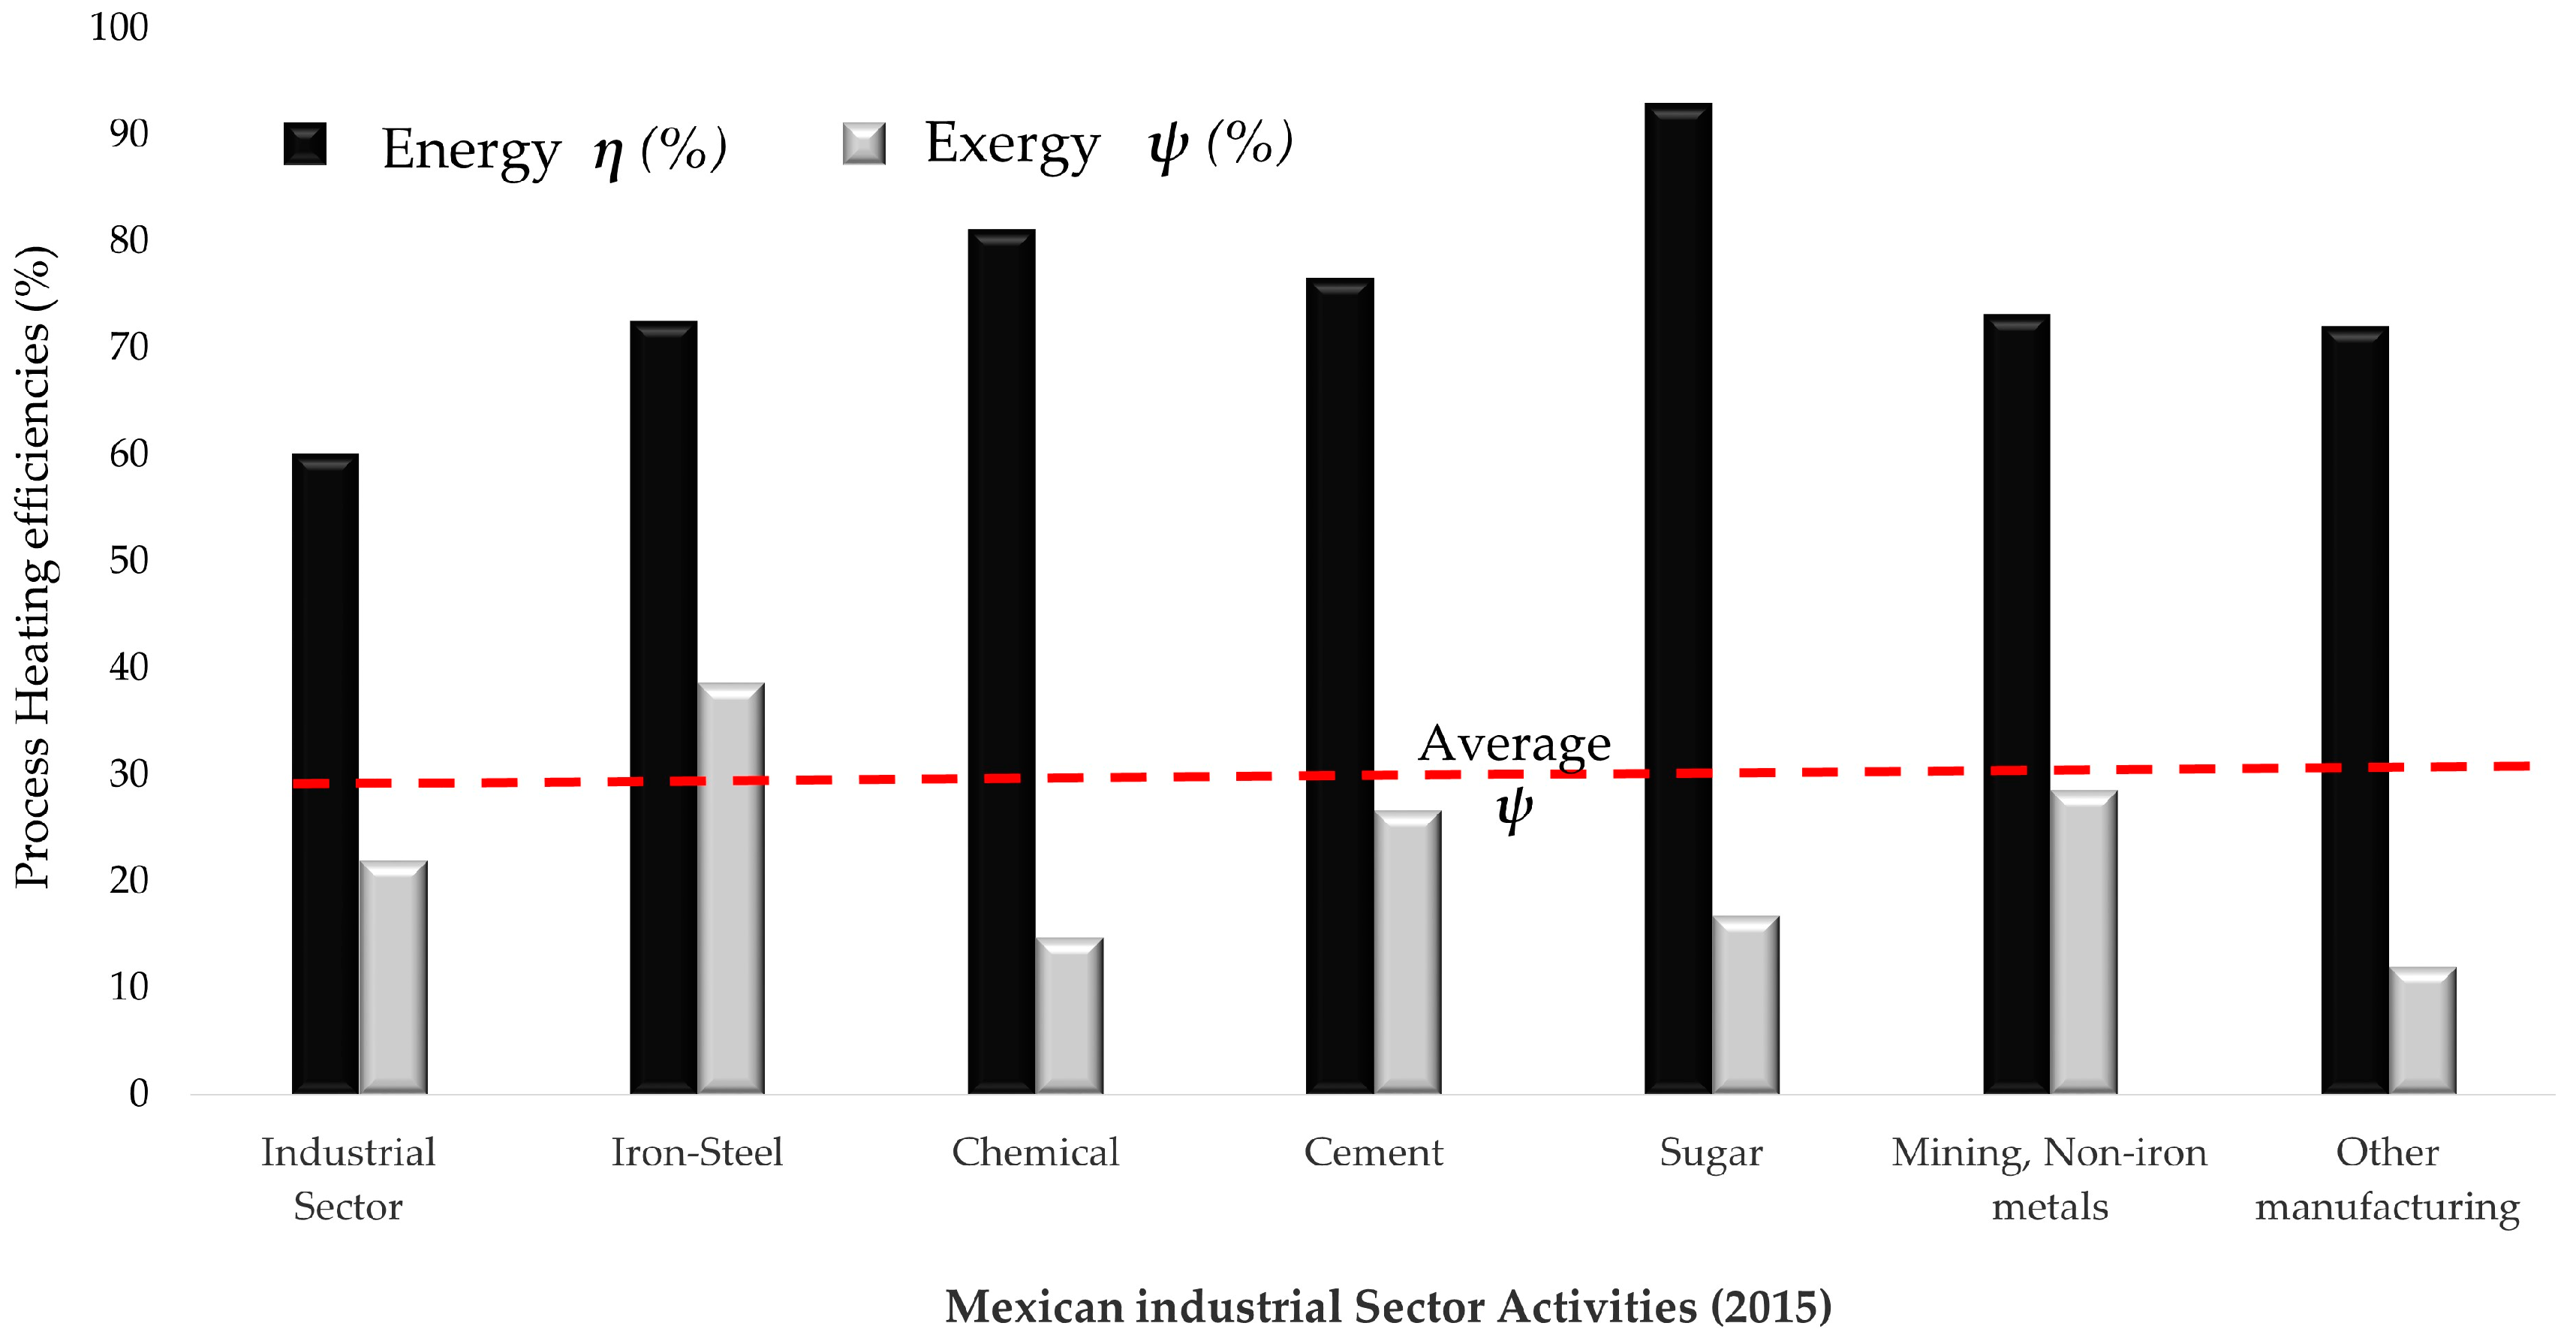
4.2. Mexican Industrial Sector (MIS): Energy (η) and Exergy (ψ) Efficiencies

Both efficiencies were computed from the data obtained and shown in Table 3. After we applied the changes to the method, overall energy efficiency η values were higher for all the activities, even higher than those previously reported by Utlu in 2007; among the six activities and over the 16 years of the study for the SIM, results ranged from 67% to 92%, with an overall average of 78%. On the other side, exergy efficiencies ψ shows lower results, from 11.08% to 38.59% and an overall average of 22.78%. Once the values of η and ψ efficiencies were computed, the results displayed steady and similar trends of increasing or decreasing along the 16-year spam. Individually, the sugar industry portrayed the biggest η (90.4% overall) and the iron and steel industry the biggest ψ (39.02% overall). In these results, it highlights that according to SENER reports [54,71], the iron and steel industry shows the highest ψ due the employment of electric arc furnaces. In contrast, and the sugar sector displays the major η essentially due the usage of cane bagasse as an alternate fuel (a renewable source).

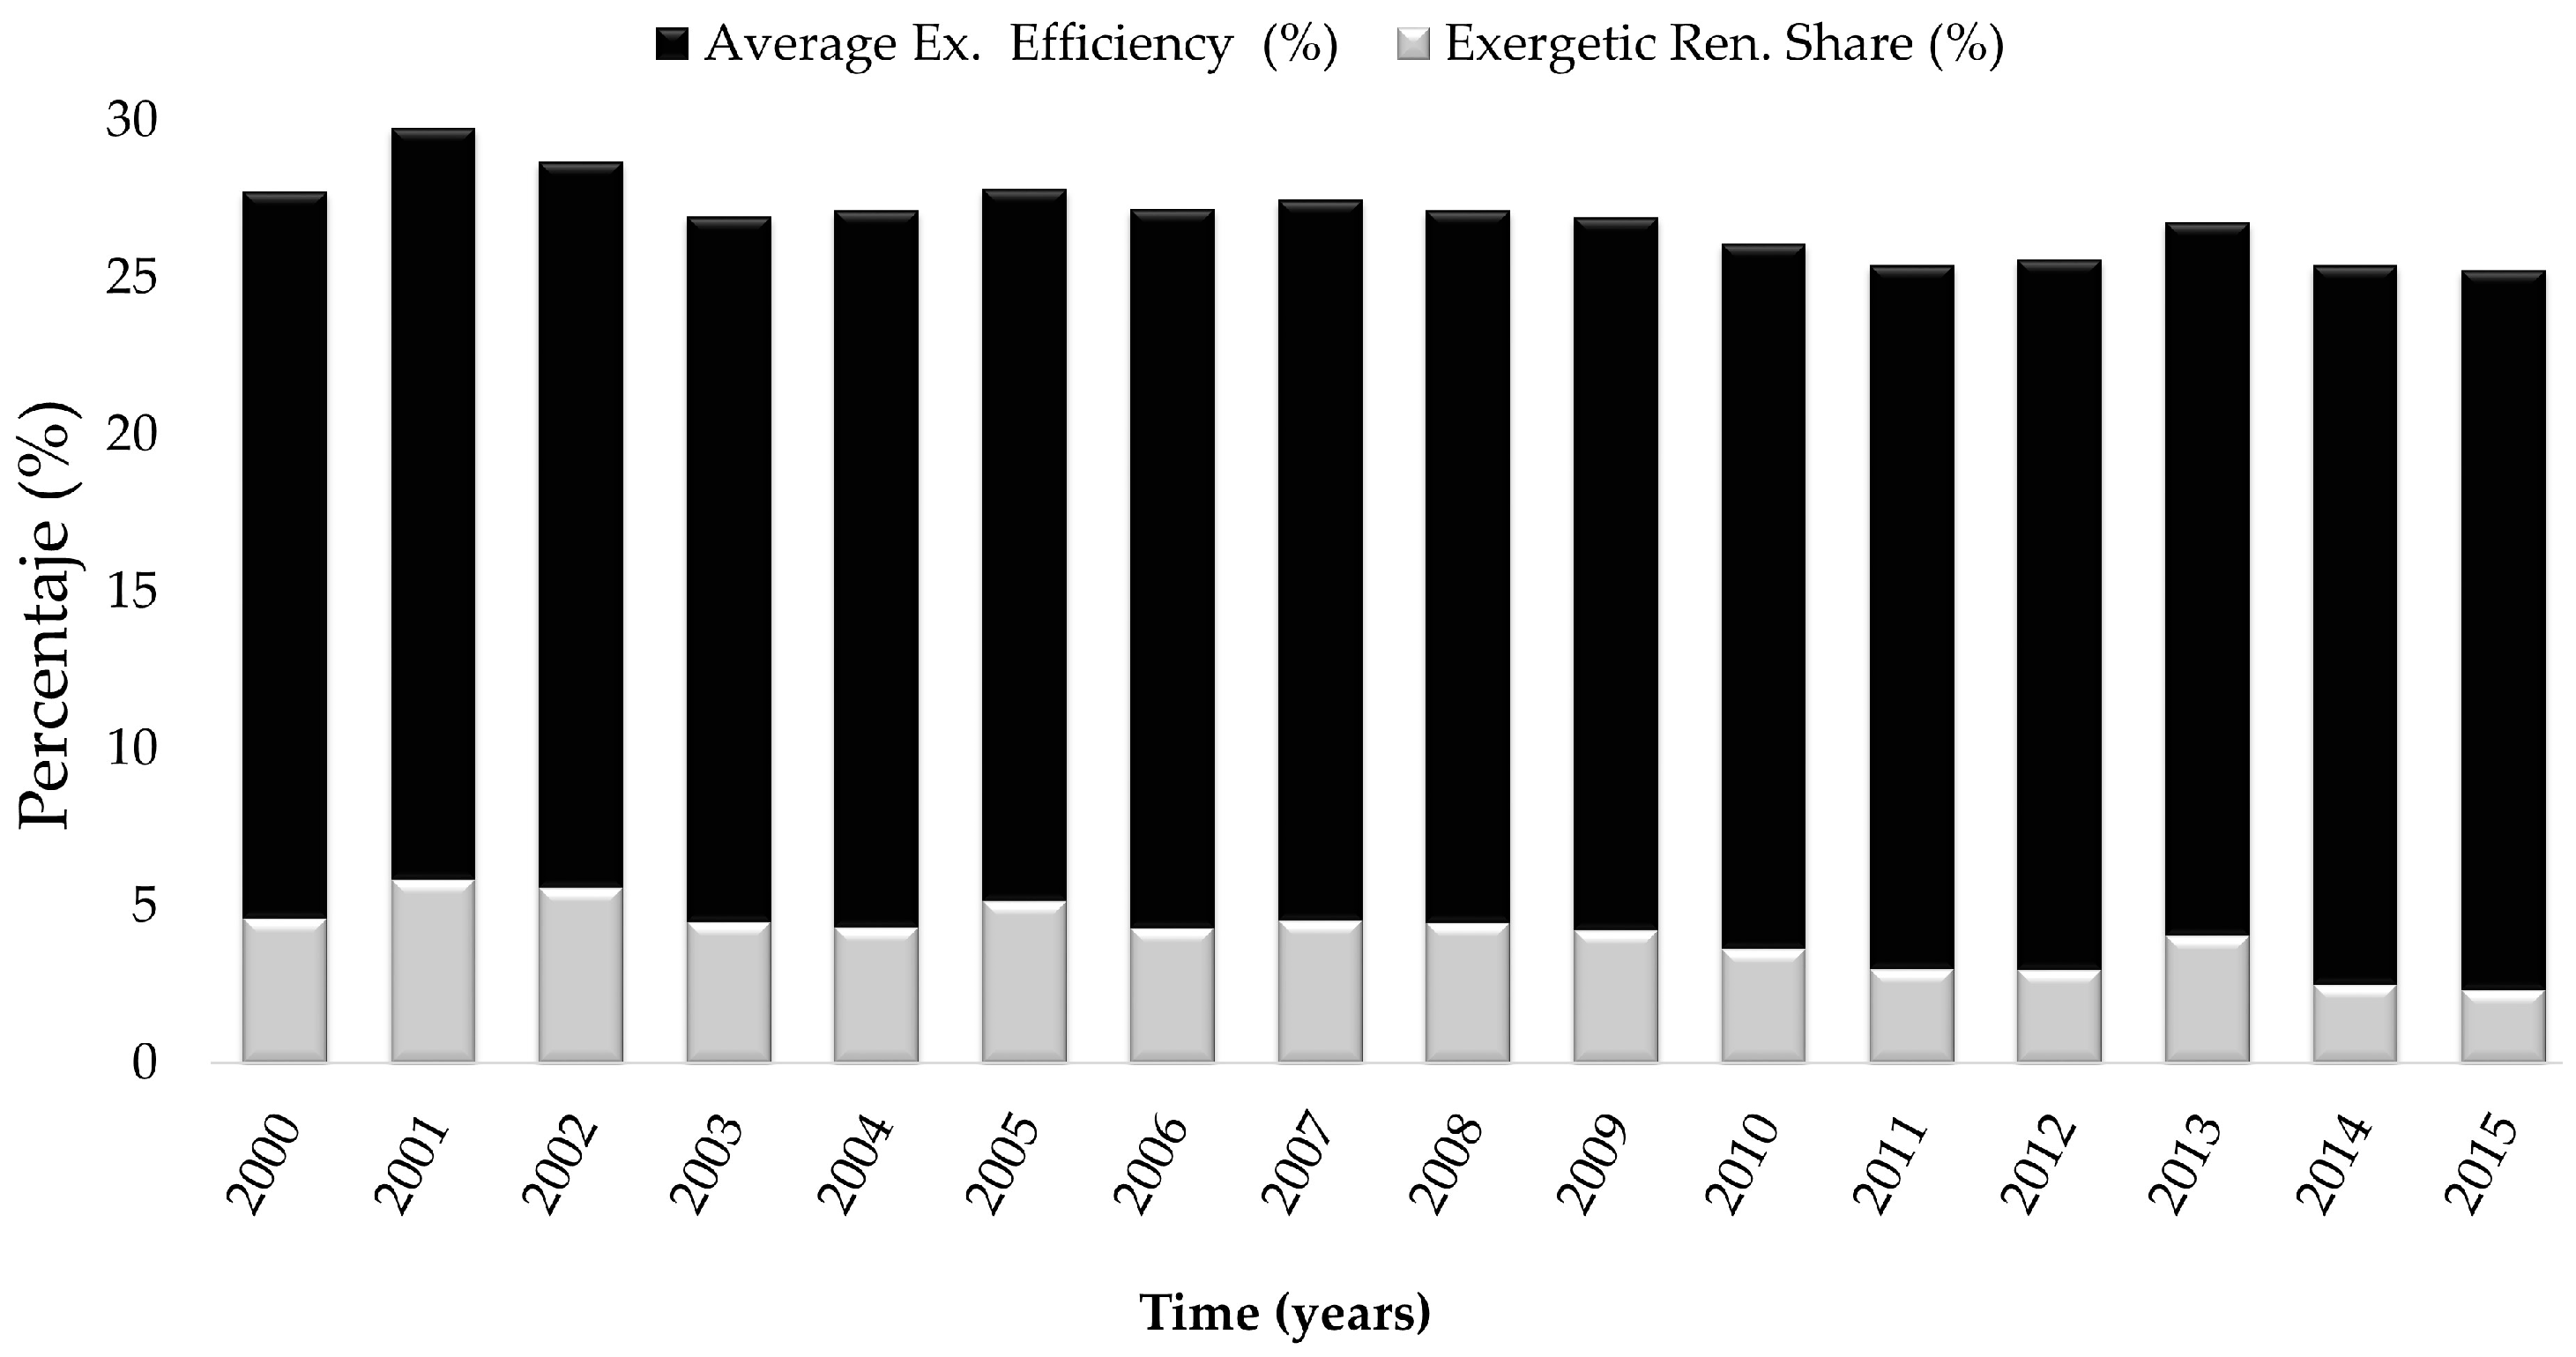
4.3. Mexican Industrial Sector (MIS) Exergetic Renewable Share (ERS)

During the period of study, the consumption trend of renewable sources of energy in Mexico shows a remarkable 40% decrease during the 16-year span. The trend decreases from 62 PJ in 2000 to 37.4 PJ in 2015. The main source was biofuels and waste, primarily provided by the industry of sugar as cane bagasse. In addition, this subsector was the major consumer of cane bagasse once it was an important by-product of its own manufacturing processes. Table 4 depicts the decreasing trend during the whole span with an interesting 48% exergetic renewable share decrease during the period of 16 years. The final consumption by the industrial sector of solar and geothermal energy accounts for just 0.46 PJ in 2015, a number that reflects how hard the Mexican industry needs to work to improve its renewable share. The final consumption as a country for all sectors accounts for a small 9 PJ in 2015.

5. Discussion

5.1. Approach to Update the Exergy Analysis Method Applied to the Industrial Sector: Case Study Application

In this paper, we propose to apply some differences to process heating temperatures and efficiencies according to the up-to-date conditions of the industrial sector. Essentially, we focused our attention on Table 2, modifying process heating data: increasing Mean Tp by all sectors except sugar; raising the high range electrical heating η from 70% to 75%; and growing the three ranges of fuel heating η, from 70%, 85% and 100%. After testing changes to observe their influence on the computing of energy and exergy efficiencies, results show a slight increasing tendency. It is interesting to note that, even though several authors have studied societal sectors, few of them (Rosen, Utlu, and Bouromandjadzi [6,28,29,77]) have shown details of their methodological steps to developed exergy analysis to the industrial sector, and dissected the complete sector by subsectors.
Contrasting our results computed and shown in Table 3 with those of Utlu in 2007, highlights the influence of the proposed modifications (to the processes heating temperature and the electrical and fossil fuels heating efficiencies to compute the overall energy efficiency), resulting in an overall 10% to 20% energy efficiencies, higher than Utlus’s results. The main trend among both efficiencies is generally similar for both studies. In 2013, Boroumandjazi quoted values between 12.95% and 18.52% for mining (and quarrying), compared to 25.69% and 28.61% for the MIS. He also refers to Iranian industrial sector results of around 63% and 42% for both efficiencies, contrasting with 78% and 23% for the MIS. Rosen summarizes just a few of them, referring to values for both efficiencies in the overall industrial sector (51% and 30%) as well as for iron and steel (52% and 27%), chemical (57% and 32%) and mining (54% and 35%) subsectors. Compared with the MIS results, some similarities were observed in terms of η, as well as differences, e.g. in ψ, with bigger results than MIS.
Concerning previous studies for Mexico, in 2014, Garcia [38] in his analysis of the Mexican non-domestic sector found that exergy efficiency was the highest (19.7% overall) after a comparison with other countries. In 2016, Guevara [39] analyzed the useful exergy and the energy transitions of Mexico, observing the strong dependency of the Mexican economy on fossil fuels (oil and natural gas), and pointed out that the renewable resources reduced their share by 50% while electricity gained relevance between 1971 and 2000. Guevara highlights the lowest automation of the Mexican industry, as Mexico is still more labor-intensive than developed countries.

5.2. Mexican Industrial Sector: Energy and Exergy Consumptions and Efficiencies

After 1994, Mexico’s growing scenario started with an expansion of the anchor industrial subsectors, as a consequence of foreign investments. Despite global efforts to improve energy efficiency, the industrial sector remains one of the main consumers of fossil fuels with global numbers from 30% to 70% [15,78] of the total consumption. This confirms the growing trend of energy consumption of the MIS results during the analyzed 16-year period (18.6% by the MIS and 10.2% for fossil fuels), with maximum rates in 2015 for fossil fuels. By 2015, in the whole sector, iron and steel production (210 PJ) and cement industries (147 PJ) were the largest consumers of fossil-fuels. Five of the main activities consumed 45% of the 1024.2 PJ used by the MIS.
A descriptive analysis was developed to observe the behavior of both efficiencies. Figure 3 summarizes the differences in the dispersion values when comparing them. Figure 3a shows the results of the exergy efficiencies, a narrow dispersion characterizes the results from the MIS and four of the subsectors (iron and steel, chemical, sugar and mining). From a contrasting point, dispersed values belong to two subsectors: cement and other manufacturing. It highlights the other manufacturing industrial activities displaying the lowest average values of exergy efficiency than the other subsectors (11.8%), mainly due to the diverse and wide range of activities utilizing energy sources with low levels of HHV. Figure 3b shows the results of the energy efficiencies. Here, narrow dispersion characterizes the results of three of the subsectors (iron and steel, chemical, and mining) and the MIS. Conversely, dispersed values belong to three subsectors: cement, sugar and other manufacturing. It highlights the sugar industry displaying the highest average values of energy efficiency of all subsectors (90.5%).
To observe the MIS performance in terms of energy inputs, differences were detected in terms of increasing or decreasing values of energy or exergy efficiencies during the 16-year span, comparing the extreme years (2000 vs. 2015). In summary, we can claim that we observe remarkable differences for both efficiencies. In terms of energy, we can observe that the overall value for the MIS decreases 0.35%. Contrarily, we detected decreasing consumptions in the remaining five of the six subsectors with results no bigger than 1.5%. To summarize, both efficiencies behave similarly, with constant trends of increasing and decreasing peaks generally no bigger than 2% or 3% (exceptionally, 4%) along the entire 16-year span. Consequently, areas in need of improvement were detected to confirm one of the main goals of this research.
We consider there are different reasons behind this behavior: technological improvement, raw materials, good environmental practices, and, mainly, the type of fuel [24]. In summary, the most noteworthy differences between energy and exergy efficiencies are mainly attributable to heating processes. High heating efficiencies must be used to bring high end-use demands; however, the opposite occurs. It suggests areas in need of improvement for most of the subsectors. Consequently, the overall exergy efficiency of the sugar subsector is significantly lower (17.6) than the overall energy efficiency (67.31).

5.3. Mexican Industrial Sector (MIS): Thermodynamic Efficiencies Comparison to Detect Areas in Need of Improvement

The exergy analysis (2000–2015) displayed some considerable differences between the overall energy and exergy efficiencies in the Mexican Industrial Sector. This disproportion indicates available energy losses, which could be a factor of sectorial inefficiencies, and, consequently, areas in need of improvement. Focused on the differences between the results of the overall energy and exergy efficiencies, we could establish that there is potential for energy optimization, since the exergetic efficiency identifies the irreversibilities of the system under study [79]. Figure 4 is a sample illustration of the year 2015. It depicts differences between the computed statistic median thermodynamic efficiencies for the whole sector. The iron and steel industry shows the lowest gap (33%), in contrast to the sugar industry (76%), the chemical industry (66%) and the other manufacturing industries (60%). These results can be based on the slight differences among the energy sources used by each sector.
Essentially, for the analyzed 16 years, the sugar industry seems to perform best based on its highest overall energy efficiency (70.9%) but its corresponding exergy-based performance is the lowest (17.4%), and its difference for improvement is the largest of the sector (49.7%). A similar analysis of the iron and steel subsector confirms the previous claim. For the 16 years analyzed, it seems to perform best based on overall energy efficiency (72.6%); its overall exergy-based performance is the highest (33.9%) of the MIS; and its difference for improvement is the lowest of the whole sector (12.9%). These exergy losses or irreversibilities from manufacturing activities embody the true thermodynamic inefficiencies of the sector. The main reason behind this behavior occurs because electricity (a high-grade source) is still commonly utilized in low-grade in the sugar, chemical and other manufacturing subsectors [26,38]. Regarding improvement areas based on energy and exergy analysis, effective energy diversification strategies are needed by the MIS to achieve greater exergy efficiencies. The core actions detected as needing to be developed and focused on are: regulations and standards; fiscal policies; agreements and targets; reporting, benchmarking, and training programs; and technological improvements. These strategies have been successfully developed in other countries [51,78,79].

5.4. Mexican Industrial Sector (MIS) Exergetic Renewable Share (RS) Compute and Comparison with Overall Exergy Efficiencies

Figure 5 shows the comparison of renewable share and exergy efficiency. In accordance with Gong [26], the renewable share is expressed as a sustainability indicator of a system under study. Subsequently, once exergy efficiency and the exergetic renewable share were computed, we established two sets of analyses. First, the evolution of the MIS through the complete span of study were computed (Table 4). Then, exergetic renewable share and exergy efficiency by means of sustainability indicators were also computed.
In regards to the MIS renewable exergy evolution, the rates tend to decrease during the 16-year span (about 38 PJ), with a lower mark by 2015, even though the sugar subsector increases its share of renewables. These results, to some extent, are linked with the semi-constant maturing of the Mexican economy. Since 2000, the energy demand in Mexico has grown by a quarter, and the electricity consumption has grown by half [70]. Regardless of almost constant values for exergy efficiency, the exergetic renewable share shows irregularity (with a maximum of 5.9% in 2002, and a minimum of 2.4% in 2015). For the whole period of study, the average computed values for the MIS were 4.1% for exergetic renewable share and 22.8% for exergy efficiency. According to the IEA reports on future Mexican Policies Scenario [70], electricity demand will remain one of the two main sources of energy. At the same time, to minimize the intensity of the use of fossil fuels, electricity demand in Mexico will grow at an average annual rate of 2.4% between 2014 and 2040—a pace faster than the OECD average. Then, sustainable analysis and practices are mandatory for these future scenarios, considering the challenging dependence of fossil fuels in an oil producer country.

5.4.1. Mexican Industrial Sector (MIS) Comparison of Exergy Efficiencies (ψ) and Exergetic Renewable Share (ERS) as Sustainable Indicators

A thorough literature review of previous studies was carried out to establish a comparison between MIS results and similar ones. The work by three main scholars, Ertesvag, Bligh and Utlu [25,30,49], offer a total of 16 different countries, 21 different years and 41 data series within nearly 75 references, with an exergy efficiency average of 38.4% [6,18,22,24,25,30]. To construct Figure 6, the main criterion was based on the countries with bigger exergy efficiency values, including data from the OECD and the world with an average 47.9% exergy efficiency. Starting with IEA website databases [80], we reviewed the energy balances by country, and obtained the values of Total Energy Inputs (total final consumption) and the values of renewable sources for the industrial sector consumption (hydro, geothermal, solar, biofuels and waste).
At first sight, the exergetic renewable share of three countries, namely Brazil, Finland and Sweden, are above average with respect to others. MIS results are the second lowest due to a low share of renewables, above just Iran and the Netherlands. Equally important, comparing the exergy efficiencies of the MIS, the graphic shows that its results (22.9%) are a little farther from most of the results in this graphic. The closest are those of the world in 1990 (27%). In summary, comparing the Mexican Industrial Sector’s overall exergy efficiency with other countries, the results of the MIS were lower, poor exergy efficiency is still occurring. It confirms that improvement of 14% at least are needed to reach the average mean value obtained (37%) (Figure 6). This divergence may be related to different sources of energy and technological advances through time. Due to the different methodological approaches to collect and analyze data, in terms of exergy efficiencies, this comparison offers a valuable idea for the industrial sector, even though it is always a challenge to equate and contrast different societies around the world. According to Banerjee, the overall global exergy efficiency rate is only 30%, an indicator that persists despite numerous energy efficiencies improvement opportunities through research and development for next generation industrial processes [51].
Although this is a small sample of the industrial sector worldwide, the results of our study could be generalized to those high energy consuming industrial activities. We are aware that the methods applied to previous exergy analyses of the industrial sectors and in our research may have limitations. In a strict physical sense, some societies seem more efficient than others; however, in a broader perspective, a country or a society cannot be simplified like this [25,26]. In addition, beyond the lack of available data from previous and actual flows for energy balances, renewable shares, exergy efficiencies and the years in which those studies were developed could influence the results. The more recent the analyses are performed, the more improvements in methodological steps there would be. Consequently, the greater the number of renewable energy sources, the greater the number of positive factors inducing societal exergy improvements we could obtain. Moreover, when analyses conducted during different periods are utilized to compare worldwide societies, a certain degree of risk would remain.

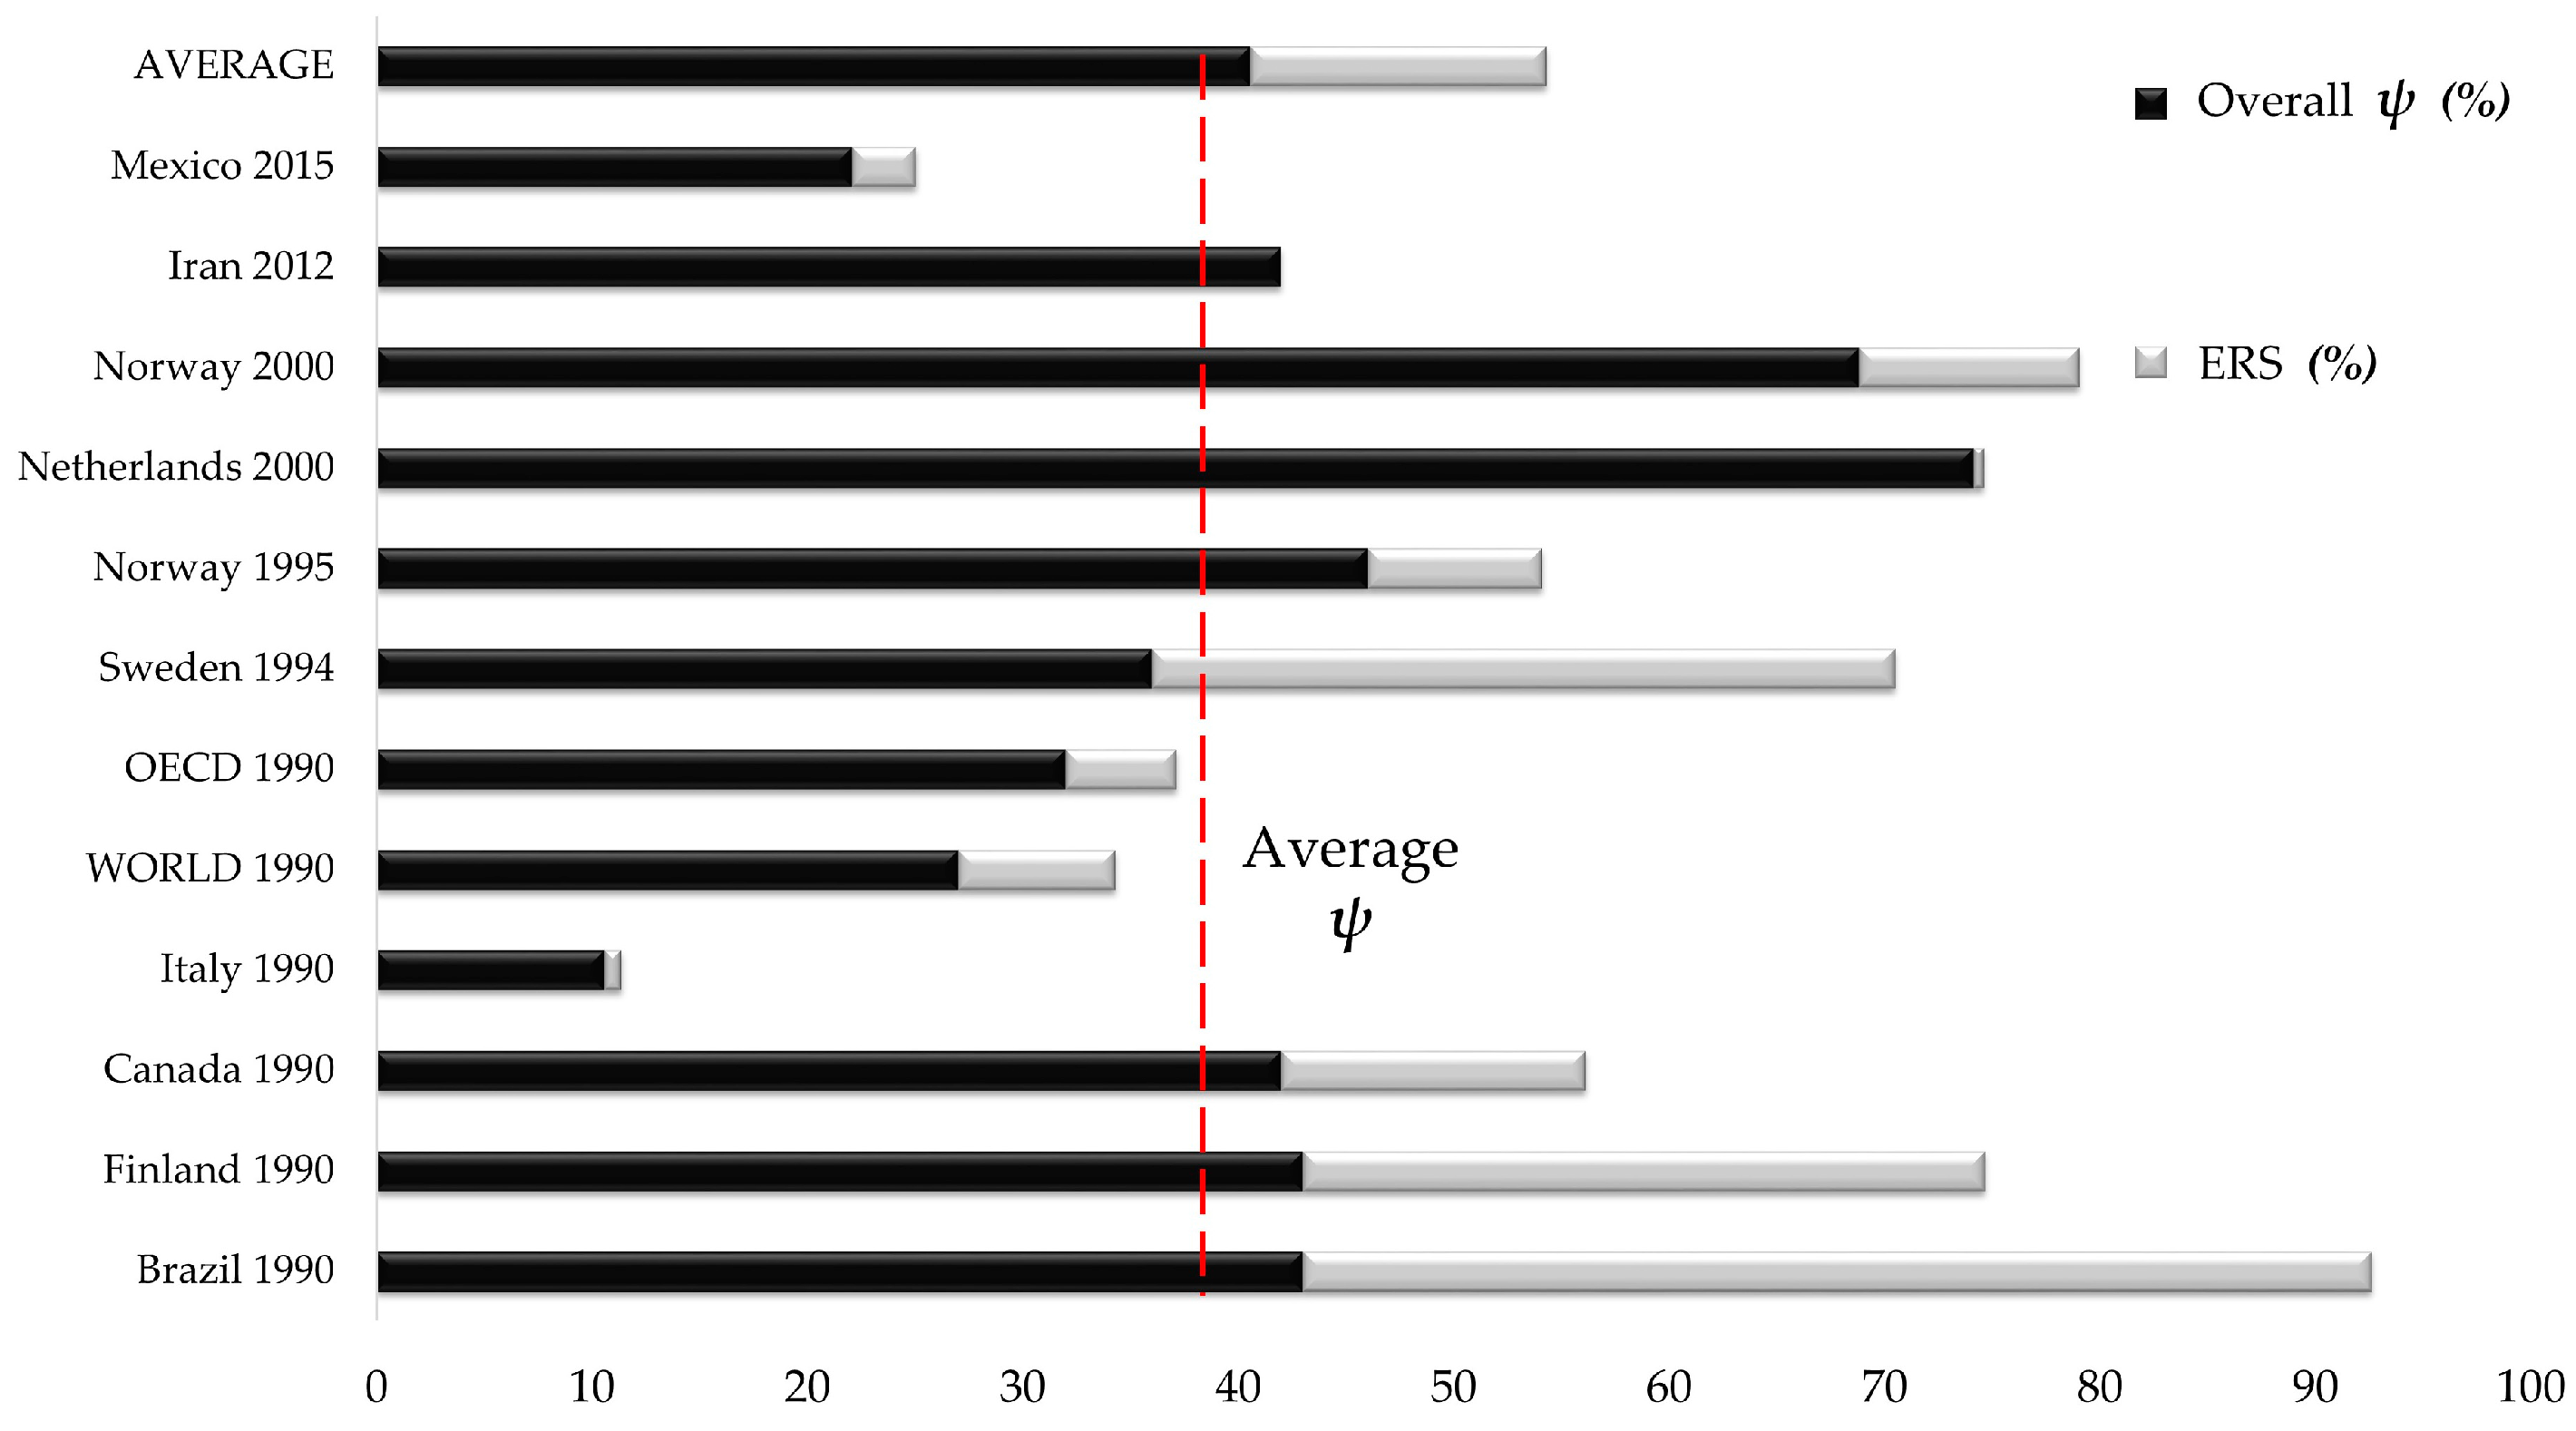
5.4.2. Mexican Industrial Sector (MIS) Comparison of Exergy Efficiencies (ψ) and Exergetic Renewable Share (ERS) with Other Countries

To compute the country’s ERS, we followed the same methodological steps used previously to compute MIS-RS with the IEA data sources [80]. It is noticeable that this database offers only values from 1990 to 2015. Therefore, our approach takes values from 1990 as the minimal criteria for those countries with previous exergy efficiencies studies (Brazil, 1987; Finland, 1985; and Canada, 1986). Figure 6 displays results for both indicators, with average ERS values of 13.7%, with the highest of 49.6% (Brazil) and the lowest of 0% (Iran, 2012). Similar values of both factors give Brazil the biggest results when comparing countries, contrasting with the Netherlands with the second-biggest exergy efficiency but with the second-lowest exergetic renewable share of 3%. It is interesting how Brazil has been increasing their exergetic renewable share since the 1990s, based on a strong infrastructure to produce renewable fuels, supported by a positive value in their general energy balance.
The MIS exergetic renewable share value (2.9% in 2015) is considerably below average, mainly due to a poor level of exergetic renewable share (discussed previously in Section 4.3). The graphic shows values for most of the above average countries, as well as those for the OECD and the world. Our study provides additional support for the sectorial exergy analysis methods, with the approach of exergetic renewable share and sustainability index to strengthen the interconnection of the exergy concept and environmental issues. According to Koroneos [56], the development of exergetic indicators could be a useful tool for the location of energy degradation spots, energy conversion, environmental impact producing materials or giving an insight on technology substitutions. One of our goals in this paper was based on the approach that once exergy efficiency tends to increase, environmental impacts (air emissions) conversely decrease, and, hereafter, sustainability will increase. Through the computation and comparison of the exergetic renewable share with exergy efficiency for our study case, we confirm that both indicators confirm this statement [10].

6. Conclusions

The main goal of the current research was to analyze the total final consumptions of energy and exergy, as well as to compare the thermodynamic energy and exergy efficiencies of the industrial sector to detect improvement areas. The research was developed based on a study case in Mexico, from 2000 to 2015. Besides, the exergetic renewable share was analyzed. The following conclusions may be drawn from the results.
This paper has shown the need to update the exergy analysis method applied to the industrial sector; thus, process heating temperatures, electricity and fossil fuels efficiencies were modified. These changes influenced the computation of energy and exergy efficiencies; compared to previous studies, our results show a slight tendency to increase mainly on the energetic efficiencies.
The research has also shown that, since exergy analysis is an extensive and systemic method that detects the maximum amount of work that a system can produce, it is a more suitable tool than energy balances to evaluate and improve the thermodynamic performance of the system. Our results display improvement areas. The comparisons of energy and exergy efficiencies points out the need to increase exergy efficiencies, and the following strategies are proposed: regulations and standards; fiscal policies; agreements and targets; reporting, benchmarking, and training programs; and technological improvements. These should allow the MIS to take a sustainable path. The replicability of our research was confirmed when our results were compared with other countries.
The results of this research support the idea that exergy is different from energy. Scholars claims that it is important to employ exergy analysis to complement the prevailing energy based methods utilized to develop official reports or environmental and energetic strategies. Thus, decision makers in society should consider not only applying energy balances methods to write official reports or design future projects, but also reinforcing them with the exergy analysis methodology, especially since it was demonstrated that exergy provides key elements to improve the energetic performance.
This study has gone some way towards enhancing our understanding of the current methods of sectorial exergy analysis; as a contribution to seal the gap between exergy and the environment theories, the renewable share coupled with the exergy efficiency were proposed as a new approach to boost sustainability. The results of the Mexican exergetic renewable share (ERS), compared with other countries, unveiled the low fraction of the MIS. It is an indicator that continued efforts are needed to upgrade the ERS in a more sustainable path to increase the use of renewable fuels in the industrial sector, not only locally in the Mexican industry, but also globally.
Our approach could be useful for future research to analyze the industrial sector, particularly emerging market economies. Although it is a small study of sectorial societies, our results could be generalized to industrial activities with high energy consumption, contributing to decrease the lack of similar studies. More broadly, research is also needed to develop the exergy analysis of the whole Mexican society, as well as the study of the interactions between the thermodynamic efficiency and other variables, i.e., social and economic, to continue in the search of a more sustainable industrial sector.

Acknowledgments

The authors thanks to the great support provided by the Consejo Nacional de Ciencia y Tecnología (CONACYT) and the Consejo Veracruzano de Investigación Científica y Desarrollo Tecnológico (COVEICYDET) through the Ph.D. scholarship (No. 218934) to Raul Arango-Miranda. We appreciate the support of the Universidad Veracruzana, particularly the contribution of the Instituto de Biotecnología y Ecología Aplicada (INBIOMA).

Author Contributions

Raul Arango-Miranda applied the environmental accounting methodology of exergy analysis, quantified the analyzed flows, managed the data and wrote the manuscript draft. Robert Hausler contributed to the idea of quantifying resource utilization by exergy analysis, held the management of environmental information, and reviewed the drafting of the manuscript. Rabindranarth Romero-López contributed to the statistical analysis of the data and helped with the writing of the manuscript draft. Mathias Glaus contributed to the exergy analysis method and the reviewing of the manuscript draft. Sara Patricia Ibarra-Zavaleta contributed to the statistical analysis of the managed data and reviewing the drafting of the manuscript. All authors contributed to the work in this paper.

Conflicts of Interest

The authors declare no conflict of interest.

References

  1. Intergovernmental Panel on Climate Change; United Nations Environment Programme (UNEP). Climate Change 2014, Mitigation on Climate Change. 2016. Available online: http://www.ipcc.ch/report/ar5/wg3/ (accessed on 6 May 2017).
  2. Green House Gas Emissions Data. 2016. Available online: https://www.epa.gov/ghgemissions/global-greenhouse-gas-emissions-data (accessed on 15 March 2017).
  3. Sadorsky, P. Renewable energy consumption and income in emerging economies. Energy Policy 2009, 37, 4021–4028. [Google Scholar] [CrossRef]
  4. Moran, M.; Sciubba, E. Exergy analysis: Principles and practice. J. Eng. Gas Turbines Power 1994, 116, 285–290. [Google Scholar] [CrossRef]
  5. Reistad, G. Available energy conversion and utilization in the United States. J. Eng. Power 1975, 97, 429–434. [Google Scholar] [CrossRef]
  6. Boroumand Jazi, G.; Rismanchi, B.; Saidur, R. A review on exergy analysis of industrial sector. Renew. Sustain. Energy Rev. 2013, 27, 198–203. [Google Scholar] [CrossRef]
  7. Wall, G. Exergy—A Useful Concept within Resource Accounting; Chalmers Tekniska Högskola, Göteborgs Universitet: Gothenburg, Sweden, 1977. [Google Scholar]
  8. Rosen, M.A.; Dincer, I. Exergy as the confluence of energy, environment and sustainable development. Exergy 2001, 1, 3–13. [Google Scholar] [CrossRef]
  9. Rosen, M.A.; Dincer, I. On Exergy and Environmental Impact. Int. J. Energy Res. 1997, 21, 643–654. [Google Scholar] [CrossRef]
  10. Dincer, I.; Rosen, M.A. Exergy as a driver for achieving sustainability. Int. J. Green Energy 2004, 1, 1–19. [Google Scholar] [CrossRef]
  11. Sciubba, E.; Wall, G. A brief commented history of exergy from the beginnings to 2004. Int. J. Thermodyn. 2007, 10, 1–26. [Google Scholar]
  12. Szargut, J.; Morris, D.R.; Steward, F.R. Exergy Analysis of Thermal, Chemical, and Metallurgical Processes; Hemisphere Publishing Corporation: Washington, DC, USA, 1987. [Google Scholar]
  13. Van Gool, W. Thermodynamic aspects of energy conservation. Energy 1980, 5, 783–792. [Google Scholar] [CrossRef]
  14. Lozano, M.; Valero, A. Application of the Exergetic Costs Theory to a Steam Boiler in a Thermal Generating Station; ASME Book: New York, NY, USA, 1987. [Google Scholar]
  15. Dincer, I.; Rosen, M.A. Exergy: Energy, Environment and Sustainable Development; Newnes: Oxford, UK, 2012. [Google Scholar]
  16. Rosen, M.A.; Dincer, I.; Kanoglu, M. Role of exergy in increasing efficiency and sustainability and reducing environmental impact. Energy Policy 2008, 36, 128–137. [Google Scholar] [CrossRef]
  17. Milia, D.; Sciubba, E. Exergy-based lumped simulation of complex systems: An interactive analysis tool. Energy 2006, 31, 100–111. [Google Scholar] [CrossRef]
  18. Sciubba, E.; Bastianoni, S.; Tiezzi, E. Exergy and extended exergy accounting of very large complex systems with an application to the province of Siena, Italy. J. Environ. Manag. 2008, 86, 372–382. [Google Scholar] [CrossRef] [PubMed]
  19. Swan, L.G.; Ugursal, V.I. Modeling of end-use energy consumption in the residential sector: A review of modeling techniques. Renew. Sustain. Energy Rev. 2009, 13, 1819–1835. [Google Scholar] [CrossRef]
  20. Ayres, R.U.; Ayres, L.W.; Warr, B. Exergy, power and work in the US economy, 1900–1998. Energy 2003, 28, 219–273. [Google Scholar] [CrossRef]
  21. Wall, G. Exergy conversion in the Japanese society. Energy 1990, 15, 435–444. [Google Scholar] [CrossRef]
  22. Wall, G.; Sciubba, E.; Naso, V. Exergy use in the Italian society. Energy 1994, 19, 1267–1274. [Google Scholar] [CrossRef]
  23. Chen, G.; Chen, B. Extended-exergy analysis of the Chinese society. Energy 2009, 34, 1127–1144. [Google Scholar] [CrossRef]
  24. Rosen, M.A. Evaluation of energy utilization efficiency in Canada using energy and exergy analyses. Energy 1992, 17, 339–350. [Google Scholar] [CrossRef]
  25. Ertesvåg, I.S. Society exergy analysis: A comparison of different societies. Energy 2001, 26, 253–270. [Google Scholar] [CrossRef]
  26. Gong, M.; Wall, G. Exergy Analysis of the Supply of Energy and Material Resources in the Swedish Society. Energies 2016, 9, 707. [Google Scholar] [CrossRef]
  27. Utlu, Z.; Hepbasli, A. Exergoeconomic aspects of sectoral energy utilization for Turkish industrial sector and their impact on energy policies. Energy Policy 2009, 37, 577–587. [Google Scholar] [CrossRef]
  28. Utlu, Z.; Hepbasli, A. A review and assessment of the energy utilization efficiency in the Turkish industrial sector using energy and exergy analysis method. Renew. Sustain. Energy Rev. 2007, 11, 1438–1459. [Google Scholar] [CrossRef]
  29. Rosen, M.A. Assessing global resource utilization efficiency in the industrial sector. Sci. Total Environ. 2013, 461, 804–807. [Google Scholar] [CrossRef] [PubMed]
  30. Bligh, D.C.; Ugursal, V.I. Extended exergy analysis of the economy of Nova Scotia, Canada. Energy 2012, 44, 878–890. [Google Scholar] [CrossRef]
  31. Oladiran, M.T.; Meyer, J.P. Energy and exergy analyses of energy consumptions in the industrial sector in South Africa. Appl. Energy 2007, 84, 1056–1067. [Google Scholar] [CrossRef]
  32. Gong, M. Exergy analysis of a pulp and paper mill. Int. J. Energy Res. 2005, 29, 79–93. [Google Scholar] [CrossRef]
  33. Kotas, T.J. The Exergy Method of Thermal Plant Analysis; Elsevier: Amsterdam, The Netherlands, 2013. [Google Scholar]
  34. Michaelis, P.; Jackson, T.; Clift, R. Exergy analysis of the life cycle of steel. Energy 1998, 23, 213–220. [Google Scholar] [CrossRef]
  35. Saidur, R.; Khaliq, A.A.; Masjuki, H. Analysis of energy and exergy use for process heating in the industrial sector of Malaysia. Int. J. Exergy 2006, 3, 119–149. [Google Scholar] [CrossRef]
  36. Sanaei, S.M.; Furubayashi, T.; Nakata, T. Assessment of energy utilization in Iran’s industrial sector using energy and exergy analysis method. Appl. Therm. Eng. 2012, 36, 472–481. [Google Scholar] [CrossRef]
  37. Zhang, B.; Chen, G.; Xia, X.-H.; Li, S.; Chen, Z.; Ji, X. Environmental emissions by Chinese industry: Exergy-based unifying assessment. Energy Policy 2012, 45, 490–501. [Google Scholar] [CrossRef]
  38. Kerdan, I.G.; Gálvez, D.M.; Raslan, R.; Ruyssevelt, P. Modelling the energy and exergy utilisation of the Mexican non-domestic sector: A study by climatic regions. Energy Policy 2015, 77, 191–206. [Google Scholar] [CrossRef]
  39. Guevara, Z.; Sousa, T.; Domingos, T. Insights on Energy Transitions in Mexico from the Analysis of Useful Exergy 1971–2009. Energies 2016, 9, 488. [Google Scholar] [CrossRef]
  40. Rivero, R. Application of the exergy concept in the petroleum refining and petrochemical industry. Energy Convers. Manag. 2002, 43, 1199–1220. [Google Scholar] [CrossRef]
  41. Rivero, R.; Rendón, C.; Gallegos, S. Exergy and exergoeconomic analysis of a crude oil combined distillation unit. Energy 2004, 29, 1909–1927. [Google Scholar] [CrossRef]
  42. Hammond, G.; Stapleton, A. Exergy analysis of the United Kingdom energy system. J. Power Energy 2001, 215, 141–162. [Google Scholar] [CrossRef]
  43. Dincer, I.; Rosen, M.A. Sectoral energy and exergy modeling of Turkey. J. Energy Resource. Technol. 1997, 119, 200–204. [Google Scholar]
  44. Dincer, I.; Rosen, M. Nomenclature. In Exergy, 2nd ed.; Dincer, I., Rosen, M.A., Eds.; Elsevier: Amsterdam, The Netherlands, 2013; pp. 519–523. [Google Scholar]
  45. Rosen, M.A. Using exergy to assess regional and national energy utilization: A comparative review. Arab. J. Sci. Eng. 2013, 38, 251–261. [Google Scholar] [CrossRef]
  46. Rivero, R.; Rendon, C.; Monroy, L. The exergy of crude oil mixtures and petroleum fractions: Calculation and application. Int. J. Thermodyn. 1999, 2, 115–123. [Google Scholar]
  47. Aljundi, I.H. Energy and exergy analysis of a steam power plant in Jordan. Appl. Therm. Eng. 2009, 29, 324–328. [Google Scholar] [CrossRef]
  48. Tsatsaronis, G. Definitions and nomenclature in exergy analysis and exergoeconomics. Energy 2007, 32, 249–253. [Google Scholar] [CrossRef]
  49. Utlu, Z.; Hepbasli, A. A review on analyzing and evaluating the energy utilization efficiency of countries. Renew. Sustain. Energy Rev. 2007, 11, 1–29. [Google Scholar] [CrossRef]
  50. U.S. Department of Energy. Quadrennial Technology Review 2015; U.S. Department of Energy: Washington, DC, USA, 2015; Chapter 6; p. 35.
  51. Banerjee, R.; Gong, Y.; Gielen, D.J.; Januzzi, G.; Marechal, F.; McKane, A.T.; Rosen, M.A.; van Es, D.; Worrell, E. Energy End-Use: Industry. In Gobal Energy Assessment—Toward a Sustainable Future; Cambridge University Press: Cambridge, UK, 2012; pp. 513–574. [Google Scholar]
  52. Bühler, F.; Nguyen, T.-V.; Elmegaard, B. Energy and exergy analyses of the Danish industry sector. Appl. Energy 2016, 184, 1447–1459. [Google Scholar] [CrossRef]
  53. Vannoni, C.; Battisti, R.; Drigo, S. Potential for Solar Heat in Industrial Processes; IEA SHC Task 33; Sapienza University of Rome: Rome, Italy, 2008; p. 174. [Google Scholar]
  54. SENER. Balance Nacional de Energia 2015; SENER: Getxo, Spain, 2016. [Google Scholar]
  55. Gong, M.; Wall, G. On exergy and sustainable development—Part 2: Indicators and methods. Exergy 2001, 1, 217–233. [Google Scholar] [CrossRef]
  56. Koroneos, C.J.; Nanaki, E.A.; Xydis, G.A. Sustainability Indicators for the Use of Resources—The Exergy Approach. Sustainability 2012, 4, 1867. [Google Scholar] [CrossRef] [Green Version]
  57. Haseli, Y.; Dincer, I.; Naterer, G. Unified approach to exergy efficiency, environmental impact and sustainable development for standard thermodynamic cycles. Int. J. Green Energy 2008, 5, 105–119. [Google Scholar] [CrossRef]
  58. Dincer, I. Thermodynamics, exergy and environmental impact. Energy Sources 2000, 22, 723–732. [Google Scholar] [CrossRef]
  59. Ao, Y.; Gunnewiek, L.; Rosen, M.A. Critical review of exergy-based indicators for the environmental impact of emissions. Int. J. Green Energy 2008, 5, 87–104. [Google Scholar] [CrossRef]
  60. Data, I. World Bank Opend Data. Available online: https://data.worldbank.org/country/mexico (accessed on 28 September 2017).
  61. OECD Data. Real GDP forecast. Available online: https://stats.oecd.org (accessed on 5 March 2017).
  62. Agency, I.E. World Energy Outlook 2008; International Energy Agency/OECD: Paris, France, 2008. [Google Scholar]
  63. Service, C.R. Mexico’s Oil and Gas Sector: Background, Reform Reports and Implications for the U.S.; Congressional Report; Congressional Research Service: Washington, DC, USA, 2015.
  64. Sheinbaum-Pardo, C.; Mora-Pérez, S.; Robles-Morales, G. Decomposition of energy consumption and CO2 emissions in Mexican manufacturing industries: Trends between 1990 and 2008. Energy Sustain. Dev. 2012, 16, 57–67. [Google Scholar] [CrossRef]
  65. Stern, D.I. The effect of NAFTA on energy and environmental efficiency in Mexico. Policy Stud. J. 2007, 35, 291–322. [Google Scholar] [CrossRef]
  66. Tracker, C.A. Effect of Current Pledges and Policies on Global Temperature. 2015. Available online: http://climateactiontracker.org/global.html (accessed on 6 November 2016).
  67. Inventario Nacional de Gases de Efecto Invernadero 1990–2010, INE-SENARNAT; INE: Mexico City, Mexico, 2013. Available online: http://www.inecc.gob.mx/descargas/cclimatico/inf_inegei_public_2010.pdf (accessed on 12 March 2017).
  68. Mexico. Industrial Corridors. 2017. Available online: http://dgeiawf.semarnat.gob.mx:8080/ibi_apps/WFServlet?IBIF_ex=D4_R_PROFEPA02_01&IBIC_user=dgeia_mce&IBIC_pass=dgeia_mce (accessed on 21 October 2017).
  69. ENCC 2013. Estrategia Nacional de Cambio Climático. Visión 10-20-40. Gobierno de la Republica. México, 2013. Available online: http://www.inecc.gob.mx/descargas/cclimatico/2012_est_nal_cc.pdf (accessed on 6 January 2018).
  70. International Energy Agency (IEA) Outlook, (2016). Mexico Energy Outlook. Special Report. International Energy Agency (IEA). Available online: https://www.iea.org/search/?q=MEXICO+OUTLOOK+2016#gsc.tab=0&gsc.q=MEXICO%20OUTLOOK%202016&gsc.page=1 (accessed on 12 November 2017).
  71. Secretaría de Energía. Balance Nacional de Energia 2014; Secretaria de Energia (SENER): Mexico City, Mexico, 2015; Volume 1, p. 136. [Google Scholar]
  72. Secretaría de Energía. Balance Nacional de Energia 2011; Secretaría de Energía: Mexico City, Mexico, 2012; p. 159. [Google Scholar]
  73. Secretaría de Energía (SENER). Balance Nacional de Energıa, 2000; Secretaria de Energia (SENER): Mexico City, Mexico, 2001; Volume 1, p. 138. [Google Scholar]
  74. Instituto Nacional de Estadística y Geografía. XII Censo General de Población y Vivienda, 2000; Instituto Nacional de Estadística y Geografía: Aguascalientes, Mexico, 2001; Volume 1.
  75. Instituto Nacional de Estadística y Geografía (INEGI). Estadisticas Historicas de Mexico 2009; Instituto Nacional de Estadística y Geografia: Agusacalientes, Mexico, 2010.
  76. International Energy Agency (IEA). 2016. Available online: https://www.iea.org/statistics/statisticssearch/report/?year=2015&country=MEXICO&product=Balances (accessed on 25 September 2016).
  77. Dincer, I.; Hussain, M.; Al-Zaharnah, I. Energy and exergy use in the industrial sector of Saudi Arabia. J. Power Energy 2003, 217, 481–492. [Google Scholar] [CrossRef]
  78. Abdelaziz, E.A.; Saidur, R.; Mekhilef, S. A review on energy saving strategies in industrial sector. Renew. Sustain. Energy Rev. 2011, 15, 150–168. [Google Scholar] [CrossRef]
  79. Kondo, K. Energy and exergy utilization efficiencies in the Japanese residential/commercial sectors. Energy Policy 2009, 37, 3475–3483. [Google Scholar] [CrossRef]
  80. International Energy Agency. Website, Energy Balances. In Energy Balances by Year, Country or Region; International Energy Agency: Paris, France, 2017. [Google Scholar]
Figure 1. MIS exergy consumption rates, 2000–2015.
Sustainability 10 00153 g001
Figure 2. Mexican Society Sectors, 2015.
Sustainability 10 00153 g002
Figure 3. SIM average values of thermodynamic efficiencies, 2000–2015: (A) SIM Total; (B) Iron and Steel; (C) Cement; (D) Chemicals; (E) Sugars; (F) Mining of non-metallic minerals; and (G) Other manufacturing. (a): Energy efficiency (ɳ); (b)Exergy efficiency (ψ).
Sustainability 10 00153 g003
Figure 4. MIS average energetic and exergetic efficiencies, industrial activity breakdown by the year 2015.
Sustainability 10 00153 g004
Figure 5. MIS evolution of exergy efficiencies and exergetic renewable share as sustainability indicators, 2000–2015.
Sustainability 10 00153 g005
Figure 6. Comparison of countries exergy efficiencies and exergetic renewable share as sustainability indicators.
Sustainability 10 00153 g006
Table 1. Properties of the most common energy sources * (adapted from Utlu and Rosen [24,28]).
Energy CarrierHigh Heating Value (HHV)Chemical ExergyQuality Factor (Dimensional) γ
(kJ/kg)(kJ/kg)
Coal32,73334,0901.04
Gasoline47,84947,3940.99
Fuel Oil47,40547,1010.99
Natural Gas55,44851,7020.93
Crude oil (Mexican Mixture)42,41444,8000.94
LPG45,46045,0050.99
Electricity3600.63600.61.00
* The reference environmental conditions are: Temperature = 25 °C; pressure = 1 atm.
Table 2. Data heating processes for industrial activities, adapted from Utlu [28].
Process Heating Data (Tp Range, Energy and Exergy Efficiencies)Breakdown of Energy and Exergy Efficiencies for Each Tp Category
Electrical HeatingFuel Heating
Industrial SubsectorsManufacturing Operation ApplicationsTp RangeMean Tp (°C)Electricity (%)Fuel (%)ɳe,h (%)ψe,h (%)ɳf,h (%)ψf,h (%)
Iron-SteelCokingLow1904.201006.31004.1
CalciningMed3000090-85-
Smelting & metal meltingHigh165095.81007553.47038.1
ChemicalDriyingLow6062.501005.41003.5
Other heatingMed30037.51009025.28516.8
Fluid heatingHigh600007542.87030.6
CementPre-heatingLow6091.70.91005.41003.5
CalciningMed50009.09025.28516.8
SinteringHigh15008.390.17545.77032.7
SugarMingling- centrifugingLow6510059.010016.310010.6
FilteringMed31509.09044.48529.6
EvaporationHigh400032.07539.07027.9
Mining and non-iron metalsCrushingLow601013.810010.81007.0
GrindingMed1509.422.69023.88515.9
Separation; tickening; refiningHigh50080.463.67539.17027.9
Other manufacturingPre-heatingLow6010.613.81009.71006.3
Fluid HeatingMed46089.486.29023.88515.9
Other heatingHigh6000.10.17539.07027.9
Table 3. MIS thermodynamic efficiency results, energy (η) and exergy (ψ), 2000–2015.
Process Heating Data (Tp Range, Energy and Exergy Efficiencies)Breakdown of Energy and Exergy Efficiencies for Each Tp CategoryEnergy-Exergy EfficienciesEnergy-Exergy Efficiencies
Electrical HeatingFuel HeatingElectrical HeatingFuel Heating
Industrial SubsectorsManufac-Turing Operation ApplicationsTp RangeMean Tp (°C)ElectricityFuelɳe,hψe,hɳf,hψf,hɳe,hψe,hɳf,hψf,h
(%)(%)(%)(%)(%)(%)
Iron-SteelCokingLow1904.201006.31004.1
CalciningMed300009085-75.351.47038.1
Smelting and metal meltingHigh165095.81007553.47038.1
ChemicalDriyingLow6062.501005.41003.5
Other heatingMed30037.51009025.28516.862.83.48516.8
Fluid heatingHigh6000.007542.87030.6
CementPre-heatingLow6091.70.91005.41003.5
CalciningMed50009.09025.28516.897.08.771.631
SinteringHigh15008.390.17545.77032.7
SugarMingling; centrifugingLow6510059.010016.310010.6
FilteringMed31509.09044.48529.693.816.389.117.8
EvaporationHigh400032.07539.07027.9
Mining and non-iron metalsCrushingLow6010.013.810010.81007.0
GrindingMed1509.422.69023.88515.970.332.577.522.3
Separation; refining, etc.High50080.463.67539.17027.9
Other manufacturingPre-heatingLow6010.613.81009.71006.3
Fluid HeatingMed46089.486.29023.88515.910.71.187.114.6
Other heatingHigh6000.10.17539.07027.9
Table 4. MIS evolution of the exergetic renewable share, from 2000 to 2015.
Time (Years)Exergetic Ren. Resources MIS (PsJ) (Average)Exergetic Ren. Share (%)Time (Years)Exergetic Ren. Resources MIS (PJ) (Average)Exergetic Ren. Share (%)
200062.04.6200863.84.5
200172.25.9200954.34.2
200270.45.6201050.63.6
200357.14.5201145.73.0
200456.94.3201244.93.0
200569.95.2201364.84.1
200662.34.3201438.82.5
200764.04.5201537.42.4

